Cryptocurrency Posts
Crypto Briefing
Intense competition for elite AI talent may hinder labs' ability to innovate, impacting future AI model advancements and market dynamics.
The post Top AI researchers leave Google DeepMind for OpenAI, Anthropic amid competition appeared first on Crypto Briefing.
The credit upgrade enhances SK Hynix's financial flexibility, enabling strategic growth and attracting broader institutional investment.
The post Moody’s upgrades SK Hynix to A3+, completing a clean sweep of credit rating wins appeared first on Crypto Briefing.
The delay in finalizing Venezuelan oil deals may hinder global oil supply stability and affect future oil price trends.
The post Energy Dept. criticized for slow pace in Venezuelan oil deal finalization appeared first on Crypto Briefing.
Ripple's strategic investments in ZILO and Licuido could bolster XRP Ledger's regulatory compliance, potentially enhancing its competitive edge.
The post Ripple invests in ZILO and Licuido to enhance XRP Ledger infrastructure appeared first on Crypto Briefing.
CXMT's expansion could disrupt the DRAM market's oligopoly, intensifying global competition and challenging established industry leaders.
The post China’s top DRAM maker CXMT plans second Beijing chip plant as semiconductor arms race heats up appeared first on Crypto Briefing.
Bitcoin Magazine
Bitcoin Magazine
Coldcard Bitcoin Thief Likely Used Top Blockchain Services Provider: Report
Since over $70 million in Bitcoin was stolen yesterday by an attack that exploited a fault in the Coldcard’s system, it has been reported that the thief used a top blockchain services provider for help.
Writing on X Friday, engineer at payments company Block, Clay Garrett, said that the provider — who he did not name at the request of the services provider — had been contacted after finding blockchain movements matched the “suspected workflow” of the attacker.
“During our investigation of the Coldcard drain yesterday, we identified an unusual pattern in the sweeps,” Garrett said.
“That pattern led us to a hypothesis that has since been confirmed: the operator used a paid account at a well-known blockchain-services provider to query the source addresses and perform other related activity during the sweeps,” Garrett continued, adding that the authorities had been notified.
Galaxy Digital’s research arm also wrote on X that the thief had an unusual pattern of moving the coins.
“The pattern tells us these were all the same attacker — it does not capture the attack itself, which looks the same as if a coin owner chose to move coins,” the company said, adding that Bitcoiners should move funds out of single-signature Coldcard addresses and into secure custody.
After over $35 million in Bitcoin was drained from wallets on Thursday, Coinkite said that a firmware bug in Coldcard Mk3 devices — starting with version 4.0.1 in March 2021 — caused seed generation to fall back to a weak software Pseudorandom Number Generator instead of the hardware true random number generator.
This allowed private keys for many single-signature wallets (especially those created without dice rolls or a strong BIP-39 passphrase) predictable enough for attackers to brute-force.
Later on Friday, Coinkite admitted all of its models were vulnerable following more thefts. Over $70 million has so far been swiped and engineers have warned that more Bitcoin addresses could be at risk.
The company makes a number of Bitcoin products, including cold storage hardware wallets.
This post Coldcard Bitcoin Thief Likely Used Top Blockchain Services Provider: Report first appeared on Bitcoin Magazine and is written by Mathew Di Salvo.
Bitcoin Magazine
Younger Democrats Understand Clarity Act And Bill Should Pass, Says Coinbase’s Chief Policy Officer
The Clarity Act will likely get through despite some — older — Democrats holding it back, according to Coinbase’s Chief Policy Officer, Faryar Shirzad.
Speaking on The Hill’s morning Rising show Friday, Shirzad said that crypto was “maybe the most bipartisan issue in Washington.”
JUST IN:
— Bitcoin Magazine (@BitcoinMagazine) July 31, 2026Coinbase Chief Policy Officer talks CLARITY ACT progress on The Hill:
""We've got ethics nailed down, we've got nominations nailed down, we've got a bipartisan bill on the substance, we should be good to go"pic.twitter.com/gMKuM7ujYs
He added that while some lawmakers were holding back the long-awaited legislation, younger Democrats got it.
“A lot of the opposition is generational — so it is Democrats who oppose it — but I think younger members who understand the technology, understand that money is transforming how we should engage financially, how we need to adapt, and so it’s really a generational shift,” he said.
“I think we’ll be on the winning end of that because right now there are about 67 million Americans who own crypto,” Shirzad added. “We’ve got ethics nailed down, we’ve got nominations nailed down, we’ve got a bipartisan bill on the substance, we should be good to go.”
Lawmakers are currently mulling over the latest draft of the Clarity Act, which aims to set in stone digital asset regulation. The latest draft bans officials and their families from issuing or promoting crypto.
A new draft started circulating this month, banning officials and their families from issuing or promoting crypto — something opposition lawmakers previously had issue with.
But some Democrats are still unhappy with the bill in its current form. A group of Democrats last week said in a statement that the bill in its current form falls short.
The bill has been in a deadlock this year, partially because banking chiefs raised concerns over stablecoin yield and ethics concerns.
Banking lobbyists have said that if crypto exchanges pay attractive yields to customers, banks could lose their deposit base.
Shirzad previously said in an interview that the bill was an “extraordinarily bipartisan” piece of work.
If approved, the bill would set in stone crypto regulation in the world’s largest economy.
This post Younger Democrats Understand Clarity Act And Bill Should Pass, Says Coinbase’s Chief Policy Officer first appeared on Bitcoin Magazine and is written by Mathew Di Salvo.
Bitcoin Magazine
Coinkite Releases Fixed Firmware After Coldcard Bug; AI Likely Involved In The Breach
Over a thousand bitcoins are believed to have been stolen so far in a hack that started to be discussed on social media in the afternoon of July 30th. Coinkite, one of the most reputable hardware wallet manufacturers, was revealed to have a critical bug in the way it generated secure private keys for its Bitcoin hardware wallets. Industry experts believe AI was used in the breach.
Coldcard MK3 devices with firmware version 4.0.1 (March 2021) through 4.1.9 are the worst affected. 12- or 24-word seeds generated by the device that did not include user-generated dice rolls or a BIP 39 extra passphrase are vulnerable.
Users who fit this category, who have bitcoins in an MK3 Coldcard and did not use the dice roll feature for extra entropy or the extra passphrase, should consider themselves at risk and move their coins as soon as possible from the wallets. Bitcoin Magazine technical writer Shinobi has published a guide on the topic, and Coinkite has also published a guide and advisory.
The vulnerability was a specific line of code in the firmware, a low-level software codebase that controls the hardware. This firmware appears to be upgradable. The Coinkite advisory was updated this morning, advising users to upgrade device firmware for all three chips, MK3, MK4 and MK5 devices, including the Coldcard Q:
“Updated July 31, 2026 at 9:33 a.m. EDT: Fixed firmware is now available. Mk4 and Mk5 users must update to version 5.6.0 or later. Q users must update to version 1.5.0Q or later. For Mk3, update to version 4.2.0 or later.”
Coinkite also explained in their advisory that updating the firmware does not mean that the private and public keys generated by the vulnerable firmware before it are now secure; those keys remain vulnerable as they were effectively created with a weak password. After the firmware is updated, a new wallet needs to be created, and the funds need to be sent onchain to the new addresses to secure the funds. Coinkite wrote:
“Updating the firmware does not change or repair an existing seed. If your seed was generated before the fixed firmware version for your model, follow the migration guidance below unless the independent dice-entropy exception applies to you.”
Some Multisignature Wallets May Be At Risk
Peter Todd, Core contributor and cybersecurity engineer, today addressed specific edge cases for multi-signature wallets that use a threshold of Coldcards to secure funds. “Example case: you have a 2-of-3, with 2 Cold Cards, and a 3rd uncompromised device. If you move your funds, the moment your script is revealed for the first time – previously hidden behind the address hash – the attacker now knows enough to use the compromised 2 cold card keys to steal your funds.”
The transaction that reveals the multisig script might be unconfirmed, giving hackers enough time to create a competing transaction with a higher fee. Fortunately, such cases have a solution: the MARA mining pool can help in this case with their private mempool mining service, Slipstream; “because they promise to keep your transaction – and thus pubkeys – secret until they’re already in a block. Dramatically reducing the ability of the attacker to steal the funds,” said Todd. He added that “If you’ve already reused addresses, this isn’t relevant, and you should just try to move your funds ASAP. But if you haven’t, MARA may be able to help.”
Beyond The Immediate Crisis
NVK, one of the co-founders of Coldcard, published a long post on X with an initial analysis beyond the basic security steps needed to secure funds. In it, he wrote that the company is “committed to working with affected users who want to pursue a police report, insurance claim, or their own investigation”, including “a written incident summary specific to your loss and any transaction data we can share”.
Beyond the immediate crisis, NVK pointed to a broader tech shift as the hacking capabilities of AI begin to change previous cybersecurity dynamics and expectations. In the blog post he wrote:
“To every other developer: we believe this is a sober reality of the new AI paradigm. AI-assisted code review can now find latent bugs at a speed that is outpacing even the industry’s most seasoned experts. If your firmware is open-source or has ever been public, assume it’s already being read by attackers and defenders alike.”
The hack and over 70 million dollars in estimated stolen funds in the past 24 hours are an effective bounty paid to hackers who are now likely auditing every wallet codebase available for vulnerabilities. While the Bitcoin and broader crypto industry has generally operated under the assumption that hackers will test their code, the development of AI models optimized for cybersecurity accelerates these processes.
Industry experts gathered in a long X Spaces public call last night, discussing the topic for many hours. Beyond the immediate recommendations and answering questions to Bitcoin users throughout the long Spaces, analysis of what is likely to follow in the coming weeks was also discussed. Other wallet providers are likely to get probed, and especially open source projects which generate private key material will be tested.
The X Spaces was not recorded, likely to preserve the privacy of everyone in the call; however, initial sentiment suggests companies will need to be auditing their code with the latest frontier models, as a matter of survival. The latest cybersecurity-oriented AI models by Anthropic, OpenAI, Moonshot’s Kimi K3 and others are already available to the public. Many companies in the Bitcoin industry already use these to test the integrity of the code, but some might not be, and the race to find vulnerabilities in wallet-facing code will certainly continue, especially in the following weeks.
Ultimately, today we grieve lost coins, and a state of introspection and careful review occurs. Beyond this now historic hack will be an open source self-custody industry and infrastructure that is likely to be orders of magnitude more secure, with very hard lessons learned. After all, every hacker with an AI agent is likely testing defenses now.
Multi-vendor, Multi-key Wallets and Covenants
Future high sovereignty wallets, be it at the retail or corporate level, are likely to not depend on any single vendor. Multisignature wallets, when well done, can distribute vulnerability risks across different code bases, teams and hardware.
User-generated entropy was also a major theme in the X Spaces discussed earlier, with dice roll-generated entropy brought up regularly as a solution. Coldcards, as well as other hardware wallets like Foundation Devices, guide users on how to add their own entropy properly; many dice need to be rolled, ideally north of a hundred individual rolls. Once done, however, dice rolls represent a non-software source of randomness for wallets that also separates users from the edge-case risks in software- or hardware-generated entropy.
Covenants a popular soft fork among a certain niche in the Bitcoin industry have also started to be brought up as further step to strengthen the self-custody industry. This upgrade to the Bitcoin consensus which might be hard fought if achieved at all, could give users important smart contract capabilities, such a wallet that can only send to a white list of addresses, something not possible in Bitcoin script today.
This post Coinkite Releases Fixed Firmware After Coldcard Bug; AI Likely Involved In The Breach first appeared on Bitcoin Magazine and is written by Juan Galt.
Bitcoin Magazine

US Closes in on Iran’s Strait of Hormuz Bitcoin Insurance Policy, Sanctions Companies
Iran has been dodging sanctions by accepting pay in Bitcoin from ships passing through the Strait of Hormuz, according to a Friday announcement from the U.S. Treasury’s Office of Foreign Assets Control.
The OFAC sanctioned the companies tied to the Iranian regime accused of doing so. Ships have barely been passing through the strategic Strait of Hormuz, where a fifth of the world’s oil passes through, since the U.S. and Israel attacked Iran in February.
In the statement, OFAC said that Hormuz Safe, developed by Iran’s Ministry of Economy, “accepts payment in Bitcoin and other digital assets” so it can bypass sanctions.
“With its economy in freefall and inflation in the triple digits, the regime is desperate for cash,” Secretary of the Treasury Scott Bessent said in a statement.
“The United States will not allow Iran to hold global commerce hostage or use international shipping to finance the IRGC’s terrorism, aggression, and repression.”
The OFAC statement added that two firms — the Persian Gulf Marine Insurance Company (PGMIC) and HormuzSafe Marine Services Authority (“Hormuz Safe”) — accused of running an IRGC-backed scheme forcing commercial vessels to buy mandatory “insurance” to transit the Strait of Hormuz.
Bloomberg first reported in May that Iran had started a Bitcoin-backed insurance service for Iranian shipping companies.
The U.S. earlier this month announced that it had frozen crypto linked to the Iranian regime, mostly in the form of the Tether stablecoin.
Stablecoins like Tether’s USDT can be frozen by the company that issues the asset but Bitcoin, being decentralized and having no single issuer, cannot.
Experts have warned that a recession could follow due to the war between the U.S. and Iran due to high oil prices if the Strait of Hormuz remains closed.
This post US Closes in on Iran’s Strait of Hormuz Bitcoin Insurance Policy, Sanctions Companies first appeared on Bitcoin Magazine and is written by Mathew Di Salvo.
Bitcoin Magazine
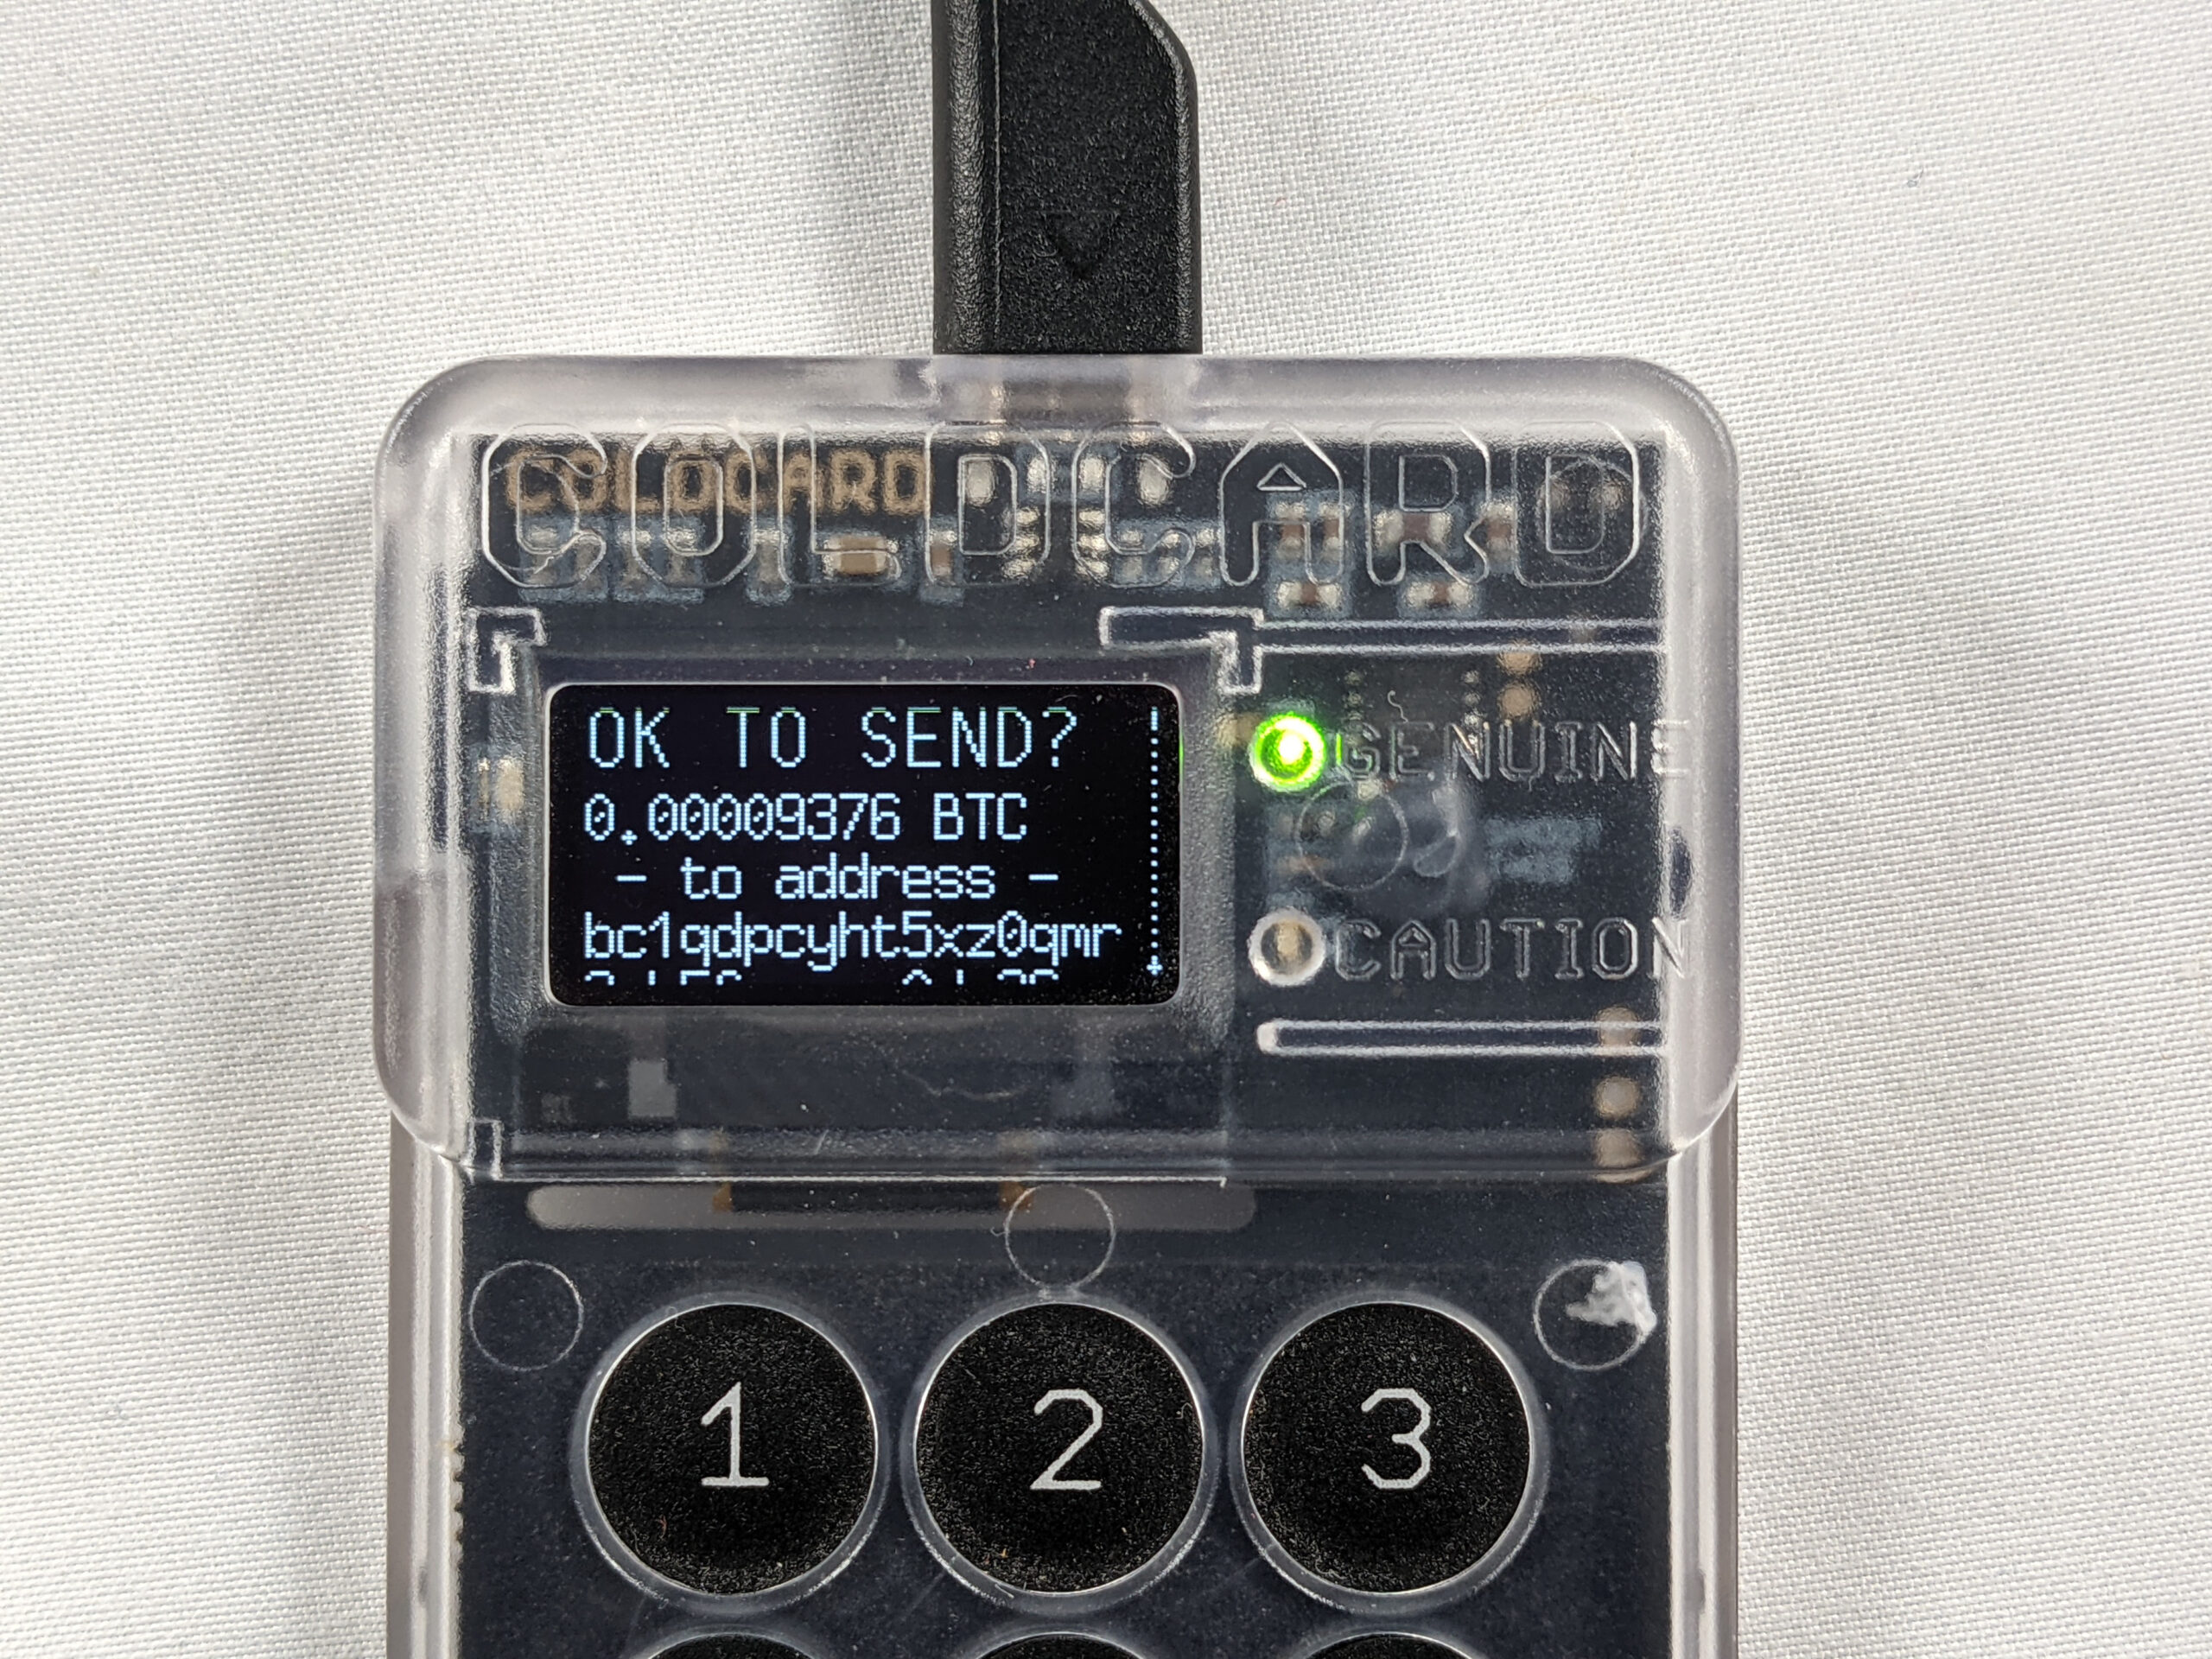
COLDCARD SECURITY RISK: IMMEDIATE ACTION REQUIRED
First, yes, that is a very clickbait title and completely unusual. This is a real security issue. Here is the official announcement from Coinkite themselves posted yesterday, please read and verify the genuineness of the issue there.
TLDR: Coldcard MK2, MK3, MK4, MK5 and Q are being drained. A bug lets attackers find your seed phrase without any action on your part. Only wallets generated using the dice roll method are safe, assuming you rolled at least 50 dice. If you don’t know, don’t remember, or aren’t sure, move your funds immediately.
This is a critical issue that requires immediate action. If you used a Coldcard to generate a word seed and did NOT use the recommended 50+ dice rolls to provide your own entropy after the end of 2020, your word seed is not secure. It was generated without a sufficient amount of randomness, and can be brute forced by a malicious attacker. Wallets are actively being drained now. This issue also affects any ephemeral keys and session keys for Clone Coldcard or Key Teleport features, and BIP 85 seeds generated from a compromised seed. YOU MUST STILL MOVE YOUR FUNDS.
This attack is being actively exploited, with around 1000 BTC seen moving on-chain connected to the vulnerability.
Breath, and relax. You must move your funds to a new word seed, or a word seed generated by a different device, in order to secure your funds.
– If you have another hardware wallet that is not a Coldcard, send your funds there. This is the quickest and simplest way to get them someplace secure.
– If you do not have another hardware wallet, and only have a Coldcard, generate a passphrase using at MINIMUM six seed words from the BIP 39 word list. Use this guide to select your words for the passphrase, do NOT pick them yourself. Check your wallet fingerprint (or an address), power down your device, restart it and re-enter the passphrase. Confirm that the fingerprint (or address) matches, and send your funds to the passphrase wallet. This is not a permanent solution. This is simply giving you enough security that an attacker will not be able to brute force your keys in a matter of days, and you can generate a new seed without being in a state of panic. Make sure your passphrase is written down securely.
– If you have no other options, or are uncomfortable with using the device at all, Nunchuck wallet available on mobile and desktop. Take your time, don’t rush yourself too fast, and make sure that all of your backups are done properly. After you have verified backups, send your funds to this wallet. If you are managing significant sums, Nunchuck has support for multisig. You can create one using multiple devices. Blockstream Green and Bluewallet are two other options for software wallets.
Once your funds are secure, take a minute and relax. Coldcards are still safe to use as long as the word seed is generated securely. A firmware patch has been released here. Any word seed generated after this firmware update should be secure (and you can use the dice roll option too). If you have transferred your funds to a hot wallet, or something less secure, your Coldcard is safe to use after applying the firmware update and generating a new seed.
Once you have secured your own funds, stop and take stock. Reach out proactively to anyone you know who might be using a Coldcard that was vulnerable when they generated their seed. Inform them of the issue, and if needed (and you are capable) help walk them through migrating their funds. Everyone doesn’t pay attention to Bitcoin news on a regular basis, so many people might be unaware that they are even vulnerable.
Disclaimer: This article is for informational and educational purposes only and does not constitute financial, legal, or technical advice. Readers are solely responsible for managing their own private keys and executing fund transfers. Bitcoin Magazine and the author assume no liability for any loss of funds, technical errors, or operational missteps resulting from actions taken based on this content. Always independently verify security alerts directly through official project channels before taking action.
This post COLDCARD SECURITY RISK: IMMEDIATE ACTION REQUIRED first appeared on Bitcoin Magazine and is written by Shinobi.
CryptoSlate
Bitcoin entered BIP-110's final ordinary 2,016-block window on July 25 with miner support at 0.89%. The proposal requires 1,109 blocks, or 55%, for ordinary lock-in, and its mandatory version-bit phase can begin in August if support stays below that threshold.
Jameson Lopp has framed Consensus Cleanup, covenants, and quantum preparation as Bitcoin's next agenda. He also occupies two sides of that transition: Lopp opposes BIP-110 and co-authored BIP-361, a draft plan for post-quantum migration.
BIP-110 gives those debates a live governance reference because developers, miners, node operators, exchanges, custodians and holders each supply a different form of consent. The next proposals attach that coordination test to block validation, theft-resistant custody and the ownership status of vulnerable coins.
Known bugs enter the upgrade queue
Consensus Cleanup combines four protocol repairs in BIP-54. Antoine Poinsot and Matt Corallo completed the specification in May, and Bitcoin Inquisition has run the rules on its experimental signet since February.
The package covers the timewarp attack, extreme block-validation costs, a Merkle-tree ambiguity involving 64-byte transactions, and future duplicate-transaction checks.
The timewarp flaw gives majority hash power a route to drive mining difficulty toward its minimum within 38 days, pulling subsidy forward through faster block production and altering miner incentives.
A separate weakness is that specially crafted blocks can take several minutes on high-end hardware and hours on weaker machines.
BIP-54 caps signature operations per transaction, cutting the worst-case validation burden by a factor of 40. It also invalidates a 64-byte transaction form that miners have treated as nonstandard since 2019 and that Bitcoin last recorded on-chain in 2016.
Because those repairs tighten consensus validity, review centers on edge cases across the specification, reference code, test vectors, and months of signet use. An extended delay would leave four documented weaknesses in the protocol and increase the likelihood that a future attack would compress the review schedule.
Consensus Cleanup gives Bitcoin a maintenance test with defined faults and measurable remedies, allowing approval to demonstrate that the network can process defensive protocol work through ordinary review.
Prolonged delay would convert known weaknesses into accumulated technical debt.
| BIP-54 repair | Risk addressed | Practical impact | Forward-looking question |
|---|---|---|---|
| Timewarp fix | Majority hash power can push difficulty toward minimum | Could accelerate block production and pull subsidy forward | Can Bitcoin close known incentive bugs before they become exploitable? |
| Validation-cost limits | Crafted blocks can take minutes or hours to validate | Weakens low-resource nodes and increases propagation risk | Does the network prioritize worst-case resilience before attack pressure rises? |
| 64-byte transaction rule | Merkle-tree ambiguity from special transaction format | Removes a class of historical consensus ambiguity | Is preventive cleanup easier before the edge case becomes weaponized? |
| Duplicate-transaction cleanup | Future BIP-0030-style validation concerns | Reduces legacy exception handling | Can Bitcoin simplify consensus without triggering coordination backlash? |
Covenants move into active testing
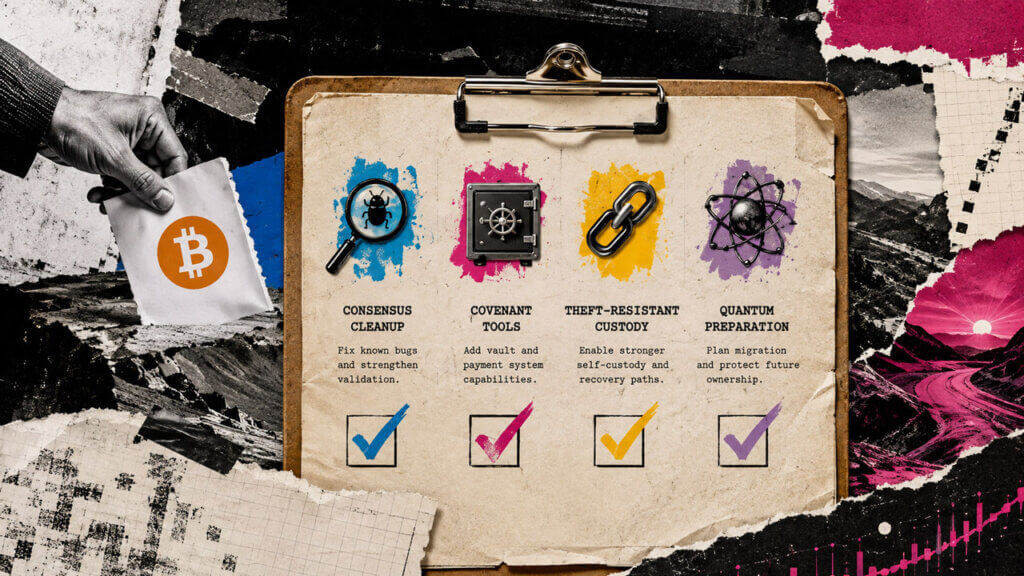
Bitcoin Inquisition activated BIP-446's OP_TEMPLATEHASH on July 27 at signet block 314,928. The opcode lets a Tapscript commit to the exact transaction that can spend an output, giving wallets and second-layer systems a covenant primitive.
A vault uses that primitive via a first transaction that announces an attempted withdrawal and creates a delay during which the owner can redirect funds to a safer address or block the thief's payout.
Current constructions can use presigned transactions and destroyed signing keys, an operational model that becomes fragile across large balances and long storage periods.
BIP-448 proposes a three-opcode Tapscript package that combines OP_TEMPLATEHASH with OP_CHECKSIGFROMSTACK and OP_INTERNALKEY.
Gregory Sanders, Antoine Poinsot and Steven Roose connect the package to rebindable transactions, simpler payment channels, multiparty Lightning designs, statechains and Ark variants.
Reviewers can compare a standalone TEMPLATEHASH activation, with its smaller review surface and earlier vault tooling, against BIP-448's broader payment-system support and lower chance of another soft fork.
A longer testing period keeps current consensus rules in place and extends reliance on custodians or fragile presigned constructions.
For holders, covenant policy determines how much control a wallet can encode before funds leave an address.
Vault delays, recovery paths, and restricted-spending templates could strengthen self-custody and keep control outside exchanges, ETFs, or professional custodians.
| Proposal | Core change | Main use case | Trade-off |
|---|---|---|---|
| BIP-446 / OP_TEMPLATEHASH | Lets Tapscript commit to the spending transaction | Vaults, recovery paths, restricted spending | Smaller review surface, but narrower capability |
| BIP-448 package | Combines OP_TEMPLATEHASH, OP_CHECKSIGFROMSTACK, and OP_INTERNALKEY | Payment channels, multiparty Lightning, statechains, Ark variants | Broader utility, but larger consensus-review burden |
| No covenant activation | Keeps current consensus rules | Presigned vaults, custodial controls, existing wallet models | Avoids soft-fork risk, but leaves self-custody tools weaker |
Quantum migration sets the ownership deadline
BIP-361 places the largest coordination task on a five-year clock. The draft would stop creation of new quantum-vulnerable outputs around three years from activation, then nodes would tighten verification for legacy ECDSA and Schnorr spending paths around year five.
Phase B would require a quantum-safe rescue protocol for legacy spends, although the draft does not yet specify a single rescue design.
That timetable would require exchanges, custodians, wallet providers, and individual holders to move funds into a post-quantum output type. Owners who do not migrate by Phase B would need to meet the new rescue conditions.
By placing ownership guarantees inside the security design, BIP-361 aims to block a quantum operator from sweeping exposed coins through legacy spend paths. Owners who miss the window could face added recovery friction, and any rescue mechanism would require rules for proof design, privacy, fraud controls, and dormant funds.
| Phase | Approximate timing | What changes | Who must act |
|---|---|---|---|
| Activation | Year 0 | Quantum migration clock starts | Developers, node operators, wallet providers, exchanges, custodians |
| Phase A | Around year 3 | New quantum-vulnerable outputs would stop being created | Wallets, exchanges, payment processors, custodians |
| Phase B | Around year 5 | Legacy ECDSA/Schnorr verification would be tightened with quantum-safe rescue rules | All holders with vulnerable outputs |
In the bull case, the BIP-110 process produces clearer standards for network readiness. BIP-54 receives concentrated review, covenant proposals gain comparative signet data, and quantum planning receives a multi-year implementation runway.
Wallets gain stronger theft controls, nodes gain tighter validation bounds, and custodians gain time to inventory vulnerable outputs.
In the bear case, the spam dispute turns each soft fork into a factional contest. Consensus Cleanup stays on signet, covenant work fragments across competing opcode packages, and post-quantum policy waits for a nearer cryptographic threat.
Bitcoin then carries known bugs, weaker self-custody tools, and a compressed migration schedule into the same governance process.
BIP-110's August window will create a single record of Bitcoin governance, and Consensus Cleanup, covenants, and BIP-361 will extend that record into maintenance, custody, and cryptographic survival.
Bitcoin's path now depends on identifying which protocol proposals protect its core functions and building consent before emergency conditions set the timetable.
The post Four unpatched bugs, a 5-year quantum clock, and a miner standoff are pushing Bitcoin to a critical crossroad appeared first on CryptoSlate.
PowerCompute, a Bitcoin miner expanding into high-performance computing, disclosed that its US Digital subsidiary borrowed about $18.07 million from Arch Lending under two bridge notes signed July 27.
The notes had a listed July 31 maturity, four days after signing, and permitted payment until 5 p.m. ET on Aug. 1. The proceeds were intended to fund repayment in full of Galaxy Digital and Liebel debt while PowerCompute finalized an anticipated Bitcoin-secured term facility.

The disclosure landed on the listed maturity date with the term facility's documents still being finalized. As of press time, PowerCompute's live SEC submissions feed showed no filing after the July 31 8-K, while its investor-relations release feed showed no press release after July 29.
The contractual payment cutoff had passed, but the public record still did not establish a default, an extension, or a completed refinancing. The notes specify a 15% annual default interest rate, but the disclosure did not show that rate had been triggered.
The 8-K rounded the bridge to an aggregate $18 million. The first note carries $11,005,502.75 in principal and the second carries $7,063,342.53. Together they total $18,068,845.28, or $68,845.28 more than the rounded figure.
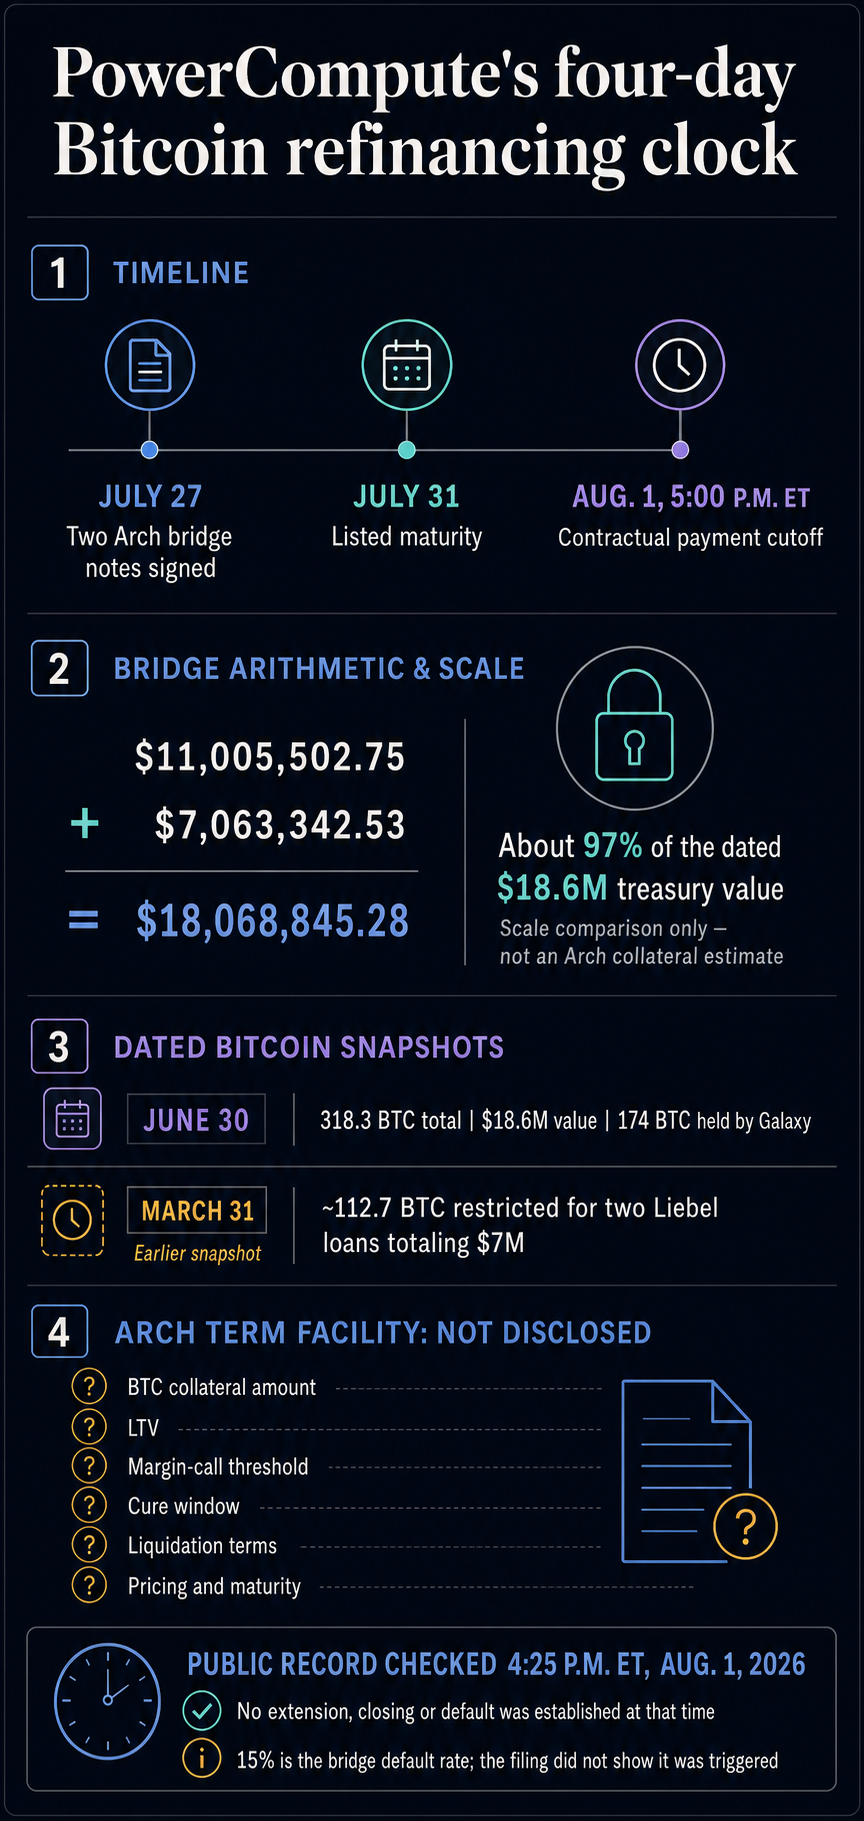
That exact principal was about 97% of the $18.6 million value PowerCompute assigned to its entire Bitcoin treasury at June 30. The company's June update and mining page reported 318.3 BTC at that date, including 174 BTC held by Galaxy for its loan facility.
The Liebel collateral figure comes from PowerCompute's first-quarter filing, which reported about 112.7 BTC in restricted custody for two SE & AJ Liebel loans totaling $7 million. The June update did not refresh that amount. The July filing calls the creditor “DE & AJ Liebel,” an unexplained naming discrepancy.
The first-quarter filing also said Galaxy could use or rehypothecate the pledged Bitcoin and had to return the same type and quantity after full payment. Galaxy collateral had increased from 145 BTC at Dec. 31, according to the company's annual report, to 174 BTC at March 31.
PowerCompute said the anticipated Arch facility would be secured by Bitcoin in its treasury. It did not disclose the Bitcoin amount, loan-to-value ratio, margin-call thresholds, cure period, liquidation terms, maturity or pricing. It also did not say whether the Bitcoin previously held for Galaxy and Liebel was returned to PowerCompute, transferred to Arch, or supplemented.
The collateral stack remains unresolved. The 15% default clause does not show whether the refinancing closed or the rate was triggered. Until PowerCompute discloses the refinancing outcome and the Bitcoin securing the Arch facility, its June 30 total of 318.3 BTC cannot be treated as a current measure of unencumbered liquidity.
The post Bitcoin miner gambles on a 4-day bridge loan equal to 97% of its BTC treasury value – the deadline passed without in total silence appeared first on CryptoSlate.
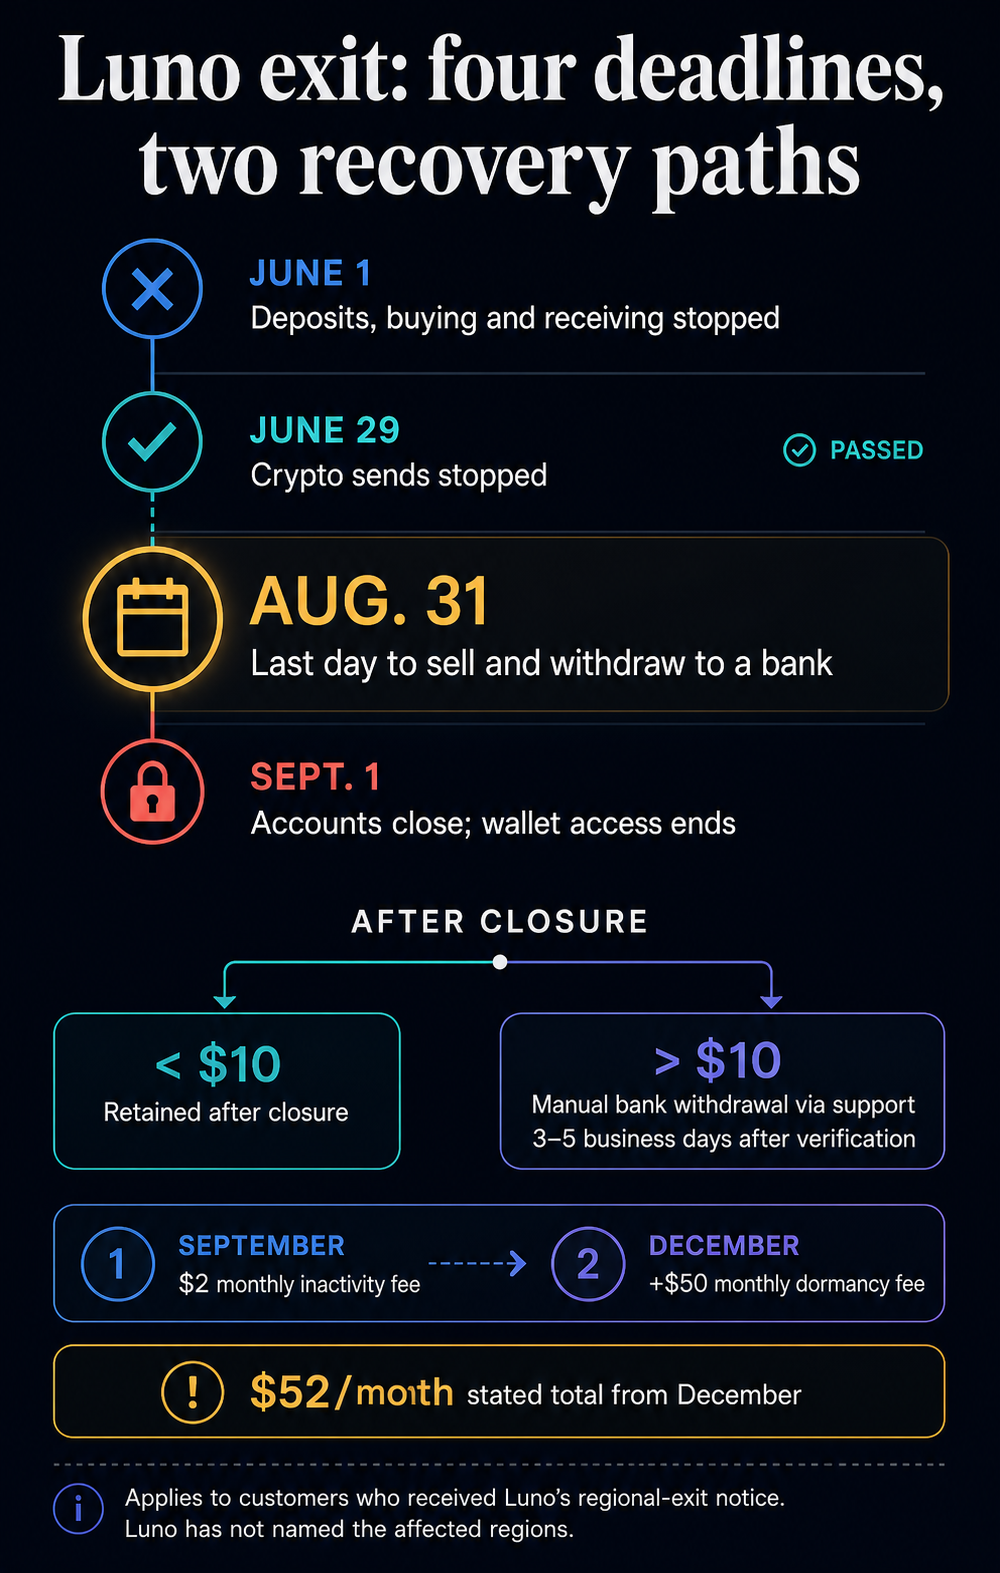
Crypto platform Luno has stopped customers covered by its regional-exit notice from sending their crypto to another wallet or exchange. With that option closed, their remaining standard route is to sell their holdings and withdraw the cash to a bank by Aug. 31 before Luno closes their accounts on Sept. 1.
Restrictions began June 1, when Luno disabled deposits, crypto purchases and incoming crypto for affected customers. Selling, bank withdrawals and outgoing crypto transfers remained available until June 29. Customers who missed that send deadline can no longer preserve their holdings by moving them in kind. They must convert the assets to fiat to use Luno's ordinary bank-withdrawal process.
Luno has not publicly named the affected regions or disclosed how many customers received the notice. A separate country availability page currently lists Kenya, Nigeria, South Africa, Indonesia and Malaysia as supported, and a list of 33 ‘unsupported countries,' leaving hundreds of unaddressed locales. The regional-exit guidance was created May 28 and updated July 29, without a public record showing which passages changed.

Funds left behind face rising costs
Balances below the equivalent of $10 cannot be processed under Luno's minimum withdrawal threshold. The company says it will retain those small balances after Sept. 1. Customers who leave more than $10 can seek a manual withdrawal after closure, but they must contact support and provide verified bank details or a recent bank statement. Luno says a completed manual withdrawal takes three to five business days.
Manual withdrawals do not extend ordinary account access. Selling and standard bank withdrawals stop after Aug. 31, and wallet access ends the following day. Customers with less than $10 do not qualify for the manual process described in the notice, while those above the threshold must complete the additional verification steps.
Fees begin as the accounts close. The notice says remaining funds can face a $2 monthly inactivity fee starting in September. From December, an additional $50 monthly dormancy fee applies for continued storage, taking the stated charges to $52 a month while funds remain. Luno has not publicly confirmed whether the exact schedule varies among the unnamed affected jurisdictions.
Luno said it is withdrawing from the affected regions to focus on core markets across Africa and Southeast Asia. The company has not linked the decision to insolvency, a security breach or a specific regulatory order. Customers covered by the notice have already lost the option to leave with crypto, and the ordinary cash-out route closes Aug. 31.
The post Luno blocks crypto transfers for some users, leaving a late August cash-out deadline before monthly fees hit appeared first on CryptoSlate.
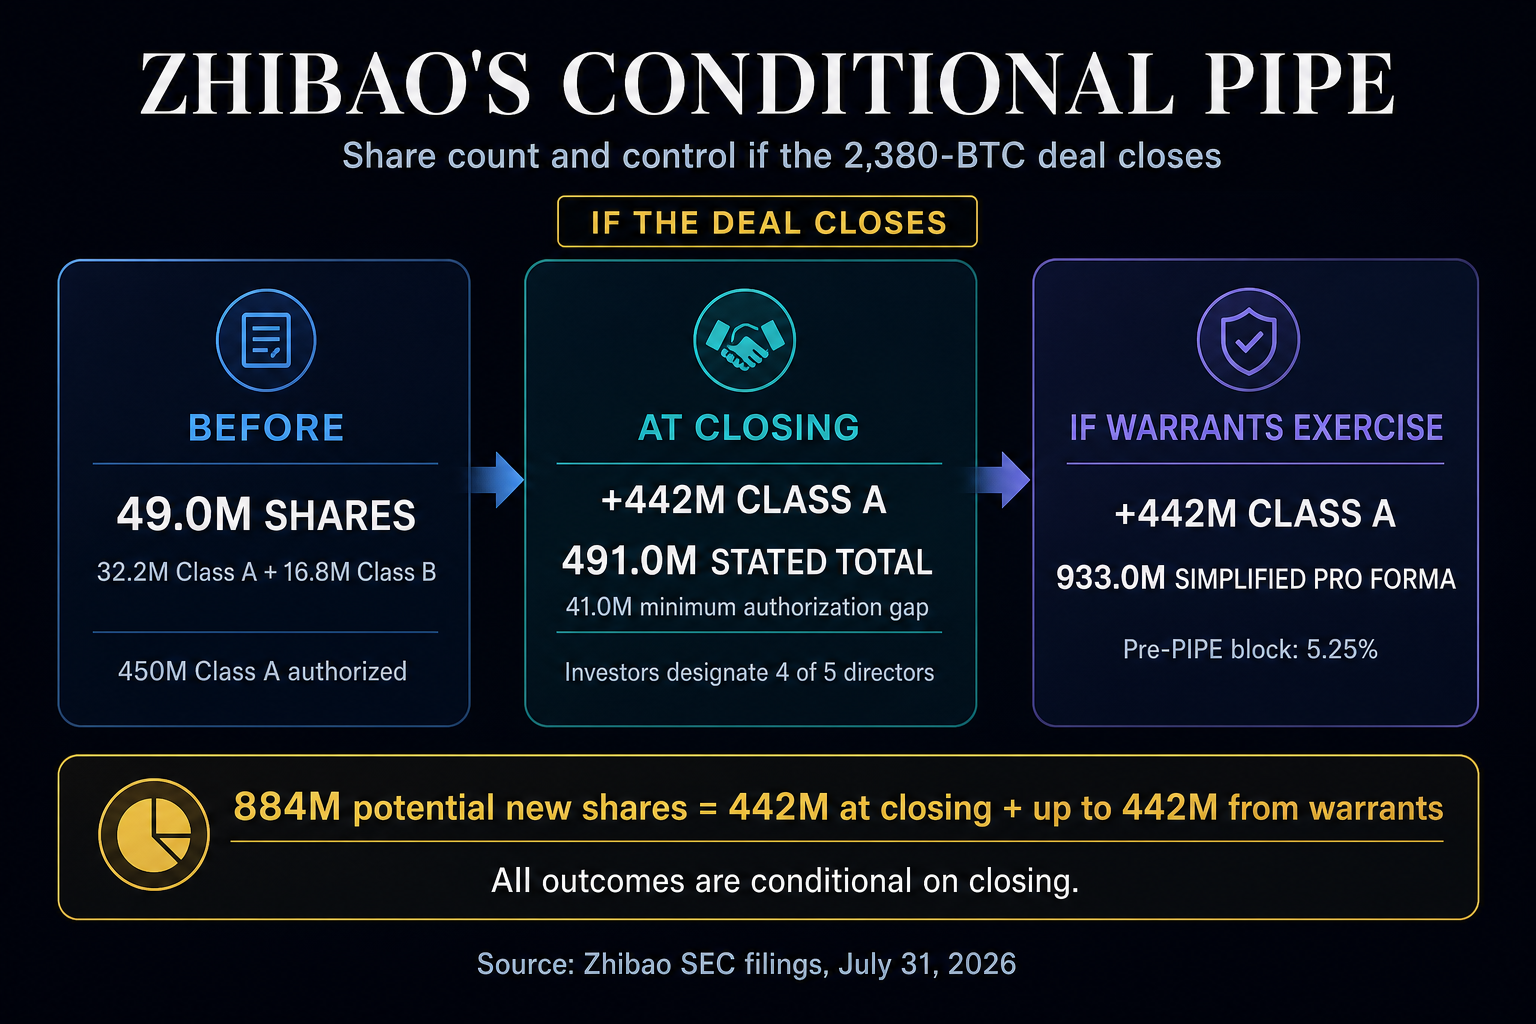
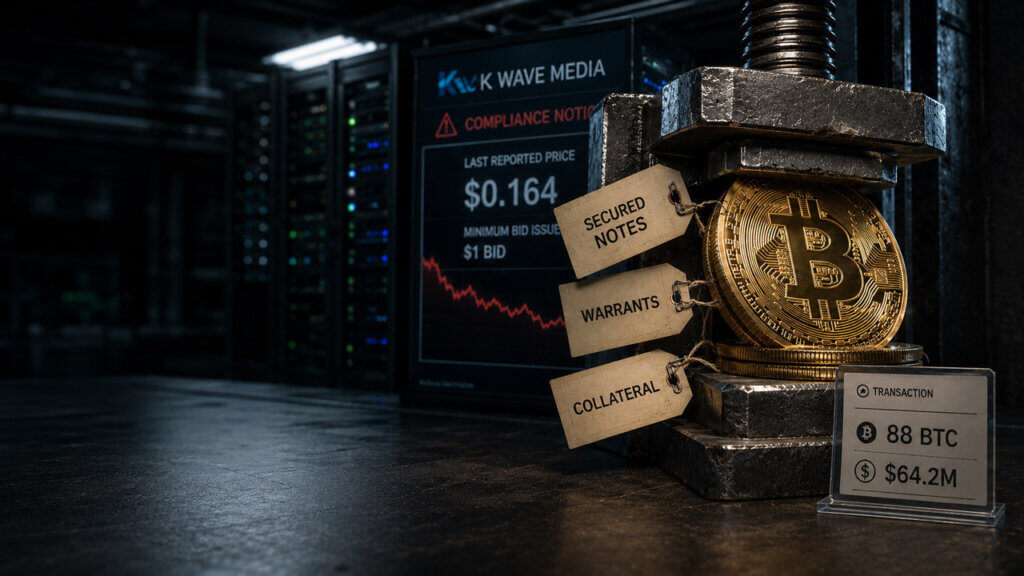
Zhibao Technology, a Nasdaq-listed Chinese insurtech company, signed a $154.7 million private investment in public equity (PIPE) agreement payable in 2,380 BTC. If it closes, investors would take control of the board and management. No closing had been disclosed as of Aug. 1.
Under the July 31 securities purchase agreement, investors would buy 442 million units at $0.35 each. Every unit contains one Class A ordinary share plus a two-year warrant to buy another Class A share at $0.35. The potential issuance totals 884 million new shares: 442 million at closing and up to 442 million later through warrant exercise.
The governance shift would begin at closing. Investors would designate four of five directors and choose the new CEO and CFO. Four incumbent directors and the current CEO and CFO would resign, while Botao Ma would remain a director.
The agreement fixes BTC at $65,000 based on July 30 prices, producing the 2,380-BTC payment. Each of the 10 investor entities listed in the agreement is allocated 44.2 million units for $15.47 million, payable with 238 BTC.
Zhibao’s existing share structure cannot accommodate even the first issuance without a change. The company reported 32,184,970 Class A shares and 16,816,692 Class B shares outstanding, with 450 million Class A shares authorized. Its Class B shares convert one-for-one into Class A and carry 20 votes before conversion. Converting them and issuing the closing shares would produce 491,001,662 Class A shares, at least 41,001,662 more than the present authorization.
That issuance would sharply dilute the pre-PIPE share block. Its 49,001,662 shares would account for about 9.98% of the stated post-closing base, while Class B holders would lose their 20-to-one voting advantage. If every new warrant were later exercised, the stated base would rise to at least 933,001,662 shares and the pre-PIPE block would fall to about 5.25%. This simplified pro forma excludes older warrants, convertible notes, awards and future adjustments.

What the closing still requires
The agreement contemplates closing within 12 business days of July 31, or on another date agreed in writing. Conditions include sufficient authorized capital, Class B conversion, required shareholder and regulatory or exchange approvals, no exchange objection and Nasdaq compliance. The filings give no public timetable for a shareholder vote, capital increase or Nasdaq clearance. Those conditions could push closing beyond the 12-day target.

Zhibao also has a separate Nasdaq minimum-bid deficiency. The exchange notified the company on July 10 after its stock closed below $1 from May 27 through July 9. Zhibao’s initial deadline to regain compliance is Jan. 6, 2027, and requires at least 10 consecutive business days at or above $1. The PIPE documents leave the relationship between that deficiency and closing undefined.
Funding remains another unverified condition. Each investor represents that it legally and beneficially owns its allocated BTC and must send it to a company-designated custodian wallet on or before closing, unless the parties agree otherwise in writing.
The filings do not identify the entities’ natural-person controllers, the custodian or wallet, or independently establish that the BTC is available. Until a closing disclosure shows the approvals and transfer completed, the Bitcoin contribution, share issuance, and management overhaul remain conditional.
The post Ten mystery investors are using 2,380 BTC to completely hijack a Nasdaq company and gut its leadership appeared first on CryptoSlate.
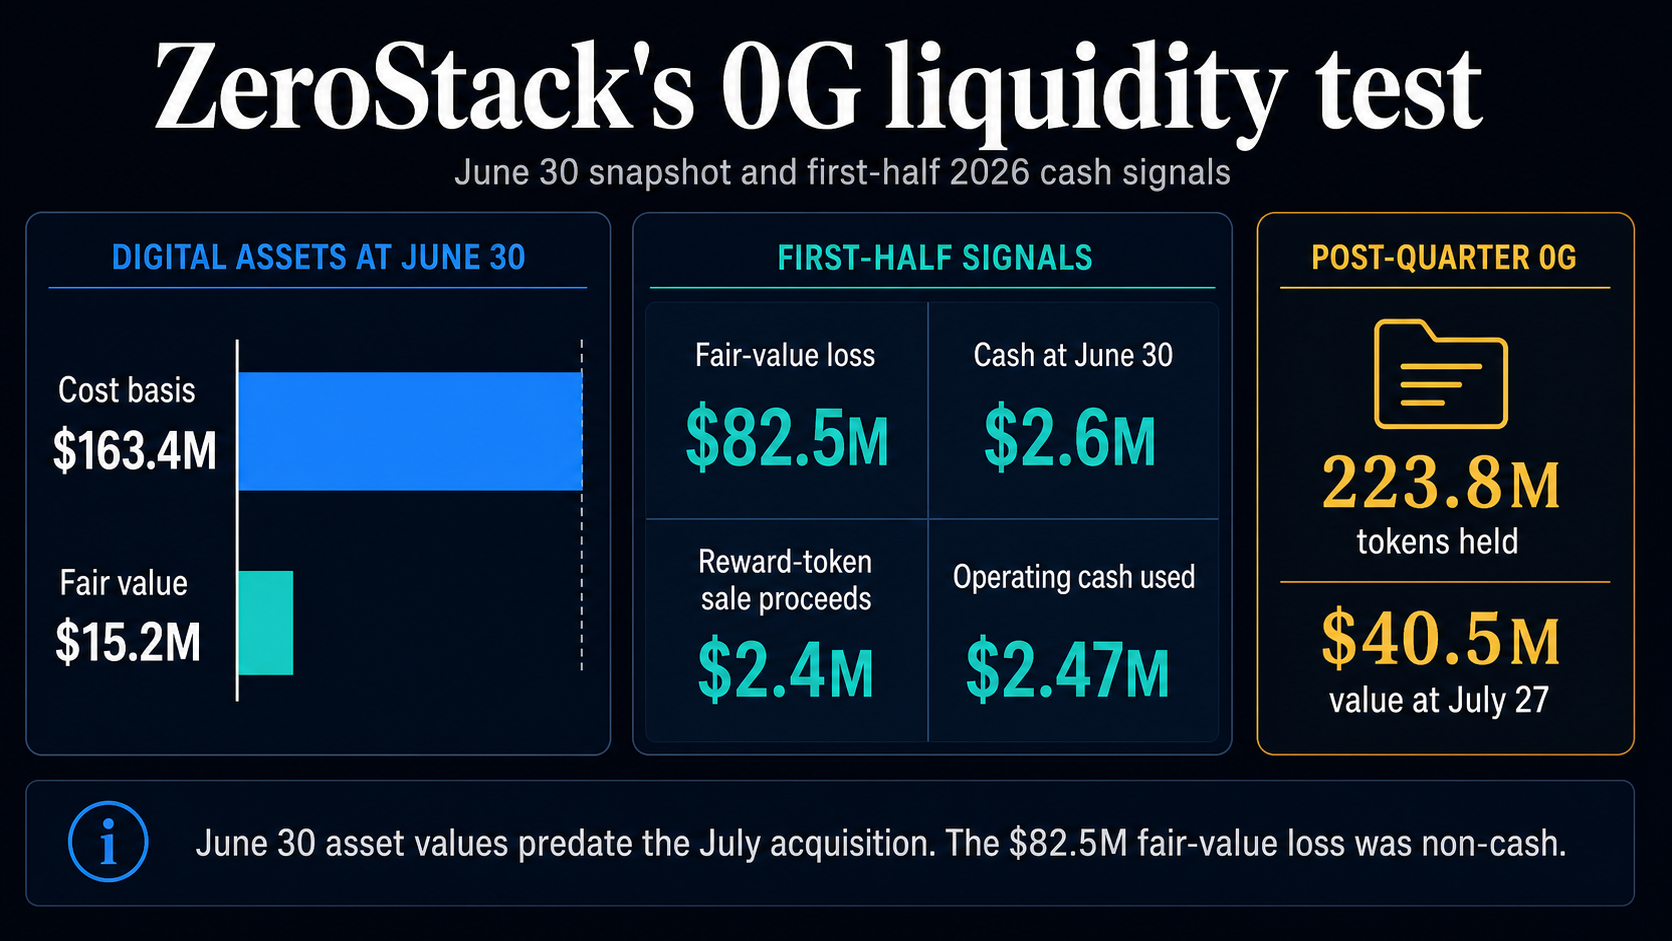
ZeroStack, whose digital-asset treasury is overwhelmingly composed of the AI-focused 0G token, said it expects to fund operations mainly by selling staking rewards. Management, however, could not conclude that its plans would alleviate substantial doubt about the company's ability to continue as a going concern.
The company's Form 10-Q, filed July 31 for the quarter ended June 30, reported $2.6 million in cash, negative working capital of $600,000, a $339.1 million accumulated deficit and a $61.3 million net loss for the first half of 2026. It also recorded an $82.5 million loss from remeasuring digital assets at fair value. That markdown was an accounting loss, not a realized cash loss.
At June 30, ZeroStack held 75.1 million 0G tokens with a recorded cost of $163.33 million and fair value of $15.17 million. Including a small Bitcoin position, total digital assets had a $163.43 million cost and $15.21 million fair value. Those figures are a June 30 snapshot and predate a much larger 0G acquisition that closed in July.
Reward sales underpin the liquidity plan
ZeroStack recognized $3.78 million in digital-asset revenue from 6.62 million 0G tokens earned through staking during the first half, net of 1% or 2% validator commissions. It sold 4.94 million tokens from its rewards wallet for $2.4 million in proceeds, while using $2.47 million in cash for operating activities over the same period.

Management said the company expects to fund operations primarily by monetizing staking rewards and may sell some underlying token holdings if needed. ZeroStack said its staked tokens remain in company wallets and can be withdrawn at any time, but that does not establish immediate cash availability. The filing also warns that rewards can decline or disappear and that sales depend on token prices and market conditions.
The filing therefore does not establish that this mechanism can fund operations for the year following issuance of the financial statements. Yet, its precise warning is substantial going-concern doubt, rather than a declaration that ZeroStack is insolvent.
A March 31 Form 8-K described 142,232,948 0G tokens originally contributed to Texas Blocker. After ZeroStack's acquisition of the company closed on July 20, the 10-Q's subsequent-events note said ZeroStack received 147,990,763 tokens from Texas Blocker and held 223,773,990 tokens in total, valued at about $40.5 million using the July 27 closing price.
The contributed and acquired counts differ by 5,757,815 tokens. Texas Blocker was permitted to stake its holdings before the acquisition closed, but the public disclosures do not explicitly attribute that entire difference to staking rewards.
The transaction also carried related-party ties. Texas Blocker was formed by ZeroStack CEO Daniel Reis-Faria and CFO Dany Vaiman, and the filing says Zero Gravity Labs owned 51% of it at June 30. ZeroStack Executive Chairman Michael Heinrich was Zero Gravity's CEO when the ZeroStack transaction closed.
0G traded near 15 cents on Aug. 1, with roughly $6.8 million to $7.5 million in rolling 24-hour volume.
The post This $163M crypto stash collapsed to just $15M, forcing ZeroStack to literally stake its survival on token rewards appeared first on CryptoSlate.
CryptoTicker.io
At the end of July 2026, one of the most closely watched funds in global markets lost roughly three quarters of its assets in a matter of days. Situational Awareness, the artificial intelligence fund founded by former OpenAI researcher Leopold Aschenbrenner, was forced to sell its entire public equity book to Ken Griffin's Citadel at a discount after prime brokers issued margin calls it could not meet.
The story matters to crypto readers for reasons that go well beyond schadenfreude at a leveraged blow-up in another asset class. The collapse ran on mechanics that anyone who traded through 2022 will recognise instantly, it involves a figure whose career began inside the FTX orbit, and it arrived in the same weeks that Bitcoin quietly broke its correlation with the AI trade. Several crypto-native companies are now carrying AI infrastructure risk directly on their balance sheets.
Who is Leopold Aschenbrenner?
Aschenbrenner is a German investor and former AI researcher, born in 2001 or 2002 to parents who were both doctors, and educated at the John F. Kennedy School in Berlin. He entered Columbia University at 15 and graduated as valedictorian in 2021 at the age of 19, with a degree in economics and mathematics-statistics.
His early career included a stint at the FTX Future Fund, the philanthropic arm of Sam Bankman-Fried's exchange, where he helped run a charitable operation from the Bahamas. He then joined OpenAI's Superalignment team, the group tasked with controlling systems more capable than humans.
OpenAI dismissed him in April 2024 over an alleged information leak. Aschenbrenner disputes that account. He has said he shared a largely non-confidential planning document with outside researchers for feedback, and that his dismissal followed tensions over warnings he had raised about the company's security practices. OpenAI has said those concerns were unrelated to his departure.
In June 2024 he published "Situational Awareness: The Decade Ahead," a 165-page essay arguing that artificial general intelligence was arriving faster than almost anyone understood, and that the resulting demand for compute, energy and hardware would be historic. The essay became required reading across Silicon Valley. The following month, he turned it into a fund of the same name.
The trade was the essay. If AI capability scaling continued, then semiconductors, memory, data centres and power infrastructure were the bottleneck, and owning that bottleneck with leverage was the highest-conviction expression of the thesis. Backers included Stripe co-founders Patrick and John Collison, former GitHub CEO Nat Friedman and investor Daniel Gross. Jane Street was also an investor. The Wall Street Journal reported gains of more than 1,000% since inception.
Reported peak assets vary by source. CNBC put the fund's high-water mark at around $45 billion, while other reporting has cited roughly $20 billion in assets under management at peak. Either figure represents an extraordinary amount of capital for a manager who had never run money before founding the fund at 22.
What exactly happened to Situational Awareness?
The unwind ran over roughly two weeks in late July.
The fund's concentrated positions in AI infrastructure names, reported to include SK Hynix, CoreWeave, Nebius, Micron and Bloom Energy, fell between 35% and 47% during the month. The Philadelphia Semiconductor Index dropped 28.6% from its 22 June peak as investors began questioning whether hyperscaler capital expenditure could ever generate adequate returns. A separate short position against software stocks reportedly went against the fund at the same time, compounding the damage from both directions.
Then the leverage did what leverage does. Reports put the fund's gearing at as much as 400%. At four times leverage, a 25% decline in the underlying positions is mathematically sufficient to erase an investor's entire equity contribution. The positions fell considerably further than 25%.
Prime brokers Goldman Sachs, J.P. Morgan and Bank of America issued margin calls. The fund attempted several escape routes: a capital raise letter to existing investors, discussions with lenders, and negotiations with Millennium Management and Jane Street Group. According to reporting in the Financial Times, all of them failed. Citadel stepped in and bought the entire public book at a discount.
Assets fell from roughly $45 billion to around $10 billion. Reporting since suggests the fund may still be forced to liquidate further holdings.
There is a revealing postscript. Once Citadel had absorbed the position, the Nasdaq gained 3.30% and the semiconductor index rose sharply. Much of the late-July decline in AI infrastructure names had been the market pricing in a large, visible, forced seller. Removing him removed the discount.
The timing was unusual in one further respect: Aschenbrenner married Avital Balwit, chief of staff to Anthropic CEO Dario Amodei, in California the same weekend the fund was being unwound.
Why does an AI fund blow-up matter for crypto?
Three reasons, in ascending order of importance.
The first is that this is a familiar story with different tickers. A young quantitatively gifted manager builds a totalising thesis about the future, expresses it through extreme concentration and heavy leverage, produces spectacular returns that attract enormous capital, and then discovers that leverage is symmetrical. Crypto has run this experiment repeatedly. The specific detail that closes the circle is that Aschenbrenner's first significant job was at the FTX Future Fund, and that Jane Street, where Bankman-Fried himself trained, appears in this story both as an investor and as a failed rescue counterparty.
The comparison should not be pushed too far. There is no allegation of fraud, no customer funds, no missing assets. Situational Awareness appears to have been a legitimate fund that took a directional view and lost, which is a categorically different thing from what happened at FTX. But the underlying behavioural pattern, that of narrative conviction plus leverage minus risk management, is the same one that has cost crypto investors more money than any hack.
The second is that the mechanics are identical to a liquidation cascade. Concentrated leveraged longs, a price decline, a margin call, a forced seller who must sell into a falling market, and a well-capitalised buyer waiting to take the other side at a discount. Crypto traders watch this happen on-chain and on exchange liquidation feeds constantly. On 13 July, when the Kospi fell 8.95% and SK Hynix dropped 15.37% in its worst session on record, $253 million in leveraged crypto positions were force-liquidated in parallel, with long positions accounting for 76% of the total. Same physics, different venue.
The third, and most consequential, is what crypto did not do.
Why did Bitcoin not follow AI stocks down this time?
For most of 2026, crypto traded as a high-beta expression of the AI trade. It rose when chip stocks rallied and fell when they slipped. That relationship broke in July, and it broke twice inside five sessions.
When roughly $797 billion came off the largest US technology stocks in a single Thursday session in late July, $Bitcoin barely moved. On 29 July, as Asian equities suffered one of their worst two-day stretches of the year and SK Hynix fell nearly a fifth despite growing quarterly profit more than sixfold, Bitcoin rose about 1% to $63,800. Ether added 1% to $1,899, XRP gained 2% to $1.07, and Solana held around $73. When Citadel absorbed the Situational Awareness book and AI infrastructure names rebounded sharply, crypto markets were largely unmoved in the other direction as well.
Across July as a whole, Ether gained 16.29% and Bitcoin 5.61%, while the AI infrastructure complex was being repriced downward.
The interpretation matters. One reading is that Bitcoin is regaining independence as an asset class, driven now by rate expectations, ETF flows and its own regulatory calendar rather than by sentiment toward Nvidia's supply chain. Analysts increasingly describe crypto as behaving like a liquidity sponge, expanding and contracting with global money supply and real rates rather than with any individual equity narrative. Research has attributed roughly 45% of weekly Bitcoin price movement in 2026 to ETF flows alone.
A more cautious reading is that two weeks is not a trend, and that decoupling claims have been made and abandoned repeatedly since 2020. The honest position is that the correlation has weakened materially and visibly, and that the next genuine risk-off event will test whether that is structural or coincidental.
Which crypto companies are actually exposed to the AI trade?
This is where the story stops being an analogy and becomes direct exposure. A significant portion of the Bitcoin mining industry has spent two years converting itself into AI infrastructure, and it is now priced accordingly.
Miners owned the two things AI companies most needed: large contracted power capacity and physical data centre real estate. After the 2024 halving compressed mining economics, pivoting that capacity toward high-performance computing and AI hosting became the sector's dominant strategy. Leasing activity grew from 95 MW in the first quarter of 2026 to 1.19 GW in the second, with a further 928 MW announced in the third quarter through 27 July, bringing the year-to-date total to 2.21 GW. TeraWulf signed a $19 billion lease with Anthropic. Hut 8, IREN and Applied Digital accounted for the bulk of capacity signed this year.
That pivot worked in both directions. When AI infrastructure sentiment cracked in July, these names fell harder than the underlying asset they were named after. IREN dropped 33% over a month, TeraWulf 38% and Applied Digital 36%, against a 13% decline in the broader Global X Data Center and Digital Infrastructure ETF. Over July specifically, MARA Holdings fell 18.14%, IREN 19.40% and Riot Platforms 23.08%, while spot Bitcoin gained. Their beta figures explain the sensitivity: IREN carries a five-year monthly beta of 4.28, TeraWulf 4.26 and Applied Digital 5.68.
Analysts at KBW made the sharpest observation about what was actually repriced. The selloff, they argued, primarily removed the value that markets had assigned to future AI and HPC leases rather than repricing completed projects. In other words, the market stopped paying for pipeline and started paying only for signed contracts with creditworthy tenants. KBW downgraded Core Scientific to Market Perform and flagged a new category of danger it called model-layer risk: if an AI lab tenant fails to meet expectations, the developer holding the lease is exposed.
CoreWeave, one of Aschenbrenner's reported core positions, illustrates the whole loop. It began life as an Ethereum mining operation before becoming an AI cloud provider, attempted a merger with Bitcoin miner Core Scientific that failed, and has since fallen 61% from its mid-year high of $187, shedding roughly $33 billion in market value in six weeks amid short-seller criticism and doubts about GAAP profitability. A company born from crypto mining became the most crowded position in the AI trade and then one of its largest casualties.
What should crypto investors take from this?
- Leverage is the mechanism, never the thesis. Aschenbrenner's core argument about AI compute demand may still prove correct over a decade. It did not matter. Four times leverage meant a 25% drawdown ended the position regardless of whether the ten-year view was right. Being early and levered is indistinguishable from being wrong.
- Concentration risk compounds narrative risk. The fund held a handful of names expressing a single idea. When the idea was questioned, every position moved together and there was nothing to sell that was not already falling. Crypto portfolios built entirely around one cycle narrative carry the same structure.
- Watch the miners as the transmission channel. If the AI infrastructure repricing continues, it reaches crypto through mining equities before it reaches spot Bitcoin. The KBW distinction between contracted revenue and speculative pipeline is the most useful analytical frame currently available for that sector.
- Treat the decoupling as provisional. Bitcoin's independence through two separate AI routs is real and measurable. It is also recent. The immediate calendar offers a test: US payrolls on 7 August and CPI on 12 August, with a September rate decision that markets price at 61.4% for a hike. If Bitcoin trades on those numbers rather than on the semiconductor tape, the case strengthens considerably.
Consolidation phases are where positioning happens. Prices stop trending, volume thins out, retail attention drifts elsewhere, and the assets that will lead the next expansion quietly change hands. That is roughly where the crypto market sits in early August 2026.
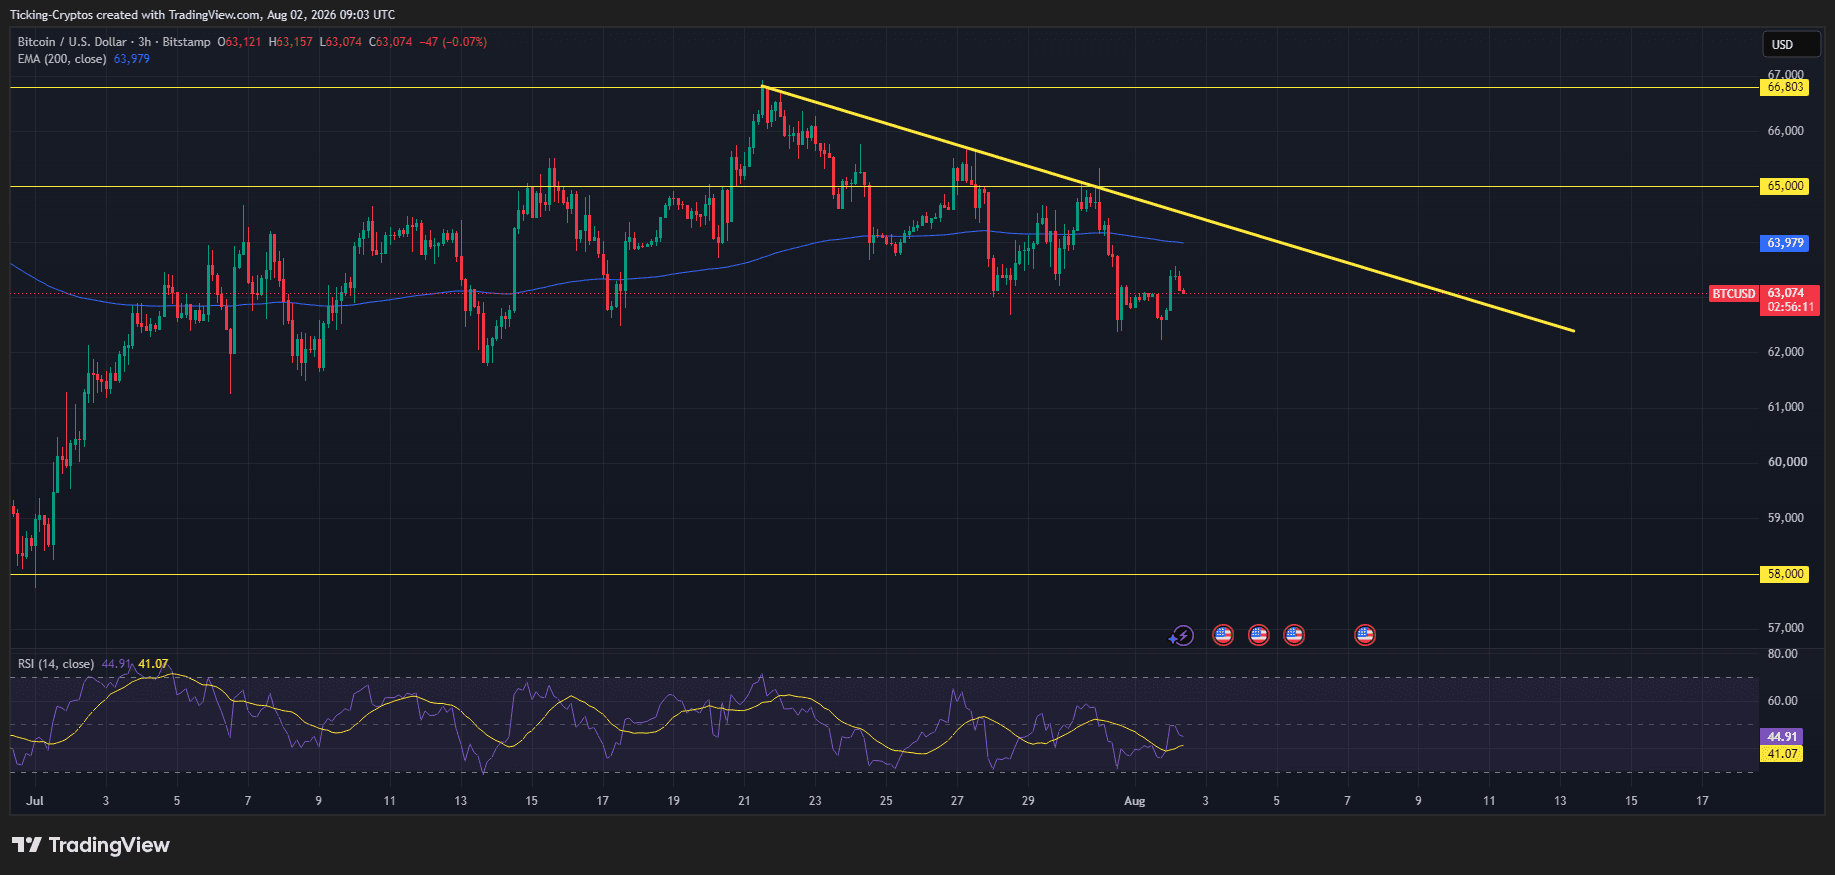
Bitcoin trades at $63,043, down roughly 28% year to date and compressing between support at $62,000 and a descending trendline that has capped every rally since 21 July. Most large-cap altcoins are 32% to 44% lower on the year. The screen below focuses on tokens priced under $5, with modest market capitalisations and deep drawdowns, but the selection is driven by identifiable catalysts rather than by price weakness alone. A token being cheap is not a thesis.
Why is the crypto market consolidating right now?
Bitcoin trades at $63,043 as of 13:11 UTC on 2 August, up a marginal 0.12% on the session, and the three-hour chart shows a textbook compression pattern.
The structure has four defined boundaries:
- Descending trendline resistance. Since the $66,803 high printed on 21 July, Bitcoin has produced a clean sequence of lower highs. That trendline has rejected every rally attempt for nearly two weeks.
- The 200-period EMA at $63,969. It supported price through most of July and flipped to resistance around 30 July. Bitcoin has traded beneath it since.
- Horizontal resistance at $65,000, a level lost in late July that now sits above both the EMA and the trendline.
- Support at $62,000, where selling was absorbed on both 25 July and 1 August, with major support far below at $58,000, the base of the early-July advance.
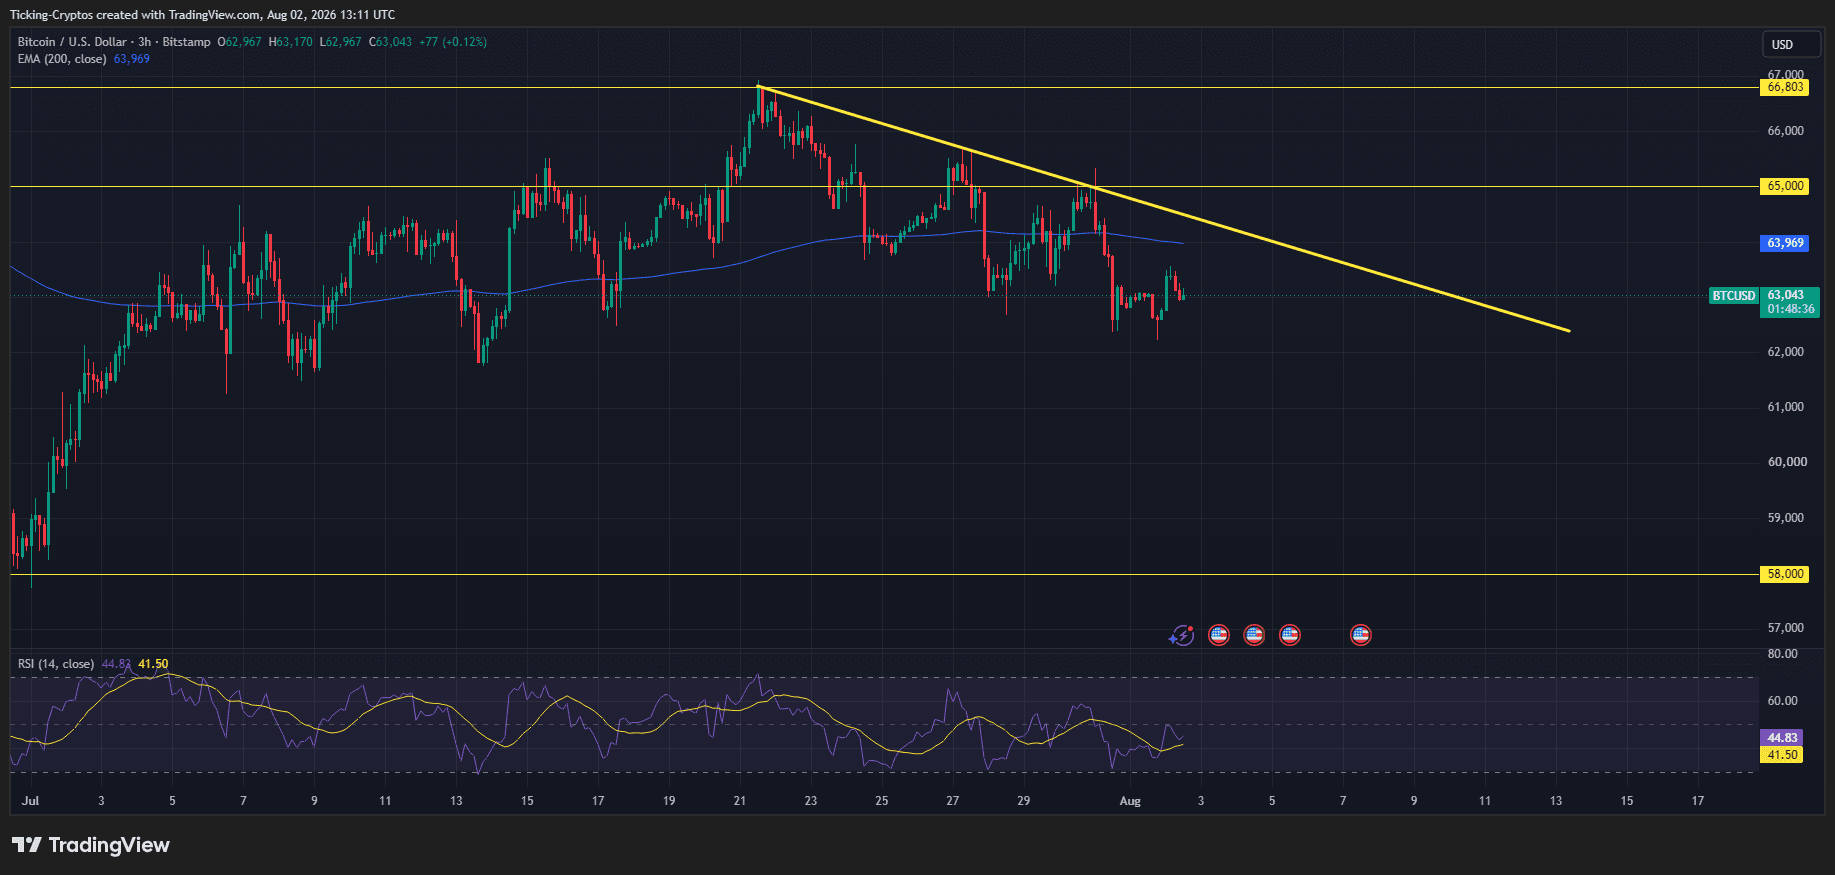
The RSI reads 44.83 against its own 41.50 average. That is below the neutral 50 line, but turning up from the lows rather than deteriorating. Sellers are largely exhausted, buyers are absent, which is the definition of consolidation.
The important detail is that this range is closing. The descending trendline is falling toward the $62,000 horizontal support, which means the two boundaries converge over the coming fortnight and force a resolution rather than allowing an indefinite drift. A break above the trendline and the $63,969 EMA opens $65,000 and then the 21 July high at $66,803. A loss of $62,000 puts $58,000 in play, roughly 8% lower, and altcoins would almost certainly fall harder than that.
Three features define this phase. Volatility has compressed, with Bitcoin absorbing a hawkish Fed, a $70 million wallet exploit and a stalled regulatory bill in a single week while declining only about 2%. Institutional flows have stabilised without turning positive, as July closed with $172.4 million of net inflows into US spot Bitcoin ETFs, ending two months of outflows but nowhere near the pace that drove previous advances. And altcoin dispersion has widened, with Cardano up 12.36% over the past week while Hyperliquid fell 11.02%, which is characteristic of a market trading on individual catalysts rather than a single directional impulse.
That last point matters most for this article. When correlation breaks down, token-specific developments start to determine returns.
Which macro forces are actually driving altcoin prices?
- Monetary policy is the dominant variable. The FOMC held rates at 3.50% to 3.75% on 29 July, but split 9-3, with Beth Hammack, Neel Kashkari and Lorie Logan all voting for a 25 basis point hike. It is the sharpest committee split since September 2016. CME FedWatch now assigns a 61.4% probability to a September hike, up from 50.6% a month earlier. Higher real yields compress valuations across long-duration risk assets, and altcoins sit at the far end of that spectrum.
- Geopolitical risk is persistent but increasingly discounted. The conflict involving Iran that escalated with joint US and Israeli strikes in late February remains unresolved, and Brent crude has carried a geopolitical risk premium throughout 2026, trading above $90 in July. The Russia-Ukraine war continues into its fifth year and is currently occupying Senate floor time through a sanctions bill. The important nuance is that markets have largely adapted. Analysts increasingly describe crypto as behaving like a liquidity sponge, expanding when global money supply and risk appetite rise and contracting when real rates climb, largely regardless of the headline conflict situation. War headlines produce sharp intraday moves that tend to mean-revert. Rate expectations produce trends.
- Regulatory clarity has been deferred. The CLARITY Act has cleared the House and the Senate Banking Committee, but no floor vote is scheduled, and Majority Leader John Thune does not expect one before the recess beginning around 7 August. Polymarket odds on 2026 passage have fallen from above 80% in February to roughly 35%. For altcoins specifically, this is the most consequential of the three, because the bill would have resolved the token classification question that keeps most regulated institutions away from anything other than Bitcoin and Ethereum.
- Security risk has repriced. An attacker drained 1,082.65 BTC, worth roughly $70.2 million, from 1,196 Coldcard-generated addresses on 30 July, exploiting a firmware flaw that allowed seeds to be reconstructed offline. Blockaid reported that crypto projects lost more than $1 billion to hacks in the first half of 2026. This raises the risk premium across the sector, and it disproportionately affects protocols holding large amounts of user capital.
What are the top 5 altcoins to watch in August 2026?
1. Ondo (ONDO)
Price: around $0.38 to $0.41 | Market cap: approximately $1.9 billion | Down roughly 81% from its $2.14 all-time high
$Ondo has the most concrete institutional pipeline of any token on this list. Its DTCC-linked tokenization initiative went live in July 2026, involving BlackRock, J.P. Morgan and Goldman Sachs in tokenizing Russell 1000 equities and Treasury bills. A separate cross-border settlement pilot with J.P. Morgan's Kinexys platform, Mastercard and Ripple completed in under five seconds. The protocol expanded tokenized securities on Solana with round-the-clock minting and redemption, and launched Ondo Perps for perpetual futures tied to equities and commodities. Total value locked sits near a record $3.5 billion across more than 205,000 holders. A governance vote to permanently burn 100 million ONDO, equal to 10% of total supply, concluded on 25 July.
The risk: Ondo is the clearest example in this market of platform growth failing to translate into token performance. TVL hit record highs while the price stayed flat, a documented disconnect. Roughly half the 10 billion total supply is still to enter circulation, which means dilution remains a structural headwind regardless of adoption.
2. Sui (SUI)
Price: around $0.72 to $0.78 | Mid-cap | Well below its all-time high
$Sui recorded a genuine institutional milestone on 23 July when Abu Dhabi sovereign wealth fund Mubadala tokenized a $75 million private markets fund directly on the network. In the same week, Hashi launched a Bitcoin lending testnet targeting institutional BTC-backed credit markets built on Sui. The pattern suggests a network positioning for regulated financial products rather than retail DeFi activity. Price action has been more constructive than the broader altcoin picture, with SUI reclaiming a key technical level in late July alongside rising on-chain activity.
The risk: the technical picture is a recovery attempt off cycle lows, not a confirmed trend reversal. Sui also tends to track broader altcoin liquidity and Bitcoin dominance more closely than it moves on its own news, which limits how much the Mubadala headline can do in a flat tape.
3. Stellar (XLM)
Price: around $0.18 | Roughly 79% below its 2018 all-time high of $0.94
$Stellar has assembled an unusually credible institutional validator set. MoneyGram, Figure Markets and Range all joined as Tier 1 validators in July. Tradable has committed to bringing up to $1 billion in tokenized private credit to the network. Most significantly, the DTCC has confirmed plans to connect its tokenized securities platform to Stellar, with $XLM expected to serve as the settlement asset. The network activated Protocol 27 following a 8 July vote, introducing authentication delegation, and reported more than $2 billion in real-world assets issued in Q1 2026 alone. Stablecoin supply on the network has grown almost 300% over two years.
The risk: the DTCC rollout is targeted for the first half of 2027. That is a long wait, and long-dated catalysts are precisely what a market with a 61.4% probability of a September rate hike discounts most heavily. XLM has also repeatedly failed to hold above the $0.20 resistance level.
4. Arbitrum (ARB)
Price: around $0.08 | Market cap: approximately $517 million | Roughly 97% below its $2.39 all-time high
$Arbitrum presents the sharpest divergence between network usage and token price in this group. Robinhood Chain launched its mainnet in early July using Arbitrum's technology, generating over $500 million in daily trading volume at peak, 17 million transactions in its first week and 350,000 addresses. The network surpassed Hyperliquid to reach eighth place among all chains by total value locked at approximately $1.2 billion, and leads all Layer 2 networks in Aave v3 borrowing and lending activity with $728 million in TVL. Usage has held up through a period of severe token weakness.
The risk: the reason for that divergence is dilution, and it is ongoing. Arbitrum unlocked approximately 92.65 million tokens in mid-July, most going to team, advisors and investors, with further unlocks scheduled through the remainder of 2026. Sustained selling pressure from vesting is the direct explanation for the price performance, and nothing in the schedule changes before year-end.
5. Ethena (ENA)
Price: around $0.083 | Market cap: approximately $790 million | Roughly 94% below its $1.52 all-time high
$Ethena is the highest-risk name here and belongs on the list for one reason: the institutional distribution is real. BlackRock integrated Ethena's USDe into its Aladdin risk management platform. Janus Henderson took a position in ENA and plans to use staked USDe for treasury cash management, adding to existing relationships with Anchorage Digital and Securitize. The potential fee-switch activation would convert ENA from a pure governance token into a cash-flow-linked asset by directing protocol revenue to stakers, which is the single change most likely to re-rate the token.
The risk, and it is substantial: the fundamentals are deteriorating, not improving. Gross protocol revenue fell 32% quarter over quarter to $65.06 million in Q1 2026. USDe supply has fallen from a $14.5 billion peak to roughly $5.92 billion. Daily active users have dropped to around 1,200. Ethena completed a 172 million token unlock on 4 July with further releases scheduled for August, and roughly 40% of the 15 billion maximum supply remains to be distributed. Ethena's model is also funding-rate dependent, meaning its yield compresses precisely when market sentiment turns negative. This is a speculative position on the fee switch and institutional distribution outrunning a shrinking protocol, not a bet on current performance.
Comparing where to trade these? Fees and spreads matter more in a range-bound market than in a trending one. 👉 See our crypto exchange comparison
What are the risks of buying altcoins during consolidation?
Consolidation does not guarantee an upside resolution. Ranges break in both directions, and a Bitcoin close below $62,500 would likely drag every token on this list lower regardless of individual catalysts, since altcoin correlation to BTC rises sharply during drawdowns.
Three risks deserve specific attention this month. Token unlocks affect three of the five names here, with ARB, ENA and ONDO all carrying active or imminent dilution schedules. The September rate decision is a binary event that markets currently price at 61.4% for a hike, and altcoins are the highest-beta expression of that outcome. And a deep drawdown is not automatically an entry point, since roughly 94% of major tokens launched since 2024 now trade below their launch price, with a median return around -95.7%. Most assets that fall 90% continue falling.
The immediate calendar is dense: US payrolls on 7 August, the Senate recess the same day, and CPI on 12 August. All three land before any of the catalysts described above have time to develop.
The week of 27 July to 2 August delivered an unusually dense run of catalysts: a hawkish hold from the Federal Reserve, the largest hardware wallet failure in Bitcoin's history, a month-end ETF redemption wave and a market structure bill running out of legislative runway.
$Bitcoin absorbed all of it and closed the week down roughly 2%, trading at $63,153 as of midday Sunday. That muted reaction is arguably the week's most informative data point, and it suggests a market that has already discounted a substantial amount of negative news.
The following is a breakdown of what moved, why it matters, and the scheduled events most likely to drive prices over the coming week.
What was the biggest crypto news this week?
Four developments carried material weight:
- The Fed held rates, but three officials voted for a hike, lifting September tightening odds above 60%.
- A firmware flaw in Coldcard hardware wallets was linked to approximately $70 million in stolen Bitcoin.
- US spot Bitcoin ETFs closed the week negative following a heavy month-end redemption day.
- The CLARITY Act reached the Senate recess window with no floor vote scheduled.
Secondary items, including Tether's quarterly profit and Solana's tokenized equity volumes, sit beneath those four in terms of market impact.
Why was the Fed's hold actually hawkish for crypto?
On 29 July the FOMC left the federal funds target range at 3.50% to 3.75%. The decision itself was expected. The vote was not. The committee split 9-3, with three regional presidents dissenting in favour of a 25 basis point hike: Beth Hammack of Cleveland, Neel Kashkari of Minneapolis and Lorie Logan of Dallas. It marks the sharpest FOMC split since September 2016.
Fed Chair Kevin Warsh reinforced the hawkish signal at the press conference, telling reporters there is no soft inflation target and no soft implicit target on this committee's watch.
Markets repriced immediately. CME FedWatch now assigns a 61.4% probability to a 25 basis point September hike, up from 50.6% a month earlier. Odds of a 50 basis point move have collapsed to zero, and a rate cut carries no probability at all. Prediction markets are aligned but less emphatic: Kalshi prices a hike at 53% against 44% for no change, and Polymarket at 52% versus 46%.
The implication for digital assets is direct. A tightening cycle resuming in September implies higher real yields, a firmer dollar and reduced appetite for long duration risk. Notably, Bitcoin held near $64,000 on the day of the decision while the S&P 500 fell about 1.5%, the Nasdaq 1.7% and the Dow 2.19%. Crypto outperformed equities on the announcement, which is an atypical response and worth monitoring.
How did $70 million in Bitcoin vanish without anyone touching a device?
An attacker drained 1,196 Bitcoin addresses in 41 minutes on 30 July, taking 1,082.65 BTC worth approximately $70.2 million. Galaxy Research attributed the sweep to a firmware flaw in Coldcard, the Bitcoin-only hardware wallet manufactured by Canadian firm Coinkite.
The mechanism distinguishes this incident from a conventional exploit. A March 2021 firmware integration error routed seed generation to a deterministic software pseudorandom number generator rather than the STM32 hardware random number generator. An attacker able to constrain the device UID, timer state and prior RNG-call history could therefore reproduce candidate seeds offline, without ever accessing the physical device. Candidate keys were then validated against public blockchain data and swept remotely.
The transactions carried identical 30 sat/vB fees with no change outputs and clustered across blocks 960,183 to 960,191, indicating full automation rather than manual execution. The proceeds currently sit in four addresses and have not moved.
Coinkite has acknowledged the failure. CEO Rodolfo Novak issued an apology and stated that the company took full accountability for the firmware bug, conceding that its review process had failed to identify it. Emergency firmware has been released for every affected model: version 4.2.0 or later for Mk3, 5.6.0 or later for Mk4 and Mk5, and 1.5.0Q or later for the Coldcard Q.
One detail is critical for affected holders. Updating firmware alone does not secure existing funds, because the private keys derived from a compromised seed remain unchanged. Affected users must generate an entirely new recovery phrase on the corrected firmware and migrate their BTC to it. Galaxy further warned that future attacks remain possible against any Coldcard-generated address, and that such attacks need not match the transaction pattern observed on 30 July.
The incident lands in an already difficult year for security. Blockchain security firm Blockaid reported that crypto projects lost more than $1 billion to hacks in the first half of 2026.
Still storing serious size on a single device? Compare hardware wallets side by side before you migrate your seed. 👉 See our wallet comparison
What are ETF flows telling us about institutional demand?
Institutional positioning remains mixed, with an increasing tilt toward Ethereum.
US spot Bitcoin ETFs recorded a net outflow of $61.53 million for the week ending 31 July, while spot Ethereum ETFs added $27.42 million and Solana ETFs took in approximately $2.82 million. HYPE products saw around $14.75 million in net outflows, consistent with the token's 11% weekly decline.
The Bitcoin damage concentrated in a single session. Funds shed $265.4 million on 31 July, reversing a $233.1 million inflow the previous day. BlackRock's IBIT accounted for $122.7 million of the outflow, Fidelity's FBTC $54.8 million and Grayscale's GBTC $52.6 million.
The monthly picture is more constructive. July closed with $172.4 million of net inflows for Bitcoin ETFs, ending two consecutive months of outflows after nearly $7 billion left the category across May and June. June alone was the worst month of 2026 at roughly $4.5 billion.
Ethereum products extended their run to four consecutive weeks of net inflows and finished July with $365.2 million, the second positive month of the year. They nonetheless remain approximately $1.1 billion in net outflows for 2026 overall, which frames the move as a recovery rather than a structural reversal.
The aggregate reading: institutions have largely stopped selling, but have not resumed buying with conviction.
Where do Bitcoin and the majors stand right now?
Prices as of midday Sunday 2 August, excluding stablecoins:
| Asset | Price | 24h | 7d | YTD |
|---|---|---|---|---|
| Bitcoin ($BTC) | $63,152.94 | +0.13% | -1.98% | -27.84% |
| Ethereum ($ETH) | $1,867.56 | +0.03% | -0.70% | -37.06% |
| $BNB | $583.35 | -0.43% | +2.16% | -32.42% |
| $XRP | $1.07 | +1.68% | -1.74% | -41.34% |
| Solana ($SOL) | $73.18 | +0.30% | -2.35% | -41.21% |
| TRON ($TRX) | $0.3272 | -0.07% | -1.05% | +15.11% |
| Hyperliquid ($HYPE) | $52.03 | -0.59% | -11.02% | +104.60% |
| Dogecoin ($DOGE) | $0.0700 | +0.26% | -4.59% | -40.31% |
| Zcash ($ZEC) | $473.79 | +1.62% | -3.64% | -7.55% |
| Cardano ($ADA) | $0.1853 | +7.31% | +12.36% | -44.31% |
| Monero ($XMR) | $360.45 | -1.16% | -0.35% | -16.80% |
Cardano is the clear weekly outperformer at 12.36%, with a 7.31% daily gain suggesting the move is still developing. BNB is the only other major in positive weekly territory. Hyperliquid is the week's largest decliner at 11.02%, though it retains a 104.60% year-to-date gain, and TRON remains the sole large-cap asset positive on the year alongside HYPE.
The year-to-date column is the more significant read. Bitcoin is down 27.84% in 2026 and trades well below the highs above $126,000 recorded earlier this year, while most large-cap altcoins sit 32% to 44% lower.
Technically, Bitcoin is now trading just beneath the 200-week moving average near $63,300, a level Marex analysts identified as the pivot for the current range. A sustained loss of $62,500 opens a path toward the $60,000 liquidation target. To the upside, the 20-day EMA near $64,288 and the 50-day EMA near $64,891 form the immediate resistance band, with the 100-day at $67,481 and the 200-day at $73,133 keeping the medium-term trend corrective.
Trading this volatility? Fees and spreads matter more in a chop than in a trend. 👉 Compare crypto exchanges
Is the CLARITY Act finished for 2026?
Not formally, but the timeline is close to exhausted. As of late July, the Digital Asset Market Clarity Act has cleared the House and the Senate Banking Committee, yet there is no floor vote, no cloture motion and no date on the calendar. Senate Majority Leader John Thune has indicated he does not expect the bill to reach the floor before the summer recess begins around 7 August, with the chamber prioritising nominations and subsequently a Russia sanctions bill.
Marex analysts characterised the delay as the removal of the market's one crypto-specific support, noting that the catalyst intended to unlock institutional buying is now parked. Prediction markets reflect the same assessment. Polymarket odds on 2026 passage fell from above 80% in February to a record low near 24% in mid-July, before settling around 35% as the ethics deadlock hardened.
The legislative groundwork remains in place. The House passed its version on 17 July 2025 by 294 to 134, and the Senate Banking Committee advanced it 15 to 9 on 14 May 2026. Should the bill miss the recess window, most observers treat early August as the practical cutoff, given that a fall vote would compete with appropriations negotiations and the election calendar.
What crypto events are coming next week?
The following dates fall between 3 and 12 August:
- Monday 3 August: ISM survey data. Consensus anticipates a recovery to 54.0 for July, with the prices paid component the relevant line for inflation trajectory.
- Wednesday 5 August: ADP private payrolls and services survey data.
- Friday 7 August, 8:30 AM ET: US non-farm payrolls for July. The week's primary catalyst, and the Fed's key labour input ahead of the September meeting. June printed at 57,000 jobs against forecasts of 110,000, following a downwardly revised 129,000 in May. A strong reading raises September hike odds and pressures risk assets; a weak one has the opposite effect.
- Friday 7 August: The Senate summer recess begins around this date, effectively closing the CLARITY Act's 2026 window absent rapid movement.
- Next week, exact day to be confirmed: The xrpld 3.3.0 release for the XRP Ledger is expected, carrying five proposed amendments, including two features previously withdrawn after researchers identified bugs.
- Tuesday 11 August: Pi Network mainnet upgrade deadline.
- Wednesday 12 August, 8:30 AM ET: US CPI for July. Combined with payrolls, this pair effectively determines the September decision.
- Wednesday 12 August: Aptos unlocks approximately 11.31 million APT, around 0.54% of total supply, at 2 AM UTC.
Further out, the next FOMC decision is scheduled for Wednesday 16 September at 2:00 PM ET.
What should traders watch?
Three variables, in order of significance.
- Friday's payrolls print. It is the largest single input into the September hike question, which is in turn the dominant driver of crypto direction. A softening labour market strengthens the case against tightening and relieves pressure on risk assets. A resilient one validates the three dissenters.
- The $62,500 level. Bitcoin has spent the week defending the low $60,000s and now sits marginally below the 200-week moving average. Losing $62,500 opens a retest of $60,000, while reclaiming the 50-day EMA near $64,900 would represent the first credible sign of returning momentum.
- ETF flows on Monday and Tuesday. The 31 July outflow was partly attributable to month-end rebalancing. Continued redemptions into the new month would indicate genuine repositioning rather than a calendar effect.
The broader setup is unchanged. Market commentary describes an asset class that absorbed sustained negative news through July but remains cautious into a historically choppy August, with rate hike expectations and labour data the principal risks. Bitcoin's ability to withstand a hawkish Fed, a $70 million wallet exploit and a stalled regulatory bill within a single week while declining only 2% is the strongest evidence available that current levels reflect substantial existing pessimism.
The crypto market is doing something unusual today: almost nothing. Hourly moves across the top 15 assets sit within a few hundredths of a percent of flat, and 24-hour changes cluster between minus 2% and plus 3%. That is a market holding its breath rather than one finding direction.
Zoom out, though, and the year-to-date column tells a far harsher story. Bitcoin is down 28%. Most large caps have lost between a third and half their value since January. And exactly three assets in the top 15 are still in the green for 2026.
Here is where every major coin stands right now.
What Is the Crypto Market Doing Right Now?
$Bitcoin trades at $63,018, up 0.06% on the hour, down 1.23% on the day and down 1.55% on the week. Market cap sits at $1.26 trillion against $22.73 billion in 24-hour volume.
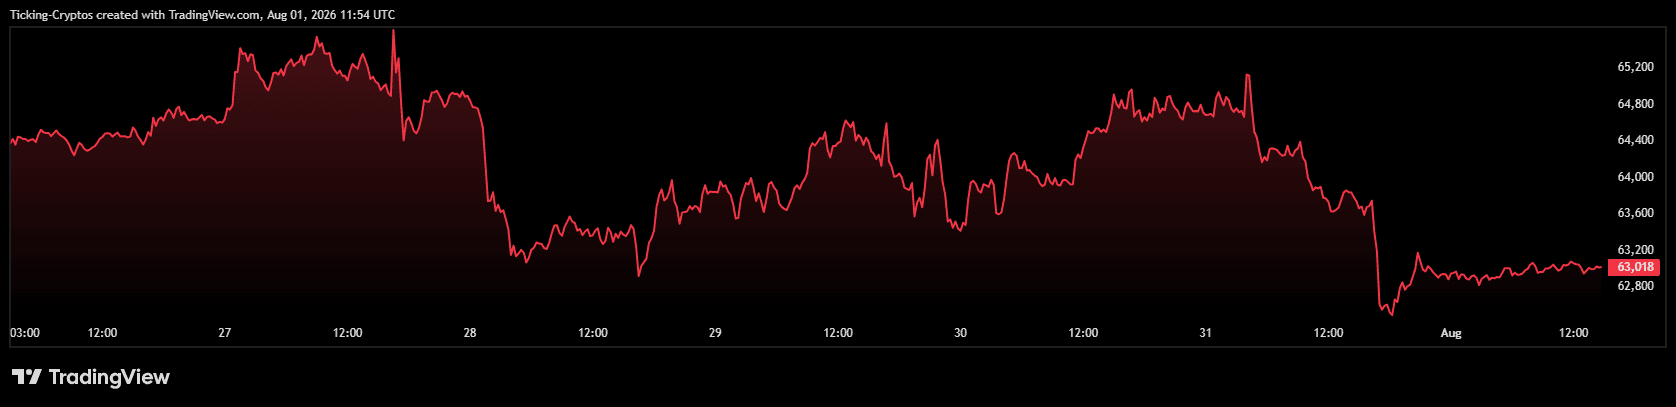
That volume figure is the number worth pausing on. Turnover equivalent to roughly 1.8% of market cap in a day is thin for Bitcoin, and thin volume in a downtrend usually means sellers have stopped panicking rather than buyers have arrived. It compresses ranges, which is exactly what today's price action shows.
$Ethereum is at $1,865, up 0.10% on the hour and down 0.90% on the day, but positive over the week at plus 0.48%. Its $225.07 billion market cap now sits at less than a fifth of Bitcoin's. The year-to-date figure is where the damage shows: minus 37.14%, meaningfully worse than Bitcoin's minus 27.99%.
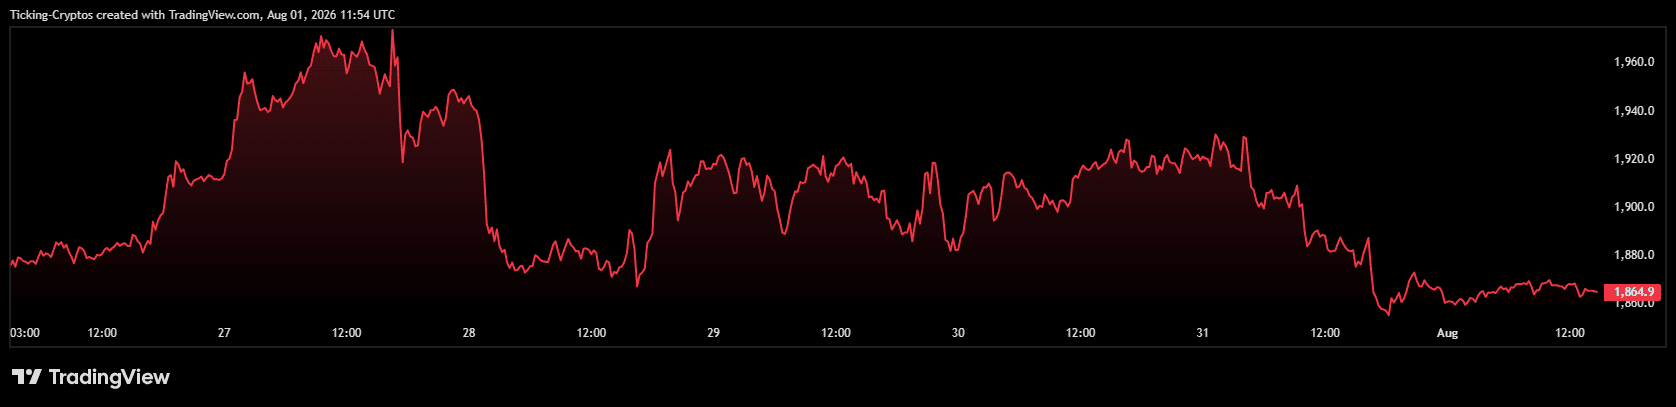
That gap is the defining structural fact of this market. Ethereum has underperformed Bitcoin by nine percentage points in seven months, and the rest of the smart contract sector has done worse still.
Which Assets Are Actually Up in 2026?
Only three names in the top 15 are positive year to date, and they have nothing in common.
- Hyperliquid ($HYPE) at $52.03 is the outright winner, up 104.60% this year with a $13.13 billion market cap. It is also today's biggest loser, down 4.89% on the day and 9.45% on the week. A perpetuals DEX token doubling in a market where Bitcoin fell 28% is a genuine outlier, but the current weekly slide suggests some of that outperformance is being handed back.
- TRON ($TRX) at $0.3274 is up 15.20% year to date, the only large cap outside HYPE with a meaningful gain. It is flat today, down 0.09% on the hour and up 0.36% on the day. TRON's stablecoin settlement volume gives it a revenue base that is largely indifferent to speculative appetite, which is precisely why it holds up when speculation dries out.
- UNUS SED LEO at $9.75 is up 1.50% for the year, effectively flat. Note its 24-hour volume: $404,110 against an $8.97 billion market cap. That is an exchange token that barely trades, so its price stability reflects illiquidity more than demand.
Why Are Privacy Coins Holding Up Better?
Zcash and Monero are the quiet story in this table.
Zcash ($ZEC) trades at $463.33, up 0.70% on the day and down only 9.59% year to date. Monero ($XMR) sits at $362.83, up 3.39% on the day, the strongest 24-hour move in the top 15, and down 16.25% for the year.
Set those against Cardano at minus 48%, XRP at minus 42% and Solana at minus 41%, and the divergence is stark. Privacy assets have lost roughly a third of what the large-cap alt sector has given up.
Two explanations compete. The charitable one is that privacy demand is genuinely uncorrelated with risk appetite, so these assets have a buyer base that does not disappear when the Fed turns hawkish. The blunter one is that both have small floats, low volumes and shallow order books, so they simply move less in either direction. Monero's $96.57 million in daily volume, the lowest of any non-stablecoin in the top 15 apart from LEO, supports the second reading.
Where Do XRP, Solana and Cardano Stand?
This is the damage zone of the 2026 market.
- $XRP at $1.06 is down 0.85% on the day, 2.54% on the week and 42.30% year to date, with a $66.39 billion cap. The psychological problem is obvious: the dollar level is now the story, and a break below it would be the first sustained sub-$1 period in over a year.
- $Solana at $72.79 is down 0.91% on the day and 41.52% for the year, with $42.29 billion in market cap and $1.22 billion in daily volume. Volume relative to cap remains healthier than most of this list, which means Solana is still being actively traded rather than abandoned.
- $Cardano at $0.1723 is the worst performer in the top 15 for 2026 at minus 48.23%. It is also, curiously, the best seven-day performer at plus 6.38%, up 1.44% on the day. That combination is typical of assets that have fallen far enough to attract mean-reversion buyers without changing anything fundamental.
- $Chainlink at $8.08 sits at minus 33.66% year to date, down 2.01% on the day. BNB at $579.68 is down 32.85% for the year but up 2.56% on the week, one of the few large caps with a positive weekly print. Dogecoin at $0.06975 is down 40.53% year to date and essentially flat today.
What Should Traders Watch Next?
Three things stand out from this snapshot.
First, compression. Hourly changes near zero across the entire top 15 rarely persist. Ranges this tight resolve, and the direction of that resolution usually follows the prevailing trend, which is currently down.
Second, the rotation pattern. Money that stayed in crypto through this drawdown went to assets with revenue (TRON), assets with a genuine product cycle (Hyperliquid) or assets with a use case detached from speculation (Zcash, Monero). It did not go to the 2021 generation of layer ones.
Third, the weekly greens. BNB at plus 2.56%, Cardano at plus 6.38% and Ethereum at plus 0.48% are the only meaningful positive weekly prints. That is a narrow base for any rebound thesis, but it is the first time in several weeks that anything outside the privacy sector has posted a positive week.
For Bitcoin specifically, the level that matters has not changed: the $60,000 to $62,000 band. Today's $63,018 sits directly above it, and everything in the table above is ultimately a derivative of whether that floor holds.
Crypto just closed one of the ugliest earnings weeks in its short public-market history. Strategy, the largest corporate holder of Bitcoin on the planet, reported an $8.22 billion net loss for the second quarter. Coinbase followed with a $359 million loss and its third consecutive revenue miss. And Bitcoin, the asset underneath both stories, spent the week sliding under $63,000.
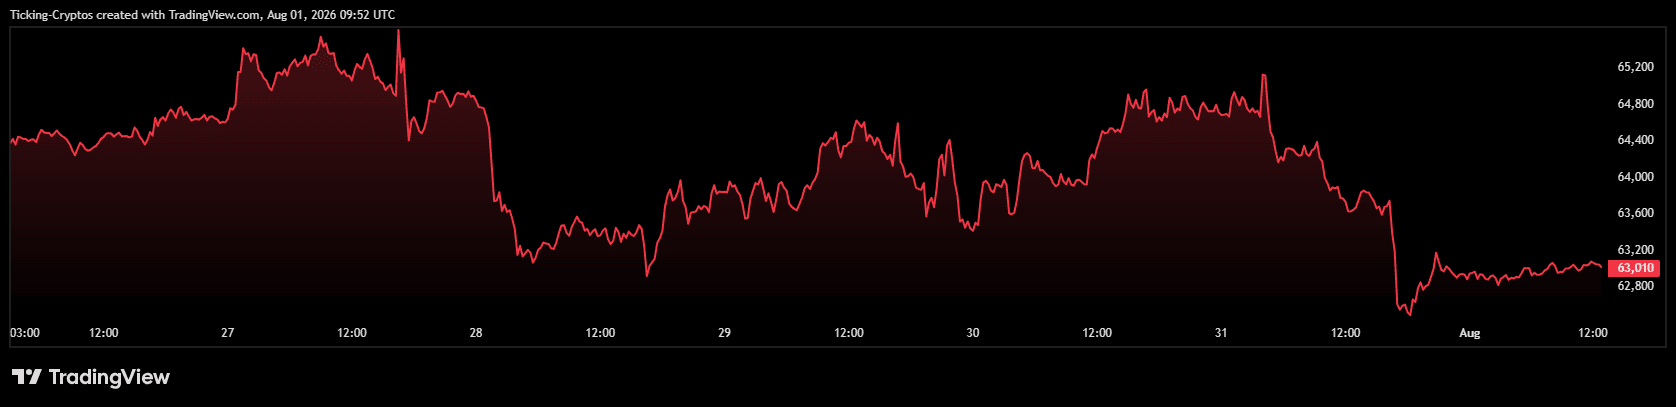
None of this happened in isolation. A hawkish Federal Reserve, a 27% Bitcoin drawdown since January, and a market structure bill stuck in the Senate have combined into the most defensive backdrop crypto has seen since 2022. Here is what actually happened, and what matters from here.
What Exactly Did Strategy Report?
The headline number is enormous, but it needs context. Strategy posted an operating loss of $8.33 billion for Q2 2026, driven almost entirely by an $8.32 billion unrealized markdown on its digital assets under fair-value accounting. Net loss came in at $8.22 billion, or $24.45 per diluted share.
Twelve months earlier, the same accounting treatment produced a $14.05 billion unrealized gain and $10.02 billion in net income. That is roughly an $18 billion swing in reported earnings, with no change to the underlying business model.
The software business, almost forgotten at this point, actually grew. Revenue rose 6.9% year over year to $122.4 million, with gross margin at 66.6%.
Michael Saylor framed the quarter as a phase of muted sentiment rather than a structural problem, and reiterated the company's push to build out what it calls Digital Credit as a new asset class.
Is Strategy's Bitcoin Position Actually in Danger?
This is the question that matters, and the answer is more nuanced than the headline suggests.
Strategy held 843,775 $BTC as of 26 July, up 25% since the start of 2026. Those coins carry an aggregate acquisition cost of roughly $63.69 billion and were worth about $54.77 billion at the time of reporting. Average cost basis sits near $75,476 per coin, which puts the position roughly $10,700 underwater per Bitcoin and around $8.9 billion below cost in total.
Crucially, that loss is unrealized. It reflects mark-to-market movement, not selling. The company did sell approximately $218.4 million of Bitcoin this year, but that was to fund preferred stock dividends rather than a forced unwind.
The balance sheet work is where the real story sits. Strategy raised $17.06 billion through at-the-market share offerings this year, cut convertible notes from $8.21 billion to $6.71 billion via a discounted $1.5 billion repurchase, and built a dollar reserve of $3.75 billion. Management says that reserve covers about 2.1 years of preferred dividends and interest under current policy.
Translation: the company is not in immediate distress. But its capital structure has become complex enough that investors are now scrutinising the dividend machine as closely as the Bitcoin stack.
Why Did Coinbase Disappoint Again?
Coinbase reported revenue of $1.22 billion, down 18.5% year over year, against roughly $1.30 billion expected. GAAP loss came in at $1.36 per share versus consensus near breakeven. Shares fell around 6% after hours to about $153.
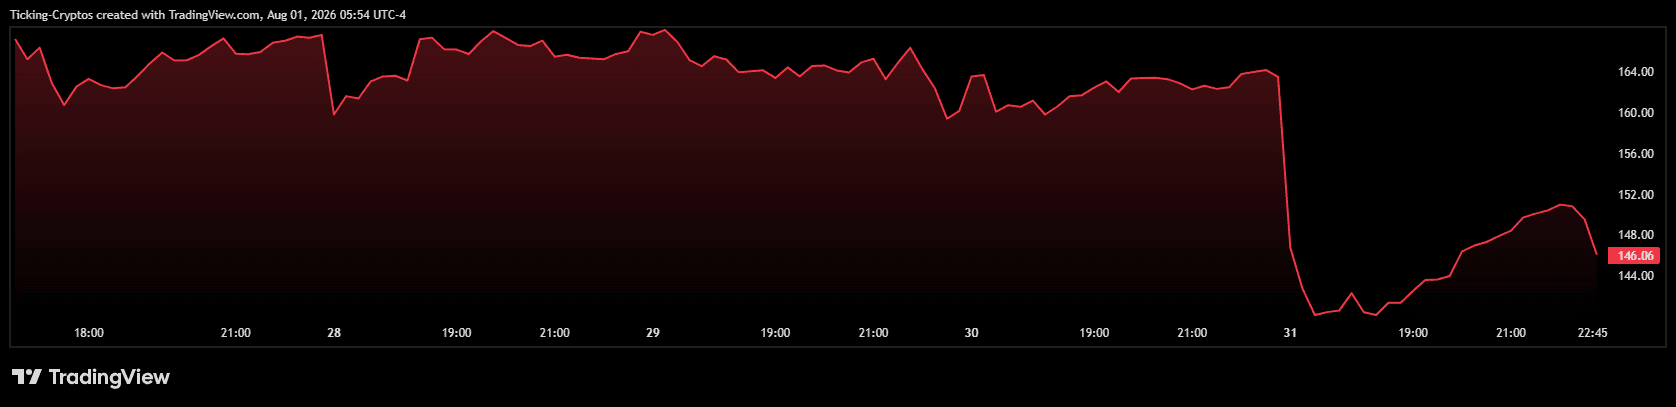
The problem is straightforward: total crypto market capitalisation fell 11% quarter over quarter and spot trading volumes dropped 25%. Transaction revenue landed at $599 million, subscription and services at $555 million, and stablecoin revenue slipped to $292 million. Monthly transacting users fell to 7.6 million from 8.7 million a year earlier, while assets on platform dropped to $245.9 billion from $425 billion.
The bright spots were real, though. Coinbase took a record 10.3% share of global crypto trading volume, its third straight quarterly high. Prediction markets revenue more than doubled quarter over quarter and crossed $100 million annualised. Adjusted EBITDA stayed positive at $207.8 million, the fourteenth consecutive positive quarter. Bitcoin-linked transactions now account for just 12% of revenue, down from more than half historically.
Brian Armstrong summarised the pitch bluntly, saying the company is no longer just a bet on the Bitcoin price. The market, for now, is not paying for that story.
What Is the Fed Doing to Crypto Right Now?
Macro is the pressure that turned a soft quarter into a bad one.
The FOMC held rates at 3.50% to 3.75% at its 29 July meeting, but the tone was the hawkish part. Three regional Fed presidents dissented in favour of an immediate hike, and Chair Kevin Warsh made clear that inflation above 2% is not acceptable. With inflation running near 4.1%, a cut is off the table and a September hike is now a live debate.
For crypto, tighter liquidity is a direct tax on leverage. Holding leveraged positions gets more expensive, risk appetite compresses, and capital rotates toward cash and short-duration paper. DWF Labs managing partner Andrei Grachev called the hawkish hold the least favourable outcome available and argued institutional positioning should turn defensive.
Regulation has not helped either. Odds on the CLARITY Act passing collapsed toward the high 20s on prediction markets after the Senate missed its August deadline, even as a 616-page merged committee draft circulated.
Where Does Bitcoin Go From Here?
$Bitcoin is trading in the low $63,000s, down from roughly $88,400 at the end of 2025 and far below the October 2025 peak near $126,000.
The technical picture is contested. Price is pressing against a descending trendline from that 2025 high, with all four weekly EMAs sloping downward overhead. The 20-week sits near $69,445 as the first real ceiling. On the downside, the $60,000 to $62,000 band has held through repeated tests since the June low and is the level bulls need to defend. Lose it, and the June low near $57,500 comes back into play.
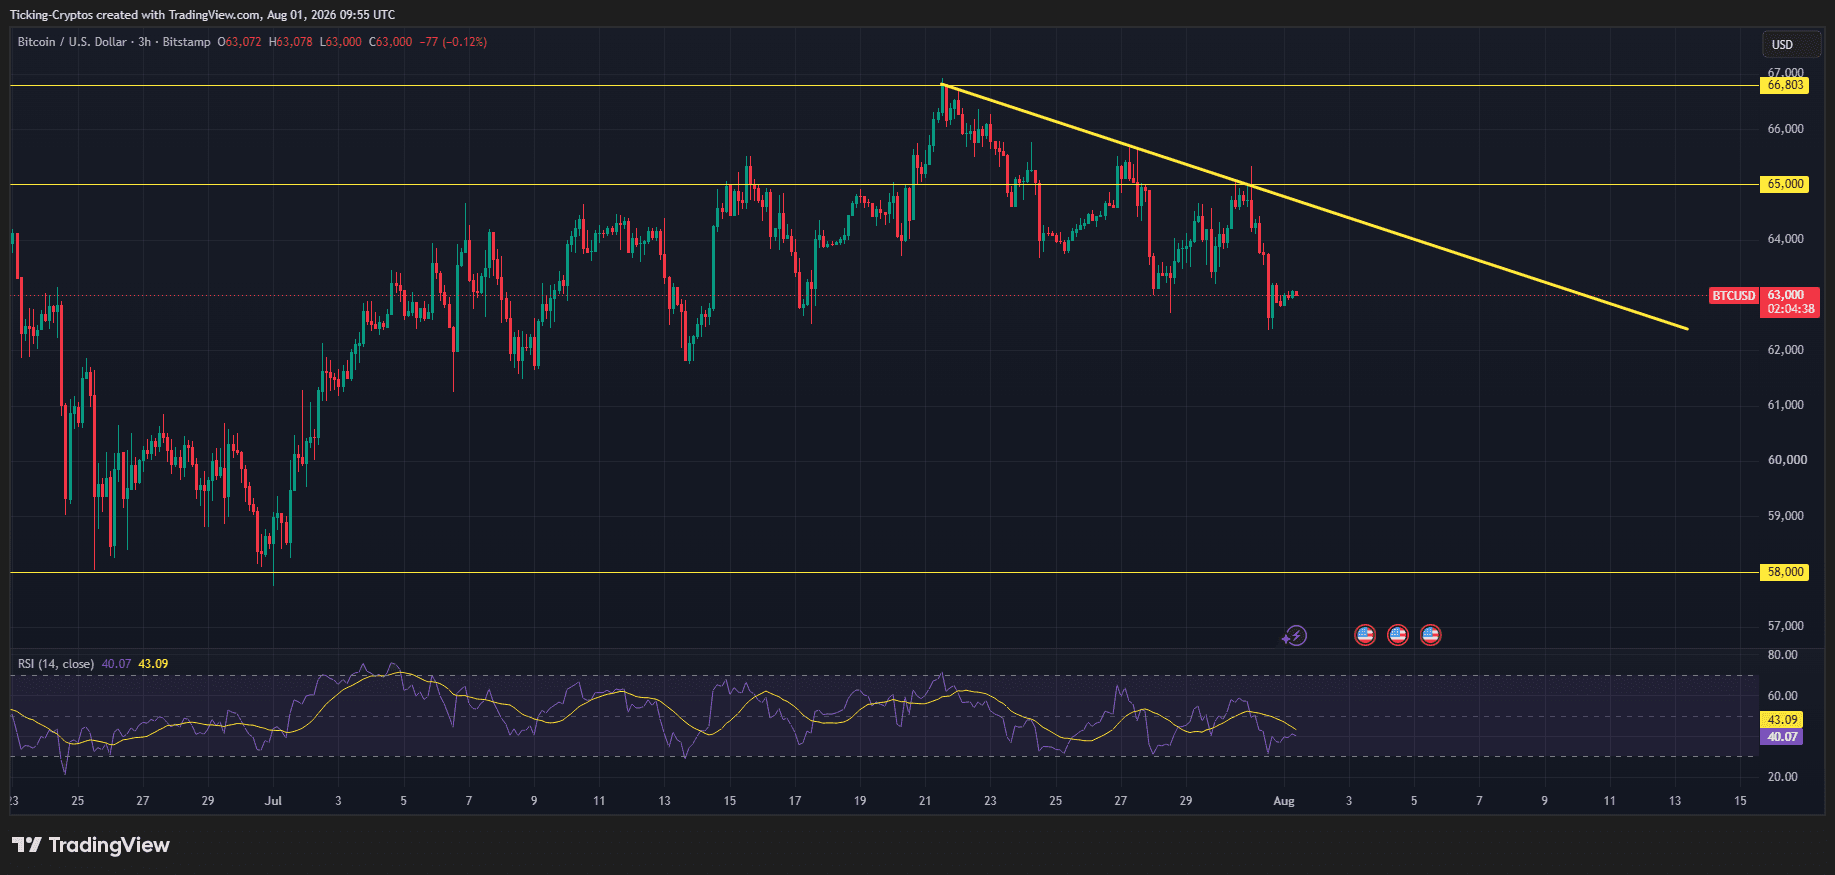
Seasonality is not on Bitcoin's side. July closed up around 9%, roughly in line with its historical average, but in the two most comparable bear-cycle years, 2018 and 2022, August erased those gains entirely.
The counterargument is that a restrictive Fed is now fully priced, ETF flows have shown signs of stabilising, and a weekly RSI divergence is flashing the opposite of what the macro tape suggests. Analysts looking at the same Fed decision have reached genuinely different conclusions, which is usually a sign the market is at an inflection rather than in a trend.
Decrypt
Galaxy Research says a third wave of thefts from Coldcard Bitcoin wallets has pushed observed losses to roughly 1,367 BTC across 4,585 addresses.
Lawsuits, privacy complaints, secret recordings, and government investigations have put Meta’s AI glasses under scrutiny.
The Binance founder urged holders to spread funds across multiple wallets as Galaxy Research put the toll from the Coldcard exploit at roughly $70 million—nearly double the initial estimate.
Gallup says Americans are growing more skeptical of artificial intelligence, with rising concerns about job losses, businesses' use of the technology, and the technology’s growing impact.
The Nano Banana tool let users generate fake satellite scenes from a text prompt, alarming investigators who rely on Google Earth to verify breaking news and atrocities.
U.Today - IT, AI and Fintech Daily News for You Today
The Coldcard exploit started a wave of fear that Bitcoin holders haven't yet witnessed.
An artificial intelligence model reportedly identified the same critical vulnerability in minutes.
Some outsiders of the cryptocurrency market are unexpectedly gaining traction.
The timing of these inflows is particularly significant given broader market conditions.
Bloomberg’s Eric Balchunas shares his take on a $89 million drain from Coldcard hardware wallets and how it provides the ultimate bull case for regulated spot Bitcoin ETFs.
Blockonomi
Key Takeaways
- FFAI shares rallied following July robotics shipments that hit a record 152 units.
- The company unveiled a three-phase U.S.-based robotics manufacturing initiative.
- New FCC regulations create higher barriers for foreign robotics manufacturers entering the American market.
- Faraday Future’s existing robot lineup holds necessary FCC certifications for uninterrupted U.S. operations.
- The company aims to ship 2,000 robotics units by the close of 2026.
Shares of Faraday Future (FFAI) climbed 10.84% to reach $5.93, then extended gains by 18.82% to $7.05 in pre-market trading. The rally came after the company announced record robotics shipments in July and outlined a comprehensive U.S.-based manufacturing strategy. Faraday Future also highlighted how recent regulatory changes by the FCC could boost demand for domestically compliant robotics solutions.
Faraday Future Intelligent Electric Inc., FFAI
July Shipments Set New Robotics Benchmark
Faraday Future disclosed that it shipped 152 robotics units in July, establishing a new monthly high. This performance pushed the company’s cumulative shipments to 394 units through the end of July. The milestone demonstrates meaningful progress toward management’s year-end goal of 2,000 total units.
The robotics portfolio currently serves education institutions, industrial clients, security operations, inspection services, and various commercial sectors. Management emphasized that these verticals now enable broader adoption throughout its expanding robotics ecosystem. The firm anticipates sustained sales momentum as distribution networks and fulfillment capabilities continue to scale.
Faraday Future has designed its robotics approach around four pillars: hardware devices, software platforms, data intelligence, and vertical-specific solutions. This integrated model allows the company to pair hardware revenue with ongoing technology and service streams. Such an architecture positions the business to capture long-term value as customers implement increasingly sophisticated robotics applications.
New FCC Rules Create Competitive Advantage
On July 28, the FCC expanded its Covered List to include certain advanced robotic devices manufactured abroad. Under the updated regulations, newly listed products typically cannot obtain fresh FCC equipment authorizations. The rule changes affect mobile robotics platforms, including humanoid and quadruped configurations.
Faraday Future confirmed that its current robot product line already possesses the necessary FCC certifications. As a result, the company does not anticipate any interruption to its existing sales channels or supply chain operations. Management also indicated plans to secure additional certifications for upcoming products and regulated hardware components.
The company believes the new regulatory framework will impose higher compliance expenses on foreign manufacturers attempting to enter the U.S. market. Furthermore, executives anticipate increased partnership interest from suppliers looking to establish compliant distribution channels domestically. Faraday Future views these dynamics as a competitive tailwind for its California-headquartered robotics division.
Three-Phase U.S. Production Plan Announced
Faraday Future introduced a three-phase initiative designed to bring more robotics production onshore. Phase one encompasses software development, engineering tools, industry-specific applications, and the company’s proprietary robotics data infrastructure. These capabilities now form the operational backbone for expanded domestic manufacturing activities.
Phase two will transition select robot assembly processes and regulated component production to U.S. facilities. Following that, phase three aims to establish full-scale domestic manufacturing for complete robot systems and certain covered parts. The company believes this roadmap will enhance supply chain resilience and simplify regulatory oversight.
Faraday Future also announced plans to host a partner recruitment conference targeting robotics suppliers, distribution networks, end customers, and system integration firms. The gathering will focus on attracting manufacturers, component producers, dealer networks, rental service providers, and data ecosystem partners. Through these collaborative relationships, the company intends to accelerate U.S. market penetration and fortify its commercial robotics infrastructure.
The post Faraday Future (FFAI) Stock Climbs on Robotics Momentum and FCC Rule Changes appeared first on Blockonomi.
TLDR
- A fourth attack wave moved 448.7 Bitcoin from 709 suspected victim addresses, according to Galaxy Research.
- Combined losses across all four waves are estimated near 1,815 Bitcoin from 5,294 addresses.
- Coinkite traced the flaw to a 2021 firmware update that swapped its true random number generator for a weaker one.
- Kraken security chief Nick Percoco says the case shows hardware wallets lack independent testing standards other devices already use.
- Coldcard has halted shipments, destroyed affected stock, and released fixed firmware, but users still must move funds to new seeds.
Coldcard, a maker of Bitcoin hardware wallets, is facing a wave of thefts tied to a firmware flaw that went unnoticed for five years. Blockchain research firm Galaxy Research says a fourth attack wave hit over the weekend.
That wave moved 448.7 Bitcoin from 709 suspected victim addresses. Galaxy’s head of research, Alex Thorn, called the addresses “likely Coldcard victims” based on transaction patterns, not confirmed device records.
Across all four waves, Galaxy estimates roughly 1,815 Bitcoin has been taken from 5,294 addresses. That number is not confirmed by Coinkite, police, or every wallet owner involved, and it assumes the victim groups don’t overlap.
LIKELY 4TH ORGANIZED WAVE COLDCARD ATTACK OCCURRING RIGHT NOW
THERE ARE STILL SIMILAR TXS IN THE MEMPOOL WAITING TO BE CONFIRMED AND THE PREVIOUSLY-CONFIRMED TXS SIGNAL RBF OPT-IN, CHECK YOUR FUNDS AND YOU MAY BE ABLE TO RBF YOUR WAY OUT OF THIS
pattern identified:
blocks…— Alex Thorn (@intangiblecoins) August 3, 2026
How the Flaw Happened
Coinkite, the company behind Coldcard, says the problem began in March 2021 during a change to its cryptographic library. The update accidentally routed seed creation to a weaker software-based random number generator instead of the device’s intended hardware generator.
Coinkite said in its report that the weaker generator existed in the source code without the team knowing it was being called. Affected models include the Mk2, Mk3, Mk4, Mk5, and Q, each losing a different amount of randomness as a result.
Block’s engineering team reviewed the issue on its own and confirmed the firmware was calling the weaker fallback generator instead of the true hardware source. Block said it had not run full tests to confirm the flaw could be exploited, but agreed early disclosure was needed given the theft reports.
What Users Need to Do
Coinkite has released fixed firmware for every affected model. Installing it does not repair wallets that already created a weak seed.
Anyone with an older seed needs to generate a new one on the updated firmware, test it with a small transfer, then move the rest of their funds. Seeds made with at least 50 dice rolls, or protected by a strong passphrase, are not considered exposed by this specific issue.
Galaxy Research says some flagged transactions are still sitting unconfirmed in Bitcoin’s network. That gives affected owners a narrow chance to move funds first by sending a new transaction with a higher fee.
This only works before the original transaction is confirmed in a block, and there is no guarantee the replacement will succeed.
Kraken’s chief security officer, Nick Percoco, said the case points to a gap in how hardware wallets get tested. He compared it to standards already used for other cryptographic devices, saying wallet makers have no equal system to confirm which random number generator is actually running in production.
Coinkite halted all device shipments after confirming the bug and destroyed unsold units carrying the flawed firmware. The company has asked users not to throw away old devices, saying they may help identify stolen funds later.
Coinkite says its legal team plans to work with law enforcement in multiple countries as the investigation into the thefts continues.
The post Coldcard Bitcoin Wallet Flaw Leads to Fourth Attack Wave appeared first on Blockonomi.
FUNToken continues to expand its gaming ecosystem with the launch of Bolt Master, the latest addition to its growing portfolio of Android games. As the eighth mobile title released under the $FUN Games ecosystem, Bolt Master combines satisfying puzzle mechanics with real $FUN rewards, giving players another fun and rewarding way to engage with the platform.
In Bolt Master, players must carefully unscrew bolts, free wooden planks, and solve increasingly challenging puzzles one move at a time. Each level introduces fresh layouts that reward strategic thinking, precision, and problem-solving, creating an experience that is both relaxing and addictive.
A Puzzle Game Designed for Everyone
Bolt Master is easy to pick up yet offers enough challenge to keep players coming back for more. Whether completing a few quick levels or tackling more complex puzzles, players can enjoy smooth gameplay while earning real $FUN rewards as they progress.
Like every game in the $FUN Games ecosystem, Bolt Master delivers a player-first experience with:
- Real $FUN rewards
- No ads
- No paywalls
- Smooth, accessible gameplay
- Free download on Android
Continuing to Grow the $FUN Games Ecosystem
The launch of Bolt Master reflects FUNToken’s ongoing commitment to expanding its gaming ecosystem with high-quality mobile experiences that provide genuine utility for the $FUN token. Each new release strengthens the ecosystem by giving players more ways to engage, earn rewards, and enjoy a seamless gaming experience.
With eight Android games now available, the $FUN Games ecosystem continues to grow while remaining focused on accessible gameplay, rewarding experiences, and continuous innovation.
Players can download Bolt Master today from Google Play and begin solving puzzles while earning real $FUN rewards.
About FUNToken
FUNToken powers a rapidly expanding ecosystem of games, rewards, and digital experiences designed to make earning and using $FUN simple and engaging. From mobile and web games to staking, rewards, and growing platform integrations, the ecosystem continues to provide more utility and accessibility for users worldwide.
With a focus on delivering high-quality gaming experiences, real $FUN rewards, and a seamless user experience, FUNToken is building an ecosystem where entertainment and utility go hand in hand.
The post FUNToken Expands Its Mobile Gaming Ecosystem with the Launch of Bolt Master appeared first on Blockonomi.
TLDR:
- FARTCOIN price gained 2.60% to $0.130 as meme coin demand and a wider crypto rebound supported renewed speculative buying.
- A whale opened a 2x leveraged long covering 16.73 million tokens, worth about $2.16 million, and placed another $531,000 limit order.
- The token broke above a July falling wedge and retested $0.125, while bullish MACD and RSI divergence signals strengthened the setup.
- Resistance sits between $0.135 and $0.15, while a loss of the $0.12 support area could weaken momentum and expose lower demand zones.
FARTCOIN’s price rose 2.60% over 24 hours to $0.130, outperforming the broader crypto market’s 1.37% advance. The move followed renewed demand for meme coins and speculative tokens during a wider risk-on rotation. Bitcoin also gained 1.24%, adding support to smaller assets across the market.
The rally gained further attention after a large trader opened a leveraged position worth $2.16 million. Technical indicators also improved after the token moved above a falling wedge resistance line. However, nearby supply around $0.135 still limits the immediate upside. Traders are now watching whether momentum can carry the token toward $0.14 and beyond.
FARTCOIN Price Gains Support From Whale Accumulation
A mysterious trader opened a 2x long position covering 16.73 million FARTCOIN tokens on Hyperliquid. Lookonchain valued the position at more than $2.16 million when the activity appeared on-chain. The trader also placed a limit order for another 18.04 million tokens worth about $531,000.
The second order suggests the investor expects another pullback before adding exposure. If filled, the combined position would exceed $2.69 million. The open trade was already showing an unrealized gain above $17,000 when the data was recorded.
Whale accumulation has strengthened interest around the FARTCOIN price outlook. However, derivatives data still shows meaningful pressure from sellers. CoinGlass data placed long liquidation leverage near $6.41 million between $0.118 and $0.125. Short leverage reached about $6.91 million between $0.132 and $0.145.
That imbalance leaves the market vulnerable near resistance. Even so, the Long-Short Ratio rose from 0.9507 on August 1 to 1.1154 on August 2. The change indicates a gradual shift toward bullish positioning as traders entered the new month.
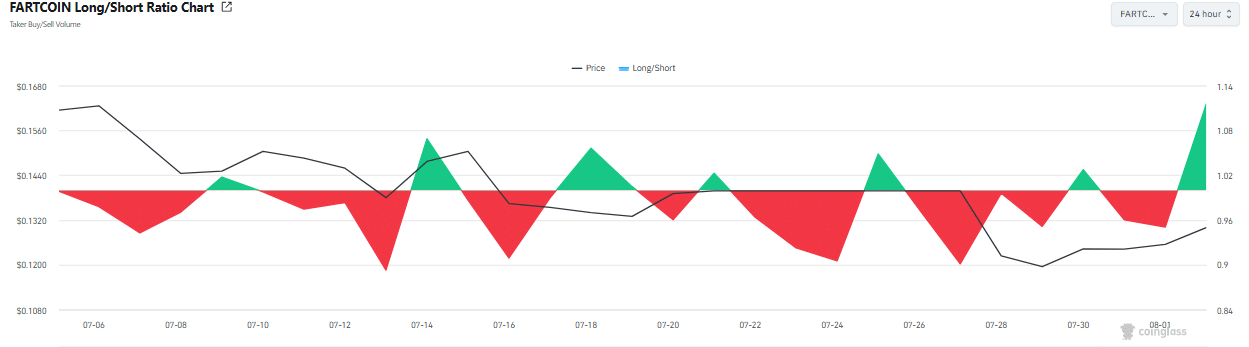
The broader market also helped the token. Bitcoin held above $64,500 after weekend geopolitical tensions eased. President Donald Trump canceled planned strikes against Iran, reducing immediate risk aversion across speculative markets. Meme coin demand accelerated at the same time, with DOGO and CATX posting extreme gains.
Breakout Structure Puts $0.14 Resistance Zone in Focus
FARTCOIN’s price has moved above a falling wedge that shaped trading through most of July. The correction followed a June rally that peaked near $0.175. Buyers later defended the breakout area around $0.125, confirming a successful retest of former resistance.
Momentum indicators also turned constructive. The MACD flipped bullish, while an RSI divergence signal appeared three times within two weeks. The RSI reading reached 59.83, placing it above the neutral level without entering heavily overbought territory.
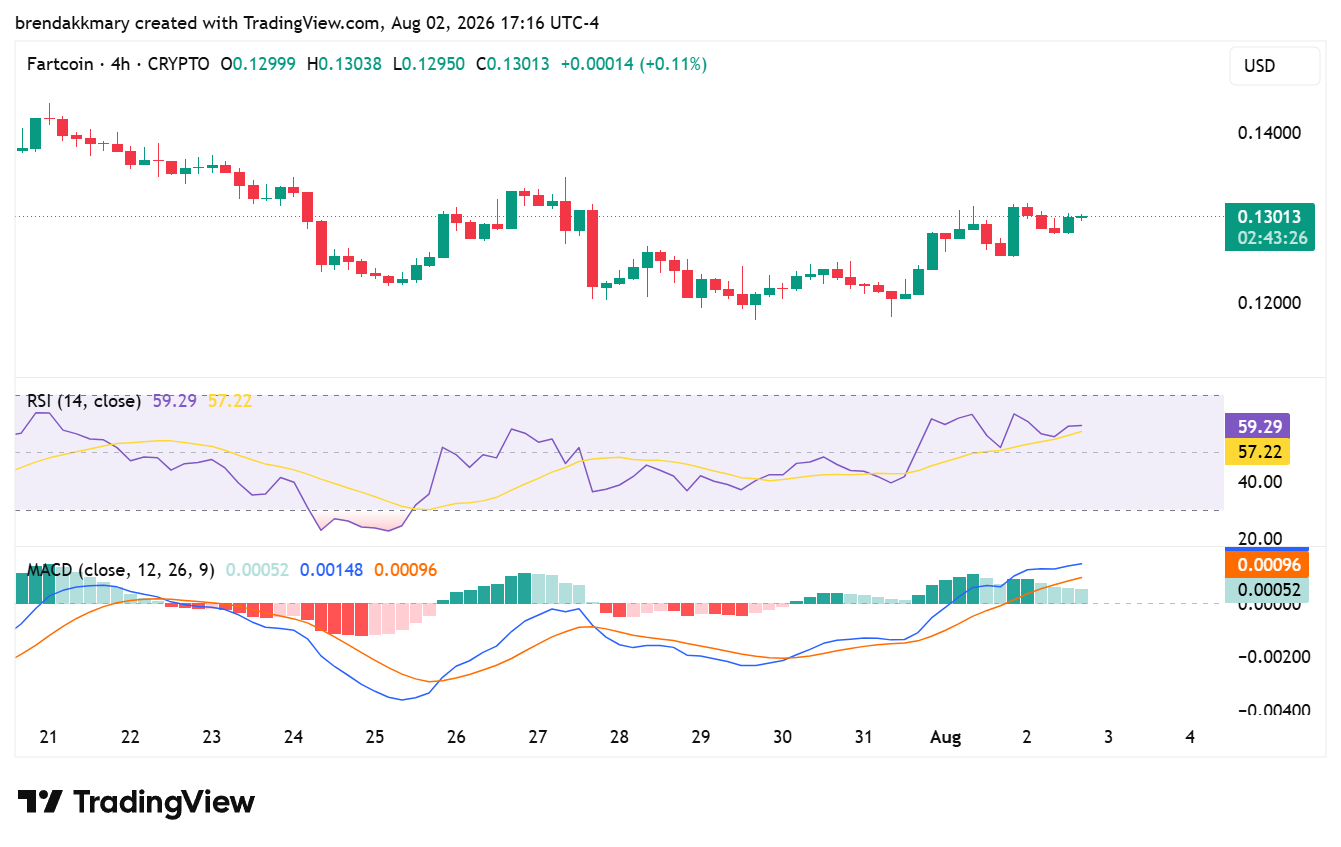
The four-hour chart analysis shows consolidation inside a symmetrical triangle. This structure places the token near a decisive technical area as volatility tightens. A confirmed move above $0.14 to $0.15 could open space toward $0.20. Some analysts also identify $0.30 as a broader breakout target.
Meanwhile, the daily volume reached $11.02 million, while market value stood at $129.2 million. Despite the rebound, FARTCOIN remained more than 51% lower year to date and far below its earlier $2.61 peak.
The immediate barrier sits near $0.135, where local supply previously slowed buying. Additional resistance appears at $0.140 and $0.155. These levels could attract profit-taking from short-term traders following the recent rebound.
Support remains equally important. The first key level sits at $0.12, followed by a stronger zone between $0.11 and $0.10. A drop below those areas would weaken the bullish setup and increase liquidation risks for leveraged buyers.
FARTCOIN price still depends heavily on speculative demand rather than a project-specific catalyst. Sustained volume, social activity, and Bitcoin strength will influence whether the breakout develops. Traders are also watching whether gains across smaller meme coins hold through the next trading sessions.
The post FARTCOIN Price Breakout Builds as Whale Opens $2.16M Leveraged Position appeared first on Blockonomi.
TLDR:
- Bitcoin price crash pushed BTC toward $62,000, cut market value, and accelerated a broad crypto sell-off across major altcoins.
- Total crypto capitalization fell toward $2.22 trillion, while the altcoin market shrank near $964 billion as liquidity retreated.
- Cardano bucked the wider decline with a 15.3% weekly gain, although ADA still trades far below its historical peak and key resistance.
- CLARITY Act delays, wallet-security concerns, geopolitical tension, and rising unrealized losses keep downside risks elevated.
Bitcoin’s late-July reversal turned a promising rally into a sharp Bitcoin price crash, dragging major altcoins lower across the market. BTC fell toward $62,000 after trading above $65,000, wiping billions from its valuation within hours. The total crypto capitalization reached near $2.22 trillion by August 2.
Altcoin capitalization also slipped to about $964 billion as Ethereum, XRP, Solana, and HYPE recorded weekly losses. Cardano moved against that pressure, with ADA posting a double-digit weekly gain.
Traders now face policy uncertainty, geopolitical tension, wallet-security concerns, and worsening on-chain losses. They are assessing whether selling pressure can deepen further.
Bitcoin Price Crash Pushes the Market Into Deeper Stress
The Bitcoin price crash followed a volatile week shaped by macro pressure and fading regulatory optimism. Bitcoin closed July with a modest monthly gain after surrendering much of its late-month advance. Latest market data showed BTC near $63,273, following an intraday low around $62,414.
The Federal Reserve’s decision to hold rates steady offered little support for speculative assets. A risk-off tone developed as investors tracked conflict across the Middle East. Those pressures reduced appetite for leveraged positions and encouraged capital preservation.
Policy uncertainty added another layer of caution. The CLARITY Act has cleared the Senate Banking Committee, but passage before the August recess looks increasingly unlikely. Senate leaders face a limited calendar and unresolved disputes over ethics language. The bill also requires bipartisan support.
The Bitcoin price crash therefore reflects more than one catalyst. Regulatory delays, geopolitical risks, and weaker confidence are combining with technical structure. Security concerns returned after reports linked a Coldcard vulnerability to the theft of roughly 594 BTC from hundreds of wallets.
Cardano Strength Contrasts With the Wider Altcoin Rout
Cardano separated from the crypto market sell-off as ADA gained while large-cap tokens weakened. Latest market data placed ADA near $0.1885, up 9.6% from the previous close. The weekly chart shows a 15.3% advance, making Cardano the clearest outlier.
That strength did not erase Cardano’s longer decline. CryptoPatel says ADA remains 96% below its 2021 peak and 89% below its December 2024 swing high. The analyst placed demand between $0.086 and $0.150, where buyers previously supported an expansion.

Cardano price action has reclaimed the upper edge of that area, but confirmation requires higher levels. The analyst marked $0.2887 as the first bullish trigger and $0.50 as the reversal level. A two-week close below $0.08 would invalidate the structure.
Those levels matter as the Bitcoin price crash keeps correlations elevated. Ethereum, XRP, Solana, and HYPE weakened during the weekly decline. Even assets with improving fundamentals can lose momentum when Bitcoin breaks support and liquidity retreats.
Market expectations show downside concern. Analyst Ted Pillows says Bitcoin could fall toward $50,000. His scenario requires the CLARITY Act to stall and a yen carry trade unwind to develop. Kalshi Crypto traders forecast a $50,000 Bitcoin print during 2026.
Cardano price resilience may reflect positioning inside a discounted range, not a confirmed reversal. The network has catalysts, including the Leios public testnet and Midnight ecosystem development. Traders are watching whether ADA can hold above $0.150 before challenging $0.2887. A break below $0.08 would materially weaken the setup.
The post Bitcoin Price Crash Sparks Altcoin Sell-off as Cardano Surges appeared first on Blockonomi.
CryptoPotato
The Sunday morning minor relief rally couldn’t continue for long, and bitcoin dived below $63,000 again on Monday and even dipped to $62,200 for the second time in just a few days.
The larger-cap alts have joined the ride, with ETH sliding below $1,850, and XRP heading towards a familiar support level.
BTC Dips Toward $62K
The previous business week began on a significantly more positive note, with BTC defending the $64,000 support and jumping to $65,600 on a couple of occasions. However, the second rejection was quite painful, pushing the cryptocurrency to under $62,800 just a day before the FOMC meeting.
Bitcoin’s volatility intensified in the hours before and after the event, in which the Fed ultimately maintained the rates unchanged, despite numerous calls for a hike. BTC jumped on Friday morning once again, reaching $65,400, where the bears stepped up a lot more viciously and drove it south hard.
In the following hours, the asset lost roughly three grand and dropped to $62,400. It rebounded to $63,000 on Saturday but dipped to $62,200 later that day. US President Trump’s canceled attacks against Iran and the promise of a new deal to reopen the Strait of Hormuz brought a relief rally on Sunday morning, but BTC was halted at $63,700.
The leg down on Monday was also unfavorable for the bulls, driving the cryptocurrency south to $62,200 once again. Although that level has stopped the free-fall, BTC remains over 4% down weekly. Its market cap has tumbled to $1.250 trillion, while its dominance over the alts is below 56.5% on CG.

Alts Back in Red
Ethereum was rejected at $1,980 during the July rally, and now struggles below $1,850 after another minor daily decline. XRP fights to stay above $1.05, a support level that was categorized as its ‘battlefield.’ If held, the token still has the chance for a major rebound, analysts asserted.
SOL, DOGE, RAIN, ADA, and XMR are also in the red, while HYPE and BNB have posted insignificant gains. Pi Network’s PI impressed over the weekend, posting some notable gains of 5-6% even as the market stalled. Today, though, its progress has stalled, and the asset is down over 5% to under $0.084.
MemeCore and Algorand are among the few alts in the green daily, while BEAT has plunged by 24%, followed by ONDO’s 6% crash.
The total crypto market cap has shed around $40 billion in a day and is down to $2.220 trillion on CG.

The post Pi Network (PI) Rally Fades, Bitcoin (BTC) Loses $63K: Market Watch appeared first on CryptoPotato.
Ripple has expanded its digital capital markets strategy. The company announced today investments in Zilo and Lucuido – two firms that are focused on developing infrastructure for tokenized funds and institutional asset trading.
The move builds on existing partnerships with both firms. Ripple did not disclose the size of either investment.
Speaking on the matter was Nigel Khakoo, SVP, Trading and Markets at Ripple, who said:
“… ZILO and Licuido provide core capabilities that are essential to further scaling this shift: regulated digital transfer agency infrastructure and liquidity for issuance and collateral mobility. This is just the beginning of the journey, and we see a substantial opportunity to bring huge efficiencies to the investment sector over the next decade.”
ZILO provides transfer agency and fund administration technology. Its systems give asset managers and custodians regulated digital records for tokenized share classes. Licuido, on the other hand, operates an FCA-regulated platform that supports the issuance, distribution, trading, and use of traditional assets as digital collateral.
Ripple plans to integrate these capabilities with its infrastructure on the XRP Ledger. The company wants institutions to issue tokenized assets, hold them in custody, move them between investors, and use them as collateral without relying on legacy systems.
Naturally, RLUSD will serve as the regulated cash component for delivery-versus-payment transactions. This structure is designed to allow the asset and payment sides of a trade to settle together on XRPL.
The investments also support Ripple’s recent push to build a broader institutional platform around tokenization, payments, stablecoins, and trading. Last month, the firm launched Ripple Mint and made an investment in compliance provider Notabene. This strengthens the infrastructure that’s available to institutions using RLUSD.
It’s also noteworthy that the company has worked with Aviva Investors, Franklin Templeton, and DBS on tokenized fund and collateral projects. Ripple said that ZILO and Licuido will help turn those individual partnerships into infrastructure that asset managers can use at scale.
The post Important Ripple (XRP) Announcement, New Investments: August 3 appeared first on CryptoPotato.
A suspected fourth wave of attacks targeting vulnerable Coldcard-generated Bitcoin wallets may already be underway, with blockchain researcher Alex Thorn warning on August 3 that almost 449 BTC had been swept from hundreds of addresses in about two and a half hours.
The latest activity, which was still unfolding as Thorn posted, follows three earlier waves that researchers have linked to the same weak-entropy vulnerability affecting certain Coldcard firmware versions.
New Sweeps Continue
Thorn said his latest analysis had identified 218 transactions affecting 462 suspected victim addresses between Bitcoin blocks 960778 and 969792. The transactions moved 388.93 BTC, valued at about $24.4 million at current rates, into 216 destination addresses, almost all of which had been just created and had no past transaction history.
“These are LIKELY Coldcard victims — they match the shape of coldcard vulnerable utxos and the elevated transaction pattern gives me high confidence they are another wave of attack,” he wrote.
The analyst stressed that he had no direct confirmation from victims yet, which is why he had deliberately used “likely” out of caution. He also quickly corrected the destination list, removing six addresses, which he said had already been receiving and spending BTC way before the Coldcard incident started on July 30. The six accounted for just over 5 BTC of the figure previously calculated.
Furthermore, Thorn stripped out 89 multisig addresses from his list, since none had appeared in the first three waves, taking the surviving core to 709 addresses and 448.73 ($28.1 million) across both confirmed and still-pending transactions.
He urged users to immediately move their funds off affected Coldcard devices and use higher transaction fees, and also warned that some of the pending transactions had Replace-by-Fee, or RBF, enabled, meaning that victims whose transactions were still sitting in the mempool might have a very brief chance to outbid the attacker and reclaim their funds before confirmation.
Earlier Waves Still Unspent
Galaxy Research has estimated that the first three confirmed waves drained 1,367 BTC, valued at around $85.7 million, from 4,585 Bitcoin addresses. According to the firm, those funds have not been spent and are still in attacker-controlled wallets, suggesting a coordinated operation rather than opportunistic theft.
However, not every stolen BTC has stayed put. One victim holding close to 30 BTC had 17 of them routed through ThorChain into the Duel online casino, which reportedly told the victim to file a police report before it could consider a freeze.
The attack stems from a vulnerability affecting seeds generated on certain Coldcard firmware versions released after March 2021. Coinkite, the maker of the Coldcard wallet, confirmed that seeds created on affected Mk3, Mk4, Mk5 and Q devices are exposed, and although newer patched firmware has stopped the problem for future seeds, it cannot secure old ones. It also said that it has destroyed all remaining vulnerable inventory, halted shipments, and is working with customers and law enforcement as they try to identify those responsible for the theft.
In addition, the firm advised users to immediately migrate to a new seed on an unaffected device, with Thorn pointing out that every single-signature Coldcard address generated under the vulnerable conditions will eventually get drained.
The post Coldcard Wallet Attacks Enter Fourth Wave, Putting 449 BTC at Risk appeared first on CryptoPotato.
Bitcoin, the altcoins, and the broader financial markets face another eventful week, with geopolitical developments, key US labor data, major earnings reports, and fresh economic indicators all capable of influencing investor sentiment.
The cryptocurrency market is in a fragile place once again. The weekend moves on the war front in the Middle East did little to boost BTC and the alts higher, and Trump’s reassuring words about an upcoming deal for the Strait of Hormuz are taken with a grain of salt.
Key Events in Focus
The first market reaction was expected to be a larger one, after US President Donald Trump canceled the planned military strikes against Iran over the weekend. Moreover, he claimed on a couple of occasions that there’s a Hormuz deal in the making, but Iranian officials denied it.
Admittedly, the US stock futures markets indeed rose after Trump’s promises, while oil prices plunged. The impact in the crypto space, though, was limited to a brief surge from BTC to $63,500 yesterday, only to be halted and driven below $63,000 on Monday morning.
The next big thing in focus would be the manufacturing and labor data. The July ISM Manufacturing PMI, one of the first major indicators of the US economy’s health, will be announced later today. Tuesday will see the release of the June JOLTS Job Openings report, which, aligned with Wednesday’s ADP Nonfarm Employment Change, will provide a glimpse into employment conditions ahead of Friday’s official jobs report.
Friday’s July Nonfarm Payrolls report is considered one of the Fed’s most closely watched economic releases. A stronger labor market could reduce expectations for policy easing, and vice versa.
Key Events This Week:
1. Markets React to Trump Cancelling US Strikes on Iran – Today, 6 PM ET
2. July ISM Manufacturing PMI data – Monday
3. June JOLTS Job Openings data – Tuesday
4. AMD, $AMD, and SpaceX, $SPCX, Report Earnings – Tuesday
5. July ADP Nonfarm Employment…
— The Kobeissi Letter (@KobeissiLetter) August 2, 2026
Earnings Season Is Here
Nearly 20% of S&P 500 companies are scheduled to report quarterly results this week, providing additional insight into corporate profitability and investor sentiment. Some of the most anticipated names this week are SpaceX and AMD on Tuesday, followed by SanDisk on Wednesday.
Although these companies do not have a direct connection to the crypto market (aside from SpaceX’s BTC holdings), strong earnings from major tech firms have frequently boosted appetite for higher-risk assets.
This week, described as ‘huge’ by the analysts at the Kobeissi Letter, combines geopolitical developments, labor-market data, manufacturing activity, and corporate earnings, and it comes shortly after the Fed delivered one of its most closely watched monetary policy decisions in years.
A slowing economy, paired with contained geopolitical risks, could benefit BTC and the rest of the market. However, stronger-than-expected data or another major escalation in the Middle East could push the market leader toward $60,000 again.
The post The ‘Huge’ Macro Week Is Here: Will This Data Finally Spark a Crypto Breakout? appeared first on CryptoPotato.
On-chain data shows that the Ethereum blockchain has developed a lot in the past few years, currently processing more activity than ever before.
At the same time, the underlying asset has failed to benefit, as it continues to struggle below $2,000. One analyst believes this disconnect has become one of the biggest debates surrounding the altcoin and the network behind it.
Ethereum Activity Rockets
Aside from the highly anticipated Merge upgrade deployed several years ago, the team behind Ethereum has completed several other, perhaps less hyped but similarly impactful updates over the years that have managed to scale the network. The blockchain is seemingly handling significantly more activity than it did during its proof-of-work years.
Data shared by popular analyst Tanaka claims that Ethereum’s layer-1 generated over $88 million in Real Economic Value (REV) during Q2, up 7% from the previous quarter. However, it’s still down by nearly 70% year-over-year.
Applications built on the world’s second-largest blockchain generated $1.8 billion in fees, meaning that Ethereum itself, which recently celebrated its 11th birthday, captured only around 4.9% of the economic value created by its application layer. The contrast becomes even more apparent when examining the network activity.
Ethereum rollups are currently processing around 1,270 user operations per second, compared to roughly 20.4 UOPS on the mainnet. Robinhood Chain is reportedly processing almost 5 times as many operations as Ethereum’s layer 1.
The analyst described the technical progress as impressive, but questioned how much of that growing activity ultimately benefits ETH holders. Current data shows:
– Total ETH supply: approximately 121.88M
– ETH in the Beacon Chain: approximately 41.10M
– Roughly 33.7% of the total ETH supply is securing the network
– Staking issuance yield: around 2.6%
– Recent annualized supply growth: around 0.85%
– Seven-day blob fee burn: only around 0.22 ETH
Changed Bull Case
The analyst doesn’t believe Ethereum is broken, but noted that ETH’s long-term investment thesis is undergoing a substantial change. Instead of “more users leading to more fees and more ETH burn,” the focus now is gradually shifting toward tokenized finance.
The value of Real-World Assets (RWAs) on Ethereum has recently exceeded $17 billion, while the broader stablecoin market is up to almost $300 billion. The analyst argued that Ethereum’s competitive advantage is no longer cheap transactions but its position as the leading settlement layer for institutional finance.
Going forward, they said the key questions are whether layer-2 activity will eventually make blob space economically valuable, whether stablecoins and RWAs generate meaningful on-chain turnover, and whether institutions increasingly hold the underlying asset as reserve collateral for the Ethereum ecosystem.
The analyst will continue to hold and accumulate ETH as they remain optimistic about its near- and long-term future, especially since Ethereum has already solved its scaling problem.
The post Ethereum’s Network Is Booming, So Why Is ETH Still Underperforming? appeared first on CryptoPotato.


