Cryptocurrency Posts
Crypto Briefing
Cango's significant Q2 loss and stock drop highlight the volatility and risks of pivoting to Bitcoin mining, underscoring the need for diversification.
The post Cango shares plunge over 20% after $82M Q2 loss appeared first on Crypto Briefing.
Bitcoin's decoupling from equities suggests a shift towards independent market dynamics, potentially altering investment strategies and risk assessments.
The post Bitcoin decouples from equities as correlation hits two-year low appeared first on Crypto Briefing.
Rising job openings suggest sustained labor demand, potentially influencing Federal Reserve's interest rate decisions amid inflation concerns.
The post American labor market remains sturdy as job openings rise in July appeared first on Crypto Briefing.
Prospect Markets' US entry could accelerate prediction markets' mainstream adoption, leveraging sports events to tap into a growing trillion-dollar sector.
The post Prospect Markets signs deal with OG Prediction Markets for US launch appeared first on Crypto Briefing.
Firelight's expansion into broader DeFi coverage could enhance risk management and trust in decentralized finance, attracting more institutional interest.
The post Firelight raises $8M to expand DeFi coverage beyond XRP appeared first on Crypto Briefing.
Bitcoin Magazine
Bitcoin Magazine

BlackRock Re-Underwrites Bitcoin, and the Portfolio Math Still Holds
Bitcoin’s roughly 50% decline from its October 2025 high has created a useful test for the institutional investment thesis. It is relatively easy to make the case for a new asset while prices are rising, correlations are favorable and capital is flowing into the market. The more revealing exercise comes after a major drawdown, when investors can revisit the original assumptions and determine which were structural and which were simply products of the preceding cycle.
That is effectively what BlackRock has done in its latest research, Re-Underwriting Bitcoin: Still a Portfolio Diversifier. Rather than treating the recent drawdown as evidence for or against Bitcoin in isolation, the firm returns to the question most relevant to an allocator: how has Bitcoin actually affected the risk and return characteristics of a diversified portfolio?
The results are more consequential than the headline return figures suggest. In BlackRock’s rolling 10-year analysis through May 29, 2026, a traditional 60/40 equity and fixed-income portfolio generated an annualized return of approximately 9.9% with annualized standard deviation of roughly 10.1%. Introducing a 1% Bitcoin allocation increased annualized return to approximately 10.9%, while volatility moved only modestly higher to roughly 10.3%. At a 2% allocation, annualized return reached approximately 11.8%, with standard deviation of about 10.6%.
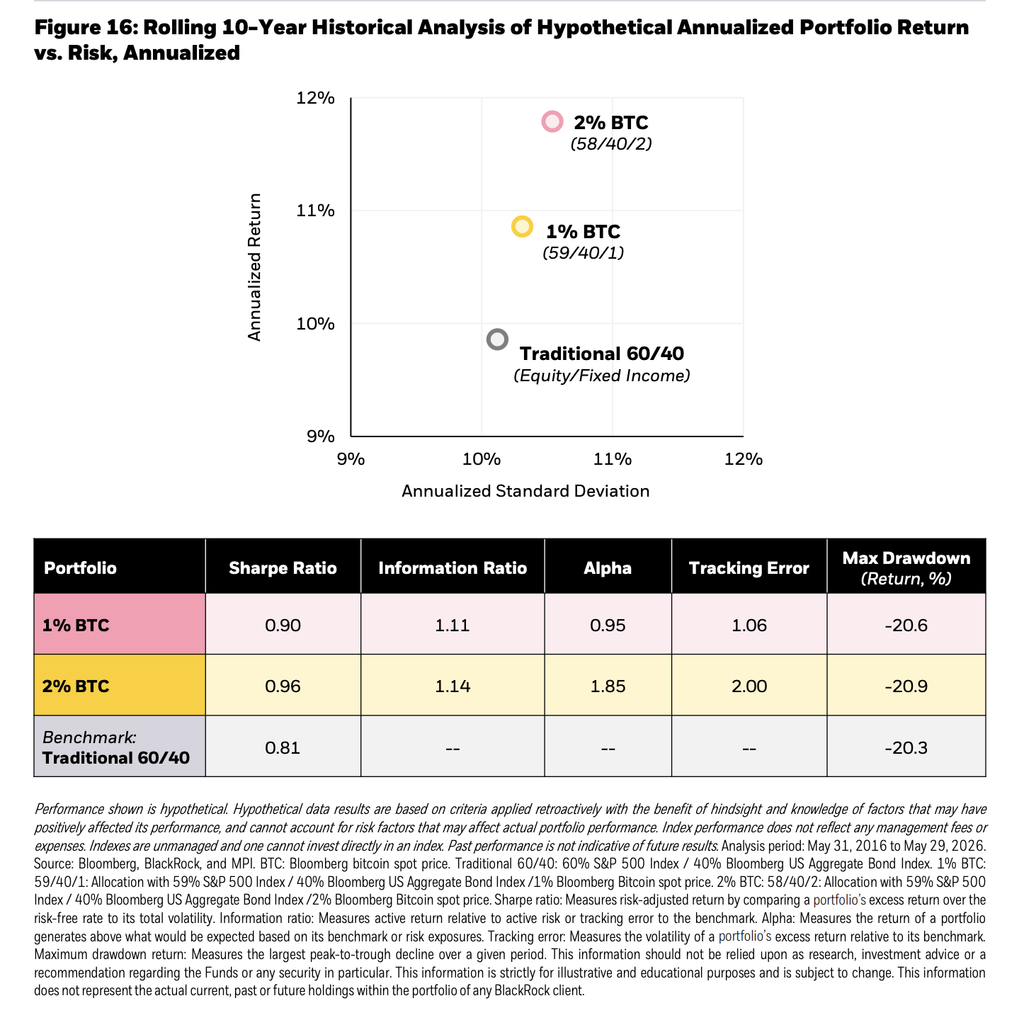
Put differently, the 2% allocation added roughly 190 basis points of annualized return relative to the traditional portfolio while increasing annualized volatility by approximately 50 basis points. The portfolio’s Sharpe ratio improved from 0.81 to 0.96, while maximum drawdown changed from -20.3% to -20.9%. Those figures are hypothetical and backward-looking, but they illustrate why judging Bitcoin primarily by its standalone volatility can produce an incomplete assessment of its portfolio impact.
The more relevant question is how that volatility interacts with everything else an investor already owns. BlackRock continues to characterize Bitcoin as having risk and return drivers that are fundamentally different from traditional assets, rooted in its fixed supply, decentralized structure and independence from any sovereign issuer. Those characteristics do not prevent Bitcoin from trading alongside risk assets during periods of deleveraging, but BlackRock’s research suggests those correlations have historically been episodic rather than permanent.
That distinction helps explain the portfolio results. A modest allocation does not import Bitcoin’s standalone volatility into a portfolio on a one-for-one basis. What matters is the marginal contribution of that allocation to total portfolio risk relative to the return it has historically generated. In BlackRock’s analysis, that trade-off remained favorable at 1% and 2%, even after incorporating one of Bitcoin’s most significant recent drawdowns.
Why 1–2% keeps appearing in BlackRock’s work
This is not the first time BlackRock has arrived at this range. Its earlier portfolio research approached Bitcoin sizing through risk contribution, concluding that a 1–2% allocation could represent a reasonable range for investors willing and able to accept Bitcoin’s risk. At those weights, BlackRock found that Bitcoin could contribute a similar share of overall portfolio risk as an individual mega-cap technology holding in a conventional 60/40 portfolio. Beyond 2%, however, Bitcoin’s contribution to total portfolio risk begins to increase disproportionately.
The new analysis approaches the same question from the opposite direction. Rather than asking how much risk Bitcoin contributes, it examines what investors historically received for assuming that additional risk. The improvement in Sharpe ratio from 0.81 for the traditional portfolio to 0.90 with 1% Bitcoin and 0.96 with 2% Bitcoin suggests that the incremental return historically more than compensated for the additional portfolio-level volatility.
This does not establish 1% or 2% as an optimal allocation, and BlackRock does not present it that way. The appropriate exposure will depend on liquidity requirements, investment horizon, governance constraints and risk tolerance. What the analysis does provide is a more rigorous framework for the discussion. The allocation question can increasingly be evaluated in terms of marginal risk, correlation, drawdown and portfolio efficiency rather than through a binary debate over whether Bitcoin itself is too volatile to own.
BlackRock has also seen the demand firsthand
There is another dimension to BlackRock’s latest analysis that is difficult to separate from the firm’s experience in the market.
BlackRock launched the iShares Bitcoin Trust, IBIT, in January 2024. Less than a year later, it had accumulated more than $50 billion in assets, making it what BlackRock itself has described as the largest exchange-traded product launch in history. It reached that milestone roughly five times faster than the previous record holder.
Its significance has only grown since then. BlackRock now describes IBIT as the world’s largest and most traded Bitcoin ETP, and the fund became the firm’s highest-revenue ETF in 2025 despite competing within a global BlackRock lineup of more than 1,000 products.
The concentration within the U.S. spot Bitcoin ETF market is equally notable. According to current ETF holdings data tracked by Bitcoin For Corporations, U.S. spot Bitcoin ETFs collectively hold approximately 1.25 million BTC, representing nearly 6% of Bitcoin’s fixed 21 million supply. IBIT alone accounts for roughly 775,000 BTC, or more than 60% of the Bitcoin held across the U.S. spot ETF complex.
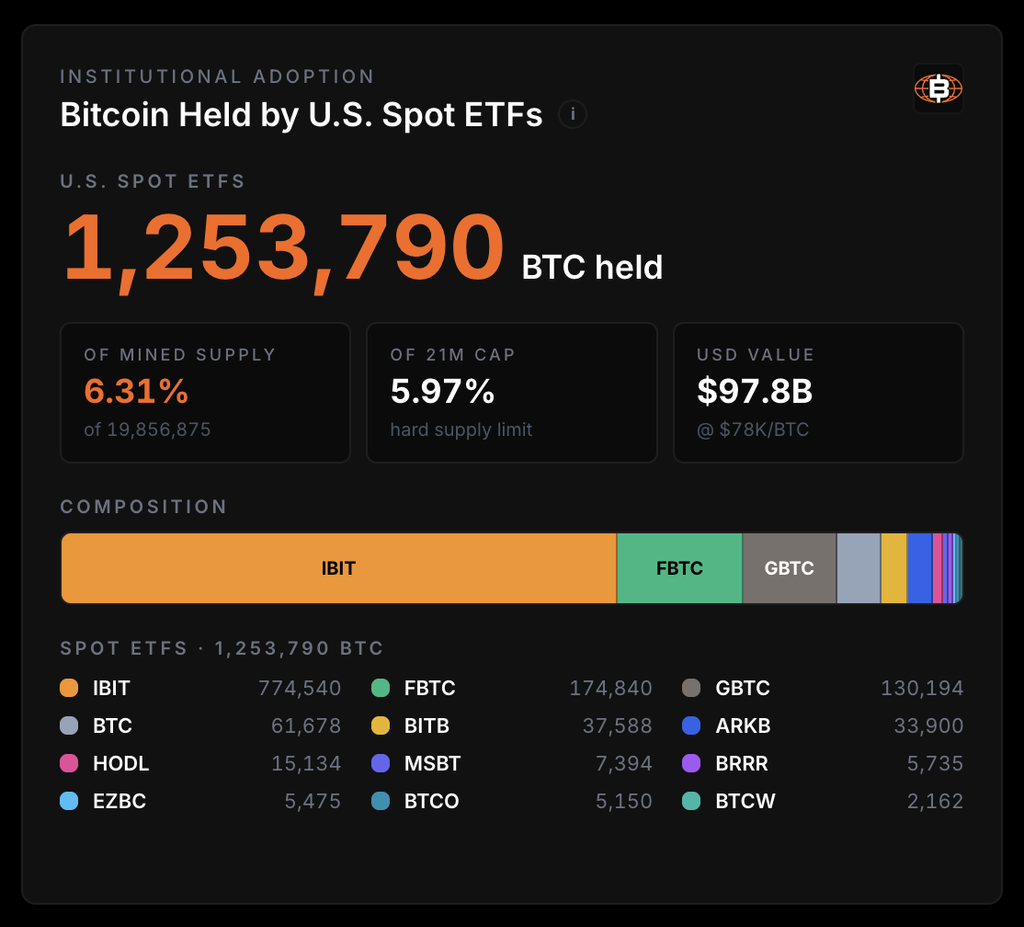
View the full Bitcoin ETF Dashboard.
That does not make BlackRock’s research independent of commercial context; IBIT is an important and increasingly valuable BlackRock product. That context should be understood rather than ignored. But it also means the firm’s reassessment is occurring alongside more than two years of observing how investors actually use Bitcoin exposure at scale.
The distinction is useful. The theoretical case for Bitcoin as a portfolio asset is increasingly being accompanied by observable allocation behavior. Investors have now had access to Bitcoin through familiar brokerage, advisory and institutional infrastructure across multiple market regimes, including periods of rapid appreciation and severe drawdowns. IBIT’s growth suggests that demand has persisted well beyond its initial launch window.
A drawdown is precisely when a thesis should be re-underwritten
The timing of BlackRock’s report may ultimately be more informative than the portfolio simulation itself.
Bitcoin is not being reassessed at an all-time high. BlackRock published the analysis after an approximately 50% drawdown from Bitcoin’s October 2025 peak, a period the firm associates with leveraged positioning being unwound, slowing ETP flows and weaker demand from companies accumulating Bitcoin. Its conclusion is that these forces represented a positioning correction rather than a fundamental change in Bitcoin’s investment case.
That is what re-underwriting is supposed to accomplish. An investment thesis should not survive because investors are attached to it; it should survive because its underlying assumptions continue to hold when conditions change.
For Bitcoin, those assumptions extend beyond historical returns. The asset remains scarce by design, globally liquid, independent of a sovereign issuer and structurally different from the liabilities that dominate traditional portfolios. BlackRock argues that concerns around fiscal sustainability, monetary stability and geopolitical risk may therefore become increasingly relevant to Bitcoin’s long-term adoption.
The portfolio evidence does not prove what Bitcoin will return over the next decade, nor does IBIT’s success establish what an appropriate allocation should be. What the two developments show together is that the institutional conversation has advanced considerably. Bitcoin is no longer being evaluated solely as an unconventional asset that institutions may or may not choose to own. It is increasingly being evaluated through the same disciplines applied elsewhere in capital allocation: sizing, risk contribution, correlation, liquidity, drawdown and expected return.
What this means for corporate leaders
For CFOs, boards and corporate operators, that evolution may be the most important takeaway from BlackRock’s work.
The relevant decision is not whether Bitcoin is volatile; that is already known. Nor does a corporate allocation need to resemble the concentrated Bitcoin strategies pursued by companies that have explicitly built their capital structures around the asset. Between zero exposure and a Bitcoin-centric balance sheet sits a much broader spectrum of possible allocations.
BlackRock’s research provides a useful framework for thinking about that spectrum. A relatively small allocation was sufficient to materially alter the historical return characteristics of a conventional portfolio without producing a comparable increase in portfolio-level risk. At 2%, approximately 190 basis points of additional annualized return came with roughly 50 basis points of additional annualized volatility in the period studied. The allocation was small; its effect was not.
For corporate leaders, the implication is less about adopting BlackRock’s specific allocation range than adopting the discipline behind the analysis. Bitcoin can be underwritten like any other strategic allocation: define its purpose, determine an acceptable risk contribution, establish liquidity and governance requirements, size the position accordingly and periodically revisit the assumptions.
That is a considerably more mature question than whether a company should simply “buy Bitcoin.”
As Bitcoin becomes more deeply integrated into institutional portfolios and financial infrastructure, the burden of analysis is shifting. The question facing the C-suite is increasingly not whether Bitcoin belongs in the conversation, but what allocation, if any, can be justified by the company’s objectives, constraints and cost of capital.
BlackRock has now re-underwritten that question after another full market cycle and a roughly 50% drawdown. Its historical portfolio math still makes the case that, in measured amounts, Bitcoin can improve the equation. For corporate decision-makers, that is the takeaway worth bringing into the boardroom.
Disclaimer: This content was prepared on behalf of Bitcoin For Corporations for informational purposes only. It reflects the author’s own analysis and opinion and should not be relied upon as investment advice. Nothing in this article constitutes an offer, invitation, or solicitation to purchase, sell, or subscribe for any security or financial product.
This post BlackRock Re-Underwrites Bitcoin, and the Portfolio Math Still Holds first appeared on Bitcoin Magazine and is written by Nick Ward.
Bitcoin Magazine

Strategy Opposes MSCI Proposal, Says Bitcoin Treasury Firms Are Being Targeted a Second Time
Bitcoin treasury Strategy has blasted Morgan Stanley Capital International’s proposal to exclude it from its Global Investable Market Indexes, calling it “misguided” and “flawed.”
Writing in a letter to MSCI Monday, the Nasdaq-listed Bitcoin behemoth’s founder, Michael Saylor, and CEO, Phong Le, said that the company was discriminating against digital asset businesses.
MSCI said earlier this month that it was consulting on a plan to define “non-operating companies” and make them ineligible for its Global Investable Market Indexes. The removal of such companies would exclude firms like Strategy from indexes visible to a large pool of institutional investors.
MSCI’s latest proposal comes after the company in 2025 proposed excluding from its indices all companies whose digital-asset holdings represent 50% or more of total assets.
“MSCI’s continued effort to discriminate against digital assets is misguided and calls into question MSCI’s neutrality and reliability,” Strategy’s letter read.
It added: “The proposal, like the 2025 proposal that MSCI withdrew, is discriminatory, arbitrary, and misguided. If adopted, the proposal would have no meaningful impact on Strategy’s business, but it would profoundly harm MSCI’s reputation as a reliable and neutral index provider. Like the 2025 proposal, the current proposal should be withdrawn.”
Strategy argued that MSCI was relying on unprecedented classifications to define Bitcoin as a “non-operating” asset. Strategy said it reports its Bitcoin business as an operating segment and its Bitcoin gains and losses as operating expenses.
The company said that MSCI’s methodology for targeting “non-operating companies” was “arbitrary and unexplained,” and was just a way of unfairly targeting digital asset treasuries.
Strategy further argued that the company is an operating one, employing 1,500 people across the globe and actively using its Bitcoin to “create shareholder value.”
Strategy — formerly MicroStrategy — is an enterprise software company that pivoted to buying and holding bitcoin in 2020. It first bought the cryptocurrency to protect shareholders but has since aggressively bought the asset and is now the largest corporate holder of the cryptocurrency, with 845,050 bitcoins worth $65.8 billion at today’s prices.
Investors can buy Strategy’s Nasdaq-listed stock (MSTR) to get heightened exposure to bitcoin’s performance.
MSTR closed Monday trading 4% higher. Year-to-date, the stock is down 15%.
This post Strategy Opposes MSCI Proposal, Says Bitcoin Treasury Firms Are Being Targeted a Second Time first appeared on Bitcoin Magazine and is written by Mathew Di Salvo.
Bitcoin Magazine
Bitcoin Unfazed by Trump’s Iran Threats
Bitcoin on Monday shrugged off tensions in the Middle East, barely moving despite U.S. President Donald Trump vowing to hit Iran hard.
The price of the biggest cryptocurrency recently stood at $79,076, unmoved over a 24-hour period. The coin also hasn’t budged from where it stood seven days ago.
Geopolitical strife has this year hurt Bitcoin’s price, with the cryptocurrency typically facing downward pressure on news of war and rallied in hopes of a ceasefire.
When the U.S. and Israel first attacked Iran in February, the coin nosedived, and had been shaky on news of war in March and April.
But in recent months, Bitcoin’s volatility has been muted, according to analysts, and Monday was no different: President Trump promised to hit Iran again but the asset didn’t flinch.
“We’re going to hit them hard,” President Trump was quoted telling a Fox News reporter on Monday. The U.S. and Iran started strikes again on Sunday — the first in over one month.
Bitcoin started a phenomenal run two weeks ago — its best in three years — and is up nearly 30% over the past month.
Its price started surging after the U.S. Treasury would at least double the size of its liquidity-support buyback operations. The announcement hurt the dollar but non-yielding assets like bitcoin and gold have benefited.
Positive regulatory news has also helped bitcoin this month: President Donald Trump last week said that the long-awaited crypto Clarity Act was a “very, very powerful” piece of legislation, and urged lawmakers to get it over the line.
The Clarity Act aims to establish a framework for distinguishing between digital assets that are securities, commodities or payment stablecoins — legislation that the crypto industry has long called for.
JUST IN: Crypto ETFs attracted $3.2 billion in inflows last week, "their largest weekly intake since October 2025", The Kobeissi Letter reports.
— Bitcoin Magazine (@BitcoinMagazine) August 31, 2026
BlackRock's IBIT led with $928 million last week, adding to their $1.3 billion from the prior week, and marking the biggest 2-week… pic.twitter.com/ROC9tYPMGN

Investors have piled back into exchange-traded funds this month, too, which has also helped bitcoin’s price. From August 17 to 27, investors threw over $2.8 billion at the vehicles — the most since October.
Bitcoin reached as high as $81,281 last week before sliding again on Friday.
This post Bitcoin Unfazed by Trump’s Iran Threats first appeared on Bitcoin Magazine and is written by Mathew Di Salvo.
Bitcoin Magazine

Strive Becomes Fifth-Largest Bitcoin Treasury, Stock Jumps on Latest Buy
Strive’s stock soared on Monday after the company announced a $143 million bitcoin buy, making it the fifth biggest publicly traded crypto treasury.
The Nasdaq-listed company announced its latest buy of 1,800 bitcoins between August 24 and August 28. It snapped up the coins for an average price of $79,431, according to a filing with the Securities and Exchange Commission.
The Dallas, Texas-based company now holds 23,156 coins worth $1.8 billion at today’s prices. Its stock (NASDAQ: ASST) was trading 9% higher at about 12.30pm in New York. Year-to-date, Strive’s stock has risen by nearly 40%.
JUST IN:
— Bitcoin Magazine (@BitcoinMagazine) August 31, 2026Public company Strive bought 1,800 BTC for $143 million
pic.twitter.com/xEkWx3ZNZp
Strive’s year-to-date Bitcoin yield, a metric that compares growth in bitcoin holdings relative to share count, reached 40.8% as of its Aug. 28 filing, up from less than 37% in early June.
Strive now is the fifth biggest bitcoin treasury, behind only Strategy, Twenty One, Metaplanet, and MARA.
Founded by former Ohio gubernatorial candidate Vivek Ramaswamy in 2025, after raising $750 million to buy Bitcoin, Strive debuted as an official bitcoin treasury.
In January 2026, it completed the acquisition of Semler Scientific in an all-stock deal — the first instance of a publicly traded Bitcoin treasury company acquiring another such company.
The idea is that investors can get amplified returns from Strive’s stock. The company buys bitcoin with equity, and maintains a debt-free balance sheet: no bonds, no credit lines, and no leveraged positions that could trigger forced liquidation in a downturn.
Strive CEO Matt Cole has described the company as debt-free with zero margin requirements and zero encumbered bitcoin.
Strive’s latest purchase comes as Strategy, the biggest corporate holder of bitcoin, restarted its buying last week.
The software company had paused buying bitcoin for 10 weeks but announced it had bought 4,603 bitcoins for $369.7 million between August 24 to August 30.
This post Strive Becomes Fifth-Largest Bitcoin Treasury, Stock Jumps on Latest Buy first appeared on Bitcoin Magazine and is written by Mathew Di Salvo.
Bitcoin Magazine
Russia’s Sberbank Estimates $46.4B Trading Volume in First Year of Crypto Buildout
Russia’s largest bank, Sberbank, has said it expects trading volume with its new crypto rollout to hit 4 trillion rubles ($46.43 bln) in the first year, according to reports.
Volumes are also expected to hit 7.5 trillion rubles ($87.06 bln) by 2029, Sberbank Deputy Chairman of the Executive Board Anatoly Popov was quoted saying, as reported by Tass on Saturday.
The forecast was deemed “conservative” according to the news report. Sberbank in July revealed plans to debut a Bitcoin and crypto wallet as well as digital asset custody by December. The Bank of Russia in July published draft regulations for crypto trading, and the State Duma is preparing the comprehensive regulation of digital assets.
And in a Friday report, Tass quoted Sberbank Deputy Chairman Anatoly Popov saying that the bank was planning to accept Bitcoin — and other cryptocurrencies — as collateral for loans.
Russia is fast moving ahead with regulating digital assets in the country. Russian President Vladimir Putin this month signed a law to set in stone the regulation of digital currencies and digital rights in the country.
The new law reportedly allows only registered entities to operate as exchanges, and puts limits on the amount of crypto retail investors can use.
Still, despite the rollout, using digital assets as a means of payment or legal tender within Russia is still banned. Using crypto as a form of payment has been prohibited in Russia since 2022.
President Putin has appeared to praise Bitcoin in the past, once saying that the leading cryptocurrency can’t be stopped.
Since the U.S. and European governments cut Russia off from the SWIFT payments system after it invaded Ukraine in 2022, Russian companies have been using Bitcoin to skirt around the penalties.
But the Russian state keeps a tight grip on what its citizens can do with crypto: authorities have been cracking down and arresting people operating unregistered crypto exchanges.
And the amounts involved barely matter — a nuclear engineer in Sarov was sentenced to 18 years for sending about $13 from his crypto wallet to groups the state designates as terrorist organizations.
This post Russia’s Sberbank Estimates $46.4B Trading Volume in First Year of Crypto Buildout first appeared on Bitcoin Magazine and is written by Mathew Di Salvo.
CryptoSlate
Switchboard, an oracle provider that supplies price data to DeFi applications, said contributors halted its deployments on Aptos, Sui, IOTA and Movement after reports of a potential Switchboard Move oracle compromise in its Move-language implementations.
At least three applications reported losses, freezes or precautionary access restrictions as Switchboard advised users to migrate temporarily to alternatives. The provider said it had not received similar reports about its Solana implementation, but it has not published a root cause or a timetable for restoring the four Move deployments.
Switchboard Move oracle compromise hits DeFi apps
Sui-based exchange Full Sail confirmed that its vaults lost funds and said deposits and withdrawals would remain paused until oracle integrity was restored and verified. Its disclosure did not identify the affected vaults or assets, provide transaction records, or quantify the loss.
Full Sail's vault documentation says users delegate liquidity management to an automated system that rebalances concentrated positions using real-time market data. Separate oracle-protection documentation describes checks that compare Switchboard prices with on-chain pool prices, test updates against 50 to 70 recent observations, and can block prices or pause emissions. Full Sail has not explained whether those controls fired, applied to the affected vaults, or were related to the reported losses.
On Aug. 31, DefiLlama placed Full Sail at roughly $229,000 in total value locked. Its rolling DEX volume was about $50 over 24 hours, $2.99 million over seven days and $9.10 million over 30 days. Those windows include pre-incident activity and do not establish how much value changed because of the event.
Virtue details IOTA price manipulation
The most detailed account came from IOTA credit protocol Virtue. It said an attacker gained control of the signing keys used by all 14 oracles on Switchboard's IOTA mainnet queue and pushed IOTA's reported price to $10 million. The attacker then deposited 1 IOTA and minted about 4.94 million VUSD, according to Virtue.
Virtue said the feed was later pushed near zero, triggering 47 liquidations that affected 45 users. It froze borrowing, repayment, deposits, withdrawals, liquidations and flash loans, and warned that VUSD was materially undercollateralized while remediation was pending. Those figures relate to Virtue, not Full Sail's undisclosed loss.
Volo pauses access as networks stay online
On Sui, Volo said it paused vault deposits and withdrawals as a precaution because of a Switchboard dependency. Volo said its vaults were unaffected and user funds were safe.
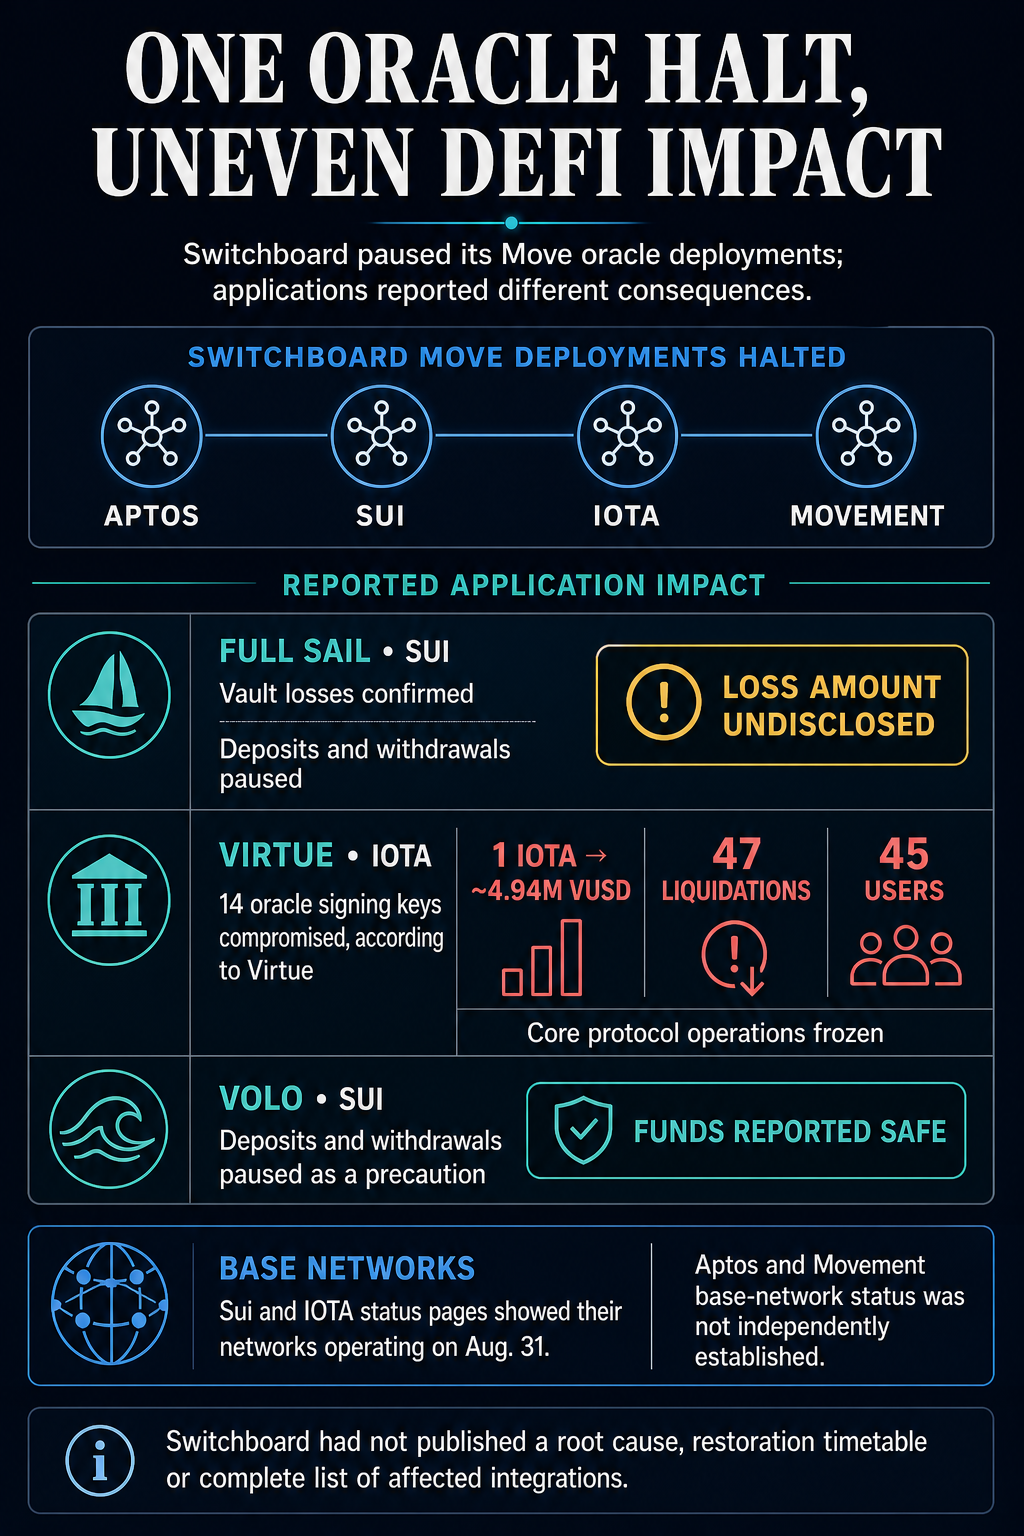
Sui's status page showed all systems operational on Aug. 31, while IOTA's page showed mainnet services operating with listed incidents resolved. Equivalent status evidence was not established for Aptos or Movement.
The verified impact is uneven but material: a confirmed yet unquantified Full Sail loss, a detailed manipulation and protocol freeze at Virtue, and a preventive access pause at Volo. Switchboard has not published a complete list of affected integrations, leaving the full application footprint of the suspected Switchboard Move oracle compromise unresolved.
The post Cross-chain oracle compromise triggers liquidations and frozen vaults across multiple DeFi networks appeared first on CryptoSlate.
Britain is widening its Russia sanctions crackdown from named entities to the payment routes that keep sanctioned networks moving money.
On Aug. 31, the National Crime Agency issued its first nationwide industry alert on the A7 network, directing banks, payment providers and crypto firms to examine counterparties, intermediary wallets and cross-border infrastructure linked to Russia-related transactions.
Rachael Herbert, Director of the National Economic Crime Centre (NECC) at the National Crime Agency, said:
“The National Crime Agency and the National Economic Crime Centre are committed to targeting the nexus between organized crime and sanctions evasion. Last year, our Operation Destabilize targeted and disrupted a major Russian-speaking professional money laundering network, making it harder for them to operate and degrading the threat they posed.”
The move comes alongside a government plan to double the maximum civil penalty available to the Office of Financial Sanctions Implementation for breaches involving measurable funds or economic resources. The proposed ceiling would rise to the greater of £2 million or 100% of the breach value, from £1 million or 50% today.
A7 operates a cross-border settlement network that UK authorities say has used financial institutions in third countries, SWIFT and other international payment infrastructure to help Russian clients move funds around sanctions.
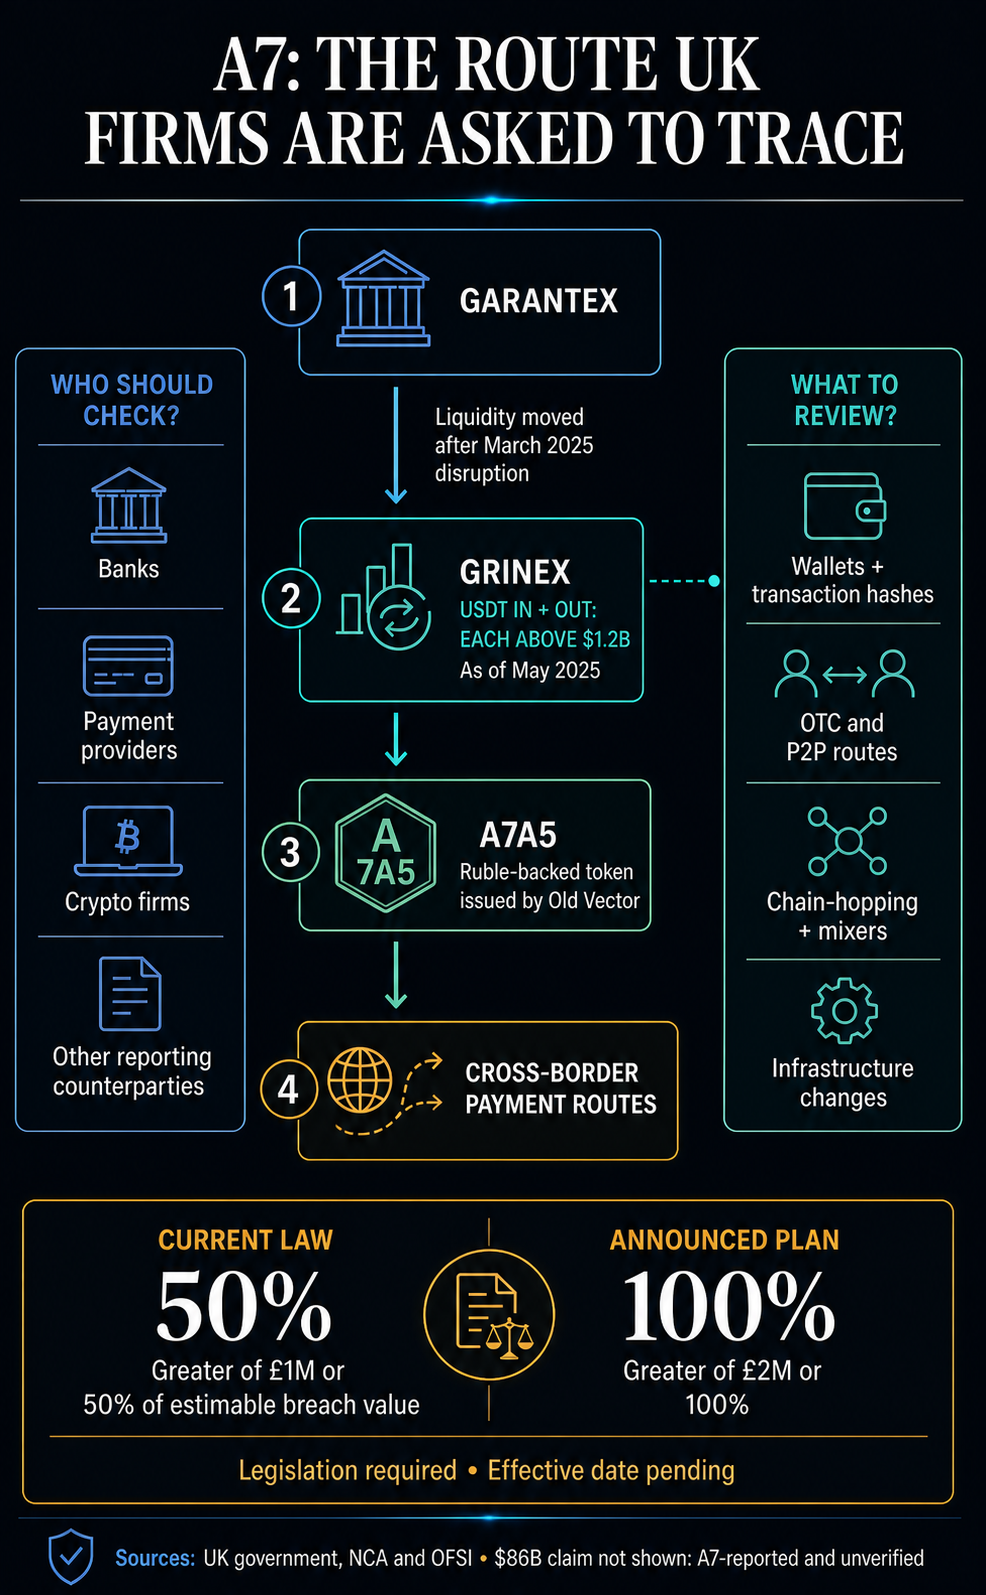
The network says it processed more than $86 billion in its first year, though that figure is self-reported and does not represent a verified measure of illicit flows.
The alert pushes compliance teams beyond conventional name screening. Authorities highlighted intermediary wallets, transaction hashes, decentralized exchanges, mixers, over-the-counter and peer-to-peer routes, services without know-your-customer controls, chain-hopping, VPN use and repeated infrastructure changes as signals that may warrant further scrutiny.
That approach reflects how sanctioned crypto infrastructure has evolved under pressure.
UK authorities previously assessed that crypto liquidity moved from Garantex to Kyrgyzstan-registered Grinex through A7A5, a ruble-backed token, after Garantex faced enforcement action. By May 2025, Grinex had recorded more than $1.2 billion each in incoming and outgoing USDT transaction volume.
The US Treasury separately said Garantex employees helped create Grinex infrastructure and that users regained account access or received equivalent value through A7A5.
For UK firms, the implication is that sanctions exposure may persist even after a crypto exchange, wallet or payment service changes names, jurisdictions or rails.
The tougher penalty proposal reinforces that shift. If enacted, firms could face fines equal to the full value of an estimable breach rather than half.
The change still requires legislation and has no effective date. OFSI would also retain discretion to impose penalties below the statutory maximum.
For now, the Aug. 31 alert marks a broader enforcement turn: Britain is asking financial and crypto firms to follow the route of Russia-linked money, not merely check whether the destination already appears on a sanctions list.
The post UK is hunting the $86 billion Russia-linked crypto pipeline as it moves to double sanctions fines appeared first on CryptoSlate.
Russia’s new crypto law took effect Sept. 1, but investors cannot yet access the full market it promises.
Federal Law No. 282-FZ gives cryptocurrency a formal place within Russia’s supervised financial system, allowing regulated investment and cross-border use through brokers, exchanges, management companies, digital depositories and organized trading venues.
However, the catch is that many of those channels are not ready.
The Bank of Russia is still completing rules that will determine which cryptocurrencies ordinary investors can buy, how trading venues calculate prices, and what capital requirements digital depositories must meet. Firms also have until July 1, 2027, to obtain licenses and bring their operations into compliance.
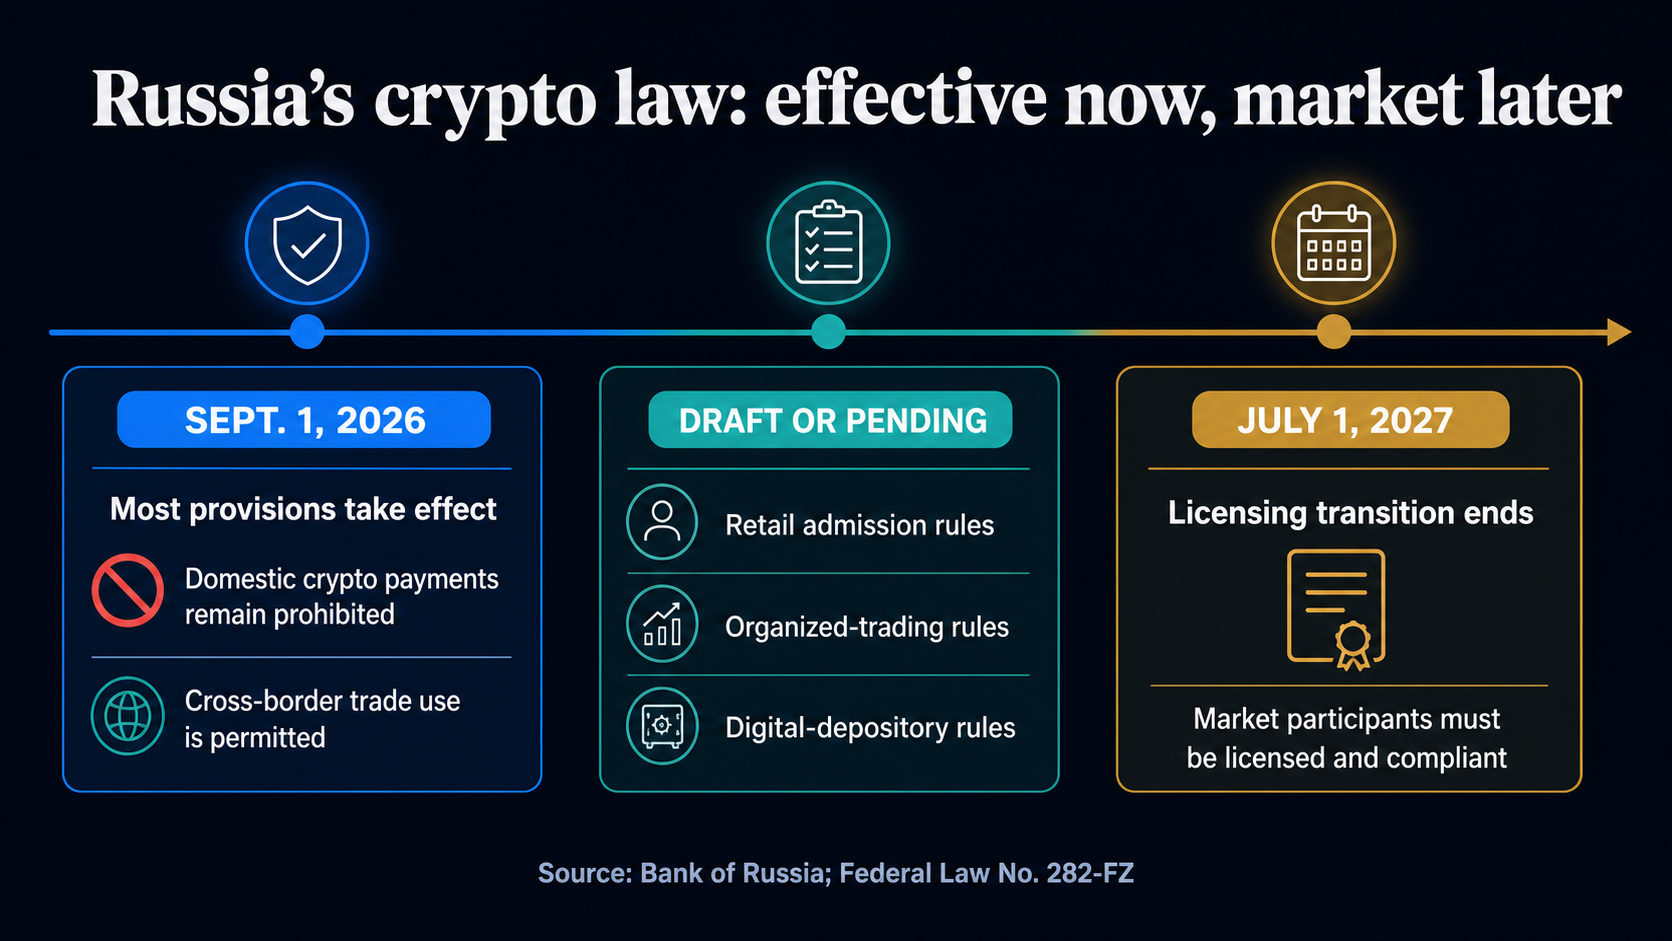
That leaves Russia in an unusual transition: crypto now has a legal framework, but the infrastructure needed to use it broadly is not yet in place.
Meanwhile, the new law does not open the door to everyday crypto payments. Instead, Bitcoin, stablecoins and other cryptocurrencies remain prohibited for purchases of goods and services inside Russia.
Their permitted role is narrower. Exporters and importers can use crypto for cross-border settlements, while investors will eventually gain access through supervised intermediaries. The Bank of Russia has said the regime also covers foreign stablecoins.
Moreover, retail investors face tighter restrictions once access expands.
Non-qualified investors must pass a test and can purchase no more than ₽300,000 of eligible cryptocurrency per year through each intermediary. Qualified investors must also complete testing but face no equivalent monetary cap.
What qualifies for retail purchase is also still being decided.
The central bank has proposed allowing Bitcoin, Ethereum and Tether’s USDT, but that list remains part of a draft ordinance. Separate proposals governing organized-trading prices and digital-depository capital requirements were also unfinished heading into Sept. 1.
Two additional Bank of Russia measures dated Aug. 27 were still undergoing Ministry of Justice registration in the regulator’s latest published status.
The staggered rollout extends beyond licensing. Some provisions of the law do not take effect until July and September 2027, reinforcing that Sept. 1 marks the legal starting point rather than a single opening day for Russia’s crypto market.
The immediate change is therefore certainty over the structure Russia intends to build. The next stage depends on the central bank turning that framework into operating rules and enough firms securing licenses to give investors somewhere to trade.
Until then, Russia has formally opened the door to a regulated crypto market without yet completing the market behind it.
The post Russia just switched on a crypto market that doesn’t fully exist yet appeared first on CryptoSlate.
Crypto added roughly $500 billion in market value in a matter of days as Bitcoin ran from about $63,500 toward $80,000 last week.
A liquidation squeeze powered much of the first phase, and regulated investment products then supplied fresh capital once forced buying began to fade.
Tom Lee told Milk Road that the crypto liquidation event showed how far “offsides” traders had become. He called the move a “course correction” that could open a much larger advance.
Glassnode said Aug. 19 produced the largest short-liquidation day in its feed since 2019, and exchanges automatically closed short positions as prices moved against traders, turning bearish bets into mandatory buying during an already violent rally.
CoinShares recorded over $2.9 billion of global crypto investment-product inflows in the week to Aug. 20, the largest weekly total of 2026. The first three trading days of the next week added another $1.65 billion.
| Rally phase | Main participant | What happened | Why it matters |
|---|---|---|---|
| Stage 1 | Macro buyers | Treasury buybacks, a weaker dollar, and liquidity support helped trigger the breakout | Created the initial conditions for risk assets to rally |
| Stage 2 | Short sellers | Shorts were liquidated as BTC moved from ~$63.5K toward ~$80K | Forced buying accelerated the move |
| Stage 3 | Regulated funds | Global crypto products took in $2.94B, then another $1.65B | Follow-through continued after the squeeze |
| Stage 4 | Institutional allocators | CoinShares survey showed allocations rising to 1.2% | Suggests some reallocation began before the rally |
The crypto rally passed from shorts to funds
CoinShares recorded $976 million of Bitcoin inflows on Aug. 27. Ethereum took in $478 million, XRP added $80.5 million, Solana drew $62.9 million, and Hyperliquid products added $39 million.
Capital entered regulated ETFs across several crypto assets even once the liquidation cascade had already done its work.
QCP’s derivatives data shows Bitcoin climbed from roughly $63,500 to around $80,000 as BTC-denominated futures open interest fell from about 646,000 BTC to 588,000 BTC. That equals a decline of roughly 58,000 BTC, or about 9%.
Funding stayed contained through the move, and a classic leveraged-long chase usually sends price, open interest, and funding higher together.
Falling open interest only establishes what happened to aggregate futures positioning. The data still shows that traders did not immediately rebuild leverage on the long side at the same pace that prices rose.
CoinShares’ August fund-manager survey found that crypto allocations among respondents rose to 1.2% of portfolios, the first increase since the October 2025 selloff. The firm said institutions drove the entire increase.
The survey covered investors overseeing about $1.16 trillion, and more respondents also cited “good value” as a reason for owning crypto during the preceding decline.
Institutions had started adding exposure before Bitcoin printed its biggest green candles, and the breakout then coincided with a much larger wave of product inflows. The short squeeze accelerated a reallocation in crypto that had already begun.
| Asset | Three-session inflow | Share of listed inflows |
|---|---|---|
| Bitcoin | $976M | ~60% |
| Ethereum | $478M | ~29% |
| XRP | $80.5M | ~5% |
| Solana | $62.9M | ~4% |
| Hyperliquid | $39M | ~2% |
| Total shown | $1.636B | ~100% |
The bull case needs the handoff to hold
The bull case rests on the idea that the crypto liquidation event cleared bearish leverage without replacing it with an equally unstable long-side position.
Glassnode places Bitcoin’s first major overhead zone around $83,000 to $86,000. A move through that area would show fresh demand absorbing supply from holders using the rally to exit. Continued weekly crypto product inflows near or above $1 billion would add another layer of support.
A gradual recovery in open interest would give the market more room, and contained funding would keep borrowing costs from showing the kind of speculative excess that often precedes another liquidation cascade.
Under that path, Lee’s “course correction” framing gains support: short sellers supplied the ignition, and institutional capital supplied the persistence.
The macro environment has already made that thesis harder to prove.
QCP linked part of the original breakout to Treasury’s decision to expand long-end liquidity-support buybacks.
Fed Chair Kevin Warsh’s Jackson Hole remarks then pushed Fed-funds futures toward a much more hawkish September outcome. Reports noted that markets lifted the implied probability of a September rate hike from roughly 35% to 64%.
Renewed US-Iran fighting added another source of stress on Aug. 31. Brent crude moved above $90, Treasury yields climbed, and US equities fell.
The buyers who inherited the rally now face a macro setup far less friendly than the one that helped Bitcoin break out.
The bear case begins below $70,000
Glassnode called the market in its Aug. 31 Market Pulse “in transition,” pairing strong institutional allocation with rebuilding leverage. The report also found softer crypto retail participation and early short-term distribution.
Bitcoin’s short-term-holder cost basis sits near $70,000. A break below that level would put recent buyers underwater and test whether regulated fund demand can continue absorbing supply during a broader risk-off move.
The outlook deteriorates further if futures leverage rebuilds as prices fall. Higher open interest and firmer funding during a decline would leave more long-side exposure vulnerable to liquidation just as macro conditions tighten.
Crypto fund flows would then provide the clearest measure of how durable the handoff became. A sharp slowdown would signal weaker institutional appetite, while broad redemptions would show that regulated-product buyers could no longer absorb selling driven by higher yields, hawkish Fed expectations, and geopolitical risk.
The next test arrives with the US jobs report on Sept. 4, with expectations around 55,000 to 58,000 new jobs, depending on the survey referenced.
Another weak employment print could make a September hike harder to justify, and a stronger number could reinforce the hawkish repricing that followed Warsh’s speech, affecting risk assets like crypto.
| Scenario | BTC / macro trigger | What to watch | Meaning for the rally |
|---|---|---|---|
| Bull case | BTC clears $83K–$86K | Product inflows remain near or above $1B weekly; funding stays contained | The handoff from shorts to institutions holds |
| Base case | BTC holds above ~$70K | OI rebuilds slowly; inflows cool but remain positive | Rally digests without confirming a full breakout |
| Bear case | BTC loses ~$70K | Recent buyers go underwater; fund inflows stall | Institutional demand faces its first real stress test |
| Breakdown case | Higher yields, $90 oil, hawkish Fed pressure | OI rises into weakness; redemptions broaden | The move looks more like a liquidation rally with a long tail |
Short sellers explain why crypto moved so quickly from the mid-$60,000s toward $80,000, and regulated fund capital explains more of what came next.
Those buyers now carry the rally into its harder phase. Their ability to keep absorbing supply through $90 oil, higher yields, and a more hawkish Fed will decide whether the $500 billion surge becomes a genuine market reset or a liquidation rally with a longer tail.
The post How short liquidations cleared $500B in crypto positions before institutional buyers took over appeared first on CryptoSlate.
Five major US spot XRP products held XRP with a combined fair value $746.1 million below accounting cost at the end of June, but investors kept buying anyway.
According to SEC filings, Bitwise, Canary Capital, Franklin Templeton, 21Shares, and Grayscale recorded roughly $629.9 million in primary-market share creations against $309.1 million in redemptions during the first half of the year.
That left capital activity positive by about $320.8 million even as the funds' combined XRP holdings sat 44.1% below their $1.7 billion accounting cost.
The gap quantifies what Bloomberg ETF analyst James Seyffart called “surprisingly resilient” XRP ETF demand in an Aug. 31 post, where he put cumulative net inflows across the asset class at $1.8 billion.
| Five-fund XRP ETF snapshot | Amount |
|---|---|
| XRP accounting cost at June 30 | $1.693B |
| XRP fair value at June 30 | $947.3M |
| Gap vs accounting cost | -$746.1M |
| Percent below cost | -44.1% |
| H1 share creations | $629.9M |
| H1 redemptions | $309.1M |
| Net capital activity | +$320.8M |
Why anyone would buy into a position already underwater
Fair value across the sample of five funds totaled $947.3 million as of June 30, versus the nearly $1.7 billion those funds had originally paid.
That decline alone would normally signal selling, since a fund holding an asset at less than half its recorded value gives shareholders every incentive to redeem and reallocate elsewhere.
New creations kept arriving faster than shares left, pushing the aggregate net figure positive despite the size of the paper decline sitting inside the funds themselves.
Bitwise, Canary and Franklin recorded $537.9 million in first-half creations against just $53.3 million in redemptions, a net inflow of roughly $484.5 million. Only about $9.90 left those three funds for every $100 that came in, and it happened while their combined XRP holdings traded 42.9% below accounting cost.
Grayscale and 21Shares recorded $92.1 million in creations against $255.8 million in redemptions, a net outflow of $163.7 million that accounted for roughly 83% of all redemptions across the five-fund sample.
Grayscale alone saw $180.8 million redeemed against just $66.6 million created, while 21Shares recorded $75 million of redemptions against $25.5 million of creations.
The aggregate $320.8 million figure reads as resilient because inflows at three funds overwhelmed outflows at the other two. Even large redemptions at Grayscale and 21Shares were offset by unusually sticky creation activity at Bitwise, Canary and Franklin.
| Fund | XRP below cost | H1 creations | H1 redemptions | H1 net activity |
|---|---|---|---|---|
| Bitwise | -$180.8M | $268.2M | $33.8M | +$234.4M |
| Canary | -$229.2M | $88.3M | $5.9M | +$82.4M |
| Franklin | -$174.5M | $181.4M | $13.6M | +$167.8M |
| 21Shares | -$113.5M | $25.5M | $75.0M | -$49.5M |
| Grayscale | -$48.0M | $66.6M | $180.8M | -$114.2M |
What the numbers establish
Enough fresh capital arrived at a handful of funds to absorb real selling elsewhere in the same product category. Some of that apparent resilience may also reflect rotation, with investors exiting higher-fee or legacy products while entering funds they consider better structured.
That is a different pattern than every cohort of XRP ETF shareholders independently believing in the trade.
The $746.1 million figure measures the gap between the funds' recorded XRP cost and its June 30 fair value, a fund-level accounting figure. That sits apart from the personal cost basis of individual shareholders, who bought and sold at many different prices across the period.
Creations and redemptions likewise happen between the funds and authorized participants in the primary market, a mechanism distinct from retail investors directly depositing or withdrawing cash.
REX-Osprey's XRPR sits outside this analysis entirely, since its 1940 Act structure and ability to gain XRP exposure through other funds make its balance sheet a poor match for the five grantor-trust products compared here.
Cumulative XRP ETF inflows reached nearly $1.6 billion by Aug. 24 and $1.64 billion by Aug. 29, before Seyffart's $1.8 billion figure at month's end. That trajectory shows June 30 captured a moment in a longer pattern, well short of its end.
BTC trades near $78,000, and spot Bitcoin ETFs pulled in roughly $2.5 billion over seven trading days in late August before a rare single-day outflow. Bitcoin's inflows are returning as price sits near a level investors already recognize.
XRP's flows kept building through a far deeper drawdown, with the funds' own holdings still trading well below what they paid.
How far XRP has to recover before the accounting pain disappears
The five funds held roughly 906.8 million XRP at June 30, implying a rough cost-basis breakeven near $1.87 per token. XRP currently trades around $1.38, meaning the sample would remain underwater if marked at today's price.
| XRP price scenario | Implied value of 906.8M XRP | Gap vs $1.693B cost | What it means |
|---|---|---|---|
| $0.75 bear case | ~$680M | ~60% below cost | Redemptions may spread beyond Grayscale and 21Shares |
| $0.90 bear case | ~$816M | ~52% below cost | ETF resilience faces a deeper stress test |
| $1.38 current price | ~$1.25B | ~26% below cost | Funds remain underwater, but less severely than June 30 |
| $1.50 recovery case | ~$1.36B | ~20% below cost | Accounting pain narrows but does not disappear |
| $1.87 breakeven | ~$1.70B | Roughly flat | Five-fund cost basis is largely recovered |
| $1.90 bull case | ~$1.72B | Slightly above cost | Resilience narrative turns into vindication |
The bull case has XRP climbing back toward the $1.50 to $1.90 range, which would erase most of the accounting gap without requiring a fresh cycle high.
Under that path, the funds currently sitting deepest underwater see their fair value close in on cost. The resilience story shifts from a stress test into simple vindication for the investors who kept buying through the drawdown.
The bear case has XRP sliding toward $0.75 to $0.90, pushing the five-fund sample 52% to 60% below cost. In that scenario, the real test shifts to whether the redemption pattern already visible at Grayscale and 21Shares starts showing up across the rest of the complex.
Regulated XRP demand behaved this year like conviction buying into a known loss. Whether that conviction was broadly shared or concentrated in a few funds now depends on where XRP trades next.
The post XRP investors poured $320M into ETFs while the funds sat on a $746M paper loss appeared first on CryptoSlate.
CryptoTicker.io
If you hold Wrapped TON on Ethereum or on BNB Smart Chain, you are facing a closed door today. The old TON bridge at bridge-v3.ton.org is being shut down permanently as of September 1, 2026. The wrapped token does not disappear from your wallet as a result, but the route by which it can be turned back into real Toncoin is no longer being operated.
How much is affected had not been published anywhere. So we counted on the morning of the deadline: at 06:56 UTC, Ethereum and BNB Smart Chain together held 11,344,908.81 Wrapped TON in wrapped form. Two weeks of reminders, waived fees and a fixed date have changed that figure barely at all.
TON Bridge and Wrapped TON: What Ends on September 1, 2026
The announcement dates from May 23, 2026. The operator of the TON bridge said it would permanently retire version 3 of the bridge at bridge-v3.ton.org, and named September 1, 2026 for it. Two directions are affected: Wrapped TON on Ethereum and on BNB Smart Chain is meant to go back to the TON network, and the so-called j-tokens on TON, meaning jUSDT, jUSDC, jDAI and jWBTC, are meant to go back to Ethereum. For the transition period the pro-rata bridge fees were waived, so that the return trip would not fail on price.
This is neither a failure nor an attack. A bridge is infrastructure, and infrastructure gets replaced. That does not make the process any more harmless for you as a holder, because a planned shutdown hits holdings just as an unplanned one does.
What a Bridge Does Technically
A cross-chain bridge is a pair of contracts that locks an amount on one blockchain and issues a proxy token of the same size on another. The proxy is worthless in itself; its entire value consists of the claim to get the locked original back. Remove the redemption route and what remains is a token that looks exactly as it did before and has lost the function it was built for.
We flagged the deadline on August 21, 2026 in a separate piece setting out the shutdown of the TON bridge and the j-tokens affected in detail. This article is the follow-up to it, and it rests not on an announcement but on a measurement of our own.
How Much Wrapped TON Is Still Stuck? The Count of September 1
This analysis was carried out by cryptoticker.io itself on September 1, 2026. The method in one sentence: through public access to both networks, the issued total supply of the two Wrapped TON contracts was queried, and in addition every redemption of the wrapped token was counted across a window of 100,801 Ethereum blocks.
Two token contracts on two networks were examined, each with name, ticker, decimals and issued supply, plus one continuous window of events on Ethereum. Both contracts report the name Wrapped TON Coin, the ticker TONCOIN and nine decimals. The position as of September 1, 2026, 06:56 UTC:
- Ethereum: 9,292,636.88 Wrapped TON
- BNB Smart Chain: 2,052,271.93 Wrapped TON
- Combined: 11,344,908.81 Wrapped TON
That figure is a net value. It falls when someone redeems their wrapped token and collects the original on the TON network, and it would rise again if new tokens were still being wrapped. On the deadline itself the second direction of travel is practically meaningless, because nobody crosses a bridge for the first time shortly before it closes.
What We Could Not Check
Three things lie beyond what public access can measure cleanly, and we name them rather than paper over them. First, the event history on BNB Smart Chain: the freely available network endpoints limit queries of historical events so severely there that a complete time series over two weeks did not come together. Second, the number of individual holders behind the balances; a holding of eleven million tokens may sit at a handful of addresses or at many thousands, and without evaluating every address the two cannot be told apart. Third, the j-token side on TON, which has a different data structure and cannot be read out comparably with the same tools.
Ethereum and BNB Smart Chain: Where the Remaining Balances Sit
Of the balances left, around 81.9 percent sit on Ethereum and around 18.1 percent on BNB Smart Chain. The split matters in practice, because the two networks cost different amounts. On Ethereum a return trip can easily cost a multiple of what it costs on BNB Smart Chain, and on small balances that fee can be larger than the value at stake.
That point explains part of the stranded supply without justifying it. For someone holding 30 tokens in an old Ethereum wallet, the return trip was an arithmetic problem well before the deadline. For someone holding 30,000, it never was.

Redemptions Counted: How Little Came Back in the Past Two Weeks
A redemption is easy to spot on the blockchain: the wrapped token is transferred to the zero address and thereby retired. Across the window from August 19, 2026 to September 1, 2026, specifically Ethereum blocks 25,779,977 to 25,880,777, we counted 74 such redemptions covering 236,588.24 tokens in total. That is the entire movement on Ethereum in fourteen days.
More revealing than the total is how it is spread across the days:
- August 19: 12,736.67
- August 20: 105,496.38
- August 21: 71,156.90
- August 22: 3,306.00
- August 23: 6,709.50
- August 24: 1,003.40
- August 25: 22,059.20
- August 26: 5,002.28
- August 27: 5,349.49
- August 28: no redemption
- August 29: 11.00
- August 30: no redemption
- August 31: 3,757.41
- September 1 up to 06:56 UTC: no redemption
The weight falls on August 20 and 21, the days on which the trade press picked the subject up. After that the movement dries up. On two of the last four days before the deadline not a single token was redeemed on Ethereum, and on another there were eleven. On the last full day before the end, 3,757.41 tokens came back, less than a tenth of what a single average day in mid-August brought.
For comparison: in our piece of August 21, 2026 we reported 11,476,155.84 wrapped tokens for both networks together. Against today's measured level of 11,344,908.81, that is 131,247.03 tokens, or around 1.1 percent, that have found their way back over the past eleven days. This comparative figure comes from our own reporting and is not independent outside confirmation. How the decline splits between the two networks cannot be broken down cleanly without the BNB Smart Chain event history.
Wrapped Tokens Without a Bridge: How a Claim Becomes a Slip With No Counter
The most important thought about this episode has little to do with TON. A wrapped token is a receipt. Its price on any given marketplace says nothing about whether the desk that redeems it will still be open tomorrow. As long as the bridge runs, the two values move in step. The moment it is switched off, they part company, and the market price of the wrapped token then hangs solely on the expectation that somebody will reopen the redemption route.
For you as a holder that implies a checking routine which reaches beyond this single case. If a token in your wallet is a proxy, often recognisable by a prefixed letter or by the word Wrapped, then the question of who operates the redemption, and for how long, always belongs to that holding. With native holdings on a regulated trading platform with its own custody the question does not arise in the same sharp form, because no second contract stands between you and the original there.
How to Recognise a Proxy Token
Three features are enough in most cases. The name carries an addition such as Wrapped or Bridged, or a prefixed letter. The token sits on a different network from the one the project actually calls home, Toncoin on Ethereum for instance. And the quantity of the token is capped nowhere by the protocol itself, but by the locked amount on the other side. If all three apply, you hold a claim, not a holding.
J-Tokens Such as jUSDT and jDAI: The Same Deadline in the Other Direction
The second half of the announcement is easily overlooked, because it concerns the audience that is on TON anyway. Anyone holding jUSDT, jUSDC, jDAI or jWBTC on TON also holds proxies, only with the sign reversed: the original in this case sits on Ethereum, locked by the same bridge. According to the announcement these balances too should have been returned before September 1.
Unlike Wrapped TON, we could not count this side, because the token structure on TON cannot be read out comparably with the tools used here. The fact that we quote no figure expressly does not mean that little is sitting there. It only means that we do not know.
What Is Still Possible After the Deadline
Two observations from the morning of September 1, both checked by us. The address bridge-v3.ton.org still answered with a regular page at 06:57 UTC. The former collective address bridge.ton.org, by contrast, redirects to an overview page that answers with a 404 error and therefore leads nowhere.
From that follows an uncomfortable but honest answer: whether the return trip still works in the course of today is the operator's decision, not a matter of calendar logic. A reachable web interface is no proof that the contracts behind it still settle. If you are affected, the attempt is still the first step, and it belongs today rather than tomorrow. An attempt that fails costs you a network fee; an attempt not made may cost the entire holding.

Wrapped TON: What Is Established and What Remains Interpretation
The data is established: the announced shutdown as of September 1, 2026, the tokens affected in both directions, the waived bridge fees and every figure in this piece that comes from our own measurement on the deadline. It is also established that redemptions on Ethereum came almost entirely to a standstill in the final days before the cut-off.
Interpretation, and labelled as such, is the question of why. That a balance stays put can have many causes: lost access to old wallets, holdings in contracts nobody maintains any more, holders who never saw the announcement, or simply amounts for which the fee is not worth it. Which of these reasons weighs how much cannot be derived from the quantity curve alone, and we therefore do not claim it. What can be said: a fixed date with waived fees and more than three months' notice moved around one percent of the balance. That is a finding about the reach of such announcements, not about the diligence of individual holders.
Checking Your Wallet for Wrapped TON: What to Do Today
The check takes a few minutes and is worth doing even if you are fairly sure you hold nothing wrapped. Old wallets from a time when bridges were common contain leftovers more often than their owners expect.
Three Checks That Take a Few Minutes
First: open every wallet you have ever used on Ethereum or BNB Smart Chain and look through the token list for entries with the ticker TONCOIN. Some wallets hide unknown tokens; in that case a look at your address through a public block explorer helps. The contract in question is found on Ethereum under the identifier 0x582d872A1B094FC48F5DE31D3B73F2D9bE47def1, and its public contract page shows the same total supply on which this analysis rests.
Second: if you find something, attempt the return through the TON bridge interface for as long as it responds. Expect the process to break off, and treat the network fee as a possible loss.
Third: document what you see before anything changes. A screenshot of the balance with the date, and the identifier of your address, are the basis for any later enquiry with an operator. Someone who notices in six months that something is missing no longer has that basis.
Deadlines in Everyday Crypto: The Pattern Behind the Single Case
Shutting down a bridge is only one type of deadline. Delistings at trading venues, exchange windows after a contract migration, the wind-down of entire platforms and the removal of individual networks from a wallet application all follow the same course: there is an announcement, a generous period, a cut-off date, and after that a remainder that stays put. September 2026 carries several such dates, and we track them in a running overview of deadlines and balances at crypto exchanges.
Today's measurement supplies an empirical value you can apply to your own holdings. Do not rely on a deadline reaching you by itself. The announcement had been running since May 23, the trade press reported at the end of August, and even so more than eleven million tokens sat unchanged on the deadline. Your own list of holdings that depend on someone else's infrastructure is the only mechanism that works regardless of whether a piece of news reaches you. For the Toncoin price itself, incidentally, the changeover carries no direct implication: what is affected is the redemption route of a proxy, not the protocol behind it.

Checking Wrapped TON: What to Take Away
- Look today, not later. Check every wallet on Ethereum and BNB Smart Chain for balances with the ticker TONCOIN and attempt the return for as long as the interface responds. If you would rather hold native assets than proxies in future, the routes there are in our comparison of the best crypto exchanges.
- Draw up a list of dependencies. Note for every holding whether it is native or has to be redeemed by somebody else's contract. Holdings you intend to keep for the long term belong under your own key management; which devices are suitable is shown in the crypto hardware wallet comparison.
- Collect deadlines in one place. Put the cut-off dates of bridges, delistings and platform wind-downs into a calendar of your own instead of waiting for notifications. If you check at the same time which supervision your trading venues sit under, the overview of regulated crypto exchanges takes you further.
(As of September 1, 2026. This article is not investment advice. Prices and fee structures change; check the terms with the provider before you buy.)
On September 25, 2026, Plasma frees 1,805,555,556 XPL in a single day. These are the tokens held by the team and by investors, subject to a one-year lock-up that has run since the mainnet beta launched on September 25, 2025. Measured against the amount in circulation today, that is around 65 percent. Add the ecosystem tranche falling on the same day and the total comes to 1,894,444,445 XPL, or 18.94 percent of the maximum supply.
The figures come from two independent places: Plasma's own tokenomics documentation and an emissions dataset that recalculates the rule independently. Both name the same day and the same amounts. This piece shows where the quantity comes from, what follows month by month afterwards, and how to check the date without relying on anyone else.
One term first, because everything else builds on it: an unlock is the moment at which contractually locked tokens become transferable. Unlocked expressly does not mean sold — it is a statement about quantity, not about price.
What Happens at Plasma on September 25, 2026: 1.81 Billion XPL for Team and Investors
Plasma is a layer-1 blockchain which, according to its own documentation, is built around stablecoin payments and optimised for stablecoins; the XPL token is its gas token, the currency used to pay for transactions on the network and to reward validators. The initial supply at the mainnet launch was 10,000,000,000 XPL. We covered that launch on September 25, 2025; the date now approaching is its first anniversary, to the day.
How those 10 billion are divided is set out in the project documentation, in four pools: public sale 10 percent, ecosystem and growth 40 percent, team 25 percent, investors 25 percent. Two of these pools matter for September 25, 2026.
One third of the team allocation of 2,500,000,000 XPL comes free, which is 833,333,333 XPL. The investor allocation, also 2,500,000,000 XPL, follows the same schedule according to the documentation and therefore contributes another 833,333,333 XPL. On top of that, each pool releases its first monthly instalment of 69,444,444 XPL. Together that gives 1,805,555,556 XPL.
| Item | Amount in XPL |
|---|---|
| Team, cliff portion | 833,333,333 |
| Team, first monthly instalment | 69,444,444 |
| Investors, cliff portion | 833,333,333 |
| Investors, first monthly instalment | 69,444,444 |
| Total team and investors | 1,805,555,556 |
| Ecosystem and growth, separate event on the same day | 88,888,889 |
| Total on the day | 1,894,444,445 |
To put the amount in context: at the price of $0.084301 that CoinGecko showed on September 1, 2026 at 06:37 UTC, the insider tranche is worth around $152 million. XPL's market capitalisation at the same moment stood at around $234 million. The relationship between those two figures is the real reason this date is news at all.
Who Stands Behind the Investor Allocation
The documentation names Founders Fund, Framework and Bitfinex among the backers. For the date itself the list of names makes no difference, because all investor tokens follow the same schedule. It still helps with context: these are professional holders with their own lock-ups and their own reporting duties, whose behaviour differs from that of a retail investor.
Why Today's Circulating Supply Proves That Not a Single Team Token Is Free Yet
That claim can be checked with a single number. The circulating supply is the quantity of tokens that is actually transferable; the maximum supply is the ceiling that will ever exist. For XPL on September 1, 2026, CoinGecko shows a circulating supply of 2,777,777,778 XPL.
That figure is not an odd number. It is made up of 1,000,000,000 XPL from the public sale plus exactly twenty ecosystem tranches of 88,888,888.89 XPL each. The arithmetic works out to the decimal place. Two things are therefore established without having to take anyone's word for it: Plasma has followed the documented schedule precisely so far, and nothing from the team and investor pools has reached circulation to date.
The independent emissions dataset confirms this from another direction. For the current distribution it puts the team at 0 percent and investors at 0 percent, while the public sale stands at 100 percent and the ecosystem at 44.4 percent. Two sources, two routes through the arithmetic, the same result.
In practice that means September 25 is not one tranche among many at XPL; it is the day these two pools open for the first time at all. Anyone comparing the date with the small monthly ecosystem releases of recent months is comparing two very different orders of magnitude. If you hold XPL through an exchange and want to know which venues list the token at all, you will find the overview in our crypto exchange comparison.
Cliff or Linear: How the XPL Vesting Schedule Is Actually Built
Vesting describes the schedule under which locked tokens are released step by step. A cliff is the lock-up period before that, during which nothing at all is released and at the end of which a larger block opens at once. XPL combines the two, and the order is the point at which many summaries lose precision.
For the team and investors the documentation states: one third of the tokens is subject to a one-year cliff from the public launch of the mainnet beta on September 25, 2025 and is released on September 25, 2026. The remaining two thirds then follow pro rata each month over two years, so that three years after the mainnet launch, on September 25, 2028, everything is unlocked.
The ecosystem and growth pool runs to a different rhythm: 8 percent of the total supply, or 800,000,000 XPL, was free immediately at launch; the remaining 32 percent follows monthly over three years and is likewise fully unlocked on September 25, 2028.
The public sale had a third rule, which we will come to separately, because a widespread misconception has attached itself to it.

The Ecosystem Tranche on the Same Day: Why 1.81 Billion Becomes 1.89 Billion
The emissions dataset lists three separate events for September 25, 2026: the team tranche, the investor tranche and an ecosystem tranche of 88,888,889 XPL. The last of these belongs to the regular monthly rhythm of the growth pool and would be unremarkable on its own; it merely happens to fall on the same calendar day.
The distinction still matters for the arithmetic, because both figures circulate in summaries. Anyone speaking of 1.81 billion XPL means the team and investors. Anyone quoting 1.89 billion has included the ecosystem tranche. Both figures are correct, they simply answer different questions.
Measured against today's circulating supply of 2,777,777,778 XPL, the insider tranches alone come to 65.0 percent, and all three events together to 68.2 percent. After the cut-off date the circulating supply works out at around 4,672,222,222 XPL, which is 46.7 percent of the maximum supply of 10 billion. Before it, the figure was 27.8 percent.
A note on precision that appears in almost no overview: the emissions dataset carries a time for the date, namely 05:48 UTC. That minute comes from projecting forward the moment of the mainnet launch, not from any statement by Plasma. The project's documentation names the calendar day only.
The July Misconception: Which XPL Lock-Up Really Ended on July 28, 2026
Several summaries of the subject claim that the unlock for team and investors had already begun in July 2026. That reading cannot be reconciled with the documentation, and it cannot be reconciled with the measured circulating supply either, which is explained in full by the public sale and the ecosystem tranches.
A July date does exist, but it concerns a different pool. From the documentation: public sale buyers outside the United States received their tokens in full at the mainnet launch on September 25, 2025. Buyers from the United States were subject to a twelve-month lock-up, which ended on July 28, 2026.
Conflating the two dates leads to a false picture of the state of supply. The July date concerned part of 1 billion public sale tokens; September 25 concerns 5 billion tokens from two insider pools. That distinction is why it pays to do the arithmetic against the circulating supply rather than lift a number from an aggregator.
Unlocked Does Not Mean Sold: What a Token Unlock Means Economically
An unlock lifts a transfer restriction. It obliges nobody to sell anything, and on its own it moves not a single token to an exchange. What changes on the day is solely the number of tokens that could be sold.
That this distinction is not academic becomes clear from the structure of the recipients. Team tokens are, according to the documentation, subject to further vesting rules tied to joining dates on top of this schedule. Investors hold stakes whose sale is governed by fund lifetimes and internal rules. Experience suggests that some of these tokens will never reach the market and others certainly will, and nobody knows the split in advance.
What can be said responsibly is the quantity side: how much is released when, and what share of what it represents. Anything beyond that would be a price forecast, and this piece deliberately does not offer one. How far the pure question of quantity can diverge from the question of price is something we have written up at greater length on the relationship between circulating supply and fully diluted valuation.
Why Liquidity Makes the Difference Here
Whether a large release is noticed in the market depends less on its absolute size than on its relationship to daily trading volume and to the depth of the order book. A tranche worth $152 million lands differently in thin liquidity than in deep liquidity. That is why two nominally equal unlocks in two different tokens can have completely different effects.
Measure Dilution Instead of Guessing: Circulating Supply, Maximum Supply and FDV at XPL
The fully diluted valuation, or FDV, is the value a project would have if every token were already in circulation today: price times maximum supply. For XPL on September 1, 2026 that was around $843 million, while the market capitalisation stood at around $234 million.
The gap between the two figures shows how much supply is still outstanding. A ratio of roughly one to 3.6 means, in this case, that for every token circulating today there are around 2.6 more still locked. September 25 shifts that ratio to about one to 2.1 in a single step.
For forming your own view that is a firmer basis than any headline, because both figures can be looked up at any time. The only thing that matters is not to confuse maximum supply with total supply: at XPL the two are identical, at many other tokens they are not.
What the Unlock Has to Do With Validator Reward Inflation
Alongside the vesting schedule, Plasma has a second source of new tokens, and it is not yet active. The documentation describes validator rewards starting at 5 percent annual inflation and falling by 0.5 percentage points a year until a long-term baseline of 3 percent is reached.
The condition under which this starts is decisive: inflation only takes effect once external validators and stake delegation go live. Until then the emissions side is determined by the vesting schedule alone. Locked tokens held by the team and investors are, according to the documentation, expressly not eligible for rewards.
What is still missing for this is stake delegation. The documentation lists it as an intention: XPL holders are to be able to take part in consensus by assigning their share to a validator and receiving part of the rewards. Only when this staking goes live alongside external validators do the validator rewards begin to run. Any later change to this reward schedule must, according to the documentation, be voted on by the validators, which amounts to a piece of governance for users of the network: the emissions side is then no longer a fixed plan, but something decided within the network.
On the other side stands a burn mechanism modelled on EIP-1559: the base fee paid for transactions on the network is destroyed permanently. Whether this mechanism offsets the emissions depends on how far the network is actually used for stablecoin transfers. Only the rule can be evidenced today, not its result.

What Comes After the Cut-Off Date: Monthly Tranches Until September 2028
September 25 does not close the subject; it is where it begins. From October 25, 2026 the remaining two thirds of the team and investor pools follow monthly, at 69,444,444 XPL per pool. Together that is 138,888,889 XPL a month.
The monthly ecosystem tranche of 88,888,889 XPL continues on top of that. In total, from the end of October, around 227,777,778 XPL a month flow into circulation, without interruption, until the schedule expires three years after the mainnet launch.
| Period | Monthly amount released in XPL |
|---|---|
| until September 24, 2026 | 88,888,889 (ecosystem only) |
| September 25, 2026 (cut-off date) | 1,894,444,445 one-off |
| from October 25, 2026 | 227,777,778 |
| until September 25, 2028 | fully unlocked thereafter |
No headline that names only the cut-off date answers this follow-up question. For context it matters more than the day itself, because it shows that the supply pressure from the vesting schedule persists for two further years. Anyone looking at XPL over a longer period reckons with that monthly rate rather than with a one-off event.
Where to Check the XPL Unlock Calendar Yourself
You need no second-hand summary for this date. A search for Plasma XPL leads almost exclusively to price pages; two addresses spare you that detour, and both are reachable without registering.
The first is Plasma's tokenomics documentation. The rules are set out there in full: the four pools, their size, the cliff for team and investors, the monthly rhythm afterwards and the end date. That is the authoritative source, because it comes from the issuer.
The second is the public emissions dataset for Plasma. It contains every single release event with a timestamp, a category and an amount, along with an overview of the current distribution. Open the file and you can check the amounts in this article line by line.
The Documentation's Key Terms, Briefly Explained
Open the primary source and you meet labels that do not explain themselves. The vesting schedule is a token's release plan. The ecosystem and growth pool is the growth pool from which the monthly tranches come. Base fees are the basic fees on a transaction, which Plasma destroys. And in the emissions dataset circulating supply stands for the transferable quantity and maxSupply for the ceiling. With those four expressions the documentation reads without further help.
The One Calculation That Makes the Rest Unnecessary
If you want to know for any token whether an announced release has already happened, a simple test helps: compare the current circulating supply with the sum of all tranches due to date. If the arithmetic works out, the project is following its plan. If it diverges, the question is worth asking. At XPL it works out to the decimal place, and that is precisely why the claim that insider tokens are already in circulation can be cleanly refuted.
Anyone wanting to keep track of such dates across several tokens will not get far with a calendar in their head. Tools that bring together release dates, circulating supplies and holdings take that bookkeeping off your hands; the selection is covered in the final section below.
The XPL Price Since the Mainnet Launch and What It Reveals About Expectations
A look at the price history belongs to the context, without turning into a forecast. According to CoinGecko, XPL reached an all-time high of $1.68 on September 27, 2025, two days after the mainnet launch. On September 1, 2026 the price stood at $0.084301, or 0.072666 euros. That is a fall of around 95 percent from the peak.
In the seven days before this article's cut-off date the token was down around 14.5 percent, and over thirty days up around 9.6 percent. What these numbers do not answer is whether the coming unlock is already priced in. Price data cannot answer that question in principle, because it presupposes a statement about the expectations of other market participants.
What can be observed are indications: how trading volume develops in the days before the date, how deep the order books are at the largest venues, and whether and how many of the freed tokens actually move to exchange addresses after the cut-off. That movement is visible on chain and therefore verifiable after the fact.
Four Common Errors in Reading a Large Token Unlock
First: percentages without a reference figure. 18.06 percent of the maximum supply and 65 percent of the circulating supply describe the same event and sound entirely different. Quote a number and you quote the reference alongside it.
Second: equating release with sale. A tranche worth $152 million does not automatically become selling pressure of that size. What the date creates is the possibility, not the event.
Third: ignoring the instalments that follow. The cliff is the visible part; the monthly 138,888,889 XPL afterwards are the permanent one. Over two years they add up to a multiple of the one-off tranche.
A fourth point stands out at Plasma in particular: the project has published a white paper under the EU regulation on markets in crypto-assets. That document covers the 2025 public sale only and does not contain the schedule for team and investors. As evidence for September 25 it is therefore of no use, even if it is valuable elsewhere.
XPL Unlock: What to Take Away
- Do the arithmetic on the date once yourself. Open the tokenomics page and the emissions dataset, and compare the circulating supply with the sum of the tranches due to date. For this kind of ongoing observation across several tokens a tool is worth having: which ones deliver is set out in the comparison of analytics platforms.
- Settle where your tokens sit before the date arrives. Holding XPL on an exchange means carrying that exchange's counterparty risk; holding it yourself means carrying responsibility for the keys. Which devices are suitable and what separates them is shown in the hardware wallet comparison.
- Check your venue's terms before the cut-off date, not after it. Fees, withdrawal limits and the available trading pairs differ considerably, and a volatile day is when you notice it first. The overview is in the crypto exchange comparison.
(As of September 1, 2026. This article is not investment advice. Prices and fee structures change; check the terms with the provider before you buy.)
Bitcoin Tax Report Wrong: What Austrian Investors Must Correct
For income from 2025 onwards, Austrian investors can request standardised tax reporting from certain parties obliged to withhold Austrian capital gains tax (KESt). The document is meant to make crypto income, and the capital gains tax attributable to it, traceable.
Even so, the report should not be adopted without checking it. Incorrect acquisition costs, transfers from external wallets or incomplete tax data can all mean that the Bitcoin gain shown does not match the actual tax position.
Bitcoin Held Outside the Provider Is the Critical Case
Problems arise above all where Bitcoin was originally bought outside the Austrian provider.
In that case the crypto service provider may not automatically know:
- the actual acquisition costs,
- the original purchase date,
- earlier crypto-to-crypto swaps,
- whether the coins count as old or new holdings.
Where data required for the capital gains tax deduction is missing, statutory flat-rate valuation rules can apply.
Which Tax Report Entries Investors Should Check
In the tax report, and in the underlying exchange data, the following in particular should be checked:
- taxable gains,
- realised losses,
- capital gains tax withheld,
- the acquisition costs applied,
- the allocation of wallet transfers,
- the treatment of old holdings,
- loss offsetting.
An Error in the Tax Report Can Mean Too Much Tax
An example:
- actual acquisition costs: 30,000 euros
- sale: 50,000 euros
- actual gain: 20,000 euros
If the provider instead applies only 20,000 euros as the acquisition costs, it would report a gain of 30,000 euros.
At 27.5 percent, considerably more tax would initially have been accounted for than was actually owed.
Discrepancies of that kind should not simply be accepted.
Correction Through the Provider or the Tax Assessment
Depending on the error and on the timing, a correction by the crypto service provider may be possible first. Where acquisition data is substantiated after the event, corrections to the capital gains tax deduction can be possible.
If a correction through the provider is no longer available, an income tax assessment may become necessary.
Your Own Records Remain Essential
Standardised tax reporting therefore does not replace your own crypto documentation.
You should keep in particular:
- the original purchase statements,
- CSV exports,
- bank transfers,
- wallet addresses,
- transaction IDs,
- evidence of self-transfers,
- historical tax reports.
The more complex the history, the more important a comparison between the report and your own data becomes.
Conclusion
An Austrian Bitcoin tax report is a valuable aid, but it is no guarantee that every historical figure is correct. Above all with Bitcoin transferred in from elsewhere, older holdings and missing acquisition costs, investors should check which values the provider has actually used. If the capital gains tax deduction is wrong as a result, a correction through the provider or through the income tax assessment may be necessary.
(As of September 1, 2026. This article is not investment advice. Prices and fee structures change; check the terms with the provider before you buy.)
The President of the European Commission stood in front of a room full of French business leaders last week and said the quiet part out loud. Europeans have roughly 10 trillion euros parked in bank accounts, that money is "sitting idle", and Europe now needs to put it to work for European companies.
She was not proposing to raid anyone's account. But the language matters, because it tells you exactly how your savings are viewed from Brussels: not as your money, but as a national resource that is currently being wasted. Here is what is actually happening, and what you can do about it that does not involve waiting for a policy to be designed for you.
What Did Von der Leyen Actually Say About Europe's Savings?
Speaking at the La REF business conference in Paris on 27 August, Ursula von der Leyen argued that Europe's old economic model is finished. Cheap imported energy is gone, easy access to global trade is gone, and the assumption that someone else would handle Europe's security is gone.
Her answer is money. Specifically, your money. Around 10 trillion euros in household savings sit in European bank deposits, and a large share of Europe's savings ends up invested outside the continent, mostly in the United States. Meanwhile European companies stall out, get bought, or move abroad for funding.
The President of the European Commission stood in front of a room full of French business leaders last week and said the quiet part out loud. Europeans have roughly 10 trillion euros parked in bank accounts, that money is "sitting idle", and Europe now needs to put it to work for European companies.
She was not proposing to raid anyone's account. But the language matters, because it tells you exactly how your savings are viewed from Brussels: not as your money, but as a national resource that is currently being wasted. Here is what is actually happening, and what you can do about it that does not involve waiting for a policy to be designed for you.
What Did Von der Leyen Actually Say About Europe's Savings?
Speaking at the La REF business conference in Paris on 27 August, Ursula von der Leyen argued that Europe's old economic model is finished. Cheap imported energy is gone, easy access to global trade is gone, and the assumption that someone else would handle Europe's security is gone.
Her answer is money. Specifically, your money. Around 10 trillion euros in household savings sit in European bank deposits, and a large share of Europe's savings ends up invested outside the continent, mostly in the United States. Meanwhile European companies stall out, get bought, or move abroad for funding.
The vehicle for fixing this is the Savings and Investments Union, or SIU. The Commission says the package of measures on securitisation, bank and insurance investment rules, market integration and supervision could unlock up to 470 billion euros in additional investment.
Is the EU Really Taking Money From Your Savings Account?
No, and anyone telling you otherwise is selling something. There is no confiscation, no forced conversion, no deposit levy in the SIU.
What the SIU does is change the plumbing. It makes it easier and cheaper for banks, insurers and asset managers to move retail money into capital markets, it pushes simplified investment products and pension wrappers, and it leans hard on financial literacy campaigns to convince you that your deposit account is underperforming.
On the last point, they are not wrong. The Commission's own framing is that bank deposits are safe and easy to access but usually earn less than capital market investments. That is true. The awkward part is the second half of the pitch: the goal is not only better returns for you, it is cheaper capital for European companies. You are being asked to become the funding source for an industrial policy.
There is also a detail that rarely gets mentioned. Your savings were never idle. Banks lend deposits out. They always have. What Brussels means by "idle" is that the money is not flowing into the specific channels the EU wants it to flow into.
Why Are Bank Deposits Losing You Money Anyway?
Forget the politics for a second. The case against leaving everything in a savings account is much older than the SIU.
A euro sitting in a deposit account earns a nominal rate. Inflation eats the real value. Across most of the last decade, the combination has meant a slow, quiet loss of purchasing power for European savers, even during periods when headline rates looked respectable. You do not see it, because the number on your statement never goes down. Only what it buys does.
That is the actual problem. Von der Leyen is right that 10 trillion euros of deposits is a bad outcome for savers. Where reasonable people disagree is on the solution.
What Does It Actually Mean to Control Your Own Money?
Here is the test. If someone else can change the rules, freeze the account, redirect the flow, or inflate away the value while you sleep, you do not fully control that money. You have a claim on it.
That applies to a bank deposit, and it applies just as much to whichever tidy EU investment wrapper gets rolled out in 2027 with a nice acronym and a tax incentive attached.
Bitcoin is the opposite design. Fixed supply of 21 million, no issuer, no board meeting that can change the schedule, and if you hold your own keys, no intermediary that can freeze it. That is the entire point of the asset. Whether you like the volatility or not, nobody in Brussels, Frankfurt or Washington can decide that your bitcoin is sitting idle and needs to be redirected.
How Does a Bitcoin Savings Plan Work?
A Bitcoin savings plan is the least dramatic way to own bitcoin. You set a fixed amount, weekly or monthly, and it buys automatically. That is it.
The mechanism is dollar cost averaging. When the price drops you buy more sats for the same money, when it rises you buy fewer. Over a full cycle your average entry smooths out, and more importantly, you stop trying to time a market that has humiliated far better traders than you.
It also fixes the behavioural problem. Most people who say they want to buy bitcoin never do, because there is never a comfortable moment. An automated plan removes the decision entirely. At the time of writing bitcoin trades around 78,000 dollars, roughly 37 percent below its all time high near 126,000 dollars. Uncomfortable for lump sum buyers. Exactly the environment a savings plan is built for.
We compared the main providers offering Bitcoin savings plans in Europe, including minimum amounts, fees and whether you can actually withdraw to your own wallet: Bitcoin savings plan comparison
Where Can You Build the Rest of the Portfolio?
$Bitcoin should not be the whole plan. The boring part of a portfolio still matters, and the same automated logic works for stocks and ETFs.
If you want the equity side handled in one place, XTB offers commission free investing in real shares and ETFs up to a monthly turnover threshold, with fractional shares and recurring investment plans, so you can run an ETF savings plan next to your Bitcoin savings plan.
👉 Open an XTB account here

What Are the Risks of a Bitcoin Savings Plan?
This is the part most articles skip, so here it is plainly.
- Bitcoin is volatile. Drawdowns of 50 percent or more have happened repeatedly and will happen again. A savings plan reduces timing risk, it does not remove market risk, and it does not guarantee a profit.
- Never automate money you need soon. Emergency fund first, in cash, in a bank account, boring and accessible. Savings plans are for capital you can leave alone through a full cycle.
- Custody is a real decision. If your provider holds the coins, you are trusting that provider. Check before you sign up whether you can withdraw to your own wallet, because a plan you cannot withdraw from is an IOU, not bitcoin.
- Tax rules differ by country. Holding periods, exemptions and reporting obligations vary across the EU, so check your local rules or ask an advisor.
XRP is down 8.48 percent over the past seven days, trading around $1.3672 after a daily candle that opened at $1.3793, tapped $1.3963 and closed 0.91 percent lower. On a screener full of red numbers that looks like just another altcoin bleeding out.
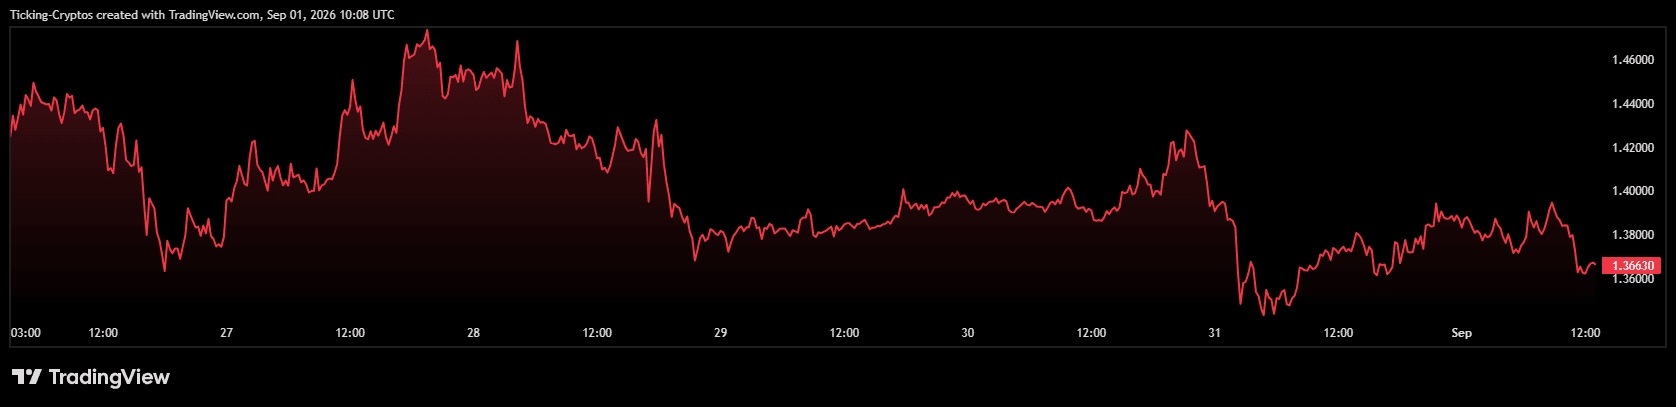
It is not. $XRP was the single best performing large cap in crypto ten days ago. It went from roughly $1.00 to an intraday high of $1.6963 in five sessions, its strongest week in 21 months, and finished August up around 28.5 percent, its best August since 2021.
So the honest framing of this week is not "XRP crashed". It is "XRP gave back part of a violent, leveraged, macro-driven spike". Those are very different setups for anyone thinking about buying, and the difference is the whole article.
Why Did XRP Fall 8% This Week?
Because the thing that pushed it up was never really about XRP.
On August 19 the US Treasury announced it would expand its buybacks of long-dated government debt, raising the cap on individual operations from $2 billion to at least $4 billion for 10 to 30 year maturities, running from September 9 through November 4. Long-term yields fell hard. The 30-year had been sitting at a 19-year high above 5.33 percent and dropped toward 5.19 percent.
Traders immediately relabelled this as "QE Lite" or curve control, and risk assets ripped. XRP ripped hardest, up around 51 percent while Bitcoin managed 22 percent, Ethereum 30 percent and Solana 28 percent over the same stretch.
Two things are worth being precise about here, because a lot of coverage was not.
First, this was not yield curve control. The Treasury described the operations as liquidity support for parts of the bond market receiving heavy volumes of eligible offers. Actual curve control means a central bank setting a yield ceiling and buying unlimited quantities to defend it. Scheduled, capped operations by the Treasury are not that. The YCC read was a market interpretation, not announced policy.
Second, a large chunk of the move was shorts getting run over. CoinGlass data circulated showing roughly $2 billion in shorts liquidated during the week, but that figure covered the entire crypto market rather than XRP alone, and about $1.2 billion of it came in a single 24 hour window. The available data does not support the claim of nearly $2 billion in XRP-specific short liquidations that got repeated widely.
Strip it down and the August spike was a macro liquidity headline, amplified by a short squeeze, on an asset that had underperformed so badly it was crowded with bearish positioning. Whale accumulation of around 380 million tokens in one week and a White House crypto summit added fuel. None of that is nothing. But none of it is a durable, XRP-specific demand story either.
When the squeeze fuel ran out, the price came back down. That is this week.
Are XRP ETF Inflows Strong Enough to Hold the Line?
This is the strongest part of the bull case, and it is genuinely strong.
US spot XRP ETFs pulled in $110.49 million in the week ending August 28, their best weekly haul of 2026 by a wide margin. Cumulative net inflows across the products have reached $1.66 billion, with total net assets around $1.44 billion.
The timing detail matters more than the headline. Of the roughly $153.55 million that flowed in during all of August, only about $3.27 million arrived between August 3 and 14. The remaining $150 million or so landed in the final two weeks, and the buying has continued through nine consecutive positive sessions.
So ETF demand did not lead this rally. It chased it. That is a meaningful distinction: chasing flows tend to be more sensitive to price than anticipatory ones, and they can reverse quickly if the tape turns. The seven US spot XRP funds together hold around 977.92 million XRP, which is real structural demand, but it is a fraction of what circulates.
What Does the XRP Chart Actually Say?
The daily chart is unusually informative right now, because the spike left a very specific footprint.
XRP is sitting at $1.3672, directly on top of the 200-day EMA at $1.3508. That moving average had been falling all year and capped every rally attempt since spring. The August surge blew straight through it, and the current pullback is the retest. That is the single most important thing on this chart.
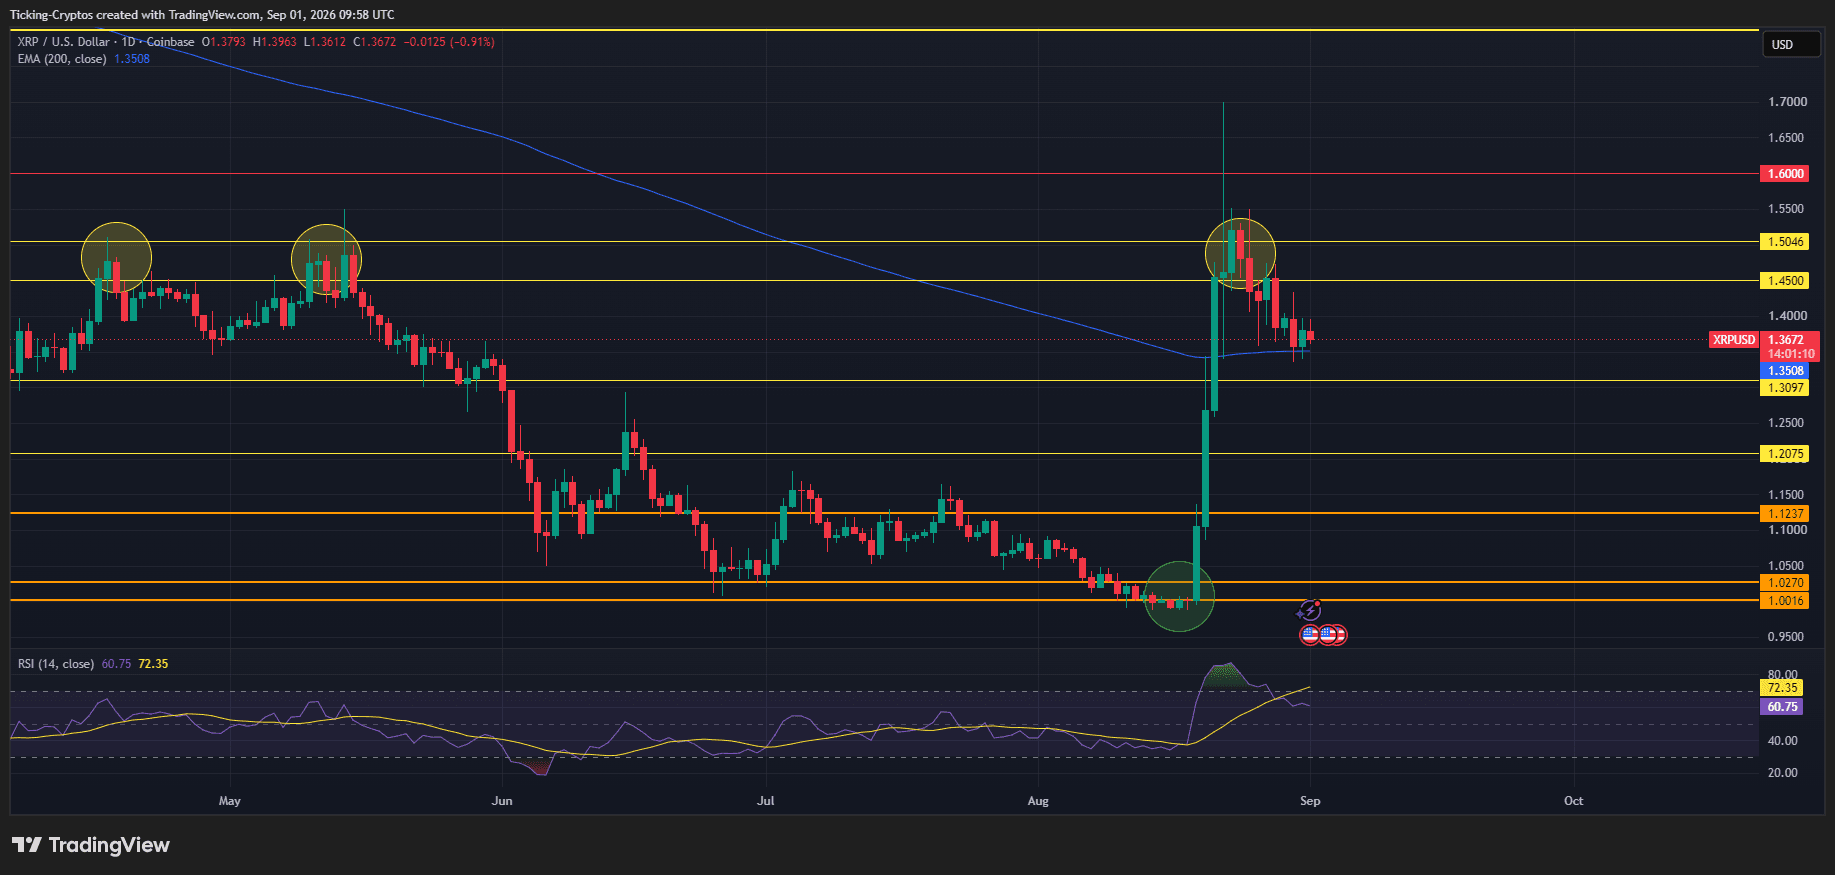
- Resistance overhead: $1.4500 is the first real barrier, and it is where sellers already stepped in on the way down. Above that sits $1.5046, the zone where the late-August candle got rejected, which also lines up with the highs from early May. The wick to $1.6963 above it is exactly that, a wick, with almost no time spent up there. $1.6000 is the next marked level.
- Support below: the 200-day EMA at $1.3508 first, then $1.3097. Below that the chart thins out badly toward $1.2075, then $1.1237, and finally the base of the whole move at $1.0270 and $1.0016, which is where the August low was set.
- Momentum: the daily RSI reads 60.75 and has already rolled over from a reading near 80, with the signal line at 72.35 above it. Momentum is cooling from an overbought extreme rather than breaking down. That is normal after a parabolic leg, but the cross below the signal is a warning that the impulse phase is over.
One structural point that traders keep missing: the move from $1.00 to $1.70 happened in days. There is almost no traded volume in the entire $1.05 to $1.35 zone. If $1.3508 fails and $1.3097 goes with it, there is very little underneath to slow price down. That cuts both ways, but it is why the risk here is not symmetrical with the reward.
What About the 1 Billion XRP That Unlocks Every Month?
Worth knowing, especially since today is the first of the month.
Ripple holds most non-circulating XRP in escrow contracts, and 1 billion tokens unlock on the first of every month. Historically Ripple re-escrows the bulk of it, typically 600 to 800 million, which leaves roughly 200 to 400 million actually entering circulation. Around 37.5 billion XRP remains locked, against circulating supply of about 62.53 billion out of a 99.99 billion total.
At today's price of roughly $1.37, that net monthly release is worth somewhere between $270 million and $550 million of new supply arriving whether the market wants it or not.
Put that next to the ETF numbers and the picture sharpens. The best ETF week of 2026 was $110 million. The monthly structural release is several times that. ETF demand is real, but it is currently not large enough to absorb the supply schedule on its own. That is not a scandal, it is arithmetic, and it is a headwind that Bitcoin simply does not have.
Is Buying XRP at Current Prices a Good Strategy?
Nobody can answer that for you, and anyone who says otherwise is selling something. What can be done is to lay out what the position actually is, because most people buying XRP here do not realise what they are betting on.
- Buying XRP at $1.37 is primarily a macro liquidity bet, not a Ripple bet. The rally was triggered by Treasury buyback expansion and lower long-end yields. If yields keep falling and the liquidity story holds, XRP has already shown it responds harder than Bitcoin or Ethereum. If the 30-year yield climbs back above 5.50 percent, the exact tailwind that created this move disappears. Analysts have flagged that level explicitly as the invalidation point for the macro thesis.
- The bull case: XRP reclaimed a 200-day EMA it had not touched since spring and is holding above it. ETF inflows just hit a 2026 record and are running nine sessions positive. Ripple is building a real business around the token's ecosystem, including a $1.25 billion Hidden Road acquisition, a $1 billion GTreasury deal and a new desk brokering equities exposure for institutions. The actual Treasury buybacks start on September 9, which is a scheduled catalyst rather than a hope. And the token is still only about 20 percent recovered from the slide that took it from $3.65 in July 2025 to below $1.
- The bear case: the move was leveraged and squeeze-driven, and Binance's estimated leverage ratio for XRP derivatives hit its highest level since early 2026, meaning more of the exposure is borrowed. Some analysts note XRP has now failed to reclaim its 50-week EMA for two consecutive weeks after a 22 percent retracement. Monthly escrow supply outweighs current ETF demand. XRP is still down about 26 percent year to date despite the best August in five years, which tells you how much damage there is to repair. And September historically has not been kind to this asset.
- The uncomfortable middle: both cases are credible, which is precisely why position sizing matters more than direction here. An asset that moves 56 percent in five days can move 30 percent against you just as fast.
If you are weighing this, the questions worth answering first are: are you actually taking a view on long-end Treasury yields, do you have a level at which you accept you were wrong, and would you be comfortable holding through a retest of the $1.20 area, because the chart structure makes that entirely possible without the bull case being dead.
What to Watch in September
Three dated events will settle most of this.
- September 9: the expanded Treasury buybacks actually begin. The announcement moved the market. The execution is when we find out whether the effect was priced or persistent.
- September 15: the Senate's procedural vote on the CLARITY Act. Sixty votes are needed to clear the filibuster. Market structure legislation is the regulatory catalyst XRP holders have been waiting on longest.
- September 16 and 17: the Fed decision. With Kevin Warsh sounding hawkish at Jackson Hole and rate hike odds back on the table, this is the one that can override everything else.
Add the ongoing ETF flow prints and the 30-year yield, and you have a fairly complete dashboard. Watch those rather than the price alone.
Decrypt
Strategy somehow threaded the needle of buying Bitcoin and STRC while also raising cash. Now how will the market respond?
Police say the ringleader also took crypto from the group and sent back 11 used cars and two excavators, a first for Korean investigators.
The proposed screen would cut three companies from MSCI's global indexes in November, with Strategy the largest by some distance.
The sum was the first payment under a $163 million deal with the Messi-backed fantasy card game, now facing a gambling prosecution.
Gov. Greg Abbott ordered state agencies to stop paying for the AI-powered license-plate readers as privacy concerns and officer-misuse scandals mount across Texas.
U.Today - IT, AI and Fintech Daily News for You Today
As the Fed triggers a traditional market selloff, whales are quietly loading up on Solana and XRP, Wintermute data shows.
Dogecoin wallet clarifies asset support cutoff before September deadline.
XRP Ledger crossed an important threshold that might open up a way to the long-awaited 1 million payments target.
Bitcoin ownership hits 4.5-6% globally and now needs trillions more to break the $123,000 cap.
Ripple has added SettleMint to its growing list of partners to further boost its digital asset services and improve tokenization across Asia.
Blockonomi
Key Highlights
- Shares of BIAF rallied more than 55% Tuesday following the company’s announcement of a new application for its CyPath Lung diagnostic test
- BioAffinity is investigating CyPath Lung as a surveillance tool for identifying cancer recurrence in patients who completed curative treatment
- More than 680,000 Americans were living with a previous lung cancer diagnosis as of the start of 2025
- Daily trading volume surpassed 17 million shares, significantly higher than the three-month average of 5.91 million
- Spark’s AI analyst assigns BIAF an Underperform rating with a $5.50 target price, pointing to cash depletion and falling revenues
Shares of BioAffinity Technologies climbed more than 55% during Tuesday’s session after the biotechnology firm issued a press release detailing plans to expand CyPath Lung’s use for monitoring lung cancer survivors.
bioAffinity Technologies, Inc., BIAF
The stock began trading at elevated levels, having jumped 65.57% during premarket hours. This came after a 6.37% decline in the previous session. Despite Tuesday’s rally, BIAF remains down 74.24% year-to-date and has plummeted 95.72% over the trailing twelve months.
The biotechnology company announced it is investigating CyPath Lung as a monitoring solution for detecting cancer recurrence in individuals who have completed curative-intent therapy.
Data from the American Cancer Society indicates that over 680,000 Americans were alive with a previous lung cancer diagnosis at the beginning of 2025. The National Cancer Institute projects approximately 230,000 new diagnoses in 2026.
When patients complete treatment, discovering a new pulmonary nodule during scans presents significant diagnostic challenges. While CT scans can identify nodules, they frequently cannot differentiate between malignant tumors, new cancerous growths, or benign post-treatment changes like scar tissue or inflammation.
CyPath Lung delivers a binary outcome: either “unlikely” or “likely” malignancy. This classification could assist healthcare providers in determining which patients require additional testing versus those who can continue with standard monitoring protocols.
Medical literature indicates recurrence rates for non-small cell lung cancer range from 20% to 55%, varying by disease stage and therapeutic approach. The American Society of Clinical Oncology suggests surveillance imaging twice yearly for the first two years following curative-intent therapy for stage I through III NSCLC.
Performance Data for CyPath Lung
The diagnostic test employs flow cytometry combined with proprietary artificial intelligence to examine cell populations within patient sputum samples. Results from a published clinical study demonstrated 92% sensitivity, 87% specificity, 88% accuracy, and a 99% negative predictive value for identifying early-stage lung cancer in high-risk individuals.
According to BioAffinity, three years of real-world commercial deployment have demonstrated the test’s ability to help physicians evaluate malignancy risk and inform patient management, including situations where imaging findings and predictive algorithms yielded contradictory information.
Company CEO Maria Zannes stated that post-treatment surveillance “has the potential to lead to earlier intervention” and could complement existing early detection methods.
Dr. Vijay Gunuganti, an oncologist at Texas Oncology, noted that CyPath Lung “can provide additional information without immediately subjecting the patient to an invasive procedure.”
Dr. Gordon Downie, Chief Medical Officer at BioAffinity, emphasized that completing treatment is “not the end of cancer care,” highlighting the increasing significance of post-treatment survivorship monitoring.
Trading Activity and Analyst Outlook
Share volume on Tuesday exceeded 17 million, substantially above the three-month daily average of approximately 5.91 million. Such dramatic volume increases typically indicate rapid retail investor interest in response to news catalysts.
CyPath Lung is classified as a Laboratory Developed Test and has not received clearance as an independent diagnostic device. The clinical efficacy data referenced pertains to early detection applications and has not undergone separate validation for post-treatment monitoring purposes.
Spark’s AI-powered analyst maintains an Underperform rating on BIAF with a $5.50 price target, highlighting concerns about severe cash burn, declining revenue performance, and potential Nasdaq delisting as primary risk factors.
The post BioAffinity Technologies (BIAF) Stock Jumps 55% on CyPath Lung Cancer Survivor Monitoring News appeared first on Blockonomi.
Key Takeaways
- ASML shares have declined approximately 7% since late July amid concerns over Chinese DUV lithography machine production
- UBS analyst elevates price target to €2,350, suggesting 55% appreciation potential and possible $1 trillion market capitalization
- According to UBS, China faces at least a 10-year gap in developing competitive EUV technology
- Latest quarterly results showed revenue of $10.62 billion with earnings per share of $8.65
- Wall Street consensus stands at “Moderate Buy” with average target price of $1,970.33
Shares of ASML were changing hands at $1,679.27 during Tuesday’s session, sliding roughly 1% as concerns about Chinese competition continue weighing on sentiment.
ASML Holding N.V., ASML
The semiconductor equipment manufacturer has experienced approximately a 7% pullback since late July, following reports that an unidentified Chinese firm had begun mass manufacturing deep ultraviolet (DUV) lithography systems.
While DUV equipment plays a role in semiconductor fabrication, it represents older technology compared to ASML’s cutting-edge extreme ultraviolet (EUV) systems. Nevertheless, the news generated uncertainty among shareholders.
UBS analyst Francois-Xavier Bouvignies remains unconvinced by the pessimistic narrative. He recently elevated his price objective for ASML from €2,250 to €2,350, representing a potential 55% gain from present levels.
Achieving this valuation would make ASML the inaugural European corporation to cross the $1 trillion market capitalization threshold. Currently, the company’s market value stands at approximately $667 billion.
Bouvignies contends the competitive threat from China has been exaggerated. After examining patent applications, he estimates China’s EUV capabilities are comparable to where ASML stood in 2004.
“Our base case continues to be that China won’t achieve an EUV tool within the next 10 years,” he wrote in a research note.
He further emphasized that even with technological improvements, Chinese equipment will likely face performance deficiencies in yield and throughput, combined with regulatory limitations that will restrict adoption beyond China’s borders.
Foundations of the Bullish Outlook
Setting aside the China discussion, Bouvignies identifies a compelling earnings expansion trajectory. His projections indicate ASML can deliver a 31% compound annual growth rate for earnings per share through 2030, potentially reaching €92.90 per share.
Key catalysts include expanded machine deployment, enhanced pricing power, and increasing demand from memory chip manufacturers.
From a valuation perspective, ASML currently commands approximately 30 times forward earnings. While this appears elevated compared to Nvidia at 17 times, Bouvignies argues it represents an attractive entry point for ASML.
He highlights that ASML presently trades at merely a 1% premium relative to American chip equipment manufacturers including Lam Research, KLA, and Applied Materials. Over the previous 15 years, that premium has typically averaged 67%.
“Given ASML’s monopoly position and structurally stronger competitive profile, we believe such a discount is difficult to justify,” he wrote.
Wall Street Maintains Optimistic View
The broader analyst community continues expressing confidence. ASML holds a consensus “Moderate Buy” recommendation with an average price objective of $1,970.33.
JPMorgan recently upgraded its target to $2,400 while maintaining an “overweight” stance. Barclays and Deutsche Bank both assign “overweight” and “buy” ratings respectively. Jefferies maintains a “neutral” position.
Among analysts tracking the stock, four have assigned Strong Buy ratings, 21 recommend Buy, four suggest Hold, and three advise Sell.
Regarding institutional activity, Ancora Advisors reduced its ASML holdings by 15% during Q2, divesting 1,464 shares while maintaining 8,264 shares valued at approximately $16.4 million.
ASML’s 52-week trading range spans from $716.20 to $1,999.96, with the 50-day moving average positioned at $1,760.29.
The company’s latest quarterly dividend distribution was $2.1507 per share, distributed on August 5th, delivering a 0.5% yield.
The post ASML (ASML) Stock: UBS Sets €2,350 Target Despite China Competition Concerns appeared first on Blockonomi.
TLDR
- C3.ai’s Q1 FY27 earnings release is scheduled for September 2, with analysts forecasting $52 million in quarterly revenue and a projected adjusted loss of $0.26 per share.
- DA Davidson’s Lucky Schreiner maintains a Sell rating with a $7 price target, suggesting a potential 35.3% decline from present trading levels.
- The AI stock has declined approximately 20% since the year began, although shares have climbed 11% during the last month.
- TipRanks data shows C3.ai’s consensus analyst price target at $9.29, indicating potential 14.2% downside, with a Moderate Sell rating overall.
- The enterprise AI company reduced its workforce by 35% in 2024 and projects approximately $1 million in net new revenue for the upcoming quarter.
C3.ai (AI) will unveil its Q1 FY27 financial results following market close on Wednesday, September 2. Shares are presently hovering near $10.90, representing a roughly 20% decline since January.
C3.ai, Inc., AI
Analyst consensus calls for the enterprise AI software provider to deliver $52 million in quarterly revenue alongside an adjusted per-share loss of $0.26. These projections would mark a substantial year-over-year revenue contraction of approximately 25.7%.
DA Davidson’s Lucky Schreiner maintains a particularly cautious view entering the earnings announcement. He has reaffirmed his Sell rating coupled with a $7 price objective, suggesting potential downside of 35.3% from current trading prices.
Schreiner highlights ongoing execution challenges and the absence of near-term profitability pathways as key concerns driving his pessimistic outlook. Despite the company’s aggressive 35% workforce reduction implemented this year, he contends the stock’s valuation remains excessive.
Recent weeks have brought modest strength to the shares, with an 11% advance over the trailing month as investor sentiment surrounding C3.ai’s software-as-a-service positioning has strengthened. However, this performance trails the broader data and analytics software industry, which has surged 14.7% during the identical timeframe.
What the Numbers Show
C3.ai’s previous quarterly disclosure presented a contradictory picture. While revenue of $51.6 million surpassed analyst projections, it simultaneously represented a steep 52.5% year-over-year decline. The enterprise AI firm exceeded expectations on adjusted operating income but fell short on billings metrics.
Subscription revenue has exhibited stagnation across the previous two reporting periods. Demonstration licenses have failed to produce any meaningful revenue contribution, while net new revenue generation remains anemic.
Management issued preliminary FY27 guidance during the prior quarter, forecasting a 10% annual revenue contraction. Current Wall Street consensus estimates cluster around $225 million, positioned near the center of the company’s projected range. Schreiner anticipates management will elevate the lower boundary of FY27 guidance in conjunction with this earnings report.
What Could Change the Outlook
Tom Siebel has resumed the chief executive position, a development Schreiner characterizes as potentially constructive. Enhanced sales performance and expanded professional services revenue represent two domains where Siebel’s leadership could generate meaningful impact.
The company has strategically pivoted toward pursuing larger enterprise clients and more sophisticated artificial intelligence implementations. During its pre-quiet period investor communication, C3.ai indicated that demand for AI capabilities continues at elevated levels, with prospective customers developing sharper understanding of C3.ai’s competitive differentiation.
Government sector demand constitutes another opportunity Schreiner identified as a prospective catalyst for accelerated growth.
Comparable companies in the data analytics segment have delivered varied quarterly performances. Elastic posted 15.1% revenue expansion and exceeded forecasts by 1.7%, propelling shares 21.8% higher. Meanwhile, Teradata disclosed unchanged revenue, surpassed estimates by 3.5%, yet witnessed shares plummet 23.7%.
According to TipRanks, AI stock holds a Moderate Sell consensus derived from one Buy rating, three Hold recommendations, and five Sell ratings. The $9.29 average analyst price target suggests 14.2% downside from present levels.
The post C3.ai (AI) Stock Faces Wednesday Earnings Test With Wall Street Skeptical appeared first on Blockonomi.
TLDR
- Hut 8’s Beacon Point campus in Texas will support computing capacity tied to Anthropic’s $35 billion agreement with Lambda.
- Nvidia holds the lease at Beacon Point, while Lambda will operate Nvidia chips and supply computing power to Anthropic.
- Hut 8’s two 15-year Beacon Point leases cover 704 megawatts and carry $19.6 billion in contracted value.
- The 525-acre Texas campus has access to up to 1 gigawatt of power and an existing grid connection.
- Hut 8 reported $74.93 million in quarterly revenue, up 81% year over year, as it expands beyond Bitcoin mining.
Hut 8 is gaining attention after its Texas data center became part of an artificial intelligence computing agreement involving Anthropic, Lambda and Nvidia. The development connects the bitcoin miner’s power infrastructure with one of the largest AI capacity deals announced this year.
Hut 8 Texas Site Joins Anthropic AI Deal
Anthropic agreed to spend $35 billion on computing capacity from Lambda, an AI cloud company backed by Nvidia. Part of that computing power will come from Hut 8’s Beacon Point campus in Nueces County, Texas.
Nvidia holds the lease at the site, while Lambda plans to operate Nvidia chips there. Anthropic will then purchase computing capacity produced at the facility. Hut 8 shares rose after the report before giving back most of the gain in pre-market trading.
Hut 8 previously disclosed two 15-year leases at Beacon Point covering 704 megawatts of IT capacity. The company did not identify the tenant when it announced the agreements. Those leases carry $19.6 billion in contracted value over their terms.
The Beacon Point campus spans 525 acres and has access to as much as 1 gigawatt of power. Hut 8 has an existing grid connection at the site, which gives the facility access to power needed for computing operations.
Bitcoin Miners Expand Into AI Infrastructure
Bitcoin miners have become more active in AI data center deals because they already control power sites. Building new high-capacity connections can take years, while mining companies often have land, power access and operating infrastructure in place.
Hut 8 joins TeraWulf, IREN and Bitdeer in signing or supporting large AI computing projects. Public bitcoin miners had already secured more than $70 billion in AI and high-performance computing contracts by March, as mining economics pushed companies toward new revenue sources.
Hut 8 reported quarterly revenue of $74.93 million in June, up 81% from a year earlier. The company expects its two Beacon Point leases to support an average of $1.31 billion in annual operating income once the campus becomes fully operational.
Other miners are following similar paths. TeraWulf agreed to provide Anthropic with about 401 megawatts in Kentucky, while Bitdeer signed a $4.7 billion agreement in Norway. Microsoft also committed about $9.7 billion for AI capacity from IREN’s Texas data centers.
The post Why Hut 8 Is Suddenly at Center of AI Boom appeared first on Blockonomi.
TLDR
- Medtronic commits about $700 million to expand its surgical robotics portfolio.
- Sentire joins Hugo as Medtronic builds a two-platform robotic surgery offering.
- Hugo now operates in more than 35 countries across six continents worldwide.
- Sentire holds approvals in China, Singapore and the European Union markets.
- Cornerstone partnership broadens Medtronic’s reach in minimally invasive surgery.
Medtronic (MDT) has committed about $700 million to Cornerstone Robotics, strengthening its position in robotic-assisted surgery. The agreement gives Medtronic distribution rights for Sentire in selected approved markets outside the United States. MDT trades at $91.82, up 1.26%, after an early move above $98 lost momentum.
Medtronic plc, MDT
Medtronic Expands Its Robotic Surgery Portfolio
Medtronic will distribute Sentire alongside its Hugo robotic-assisted surgery system across selected international markets. Therefore, hospitals can access two multi-port platforms through Medtronic’s broader surgical technology portfolio. Medtronic will also connect both systems with its existing digital and operating-room technologies.
The company sees robotic surgery as a major area for long-term procedural growth. Global adoption remains in single digits, and Medtronic sees substantial room for broader hospital use. The company plans to address different clinical needs through separate systems and operating models.
Medtronic also continues expanding its wider strategy around minimally invasive surgery and connected surgical tools. Its surgical portfolio includes robotics, instruments, digital services, imaging support, and training resources. As a result, hospitals can choose technologies that suit different procedures, budgets, and clinical requirements.
Hugo System Builds Global Procedure Momentum
Medtronic now operates the Hugo robotic-assisted surgery system in more than 35 countries across six continents. Hugo also entered the United States market within the past year after receiving FDA clearance. Medtronic expects global Hugo procedures to exceed 50,000 by the end of its fiscal year.
Hugo procedure growth currently exceeds twice the growth rate recorded across the wider robotic surgery market. Medtronic continues upgrading software and adding real-time artificial intelligence across its digital ecosystem. The company also plans integrated stapling, more instruments, and broader clinical indications.
Hugo uses a modular design that supports multi-quadrant soft-tissue procedures across several surgical settings. The platform combines wristed instruments, three-dimensional visualization, and Medtronic’s Touch Surgery digital ecosystem. Medtronic also provides training, technical service, and program support for hospitals adopting robotic surgery.
Sentire Adds International Surgical Reach
Cornerstone developed Sentire internally and designed the system around an immersive surgical console. The platform also offers dual-console capability for different surgeon preferences and training requirements. Sentire has completed multi-specialty clinical trials covering several minimally invasive surgical procedures.
Sentire received a CE Mark in May 2026 for general, gynecologic, thoracic, and urologic procedures. Cornerstone also secured market approvals for the surgical system in China and Singapore. Medtronic gains an established regulatory base for selected international distribution markets.
Cornerstone operates three research hubs, six business centers, and a 30,000-square-meter manufacturing facility in China. The partnership connects Cornerstone with Medtronic’s global commercial network and established surgical customer base. Meanwhile, Medtronic gains another robotic platform and expands its surgical reach beyond the Hugo system.
The post Medtronic (MDT) Stock: Surge as $700 Million Cornerstone Robotics Deal Expands Surgical Reach appeared first on Blockonomi.
CryptoPotato
The controversial cryptocurrency project has stood aside from the spotlight lately as the community awaits a major protocol update scheduled for mid-September.
Meanwhile, social media buzz claimed that Elon Musk publicly endorsed PI, yet the token’s price failed to capitalize on the speculation and hardly participated in the broader crypto rebound seen over the past two weeks.
All Eyes on This Date
Pi Network began the long process of protocol upgrades at the start of 2026 when the Core Team unveiled version 19.6. Among the next ones was v20.2, which laid the foundations for smart contract capabilities.
Some of the following updates became harder to deploy, resulting in delays. Version 25, for instance, was supposed to be introduced by July 22, yet it came later than expected. The implementation of protocol v26 also surpassed its initial deadline.
The next one, which is actually scheduled to be the last, is v27, and it should be deployed by September 15. It will add more flexible and secure smart-contract authentication, giving accounts and apps better ways to authorize transactions. Version 27 will continue the progress by introducing newer protocol features and expanding the network’s smart contract capabilities.
Musk’s Interaction?
Just a few days ago, the world’s wealthiest person dropped an X post where he insisted that the universe “is integer in units of Planck cubes.” The assumption triggered multiple comments from users and experts who used mathematical terms in their theories. One of them, named Pierre Ferragu, claimed that π “doesn’t exist but the idea of π does.” Musk did not stay silent about that assumption, saying:
“Pi can be (and has been) used in integer form for calculating interplanetary trajectories. The relevant maximum number of digits of pi is how many are needed to describe the volume of the Universe in Planck cubes (voxels).”
At first glance, this appeared like a brainstorm about the universe and its complex nature, but it seems the debate intrigued Pioneers. The popular X account BSCN claimed that Musk’s interaction sparked a discussion in the Pi Network ecosystem.
“What started as a casual reply to a user’s comment has sparked a huge frenzy within the Pi Network ecosystem. Yesterday, billionaire CEO Elon Musk replied to a user, highlighting Pi’s physically meaningful representation. However, the reply has been seen as some form of endorsement for Pioneers,” it explained.
Speculation and Nothing More?
It is important to note that there was no further interaction from Musk and no clarification that he was referring to Pi Network’s native token. In fact, the coin has barely seen any volatility over the past few days and continues to trade below $0.10.
It is up approximately 7% over the past two weeks, but that is rather disappointing given the overall market boom during this period, where Bitcoin (BTC) soared by 22%, and Ethereum (ETH) spiked by 30%.
Still, some analysts believe PI may experience a more substantial short-term surge. X user Crypto With Gopal argued that the price is squeezing around the $0.09 zone as volatility contracts, opining that a breakout above could set the stage for a pump toward $0.15.
The post Important Pi Network News and PI Price Update: September 1 appeared first on CryptoPotato.
Ethereum’s latest monthly candle closed above a key resistance level around $2,470 on August 31, prompting analyst Matthew Hyland to declare on X that the downtrend that started in August 2025 is over.
He framed the close as the first confirmation that a new bull market has started, comparing the current chart structure to the setups that preceded ETH’s 2016 and 2020 rallies.
ETH’s Monthly Chart Flips Bullish
Hyland’s chart runs from ETH’s 2025 peak, hit in August of that year, through a steady run of lower highs and lower lows that bottomed out near $1,500 to $1,600 in June and July of this year.
“ETH confirms a Monthly Higher_High and ends its downtrend that started in August of 2025,” Hyland posted. “The Bears have been slayed. WELCOME TO THE #CRYPTO BULL MARKET!!”
Other traders have been circling the same zone, including DonAlt, who wrote that ETH has “No real resistance till $4k,” pointing to support around $2,100 and warning that a break below $2,000 could send price toward $1,000.
Fellow market watcher Daan Crypto Trades pointed out that ETH has spent the last 11 days pinned between its weekly 200-period moving average and a horizontal support level.
Another analyst, Quantum Ascend, noted that ETH’s monthly candle closed near its 50-month simple moving average with the RSI still deeply oversold, a setup that last showed up in spring 2025, right before the token rallied 3.5x in five months, and he says he’s “expecting a new all-time high” based on the move.
At the time of writing, the second-largest crypto asset was trading above $2,400, up roughly 31% over the past month and 30% in two weeks, while remaining about 50% below its record price of over $4,900 from August last year.
Network Activity Adds Another Piece
ETH’s price recovery is happening alongside increased network activity. As CryptoPotato reported, Ethereum is approaching 1 million active addresses, despite substantial activity taking place across Layer 2 networks.
That gives the price move some additional context, although active addresses alone cannot establish whether ETH has entered a new long-term cycle. Tron, for example, has more than 4 million active addresses, largely linked to payments and stablecoin transfers.
For now, the cleanest test of Hyland’s thesis is whether ETH can hold the $2,470 breakout area. A sustained move above it would leave the $4,000 region as the next major target cited by traders, while a failure below $2,000 would considerably weaken the bullish structure.
More on Ethereum can be found in our market video below:
The post Analyst Declares Bull Market After ETH Breaks Key Monthly Resistance appeared first on CryptoPotato.
Bitcoin closed August 2026 up nearly 25%, giving the month a result that has not appeared in comparable post-peak years of 2014, 2018, and 2022.
Ash Crypto pointed to the unusual monthly candle on September 1, noting that the latest close breaks a pattern that has accompanied Bitcoin’s previous bear-market phases.
Bitcoin Breaks an August Pattern
Ash Crypto’s chart, based on Bitstamp data and using a logarithmic scale, compares August performances after Bitcoin’s major cycle highs. August 2014 fell about 18% after the 2013 peak, August 2018 lost roughly 9% after the 2017 peak, and August 2022 dropped some 14% following the 2021 high. However, this year, things went the other way.
Bitcoin started the month in the low $60,000s and climbed above $81,000 before finishing at about $78,600, producing a monthly gain of 24.95%, according to CoinGlass data. Ash Crypto described it as “BITCOIN JUST CLOSED AUGUST GREEN FOR THE FIRST TIME EVER IN A BEAR MARKET.”
The distinction is important, since the chart does not establish that BTC has entered a new bull market. Instead, it shows that August behaved differently from the same point in the previous three post-peak cycles. Bitcoin’s last all-time high was just past $126,000 in October 2025, leaving the asset well below that level despite the August recovery.
Furthermore, the flagship cryptocurrency also had its best August since 2017, when the month closed up more than 65%.
CoinGlass data back to 2017 shows how unusual that stretch has been. Outside of the aforementioned 65% gain in 2017 and 2021’s 13.8% jump, every August in between finished red, including two straight double-digit losses in 2022 and 2023, with this year snapping that run.
Besides August ending up positively, the third quarter is also shaping up nicely, with the same CoinGlass data showing it’s in the green by nearly 33%, although there’s still one month to go.
That uptick is only bettered by the same period in 2017 that saw BTC’s value go up more than 80%, and it would take an incredible run in September to bring Q3 2026 anywhere near that.
Price Action as September Starts
Bitcoin dipped below $77,000 as fresh attacks in the Middle East revived geopolitical tension, then clawed back most of that loss soon after.
That follows a productive patch last week, when the OG cryptocurrency pushed past $81,000 to hit its highest level in over three months, only to get rejected after Fed Chair Kevin Warsh’s hawkish remarks at Jackson Hole.
At the time of writing, it was trading near $78,000, after barely moving either way in 24 hours. Although that price reflected a loss of about 2.5% for the week, it was still up more than 23% over the past month.
Dominance over the rest of the crypto market has climbed above 58%, with a market cap near $1.57 trillion. Zoomed out further, BTC remains down close to 29% for the year and more than 38% below its October 2025 ATH.
The post Bitcoin Makes History With First-Ever Green August During a Bear Market appeared first on CryptoPotato.
Perhaps the most notable piece of news within the crypto industry on Monday came from Strategy, as the company started buying more BTC again after completing a few sales and rebuilding its USD reserve to over $6.7 billion.
Although that might sound celebratory at first, it’s worth taking a closer look at when the firm sold and when it bought more bitcoin, as it turns out it realized substantial losses amid the asset’s price recovery.
Back to Buying
As reported yesterday, the largest corporate holder of the leading cryptocurrency spent $370 million to acquire 4,603 BTC at an average price of $80,310 per unit. This means that the acquisition took place during the previous week when bitcoin jumped past $80,000 for the first time since last May. However, its actual time spent above that coveted level was quite brief.
Nevertheless, this purchase came after four consecutive sales completed between June 30 and August 10, as Santiment explained. Within this timeframe, the company offloaded 6,916 BTC, worth roughly $430 million at the time, at an average price of approximately $62,100.
Consequently, the reacquired 4,603 BTC managed to offset approximately two-thirds of everything the firm sold during the summer. What’s quite intriguing is that Strategy’s purchase came at a price almost $18,000 per BTC higher than the average during the sales.
Analysts such as Michaël van de Poppe brought up the timing, saying that they are “genuinely impressed” by the fact that the purchasing power has returned around BTC’s recent peak.
On the plus side, bitcoin’s spectacular resurgence from the recent low-$60,000s to almost $80,000 as of press time means that Strategy’s massive position has turned green again. The firm, which stood at an unrealized loss of well over $10 billion until a few weeks ago, is now above water by around $2.3 billion.
STRC Recovers
Strategy used the past couple of months, in which it sold some BTC and didn’t buy any to raise additional funds by selling MSTR to increase its USD reserve. The total is now over $6.7 billion.
In addition, it repurchased a significant portion of its STRC shares, whose price had tumbled far below the par level of $100 to as low as $75. However, rebuilding the USD reserve and buying back shares helped STRC recover to just over $97 as of Monday’s closing price.
The post Saylor’s Bitcoin U-Turn: Strategy Sells at $62K, Buys Back at $80K appeared first on CryptoPotato.
Ripple’s native token turned the tables in August, although the month saw a few dips to a multi-year low of just under $1.00.
Now, though, the XRP Army has refocused on September, which is expected to be highly volatile. Some even called it XRP’s “most loaded month” in history.
The August Gains
Following a very modest gain of 2.11% in July, XRP went into August with little hope for a turnaround. After all, all four previous editions were in the red, with the asset dumping by as much as 26.6% in August 2023.
The month indeed began on the wrong foot, as by the middle of it, XRP had slipped below the key psychological support of $1.00 on a few occasions. While some bears speculated about another potential leg down toward $0.80 or even lower, the trend changed in an instant.
On August 19, the entire crypto market came to life, led by bitcoin’s massive surge from under $65,000 to $80,000 within less than 48 hours. XRP was a little late to the party, but once it joined, it couldn’t be contained. For 72 hours, that is. Perhaps due to returning ETF inflows or whales going on a big accumulation spree, XRP skyrocketed by 70% from Wednesday to Saturday and touched a multi-month high of $1.70.
However, it was quickly halted there and retraced in the following weeks. Ultimately, it ended the month at just under $1.40, which is still a 30% surge in its worst-performing month in history.
What’s Next, September?
Unlike all August editions between 2022 and 2025, all Septembers within the same period were in the green, some in a modest manner (0.42% increase in 2023), and some in a highly impressive fashion (46.2% in 2022).
This one is expected to be volatile, to say the least. RippleXity called it “the most loaded month in XRP’s history.” Aside from the highly anticipated FOMC meeting scheduled in two weeks, which is likely to impact all financial markets, the US Senate will return on September 14 and vote on the CLARITY Act the following day.
The legislation is expected to influence most altcoins, and the voting in two weeks is likely to set the course for what might occur by the end of the year.
The month will also end with another major XRP-related event. Evernorth’s shareholders will vote on whether the XRP treasury company will become public on Nasdaq as XRPN. It currently holds nearly 475 million tokens.
In terms of price action, many analysts are convinced that the cross-border token has exited its bear phase and is now well-positioned for major gains.
The post XRP Enters Its ‘Most Loaded Month’ in History After 30% August Surge appeared first on CryptoPotato.