Cryptocurrency Posts
Crypto Briefing
Market resilience amid geopolitical tensions highlights the effectiveness of strategic reserves and diversified supply sources in stabilizing oil prices.
The post Oil prices stay below $100 despite Strait of Hormuz closure appeared first on Crypto Briefing.
Heightened US-Iran tensions could destabilize global oil supply and intensify regulatory scrutiny on crypto markets, impacting investors.
The post Iran fires warning shots at US destroyers near Strait of Hormuz, raising oil and crypto market jitters appeared first on Crypto Briefing.
The ZEC withdrawal highlights investor confidence amid volatility, underscoring the potential for significant market shifts post-security scare.
The post New wallet withdraws 37,316 ZEC worth $13M from Binance after protocol security scare appeared first on Crypto Briefing.
Nvidia's valuation dip signals shifting investor confidence, potentially altering its competitive edge and market positioning in tech.
The post Nvidia market cap falls below $5T amid AI sector shifts appeared first on Crypto Briefing.
Ethena's diversification into AAA CLOs could attract institutional investors by enhancing stability and reducing reliance on crypto markets.
The post Ethena expands USDe’s backing diversification with AAA CLO evaluation appeared first on Crypto Briefing.
Bitcoin Magazine
Bitcoin Magazine

The Hyperinflation of 1971 at the Kindergarten
I’m pretty sure it was 1971, but it could have been 1972. In any case, it was in kindergarten, and I was five years old. Our teachers had set up a system to motivate us kids to behave well. They had hung a big board on the wall, with all of our names listed. If you were particularly well-behaved, kind, helpful, or polite, they drew a black dot next to your name. Misbehave, and they gave you a red one. It was all about following the kindergarten rules, and the absolute transparency of it motivated most of us to try our best.
At some point, an extra prize was introduced for exceptionally good behavior: a small piece of fabric. From the group’s standpoint, that was worth much more than the top ranking in a row of black dots. And it was tangible. You could prove your elite status, even out in the sandbox.
Eventually, a trading system developed between us kids. For a scrap of fabric, you could get a bucket of sifted sand. For two, you could get a piece of candy. Suddenly, we could trade labor (sifting sand) for status symbols or sweets.
Then one day, a new teacher arrived. For whatever reason, she much more generously handed out those scraps of fabric. She simply changed the rules governing their distribution. All of a sudden, everyone had them, and you had to spend four for a piece of candy instead of two. Some of the kids started to complain. Their hard-earned scraps of fabric were now worth less, and they demanded more of them.

As you’d expect, the fabric scraps were given out more and more freely. Before long, anyone could take as many as they wanted. Eventually, they were lying around all over the place. They were worthless. No one wanted them anymore. You couldn’t trade them for anything. And so, at just five years old, I experienced genuine hyperinflation.
What does this have to do with Bitcoin?
In kindergarten, the rules were simply changed. The new teacher wanted to be nice, we kids whined, and suddenly more and more fabric scraps were handed out.
The rules of Bitcoin simply cannot be changed.
It’s a completely different story with our fiat currencies. They too have rules. The problem is that no one can ensure those rules are actually followed. Here is an example: the European Central Bank is not allowed to permanently finance governments through bond purchases, yet it does so anyway, brazenly and with no one doing—or even being able to do—anything about it. And who would intervene anyway?
Here’s another example. The Maastricht Treaty’s Stability and Growth Pact stipulated that the budget deficits of EU member states could not exceed 3% of their GDP, although permissible exceptions were built in. However, between 2000 and 2010, the Stability Criteria were repeatedly violated without sanctions—not only by Greece (11 times) but also by larger countries such as Italy (seven times), France (six times), and Germany (five times). According to the Maastricht Treaty, there are clear sanctions for countries that unlawfully fail to adhere to the deficit limit. But not once has such a sanction been imposed. No attempt was ever even made.
This may have been politically expedient and justified for whatever reason, but it shows how difficult it is for us to adhere to the rules. It’s like the New Year’s resolutions that we make with the greatest of convictions, but then usually don’t stick to for very long. The result is what matters. Currencies inflate and, sooner or later, become worthless. The U.S. dollar has lost 97% of its value over the last hundred years. The British pound, which originally represented a pound of silver, has suffered the same fate. All because more and more new dollars, euros, or pounds have been created, or to put it differently, printed.
The outcome is the same: when the fabric scraps become worthless, everyone who holds them loses their wealth.
This cannot happen with Bitcoin. Its rules are fixed, and no one controls the system nor can they simply change those rules.

Discover more in Bitcoin: The Honest Money!
This excerpt is just the beginning. Dive deeper into how inflation devalues your money, your savings, and your time in Bitcoin: The Honest Money by Alex von Frankenberg, Ph.D. The paperback is available now.
Order your copy here!
This post The Hyperinflation of 1971 at the Kindergarten first appeared on Bitcoin Magazine and is written by Alex v. Frankenberg.
Bitcoin Magazine
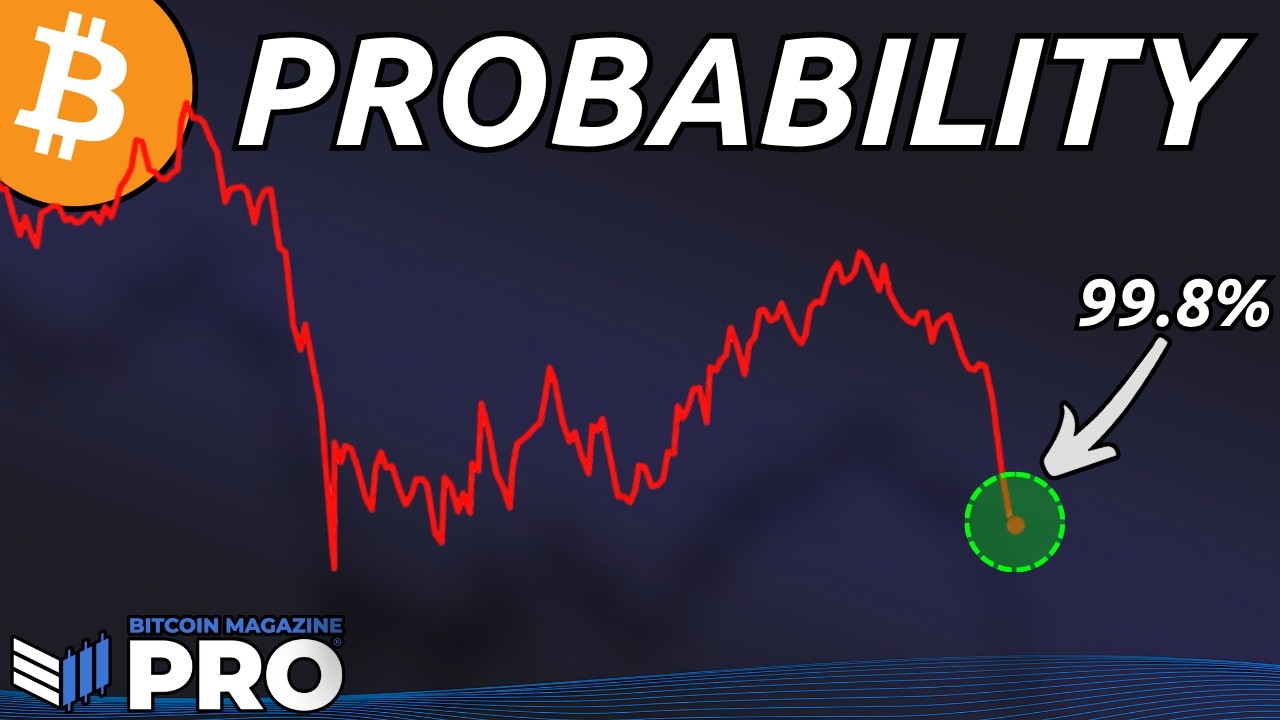
5th Worst Bitcoin Price Action Ever — I’m Buying At 99.8% Probability
The bitcoin price looks bad, but I’m buying. Price might go lower, it always can, but there is value at these levels, and I’m accumulating. I think it’s important to be honest about how I’m actually acting on the analysis I publish, rather than just presenting data from a distance. And right now, the data is saying something that has only been said a handful of times in Bitcoin’s entire history.
Let’s cut to the chase:
- The Crosby Ratio Z-score has one of the lowest readings in history.
- The RSI is at a level we’ve only encountered a handful of times in extreme market lows.
- Bitcoin has bounced off the 200-week moving average.
- The SOPR is in the bottom fifth percentile of all historical readings.
- The Mayer Multiple is also in its bottom fifth percentile.
The Crosby Ratio
The Crosby Ratio Z-score measures bitcoin’s price momentum and standardizes it for Bitcoin’s evolving volatility. It’s not a fixed threshold as it adjusts as the market matures and volatility compresses, making it applicable across every stage of Bitcoin’s history. The current reading is around -1.7. This means 99.8% of all days in Bitcoin’s history have registered a less extreme reading on this indicator.

Figure 1: The Crosby Ratio Z-Score has just dipped to one of its lowest ever values.
The list of instances where this reading has been as low: the recent drop to $60,000, the first break below $20,000 in 2022, the COVID crash in March 2020, and the 2018 bear market low. That’s it. Four occasions in over a decade of price history. Every single one of them turned out to be a significant accumulation opportunity.
The RSI
The Relative Strength Index is one of the most widely used momentum indicators across all markets. Bitcoin’s weekly RSI is currently at one of the lowest levels ever. The previous instances of readings this low were the 2015 bear market low, the 2018 bear market low, the COVID crash, and the recent drop to $60,000.

Figure 2: The Relative Strength Index is comparable to historical lows.
Two independent momentum indicators, measured completely differently, but producing the same short list of historical comparisons. That kind of confluence across methodologies isn’t something to dismiss.
The 200-Week Moving Average
The 200-Week Moving Average has served as bear market support throughout Bitcoin’s history. The only meaningful exception was the FTX collapse in late 2022, which caused a brief but sharp undershoot before a rapid recovery. Outside of that event, this level has held as a floor every single cycle.

Figure 3: Bitcoin currently sits just above its 200WMA.
View Live Chart
Bitcoin has just bounced off that level again. Directly beneath current prices sits the recent cycle low, creating the structure for a potential double bottom, one of the more reliable technical formations across any market. The 200-week moving average and the Bitcoin Realized Price converge in approximately the same zone, adding further weight to this level as meaningful structural support.
SOPR & The Mayer Multiple
The Spent Output Profit Ratio is currently in the bottom fifth percentile of all historical readings. This means the rate of realized losses across the Bitcoin network, the pace at which holders are selling at a loss, is in the deepest 5% of anything we’ve ever recorded. The selling that has driven this move has been predominantly short-term in nature; value days destroyed data confirms that long-term holders have largely not participated in this liquidation. These are short-term traders and leveraged positions being cleared out, and not the conviction holders capitulating.

Figure 4: The Spent Output Profit Ratio illustrates the severity of recent losses.
View Live Chart
The Mayer Multiple, which measures bitcoin’s price relative to its 200-day moving average, is simultaneously in its own bottom fifth percentile. When these two indicators have historically been in their lower extremes at the same time, the resulting accumulation opportunities have been exceptional. It has happened only a handful of times, and each instance has been followed by significant price appreciation.

Figure 5: The Mayer Multiple has reached levels corresponding to previous bear cycle lows.
To Sum It Up
I’ll be honest, the strength of the decline surprised me. I anticipated a pullback from the $80,000 resistance zone, but the move through $70,000 was sharper than expected. What hasn’t surprised me is the data that’s emerged as a result, because this kind of confluence across technical, on-chain, and momentum indicators has appeared before, and the market has consistently rewarded accumulation at these readings.
Could we go lower? Yes. The realized price sits not far beneath current levels and represents the next meaningful support zone if the low is revisited. I’m prepared for that scenario. But removing all emotion and looking purely at what the data is saying, five independent signals simultaneously in generational territory, this is not the moment to wait on the sidelines for a marginally better price.
Subscribe to Bitcoin Magazine Pro on YouTube for more expert market insights and analysis!
Disclaimer: This article is for informational purposes only and should not be considered financial advice. Always do your own research before making any investment decisions.
This post 5th Worst Bitcoin Price Action Ever — I’m Buying At 99.8% Probability first appeared on Bitcoin Magazine and is written by Matt Crosby.
Bitcoin Magazine

Bitcoin’s Pullback Tests Institutional Adoption Narrative as Pompliano Stays Bullish
Bitcoin’s recent price decline is testing one of the asset’s most prominent bullish narratives: that institutional adoption will stabilize volatility and support long-term growth.
Despite the downturn, ProCap Financial CEO Anthony Pompliano thinks that the broader trajectory remains intact, framing the current weakness as a natural phase in Bitcoin’s maturation into a mainstream financial asset.
Speaking on CNBC’s “Power Lunch,” Pompliano said Bitcoin’s integration into traditional finance is accelerating, pointing to growing interest from major institutions such as BlackRock CEO Larry Fink.
According to Pompliano, this shift represents the realization of a long-anticipated transition from a niche, ideologically driven asset to a widely held portfolio allocation.
“Bitcoin is maturing into a traditional finance asset,” Pompliano said, adding that institutional demand signals “what mass adoption looks like.”
Bitcoin has come under pressure in recent weeks, with prices retreating amid broader risk-off sentiment and capital rotation into equities, particularly in high-growth sectors like artificial intelligence and newly listed public companies.
The downturn has revived concerns that Bitcoin’s adoption cycle may be nearing saturation, limiting its ability to deliver the outsized returns seen in prior cycles.
Some argue that Bitcoin’s earlier growth was driven largely by rapid user adoption and speculative inflows — dynamics that may be harder to replicate now that the asset has reached a more mature phase.
As the CNBC host noted, the “adoption story” may have already peaked.
At the same time, some market participants, including Strategy’s Michael Saylor, have suggested capital could be rotating out of crypto into other high-momentum opportunities, including upcoming IPOs and AI-linked investments.
Pompliano: Rotation from bitcoin is natural, not structural
Speaking with CNBC, Pompliano pushed back on the idea that capital outflows signal structural weakness. Instead, he characterized the movement as typical portfolio rebalancing behavior.
“Capital chases momentum and returns,” he said, noting that Bitcoin’s liquidity makes it a convenient source of funds when investors pursue new opportunities.
The current market environment highlights a tension in Bitcoin’s evolution. While institutional adoption has broadened its investor base, it has also tied Bitcoin more closely to macroeconomic trends and cross-asset flows.
As a result, Bitcoin increasingly behaves like a risk asset during periods of market stress, declining alongside equities rather than acting as an uncorrelated hedge. This dynamic has complicated the narrative of Bitcoin as “digital gold,” particularly in the short term.
Still, Pompliano maintains that Bitcoin’s core fundamentals remain unchanged. He pointed to the network’s continued operation, decentralization, and predictable issuance schedule as evidence that the asset’s long-term value proposition is intact.
“Show me what has changed,” he said. “The network continues to do everything it is designed to do.”
Bitcoin as a ‘Savings Technology’
Pompliano reiterated his long-held view of Bitcoin as a hedge against fiat currency debasement, arguing that persistent government spending and monetary expansion underpin its long-term case.
He described Bitcoin as a “savings technology,” highlighting its historical compound annual growth rates — approximately 60% over the past decade and over 30% in the last three years — as evidence of its ability to preserve and grow capital over time.
In his view, Bitcoin’s role is less about short-term speculation and more about long-term wealth protection, akin to gold or real estate for previous generations.
This post Bitcoin’s Pullback Tests Institutional Adoption Narrative as Pompliano Stays Bullish first appeared on Bitcoin Magazine and is written by Micah Zimmerman.
Bitcoin Magazine

Bitcoin Price Plunges Below ‘Fire Sale’ Territory as Fear Index Reads 12 — Echoing the FTX Crash
Bitcoin price dropped to levels on Thursday that placed it below the “Fire Sale!” band on the Bitcoin Rainbow Chart — a depth not reached since the catastrophic FTX exchange collapse in November 2022 — as the Fear and Greed Index registered a reading of 12 out of 100, deep in “Extreme Fear” territory.
Bitcoin price opened today near $63,500 after sliding below $62,000 last night. That puts BTC below even the most discounted valuation band on the Bitcoin Rainbow Chart — a level the model historically flags as a rare and extreme buying signal.
The Bitcoin Rainbow Chart is somewhat of a logarithmic growth curve overlaid with color-coded sentiment bands. The deepest band — labeled “Basically a Fire Sale!” — represents the lowest tier of the model’s projected fair value range. When Bitcoin trades beneath it, the asset sits outside the historical channel that has contained BTC’s long-term price behavior.
JUST IN: Bitcoin is now below the "Fire Sale" territory for the second time in 4 years
— Bitcoin Magazine (@BitcoinMagazine) June 4, 2026
Buy the dippic.twitter.com/oU6qudhn6M

The last confirmed breach of the “Fire Sale!” floor occurred during the FTX exchange collapse in November 2022, when Sam Bankman-Fried’s crypto empire imploded and BTC cratered under forced selling pressure across the market. That event remains one of the most severe liquidity crises in crypto history.
Per Bitcoin Magazine Pro data from March 2026, Bitcoin price had already begun testing below the “Fire Sale!” zone — described at the time as “its first drop into this area since the FTX-induced crash”.
The renewed descent on June 4 deepens that breach, with the coin shedding ground for the second consecutive week.
Bitcoin price and market in ‘Extreme Fear’
The Fear and Greed Index, which runs on a scale of 0 to 100, registered 12 on Thursday — placing the market squarely in “Extreme Fear”. The index aggregates volatility, market momentum, social sentiment, and derivatives data into a single score.
A reading below 25 signals extreme fear, a condition that, by the index’s own framework, has historically preceded price recovery periods.
February 2026 saw the index touch an all-time low of 5, driven by a 52% drawdown from Bitcoin price’s peak of $126,000. Thursday’s reading of 12 sits just above that nadir, as Bitcoin price continues its slide from cycle highs.
On X today, Strategy’s Michael Saylor argued the sell-off reflects institutional capital rotating into AI infrastructure rather than a deterioration in Bitcoin’s fundamentals. The decline may have been compounded by concerns over Strategy selling 32 BTC to fund preferred-share dividends — its first bitcoin sale since 2022 — despite the company recently reducing debt by repurchasing $1.5 billion of convertible notes at a discount.
This post Bitcoin Price Plunges Below ‘Fire Sale’ Territory as Fear Index Reads 12 — Echoing the FTX Crash first appeared on Bitcoin Magazine and is written by Micah Zimmerman.
Bitcoin Magazine

Schwab Strategist: Bitcoin’s $60,000 Mining Cost Could Mark the Cycle Bottom
Bitcoin is in a bear market. That much is not in dispute.
What Jim Ferraioli, Director of Digital Currencies Research and Strategy at Charles Schwab, argued Wednesday on Bloomberg is more precise and more structural: this selloff has a measurable cost floor, and that floor is built not from sentiment or chart patterns, but from the physics of energy consumption.
The numbers frame the drawdown in context. Bitcoin peaked at $126,000 in the fall before collapsing to roughly $60,000 in February — a 50% correction that, while brutal for recent buyers, falls far short of the 75%-plus implosions that defined prior Bitcoin bear markets.
Ferraioli’s core analytical framework centers on one question: what does it cost to manufacture Bitcoin? The answer creates a natural gravitational floor that has held across multiple cycles.
For the most efficient miners — those operating at scale with next-generation ASIC hardware and access to the cheapest wholesale energy — the cost to produce one Bitcoin sits at approximately $60,000, Ferraioli said.
That figure is not arbitrary. It represents the all-in expense of powering a facility at roughly $0.07 per kilowatt-hour with the most advanced semiconductor fleets available.
The less efficient miners — those with older ASIC hardware, higher energy costs, and thinner operational margins — carry a production cost of approximately $95,000 per BTC, according to Glassnode data cited in Schwab’s May 2026 research report. That gap between $60,000 and $95,000 defines Bitcoin’s current valuation range.
Bitcoin’s energy floor: Why $60,000 may mark the bottom
Ferraioli argues that in deep bear markets, the cost of production for the best miners has historically served as the bottom. February’s low near $60,000 aligns almost precisely with that level, as well as BTC’s 200-week moving average.
The BTC selling pressure is not random. It is demographically specific. The investors driving forced liquidations are those who acquired Bitcoin during the past 18 months — buyers who rode the asset from sub-$80,000 up to $126,000 and then watched gains evaporate in full.
Schwab tracks two cost-basis metrics to quantify this pressure: the average acquisition cost for U.S. spot ETF and ETP holders, which stands near $83,000, and the active investor cost basis — excluding coins rewarded to miners — which sits near $78,000.
Both figures sit well above current spot prices, putting the majority of recent entrants into unrealized loss positions and reinforcing $83,000 as a ceiling of overhead supply rather than a floor of support.
Glassnode’s on-chain data corroborates this dynamic. Bitcoin’s latest attempted rally stalled at the aggregate ETF cost basis near $83,000, with total realized losses spiking to $1.35 billion per day and long-term holders capitulating from cycle-top positions. Hedge funds represent roughly 30% of spot ETP ownership but are operating market-neutral, executing basis trades rather than taking directional views — meaning they provide no natural bid when prices fall.
Here is where Ferraioli’s analysis turns constructive. Every major publicly traded Bitcoin miner has announced a pivot toward high-performance computing (HPC) for AI inference workloads. The economics on their face appear to favor abandoning mining: inference generates higher net revenue per megawatt-hour than Bitcoin mining during peak demand windows.
But demand for AI inference is not uniform across 24 hours. Models run hard during business hours and sit idle overnight and on weekends.
That creates a structural opportunity that does not displace BTC mining — it layers on top of it. Schwab’s analysis models Bitcoin as the optimal baseload monetization of power during off-peak hours, with inference overlaid during peak business-hour demand.
A data center operating this hybrid model maximizes utilization across the full 24-hour cycle rather than leaving capacity dark when inference demand falls away. For miners, this translates to more stable revenue, reduced forced BTC sales to cover operating costs, and lower structural risk across bear market cycles.
Bitcoin is backed by energy
The underlying thesis is one of energy economics. Bitcoin has no earnings, no free cash flow, and no CEO issuing guidance. Its value, in Ferraioli’s framework, derives from the energy cost required to produce it — a cost that is transparent, verifiable, and historically durable.
In commodity markets, price cannot sustainably trade below cost of production. Producers shut down, supply contracts, and equilibrium resets higher.
Bitcoin follows this same logic: when spot prices fall toward $60,000, the least efficient miners shut down operations, the network’s hash rate adjusts through Bitcoin’s difficulty mechanism, and the cost to produce each new coin falls.
As of May 2026, the average mining cost across all Bitcoin miners sits near $85,604, with the Bitcoin price trading in the mid-$60,000s — meaning the network as a whole is operating at a loss, a configuration that has historically preceded recoveries, not further collapse.
This post Schwab Strategist: Bitcoin’s $60,000 Mining Cost Could Mark the Cycle Bottom first appeared on Bitcoin Magazine and is written by Micah Zimmerman.
CryptoSlate
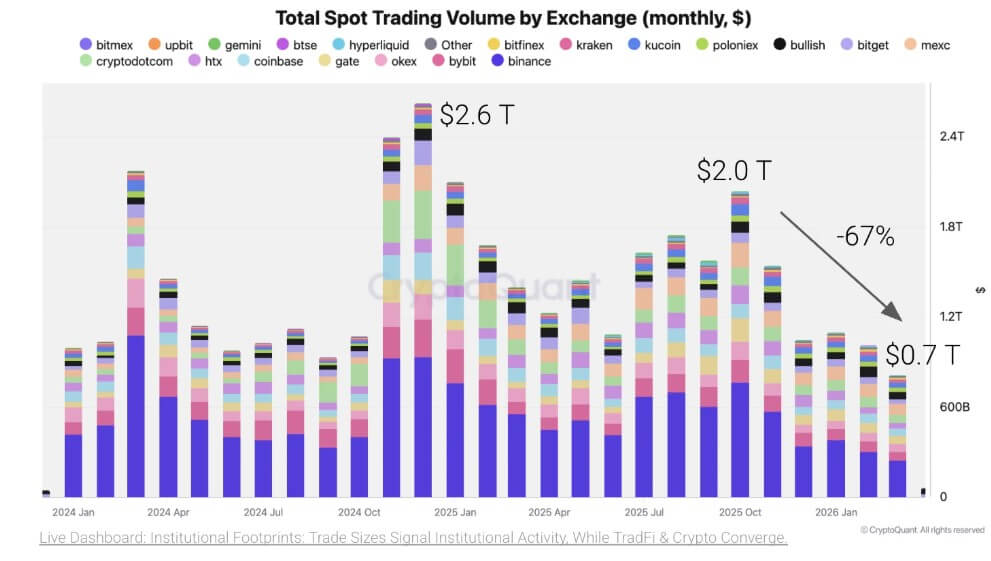
Crypto exchanges are seeing the weakest retail-driven activity in years, but some of the biggest platforms are finding a lucrative new source of volume in Wall Street-style bets on gold, silver, oil, stocks, and indexes.
According to a CryptoQuant report shared with CryptoSlate, the shift is emerging during one of the weakest trading periods for centralized crypto platforms in more than two years.
Spot trading volume fell to $679 billion in April, the lowest monthly level since October 2023, as lower prices and fading retail participation reduced market activity.
At the same time, some exchanges are seeing growth in products that look less like crypto speculation and more like traditional macro trading.
As a result, perpetual futures tied to metals, energy, and equities have become one of the fastest-growing segments on several major crypto venues. This shows how platforms built for Bitcoin and Ethereum are expanding into Wall Street-style markets that trade around the clock.
Retail volume falls to multi-year lows
The collapse in spot market turnover illustrates the sheer magnitude of the post-2025 market contraction.
According to the CryptoQuant report, centralized exchange spot volume in April plummeted 46% year-over-year, and sits a staggering 67% below the market top recorded in October 2025.
That contraction has hit the industry’s core business model, which depends on frequent trading, market volatility, and steady participation from retail users.
Still, Binance remained the largest spot venue by cumulative trading volume in 2026, with $1.3 trillion. Bybit followed with $285 billion, while Gate recorded $253 billion and Crypto.com processed $247 billion.
While these top-tier platforms still capture the lion's share of available trading flow, the underlying data indicate a far less casual ecosystem of participants.
Historically, retail traders are the first demographic to retreat during protracted crypto downturns. Casual investors often exit the market entirely after incurring losses or drastically reduce their positions when prevailing momentum stalls.
Conversely, professional trading desks, automated market makers, and institutional arbitrageurs maintain their presence, as their strategies rely on hedging, executing relative-value trades, and providing market liquidity rather than chasing directional price movements.
This demographic transition has squarely placed the weakness in the derivatives sector, a domain previously dominated by aggressive retail speculation.
Perpetual futures volume has cascaded 53% from its October 2025 highs, closely mirroring the spot market contraction. Binance retains its dominant market share in the perpetual futures space, followed by MEXC, OKX, Bybit, and Gate.
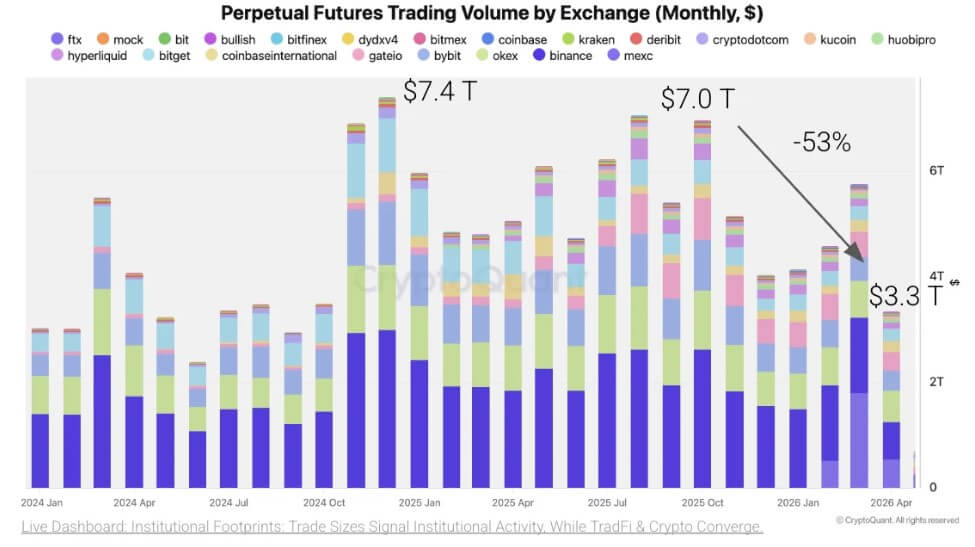
The parallel decline in both spot and leveraged trading indicates that users are not merely rotating among product types; overall demand for digital asset exposure has fundamentally weakened.
Larger trades point to a different customer base
Despite the pronounced drop in absolute trading volume, a granular look at average transaction sizes reveals a market that is steadily institutionalizing.
Average trade size is an imperfect signal, as large transactions can come from institutions, market makers, high-net-worth traders, or professional accounts. Smaller retail orders tend to pull the average down. Still, the metric helps show where bigger participants are most active.
In 2026, Gate logged the highest average Bitcoin spot trade size among major centralized venues, registering approximately $4,000 per transaction. This figure remains elevated even after cooling from a peak of $6,200 during a wave of institutional onboarding in 2025.
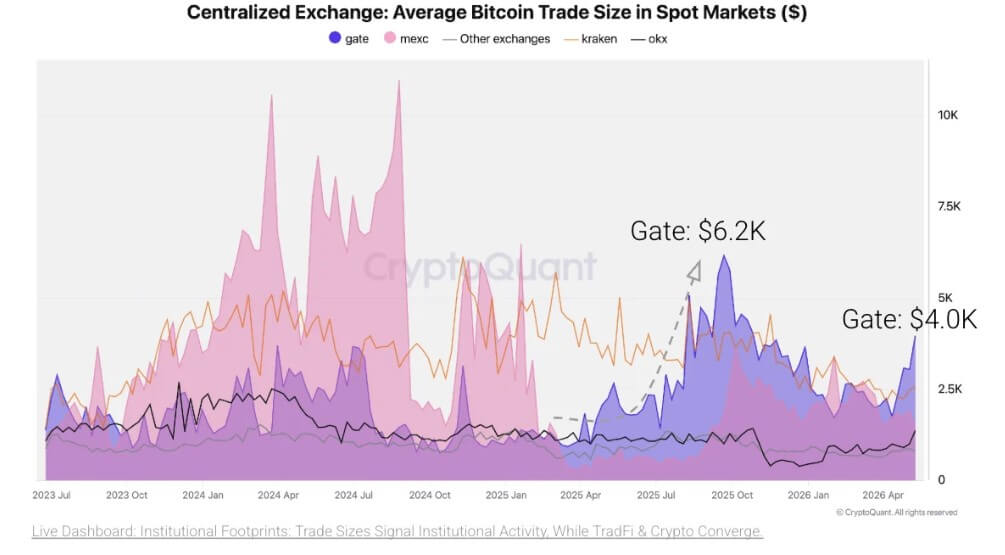
CryptoQuant pointed out that several crypto trading platforms, including Kraken, MEXC, and OKX, similarly ranked at the top of the industry for average Bitcoin spot trade sizes.
Kraken’s presence aligns with its long-standing reputation as a compliance-focused hub for professional entities, while OKX and MEXC have cultivated substantial global bases capable of executing bulk orders.
Meanwhile, this institutional footprint is even more pronounced in derivatives trading.
According to CryptoQuant, Gate led the market in average Bitcoin perpetual futures trade size in 2026 at roughly $8,900.
At the height of the 2025 market cycle, this metric briefly reached an astonishing $24,700 in August before normalizing. Kraken and OKX also maintain leading positions in derivatives trade sizes.
This trend suggests Gate has become a more important execution venue for larger Bitcoin trades in both spot and derivatives markets.
Kraken and OKX also remained among the leading venues by average Bitcoin futures trade size, reinforcing the divide between platforms that attract larger execution and those that rely more heavily on broad retail flow.
Notably, this consistency extends to Ethereum markets where Kraken, Gate, MEXC, and OKX continue to dominate average Ethereum spot trade sizes. Gate has also firmly established its presence in this top tier following sustained growth that began in early 2024.
This uniform pattern across multiple assets and product lines indicates that the shift toward wholesale, large-scale execution is a structural market evolution rather than an isolated anomaly.
Liquidity concentrates around fewer venues
This professional consolidation is heavily dependent on the underlying market structure, specifically order-book depth. Institutional participants require deep liquidity to enter and exit substantial positions without triggering severe price slippage or widening bid-ask spreads.
In Bitcoin spot markets, Gate and Binance have maintained among the deepest 1% order books among major exchanges, averaging roughly 200,000 to 250,000 BTC in depth over the period tracked.
The perpetual futures market, while inherently more competitive, displays a similar concentration of liquidity. Gate regularly leads the pack, offering Bitcoin perpetual depth ranging from 750,000 to 1.3 million BTC daily.
Hyperliquid, the leading DEX platform, has surprisingly emerged as a formidable decentralized competitor, maintaining depth above 600,000 BTC.
Meanwhile, traditional heavyweights like Binance and OKX remain robust, generally fluctuating between 500,000 and 850,000 BTC in depth.
These figures show why liquidity has become a central battleground where exchanges with deep books can attract larger traders. In turn, these larger traders can bring greater liquidity, reinforcing the venue’s position as a preferred execution hub.
In a market where retail volume is falling, that feedback loop becomes more important. Platforms with thinner books may struggle to compete for professional activity, while larger venues can use liquidity to expand into new products beyond crypto.

Crypto exchanges push into macro trading
Having secured deep liquidity and professional clientele, the most dominant crypto platforms are now leveraging their infrastructure to encroach on traditional finance.
CryptoQuant noted that trading volume for traditional-finance perpetual futures on crypto exchanges surged in 2026, reaching about $450 billion per month in March. Metals-linked contracts drove most of the activity, with gold and silver accounting for more than 90% of volume during the peak month.
The timing tracks a broader macro backdrop, with gold and silver rallying as investors reacted to inflation concerns.
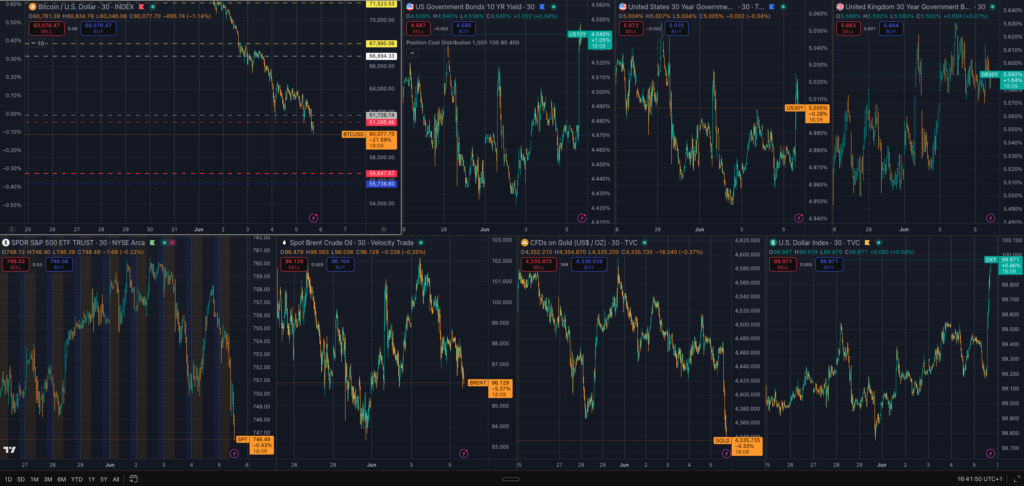
At the same time, equities reached new highs amid optimism about artificial intelligence, while oil markets became more volatile amid geopolitical tensions involving the United States and Iran.
Crypto exchanges capitalized on this macro turbulence to offer traders a familiar structure in a different venue: perpetual futures that trade 24 hours a day, seven days a week.
Perpetual futures are common in crypto because they allow traders to take leveraged long or short positions without an expiration date.
Extending that structure to gold, silver, oil, and stock-linked products gives crypto-native platforms a way to compete for macro trading activity that has traditionally been concentrated within brokerages, futures exchanges, and contracts-for-difference platforms.
CryptoQuant stated that the early demand has been strongest in metals. Gold and silver became the primary gateway for traders on crypto exchanges to express views on traditional markets.
More recently, oil-linked products have grown as energy volatility increased. Meanwhile, equity-linked contracts remain smaller, but they indicate that exchanges are testing a wider range of traditional assets.
Gate and Binance dominate the new segment
Still, CryptoQuant noted that the booming market for traditional-finance futures is largely dominated by a few exchanges.
For context, Gate handled nearly $290 billion in TradFi futures volume in March, far ahead of other platforms. This jump was mostly driven by gold and silver trading.
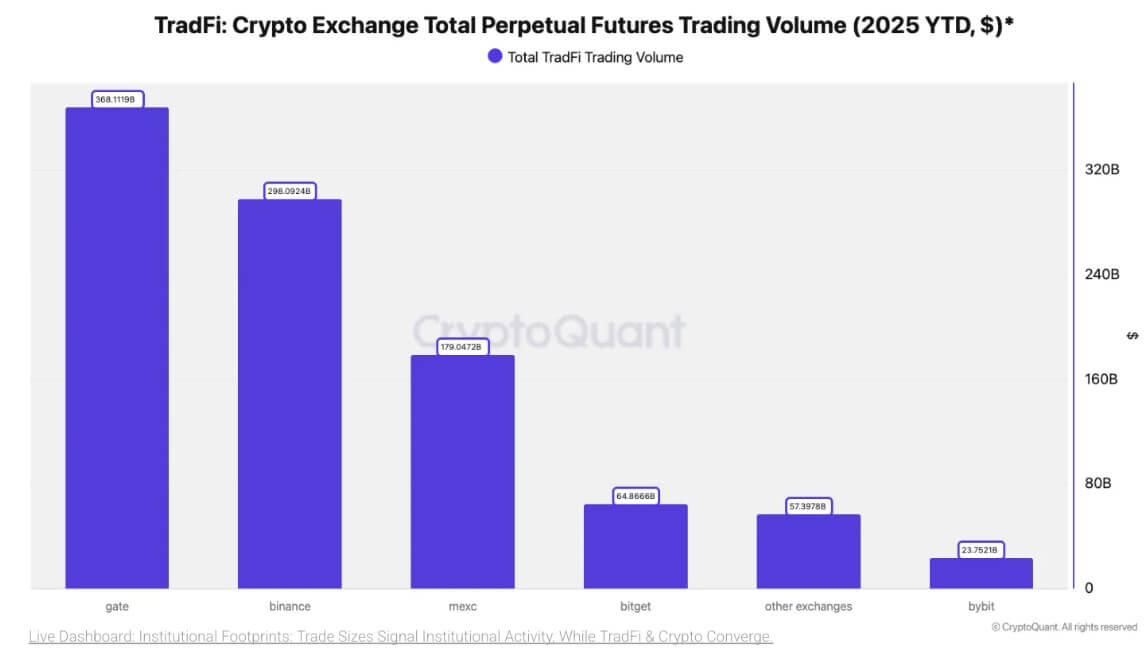
Binance ranked second, hitting $109 billion in March and maintaining high activity through May at $64 billion. MEXC, Bitget, and Bybit also saw increases as traders looked beyond metals into other asset classes.
Looking at the year as a whole, the market is highly concentrated. So far in 2026, Gate leads with about $368 billion in TradFi futures volume. Binance follows with $298 billion. Together, these two exchanges account for about two-thirds of the entire market.
MEXC is next with $179 billion, followed by Bitget with $65 billion. Bybit, despite being a major player in crypto derivatives, has handled a smaller $24 billion in traditional futures.
These numbers show how crypto exchanges are trying to adapt to the current market situation. Their original business relied on volatile digital tokens and everyday people making speculative bets.
Now, the focus is shifting to professional traders, deep market liquidity, and giving users access to traditional assets around the clock.
The post Crypto exchanges are losing retail traders but are filling the gap with Wall Street-style bets appeared first on CryptoSlate.
A group of Republican senators is warning US bank regulators that a little-known capital rule could effectively keep banks out of Bitcoin, even as Congress moves to give traditional financial firms a larger role in digital asset markets.
In a May 27 letter to Federal Reserve Vice Chair for Supervision Michelle Bowman, FDIC Chair Travis Hill, and Comptroller of the Currency Jonathan Gould, six senators urged the agencies to build a new capital framework for on-balance-sheet digital asset activities.
Their target is Basel's 1,250% risk weight for assets such as Bitcoin, which they argue functions as a de facto ban on banks holding crypto.
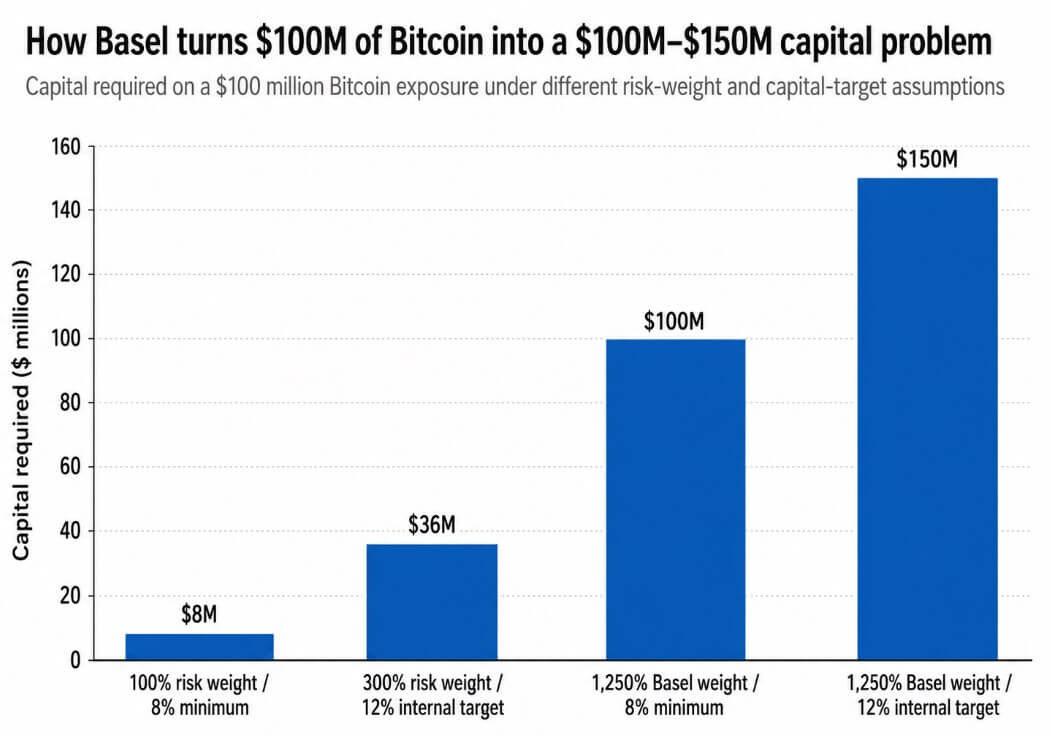
A 1,250% risk weight multiplied by the 8% minimum capital requirement equals a 100% capital allocation, meaning a bank holding $100 million in Bitcoin needs at least $100 million in capital against it.
For banks that manage to meet internal CET1 targets above the regulatory floor, the burden climbs further. A bank with a 12% internal capital target would need $150 million in capital for that same $100 million exposure, requiring roughly $18 million in annual net profit to clear a 12% ROE hurdle.
Normal custody, trading, or client-service economics rarely generate returns at that threshold, leaving a bank legally authorized to hold Bitcoin but financially unable to justify doing so.
Why this lands now
The Senate Banking Committee advanced the CLARITY Act on May 14 by a 15-9 vote, sending it to the Senate floor.
If passed, the bill would give banks a clearer statutory role in digital asset markets, but the senators argue that legislative permission without capital efficiency leaves banks holding a permission slip they cannot afford to use. A bank can be legally authorized to hold Bitcoin and still be structurally prevented from doing so by a capital charge that makes the position uneconomic before the first trade.
The three regulators the letter addresses have each moved toward crypto permissiveness since early 2025.
The OCC reaffirmed in March 2025 that national banks may engage in crypto custody, stablecoin-related activities, and distributed-ledger payment functions, while removing the prior supervisory non-objection requirement.
The FDIC followed that same month, rescinding its notification requirement and allowing FDIC-supervised institutions to pursue permissible crypto activities without prior approval.
The Fed withdrew its guidance on crypto assets and dollar tokens in April 2025, framing the move as support for innovation.
All three agencies opened the door to crypto activity and left the Bitcoin capital question untouched.
The senators found their sharpest argumentative foothold in a March 2026 interagency FAQ on tokenized securities.
| Regulator | Recent crypto-friendly move | What it allowed or eased | What remains unresolved |
|---|---|---|---|
| OCC | March 2025 guidance | Crypto custody, stablecoin activity, DLT payments; removed non-objection requirement | Capital treatment for bank-held Bitcoin |
| FDIC | March 2025 guidance | Permissible crypto activities without prior FDIC approval | Capital treatment for direct crypto exposure |
| Fed | April 2025 withdrawal | Pulled prior crypto/dollar-token guidance | Capital treatment for on-balance-sheet Bitcoin |
| Fed / FDIC / OCC | March 2026 FAQ | Tokenized securities generally treated like underlying securities | Whether that logic applies to native cryptoassets |
The joint guidance from the Fed, FDIC, and OCC held that eligible tokenized securities should generally receive the same capital treatment as their non-tokenized equivalents, and that the technology used to record or transfer ownership should not determine capital allocation.
If a tokenized Treasury is treated like a Treasury because the underlying risk profile governs its treatment, the logic should extend to Bitcoin, and the asset's volatility and operational risks are measurable and can support a calibrated framework.
The March 2026 guidance covers eligible tokenized securities, and the senators are pressing regulators to carry the same technology-neutral logic forward to native digital assets.
The prudential case for the rule
The Fed, FDIC, and OCC's 2023 joint statement noted price volatility, legal uncertainty regarding custody and ownership rights, contagion from exchange and counterparty failures, governance weaknesses in crypto networks, and operational risks associated with open or decentralized infrastructure.
The Basel standard was built around those risks after the 2022 crypto collapse exposed how quickly losses could spread to interconnected institutions.
A dollar-for-dollar capital charge reflects a genuine judgment that Bitcoin's risk profile does not resemble the assets that populate traditional bank balance sheets.
The senators argue that the risks of volatility, custody complexity, and operational exposure are quantifiable, and a calibrated capital framework can address them without requiring capital equal to or greater than the exposure itself.
The Basel Committee agreed in November 2025 to expedite a targeted review of elements of its cryptoasset standard, and reported progress on that review in February 2026.
Basel Chair Erik Thedéen has said the global crypto rules for banks need to be reworked after the US and UK both declined to implement the current framework.
A coalition of major financial industry groups wrote to Basel in August 2025, arguing that the standard would make meaningful bank participation uneconomical and requesting a pause and revisions.
The senators are pressing US regulators to act at a moment when the international architecture underpinning the 1,250% treatment is under open review.
Two paths from here
If regulators respond by proposing a calibrated framework for liquid digital assets instead of the blanket Basel weight, the capital required on $100 million of Bitcoin exposure could fall from the current $100 million-$150 million range to something closer to $8 million-$36 million under a 100%-300% risk-weight band and standard capital targets.
| Scenario | Capital treatment | Bank role in crypto | Likely market effect |
|---|---|---|---|
| Calibrated framework | 100%-300% risk-weight band; $8M-$36M capital on $100M exposure | Banks can hold inventory, support market-making, custody, prime brokerage and structured products | More institutional liquidity; tighter spreads; banks become balance-sheet participants |
| Basel rule remains | 1,250% risk weight; $100M-$150M capital on $100M exposure | Banks mostly provide custody, settlement and services, but avoid direct BTC exposure | Bitcoin access remains routed through ETFs, nonbanks and offshore venues |
At that level, bank market-making, custody, prime brokerage, and structured crypto products become viable lines of business. Institutional liquidity improves, spreads compress, and banks move from service providers to balance-sheet participants.
If regulators keep 1,250% treatment as the practical standard for native crypto on-balance-sheet exposure while continuing to open other pathways, banks would continue offering custody and settlement, while direct Bitcoin exposure stays with nonbanks and ETF wrappers.
US-traded spot Bitcoin ETFs already saw roughly $4.4 billion in outflows through May 15 to June 3, showing that institutional access to Bitcoin has routed around bank balance sheets.
That channel will deepen if the capital rule stays intact.
The letter does raise the political cost of inaction while Congress is actively writing the market structure rules that will govern bank participation in digital assets for the next decade, and legal authorization to hold Bitcoin means little if the capital charge required to do so makes the position uneconomic from the first day it hits the balance sheet.
The post A little-known 1,250% rule could lock US banks out of Bitcoin appeared first on CryptoSlate.
Charles Hoskinson raised the possibility of splitting Cardano after the collapse of one of its best-known ecosystem tools exposed a deeper fight over money, governance, and who has the power to keep builders alive on the network.
This week, the Cardano founder floated what he called a “nuclear option,” saying a new Cardano could be launched through proof of burn if the existing ecosystem cannot change how it funds and commercializes projects.
The statement came after TapTools, one of Cardano’s most widely used analytics and infrastructure platforms, said it would begin winding down operations over the next two weeks following leadership departures, mounting costs, and the loss of key technical capacity.
Hoskinson responded with a long, emotional address that turned a project closure into a broader indictment of Cardano’s governance and commercial strategy.
Hours later, he posted on X:
I’m taking a break. TTYL.


More Cardano DeFi apps will die, Hoskinson warns
Hoskinson said TapTools’ closure was unlikely to be an isolated failure, saying:
This year is going to be very hard, especially the second half of the year for Cardano. We are probably going to see more dApps in DeFi die and a consolidation happen
The warning landed as Cardano’s DeFi economy remained small by broader crypto standards and under renewed strain.
DeFiLlama data showed about $115 million in total value locked on Cardano, with the network’s DeFi TVL down more than 5% over 24 hours. Cardano’s 24-hour DEX volume stood near $6.3 million, while its stablecoin market was roughly $55 million.
Those figures point to the commercial problem behind Hoskinson’s remarks. Cardano still has a large brand and a committed community, but the financial activity available to sustain infrastructure providers, exchanges, lending apps, and analytics platforms remains limited.
For teams that rely on subscriptions, API revenue, token activity, treasury funding, or outside investment, a thin market can quickly become an operating crisis.
Indeed, TapTools had framed its closure as the result of that pressure rather than a loss of belief in Cardano.
The platform said it had served more than 1 million users, supported hundreds of projects through its API, published hundreds of articles, and generated hundreds of millions of social impressions for Cardano builders.
However, the team said the departure of co-founders, including its chief technology officer and chief operating officer, had created a gap it could not quickly repair. A backend developer had stepped into the CTO role, but that replacement also decided to leave.
The company said it had tried to lower infrastructure costs, improve efficiency, and develop new products. Still, it concluded that it could not responsibly commit to the future without a credible acquisition path or fresh resources.
For Hoskinson, the announcement confirmed a problem he said had been visible for months. He said TapTools had been part of his daily routine and called its closure a loss for the broader ecosystem.
He also pointed to JPEG Store as another sign that older Cardano projects were struggling to survive the current cycle. He added:
I would suspect others are coming very soon. There’s going to be a wave of failures in the ecosystem.
The founder says he does not hold the levers
Hoskinson’s central argument was that Cardano’s public market still treats him as the person responsible for the network’s direction, even though the formal powers needed to change that direction now sit elsewhere.
He said he does not control Cardano’s treasury, does not hold governance keys, cannot initiate a hard fork, cannot change protocol parameters, and does not own the Cardano trademark.
He said the resources created to grow and govern the ecosystem were assigned to separate entities rather than to him personally.
The comments cut into one of Cardano’s most sensitive political tensions. The network has spent years moving toward community governance, with delegated representatives, treasury rules, and other bodies taking on greater responsibility for funding and protocol decisions.
That structure limits founder control by design. It also means there is no single executive authority able to rescue struggling businesses, redirect treasury funds, or impose a commercial strategy when market conditions worsen.
Hoskinson said he had proposed multiple ways to prepare for that pressure, including a sovereign wealth fund, stablecoin reserves, an ecosystem index, and acquisitions of struggling infrastructure projects.
He argued those efforts were either rejected, delayed, or criticized by voters and community members who opposed spending treasury funds or feared centralization.
He noted:
There is a deranged psychopathy that has infected Cardano. You can see it at the bottom of each of my tweets. There are people whose only purpose now is to attack me. Every video I make, every tweet, every output, it is a growing chorus.
His frustration was aimed at that contradiction. When he tries to acquire or commercialize projects, he said critics accuse him of consolidating power. When he does not intervene, those same critics blame him for allowing builders to fail.
He stated:
You do not want commercialization, but then you punish everybody when commercialization does not occur. You say Cardano is not a ghost chain, but the things needed to prevent that, you do not care about.
Cardano's treasury politics move into the market
The speech landed at a difficult moment for Cardano as the blockchain network's ADA token fell below $0.20 for the first time in more than five years.
This extends a yearlong decline that has erased much of the token’s value and deepened pressure on builders whose businesses depend on user activity, treasury funding, or investor confidence.
Meanwhile, the decline has also sharpened the debate over whether Cardano’s governance system can fund growth quickly enough to keep pace with rival blockchain ecosystems.
According to Hoskinson:
Every person who has tried to use the treasury for commercialization gets attacked. Every program has to be pushed through with enormous effort to reach two-thirds voting, and most people do not have the political power, will or grit to get through that process.
For context, Cardano’s flagship 2026 Summit in Singapore was canceled after a treasury funding proposal failed to meet the two-thirds approval threshold required under the network’s governance rules.
Hoskinson argued that Cardano’s technology has continued to advance, citing expected work such as Leios. But he said technology alone would not be enough if the ecosystem could not fund businesses, support builders, and create incentives for commercial use.
His remarks were unusually blunt. He accused parts of the community of creating a hostile environment for builders and said some critics appeared more interested in proving Cardano had failed than helping the network recover.
According to him:
We as a community have to have a schism. We can no longer admit people whose only purpose is to burn the entire ecosystem down. It is the builders versus the non-builders, the doers versus the pessimists and cynics.
He said teams seeking treasury money or commercial support are often attacked before and after funding votes, making the system unattractive for serious operators.

A break raises the stakes
Hoskinson did not announce a formal exit from Cardano. His later post saying he was taking a break appeared to reflect exhaustion with the public fight rather than a resignation from the ecosystem.
Still, the timing amplified the message. A founder who remains Cardano’s most recognizable public advocate had just told the community that more projects may collapse, that he lacks the authority to stop it, and that the network must choose leadership, strategy, and funding mechanisms or risk managing decline.
Meanwhile, he pointed out that his “nuclear option” could be a way to separate builders from hostile critics and reset tokenomics and institutional funding.
He stated:
There are options. We could launch a new Cardano and have a proof of burn. That would be the most extreme option because those people would not migrate. They would be left behind in the environment they created, with no market, no volume and no commercialization. That is the nuclear option.
That suggestion reflected how far the conflict has moved from routine governance debate. Hoskinson’s complaint is no longer simply that voters rejected a proposal or that ADA’s price has fallen.
He argues that Cardano lacks an executive function capable of turning treasury resources, technical progress, and community support into a coordinated growth plan.
The consequences are now visible through business closures. TapTools said it remained open to acquisition or sustainable funding, but its shutdown notice gave Cardano a concrete example of what can happen when useful infrastructure cannot cover costs or retain key staff.
Considering this, Hoskinson told delegators to examine whether their DReps are helping the ecosystem grow or blocking the decisions needed to support builders.
He urged the community to take a week, study the failures, and decide whether it wants constitutional changes, treasury changes, executive changes, or even a more radical protocol path.
The post Cardano founder floats splitting his own blockchain after warning more apps will die appeared first on CryptoSlate.
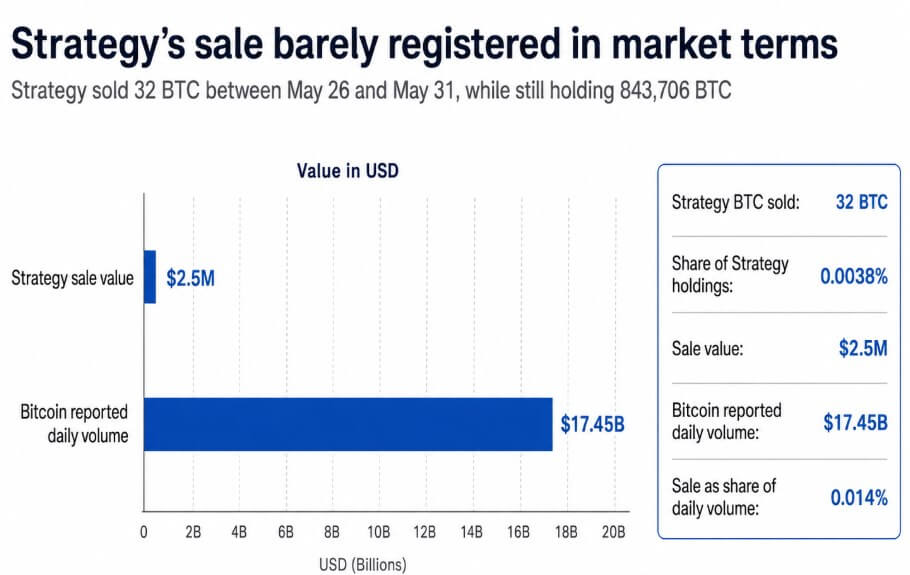
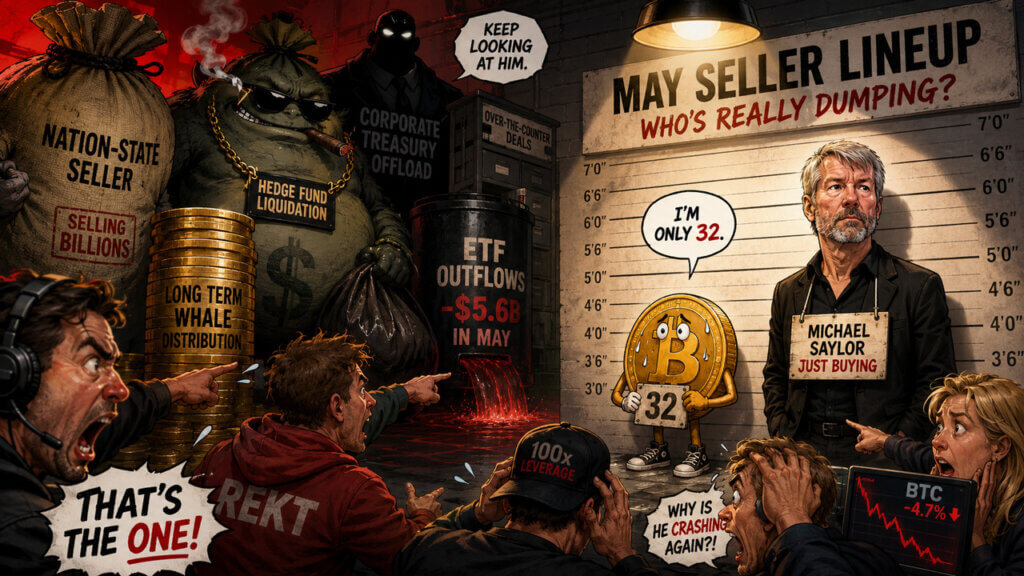
Bitcoin traders have identified Michael Saylor as a new suspect in the latest sell-off, while the numbers tell a different story.
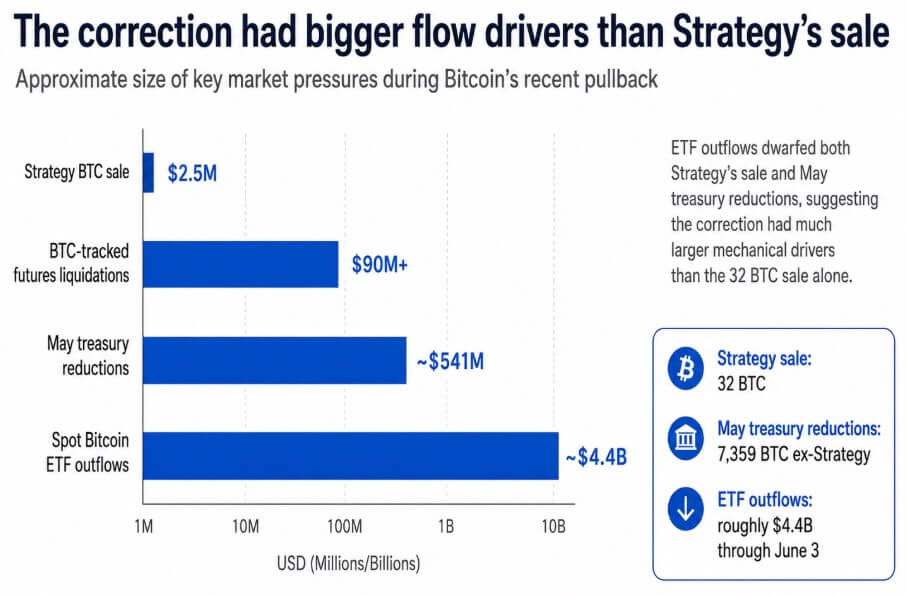
Strategy disclosed in a June 1 Form 8-K that it sold just 32 BTC between May 26 and May 31 for $2.5 million, at an average net price of $77,135, with proceeds earmarked to fund preferred-stock distributions.
The company still held 843,706 BTC as of May 31, with that sale representing 0.0038% of Strategy's total holdings and roughly 0.014% of Bitcoin's reported daily volume of $17.45 billion on that day.
A sale of that size carries no supply-side weight against a $17 billion daily market, and it lands as a narrative event that cracks a story traders had built their confidence on.
Bitcoin fell below $71,500 after the disclosure, a drop also attributed to Iran-related geopolitical tensions and over $90 million in BTC-tracked futures liquidations, making Strategy's sale one of several.
The bigger sellers hiding in May
Four other companies accounted for the bulk of public treasury Bitcoin reductions in May, and their combined total dwarfed Strategy's sale.
According to BitcoinTreasuries, public-company Bitcoin reductions totaled roughly 7,500 BTC during the month, with Strategy's 32 BTC counted in the following month's tally because of its June 1 filing date.
Excluding Strategy, MARA cut 3,386 BTC, Core Scientific reduced by 1,990 BTC, Sequans shed 1,481 BTC, and Prenetics exited 502 BTC, a combined 7,359 BTC.
At Bitcoin's May 31 price of $73,579, that reduction carried a face value of roughly $541 million, about 230 times the size of Strategy's sale.
| Company | BTC reduction | Approx. value at $73,579 BTC | Context |
|---|---|---|---|
| MARA | 3,386 BTC | ~$249M | Linked to March note repurchase activity |
| Core Scientific | 1,990 BTC | ~$146M | Backdated-entry methodology caveat |
| Sequans | 1,481 BTC | ~$109M | Debt redemption / treasury strategy unwind |
| Prenetics | 502 BTC | ~$37M | Full exit from BTC treasury position |
| Total | 7,359 BTC | ~$541M | Not a coordinated May dump |
BitcoinTreasuries noted that its May recap used a methodology that incorporated backdated entries and specifically flagged Core Scientific's 1,990 BTC reduction as one that would not have appeared under its previous method.
MARA's larger reduction also traced back to a March disclosure, when the company sold 15,133 BTC between Mar. 4 and Mar. 25 to fund $1 billion in convertible-note repurchases, not a fresh May decision.
Sequans was unwinding a failed Bitcoin treasury strategy to redeem debt, and Prenetics had already authorized a full exit from Bitcoin to redirect capital toward its IM8 health business.
Each reduction had its own logic and timeline, and none reflected a shared judgment that May was a good time to sell.
The net picture from BitcoinTreasuries makes the dump thesis harder to sustain, as public Bitcoin treasury companies added or disclosed 51,000 BTC before the May reductions and 43,500 BTC net after the reductions.
Why Saylor's sale landed differently
The market's disproportionate reaction to 32 BTC reflects Strategy's position as the symbol of corporate permanence in Bitcoin.
Since 2020, Michael Saylor has built that reputation into the company's identity as an accumulator that never distributes and treats every dip as a buying opportunity. That positioning attracted a class of investors who used Strategy as a proxy for conviction that corporations would become structural Bitcoin buyers.
A single sale to meet a preferred-stock distribution obligation left the accumulation thesis intact mechanically, but it introduced a variable that Strategy has ongoing financial obligations, and Bitcoin is the only asset available to meet them.
The follow-on anxiety is rational, even if the immediate reaction was overblown, since Strategy carries debt and preferred stock obligations with fixed distributions.
If Bitcoin prices fall further, the spread between those obligations and the company's ability to fund them through equity issuance or operating cash narrows.
The 32 BTC sale confirmed that the option to sell exists and that management will exercise it under sufficient financial stress.
Traders who built positions on the premise of a permanent buyer now have to price in an occasional seller, and that repricing does not require a large sale to begin.
The correction's actual anatomy
Attributing Bitcoin's more than 12% weekly decline solely to treasury selling misreads the flow data.
US-traded spot Bitcoin ETFs saw roughly $4.4 billion in outflows over the last 13 recorded trading days through June 3.
Those outflows dwarf Strategy's $2.5 million sale and the combined $541 million in May treasury reductions by an order of magnitude.
Geopolitical tensions tied to Iran added a separate risk-off layer, and futures liquidations exceeding $90 million amplified whatever directional move was already underway.
Strategy's disclosure entered that environment as a narrative accelerant, traders looking for a reason to reduce exposure found one, and the symbolic weight of Saylor selling gave the move a headline that stuck.
Standard Chartered's Geoffrey Kendrick maintained a $100,000 year-end 2026 Bitcoin target after the decline, treating the drawdown as a positioning reset.
That framing holds as long as the ETF outflow cycle reverses and treasury-sector net accumulation continues, and gives way if Strategy or other debt-carrying treasury holders face sustained stress requiring liquidation at scale.
What the treasury model now has to prove
If the market absorbs that small tactical sales can fund obligations without ending the accumulation thesis, Strategy's June 1 disclosure becomes a governance footnote.
Net treasury accumulation of 43,500 BTC in May, continued ETF inflows once the current outflow cycle exhausts itself, and Standard Chartered's unchanged price target all support that reading.
Bitcoin stabilizes, Strategy's premium to net asset value recovers, and the 32 BTC sale gets filed under balance-sheet housekeeping.
If investors reprice the treasury model instead, deciding that firms carrying debt and preferred obligations are conditional buyers, May becomes a template for repeated headline risk.
Every quarterly filing season, every preferred distribution date, every convertible-note maturity creates a window for another small sale that lands with outsized narrative force.
The price correction from that repricing would come from the erosion of the premium investors assigned to Strategy's perpetual-accumulation posture.
Corporate Bitcoin treasuries built their market value partly on the promise of one-way buying, and the 32 BTC sale raised the question of how many times a permanent buyer can sell before the market stops treating it as permanent.
The post Bitcoin traders blamed Saylor’s 32 BTC sale but larger selling pressure built elsewhere appeared first on CryptoSlate.
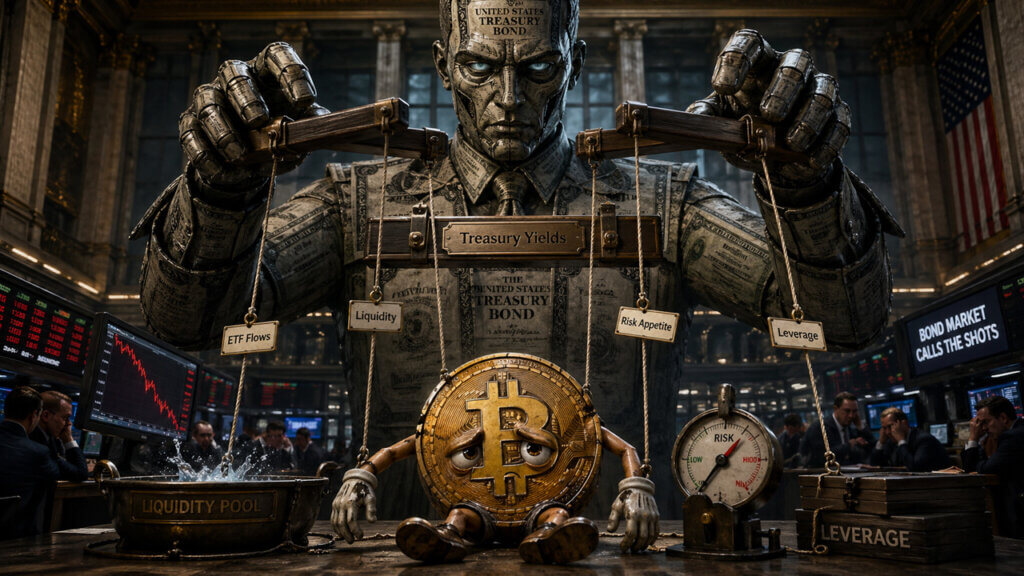
Bitcoin fell after the May US labor report gave markets a reason to delay the next Federal Reserve easing trade, turning a stronger jobs number into a tighter-liquidity problem for crypto.
The May Employment Situation report said nonfarm payroll employment rose by 172,000 in May, while the unemployment rate held at 4.3%.
TradingEconomics release-screen data put the gain well above an 85,000 consensus estimate. That gap was large enough to push the first market interpretation toward higher Treasury yields, a stronger dollar, and pressure on assets that benefit from cheaper money.

That is why Bitcoin reacted less like an inflation hedge and more like a high-duration risk asset. CryptoSlate showed BTC trading near $60,000 on June 5, down 5% over 24 hours and 17% over seven days.
The labor print added another macro shock to a market that was already fragile after its slide from the low-$60,000 range.
The key issue for Bitcoin is that the labor market looked firm enough to reduce the urgency for rate cuts, while the internal details were soft enough to keep traders debating whether the first hawkish move should last.

The jobs beat carried a catch
The headline number did the initial damage. A 172,000 payroll gain against an 85,000 consensus is the kind of surprise that usually lifts front-end yields because it weakens the argument that the Fed needs to move quickly to protect employment.
The unemployment rate staying at 4.3% added to that first reaction by removing the risk of an obvious labor-market downside shock.
For Bitcoin, the path from jobs data to price pressure is direct. Stronger labor data can keep policy rates higher for longer, which supports the dollar and raises the hurdle for speculative assets that do not produce yield.
When that happens, traders often reduce exposure first in assets most sensitive to liquidity, including long-duration technology shares and crypto.
But the composition made the report more complicated than the headline. According to the TradingEconomics calendar data, government payrolls rose by 52,000, while private payrolls were 120,000.
Private hiring remained positive and beat consensus, but it slowed sharply from the prior pace shown on the release screen.
The split changes the market interpretation because government hiring is less informative about cyclical corporate demand than private-sector payroll growth. A government-heavy payroll beat can still move yields, especially in the first minutes after release.
Discretionary traders may give it less weight than a broad private-sector acceleration.
Wage data also kept the print from looking like a clean overheating shock. Average hourly earnings rose 0.3% month over month, matching expectations, while yearly wage growth slowed to 3.4% from the prior month in the TradingEconomics screen.
That leaves the Fed without an easy case for cuts, while falling short of a wage surprise that would force a more aggressive bond selloff by itself.
Participation was steady, average weekly hours were unchanged, and the broader U-6 unemployment rate improved. Taken together, the data pointed to a labor market that is still resilient, while stopping short of a broad acceleration signal.
That is the tension markets had to price. The headline says the economy can handle tighter policy for longer. The details say private-sector momentum is cooling, yearly wage growth eased, and the payroll beat leaned heavily on public-sector hiring.
Why Bitcoin felt it first
Bitcoin has spent much of 2026 trading as a macro-sensitive liquidity asset. CryptoSlate noted earlier in the week that jobs data had become a direct test for BTC.
Cooling employment can soften the dollar and pull capital back toward risk, while strong labor data keeps the case for elevated rates intact.
Friday's report pushed the market toward the second outcome. Chart context showed US yields and the dollar rising after the release, while Bitcoin, gold, and equities came under pressure.
That combination points to a higher-for-longer reaction instead of a recession scare.
That distinction is central to the Bitcoin reaction. A recessionary jobs report would usually push yields lower, weigh on the dollar, and potentially give gold and duration-sensitive assets a bid as traders price faster easing.
Friday's setup was the opposite. The jobs market looked strong enough to delay the relief trade, so the dollar tightened financial conditions and Bitcoin took the hit.
The move also landed on a market already testing support. CryptoSlate's prior coverage of Bitcoin's $63,000 slide framed BTC as caught between ETF demand, AI equity appetite, and the need to reclaim the $66,900 to $70,000 area.
A hawkish payroll surprise makes that repair harder because it increases competition for capital and reduces the near-term case for easier financial conditions.

The report created two paths, with the first reaction following the most obvious transmission channel. Higher yields make cash and bonds more attractive at the margin. A stronger dollar tightens global liquidity.
Together, they make it harder for Bitcoin to trade as a scarce-asset story in the short run, even if that long-term narrative remains intact.
Brent's relative resilience in the chart context also helps explain the macro message. Oil holding up while Bitcoin and gold sold off suggests traders were treating the report as growth that is firm enough to keep the Fed patient.
The second-round test
The next test is whether markets keep trading the 172,000 headline payroll beat or shift toward the softer private-sector and wage details.
If the two-year Treasury yield and DXY hold their post-release gains, Bitcoin remains under pressure from the same channel that hit it immediately after the report: fewer near-term rate-cut expectations, tighter dollar liquidity, and weaker appetite for high-beta risk.
In that scenario, the market is accepting the hawkish interpretation and BTC's ability to reclaim its first breakdown area becomes the key signal.
If yields fade and the dollar gives back the spike, the market is likely moving to the second interpretation. That would mean traders are discounting the government-heavy portion of the payroll gain, giving more weight to the slowdown in private hiring, and treating cooling yearly wage growth as a limit on the hawkish repricing.
Both outcomes keep the signal mixed rather than cleanly bullish or bearish. The employment data reduced the urgency for Fed cuts, which is negative for Bitcoin's liquidity setup.
The internal details also stopped short of a broad overheating message, which is why the follow-through depends on whether rates and the dollar keep confirming the first move.
For now, the labor report gave Bitcoin holders an uncomfortable answer: the economy may still be strong enough to keep the Fed patient, yet soft enough under the surface to keep doubts about private-sector momentum alive.
That leaves BTC trading the same question as the rest of risk: whether markets care more about the headline beat or the softer parts underneath it.
The post Bitcoin price craters to $60,000 as BTC bulls get jobs report they were hoping to avoid appeared first on CryptoSlate.
CryptoTicker.io
Bitcoin has done it again: From an all-time high of around $120,000, it has dropped to about $60,000 within a few months – a decrease of around 50%. Those who invested at the peak are now staring at a halved portfolio. However, those who invested with a clear plan and the right investment strategy are already familiar with this scenario from previous cycles and know: Right now is when the foundation for future returns is being laid.
Key Insights
- Bitcoin fell from about $120,000 to around $60,000 in 2025/2026 – a decline of about 50%, which is historically not unusual in the crypto space (comparable to 2017/18 and 2021/22).
- Dollar cost averaging (DCA) is a proven strategy where you regularly invest a fixed amount – regardless of the current price. This smooths out your entry price and helps you avoid the trap of market timing.
- Large investment funds and pension funds operate on the same principle: they invest regularly over decades instead of reacting to short-term market fluctuations.
- During crash phases, you as an investor have three options: continue DCA consistently, partially shift into stablecoins, or pause your savings plan and wait for recovery signals.
- The perfect entry point is less important than having a clear plan with defined risk, time horizon, and discipline – our savings plan and crypto savings plan comparison can help you find the right provider.
From Bitcoin's All-Time High to Crash – What DCA Has to Do with It
In early 2025, Bitcoin reached a new all-time high of around $126,000 – approximately $120,000. What followed is familiar to experienced customers of the crypto market: profit-taking, panic selling, and a price drop of around 50%. The price fell to values between $60,000 and $70,000.
Such crashes are not anomalies. In previous cycles – such as 2017/18 or 2021/22 – losses ranged from 40% to over 80%. Nevertheless, Bitcoin recovered each time and reached new highs.
The problem: Many beginners enter at the top, driven by FOMO and media hype, and sell in panic at the first major decline. DCA – dollar cost averaging – is the method that cushions this behavior. Instead of waiting for the supposedly perfect moment, you invest a fixed amount regularly in cryptos like $Bitcoin or $Ethereum.
In this article, we will show you how DCA works in crypto, how to strategically use crash phases, and how to invest step by step with a crypto savings plan – for example, through Bitpanda.

What is Dollar Cost Averaging (DCA) in the Crypto Space?
Dollar-Cost-Averaging (DCA) means that you regularly buy a fixed amount of an asset – for example, €100 in Bitcoin every month. DCA allows for regular investments in cryptocurrencies without having to worry about the current price.
The cost averaging effect works like this:
- When prices are low, you automatically buy more units (e.g., more Satoshis). Investors buy more units at low prices and fewer at high prices.
- When prices are high, you buy fewer units – this creates an averaged entry price over time.
- DCA can lower the average cost per unit because you don’t buy everything at a single (possibly unfavorable) moment.
- DCA eliminates the stress of timing the purchase – you don’t need to understand technical chart analysis or market forecasts.
This method comes from traditional investing: ETF savings plans, mutual funds, and retirement plans operate on the same principle. DCA is simple for beginners and does not require extensive knowledge of cryptocurrency markets. It does not guarantee profits, but it limits psychological errors such as panic selling and impulsive trading.
Why DCA Makes Sense in Volatile Cryptocurrency Markets
The crypto market is notorious for its volatility. Daily movements of ±10% are not uncommon, and cycles where prices like Bitcoin drop from $120,000 to $60,000 are part of everyday life. DCA is particularly advantageous in volatile markets like cryptocurrencies because it allows you to take advantage of these fluctuations.
Market timing is extremely difficult in these markets. Even professional traders and analysts regularly miss the mark when it comes to identifying tops or bottoms. DCA reduces the risk of investing just before a market downturn because you spread your capital over many points in time.
DCA aims to reduce the effects of market volatility. Instead of letting market fluctuations control you, you automatically buy in bull and bear markets. This way, you benefit on average from the long-term trend of the asset.
Pension funds and retirement savings plans set the example: They regularly invest large sums in broadly diversified assets over decades without trying to perfectly time short-term fluctuations. DCA works particularly well for long-term crypto investors with a time horizon of 5 to 10+ years who believe in the fundamental value of Bitcoin and Ethereum.
Strategies for Crash Phases: DCA, Stablecoins & Waiting
Bitcoin halves from $120,000 to $60,000. Many altcoins fall 70–90%. The monetary value in the portfolio shrinks. Emotions run high. Right now, the plan separates from the panic. Here are three options you have as an investor in such phases:
Option 1 – Continue Investing via DCA: Many long-term investors simply let their existing crypto savings plan continue. DCA allows for the purchase of more units at low prices – and that is the core of the strategy. Those who consistently invest during the crash significantly lower their average entry price. An example of DCA is a monthly investment of €100 – regardless of whether Bitcoin is at $120,000 or $60,000.
Option 2 – Partially Shift to Stablecoins: Some investors park a portion of their position in stablecoins (e.g., USDT, USDC, EURS). This secures liquidity and allows for larger special purchases when signs of recovery or further downward exaggerations appear.
Option 3 – Pause the Savings Plan and Monitor the Market: Some investors temporarily stop their DCA and analyze the situation: macro data like interest policy, on-chain data like hash rate or wallet activity, regulatory developments. Only when there are signals like rising trading volumes or breaking through important resistance levels do they become active again.
None of these options are “always right.” The right choice depends on your risk tolerance, liquidity, and time horizon. What matters is a pre-defined plan rather than spontaneous panic decisions.

Applying DCA Specifically: Examples and Avoiding Typical Mistakes
Imagine you invest €200 a month in Bitcoin over 24 months. Month 1 starts at the all-time high of $120,000. In the following months, the price falls to $60,000, partially recovers, and continues to fluctuate. DCA can lower the average purchase price of an asset – your averaged entry price will end up significantly below the top, perhaps at $80,000–90,000.
Here’s how to implement DCA correctly:
- Choose a fixed interval: monthly is standard, weekly smooths out more but incurs more fees.
- Determine an amount you can afford – e.g., €50, €100, or €500 per month. Never use money that you need in the short term for rent or emergencies.
- Focus on established coins with high market capitalization: Bitcoin and Ethereum have the longest history and the broadest acceptance.
Typical mistakes to avoid:
- Starting DCA and stopping after the first significant loss
- Constantly adjusting amounts up and down based on news
- Going completely “all-in” shortly after a hype or due to a QR code in an advertisement
- Buying too many speculative altcoins instead of focusing on quality assets
DCA is particularly suitable for established crypto assets. High-risk altcoins are often more cyclical and less predictable – DCA does not protect against permanent losses in those cases.
How to Start with DCA through Bitpanda (Step-by-Step Guide)
Bitpanda is a user-friendly platform that is particularly suitable for starting with DCA. DCA is suitable for beginners and long-term investors – and Bitpanda makes the process as easy as possible. Bitpanda is the only regulated crypto exchange under BaFin, which offers a high level of security.
Step 1 – Registration via Our Link: Click here, open a free account, and confirm your email address. The registration takes only a few minutes.
Step 2 – Identity Verification (KYC): Crypto exchanges must verify users with an ID. As a regulated provider, Bitpanda requires verification via ID or passport, possibly also via video identification – comparable to opening an account at a bank.
Step 3 – Deposit Euro Balance: Transfer euros to your Bitpanda account via SEPA or other payment methods. A SEPA deposit typically takes 1–2 banking days. Other deposits like credit cards are also possible depending on the region.
Step 4 – Set Up Crypto Savings Plan (Auto-Invest): In the app or on the website, you can create a savings plan for Bitcoin or other crypto assets. Choose your amount (e.g., €50 monthly), the interval, and the payment source. Many crypto exchanges offer automated savings plans for DCA – Bitpanda's Auto-Invest function is among the most convenient.
Step 5 – Regularly Check Your Portfolio, But Don’t Trade Daily: Review your plan at intervals of 3–6 months. Adjust the strategy as needed, but avoid frantic reactions to every price fluctuation. DCA requires long-term discipline and consistent purchases.
Our savings plan comparison provides additional information on how Bitpanda compares to other providers.
How to Find the Right Savings Plan Provider (Including Our Savings Plan Comparison)
A comparison of crypto savings plans is crucial because the differences in fees, coin selection, minimum amounts, and regulatory status are significant. Transaction costs can diminish returns with frequent purchases – that’s why it’s worth taking a close look at the fee structure.
Here’s an overview of the fees of important providers:
| Provider | Trading Fees | Special Features |
|---|---|---|
| Bitvavo | 0.25% | 2-Factor Authentication, lowest spread |
| Kraken Pro | 0.25–0.4% | Founded in 2011, high security standards |
| BSDEX (Stuttgart Exchange) | 0.35% | Regulated in Germany |
| Bitcoin.de | 1.0% | Marketplace model |
| Bison (Bison App) | 1.25% | Multi-layer security concept, ISO certified |
| Coinbase | up to 2.5% | High fees, especially for altcoins |
| Bitpanda | variable | Only regulated crypto platform under BaFin |
SMS-TAN procedures are considered less secure than app-based 2FA – ensure that your provider offers modern authentication. Bitvavo uses 2-Factor Authentication for added security. Kraken was founded in 2011 and has high security standards. Bison has a multi-layer security concept and is ISO certified.
A good DCA provider should meet the following criteria:
- Transparent fee structure without hidden costs
- Real cryptocurrencies (not just certificates or stock-like products)
- Regulated custody and licensing
- Easy setup for recurring purchases
Our crypto savings plan and exchange comparison presents these points clearly. Bitpanda offers a particularly straightforward way to get started: a wide selection of crypto assets, a convenient savings plan function, staking options, and the Bitpanda Card. Getting started through our referral link takes just a few minutes.
Still, keep in mind: The choice should always fit your own needs – risk profile, desired coins, additional features like rewards or payouts. The Trade Republic card or other financial products can also be sensibly used depending on your goals. Investors in the Netherlands may have different provider options than users in Germany.
Psychology & Long-Term Thinking: What We Can Learn from Investment and Pension Funds
Successful investing has less to do with “secret knowledge” than with discipline, patience, and a clear system. Large companies, pension funds, and retirement funds regularly invest large sums into broadly diversified portfolios over the years – monthly or quarterly. They do not try to time short-term fluctuations.
Individual investors can approach a Bitcoin or crypto savings plan similarly on a smaller scale: regular amounts, long investment horizon, clear strategy, no frantic trading or selling.
DCA promotes disciplined investing without emotional decisions. Emotional control is achieved through the automation of DCA – you don’t have to check the price every day and ponder over buying or selling. DCA minimizes emotional decisions while investing and reduces the impact of market volatility on your well-being.
In crash phases – such as the drop from $120,000 to $60,000 – the DCA investor knows: They are buying at a lower price now. The focus is on the long-term trend, not the daily price. This psychological influence is enormous and makes the difference between panic selling and calmly moving forward.
Long-term thinking also means viewing crypto only as part of the overall portfolio. Timeframes of 5 to 10+ years are realistic – just like with traditional investments in funds or stocks.
Risks & Limits of Dollar Cost Averaging in Crypto
DCA is a helpful toolset, but it is not a miracle solution. Crypto remains a risky asset class with the potential for total losses in individual projects. A realistic understanding of the limits is essential.
- Risk of Persistently Low Prices: Some coins may never reach their previous all-time highs again. DCA does not protect against structurally poor investments—especially in speculative altcoins with low volume. The use of DCA should focus on assets with strong fundamentals.
- Short-Term Losses Possible: DCA smooths out volatility but does not prevent price losses. Particularly with short time horizons of less than 3–5 years, the results can vary significantly. DCA can lead to lower returns in bull markets because you did not invest the entire amount at the low point.
- Fee Accumulation: Many small trades create numerous individual transactions. The costs can add up, especially with providers that have high spreads or trading fees.
- Evaluate Individual Factors: Financial situation, emergency funds, debts, investment goals, and risk tolerance should be thoroughly assessed before entering crypto. Crypto investments are not a substitute for a solid financial foundation. Be aware of tax implications (many individual purchases = many cost bases) and seek professional advice for larger amounts. Events such as regulatory changes or geopolitical developments can have additional impacts on the market.
DCA reduces the effects of market volatility—but it does not eliminate risk. Only invest money that you can afford to set aside for the long term.
FAQ
Is Dollar Cost Averaging in Crypto still worthwhile in 2026, after Bitcoin has fallen so much?
The principle of DCA is timeless because it does not depend on whether Bitcoin is currently at $20,000, $60,000, or $120,000. It’s about investing in installments over a longer period. Especially after significant pullbacks—like the drop from $120,000 to $60,000—DCA can be attractive for newcomers because the entry prices are significantly lower compared to the all-time high. DCA reduces the risk of investing just before a market downturn and provides a solid experience even for investors without deep market knowledge.
Should I stop my crypto savings plan during a crash?
That depends on your situation. Many long-term investors consciously keep their savings plan running to benefit from lower prices. Others pause for risk reasons—such as job insecurity or liquidity needs. The necessity of a predefined strategy is crucial here: Set conditions before the crash under which you will continue or pause (e.g., “I will maintain the savings plan until a price drop of X%”). This way, you avoid spontaneous panic decisions.
Which cryptocurrencies are best suited for DCA?
DCA is typically used for established, liquid cryptocurrencies—primarily Bitcoin and Ethereum, as they have the longest history and the highest market capitalization. Highly speculative altcoins with low volume can still pose a high risk for permanent losses or project failures, even with DCA. The advantages of DCA are most pronounced with assets in which you believe in the fundamental value over the long term.
Does it make sense to combine DCA with a portion in stablecoins?
Some investors park a portion of their regular deposits in stablecoins to make larger special purchases during significant downturns—such as an additional 20–30% price drop. This hybrid strategy is a sensible addition but makes implementation more complex. You should clearly define when and how the stablecoins will be converted back into crypto to avoid decision paralysis. A clear set of rules will help you with this.
How much should my monthly amount be for DCA in crypto?
The amount must always fit your individual situation. Crypto investments should not be funded with money that is needed in the short term for rent, emergencies, or debt repayment. Start with small amounts—e.g., $25–100 per month—and only increase after gaining experience and comfort over several months. Through Bitpanda, you can already set up a savings plan with low amounts and gradually build your portfolio.
The cryptocurrency market has suffered one of its most brutal corrections of the year, shedding more than 20% of its total valuation over the past seven days. Bitcoin ($BTC) plummeted below the critical $70,000 threshold to hit a low of $60,800, dragging the entire digital asset landscape down with it.
Ethereum ($ETH) collapsed to $1,560, while major altcoins faced aggressive selling pressure; Solana ($SOL) dropped to $62 and Ripple ($XRP) hovered at $1.08. This massive deleveraging event was not isolated to digital assets. Instead, it was triggered by a systemic macro-economic shock where everything that could go wrong for global financial markets went wrong simultaneously, wiping out a staggering $2.5 trillion in a single trading session.
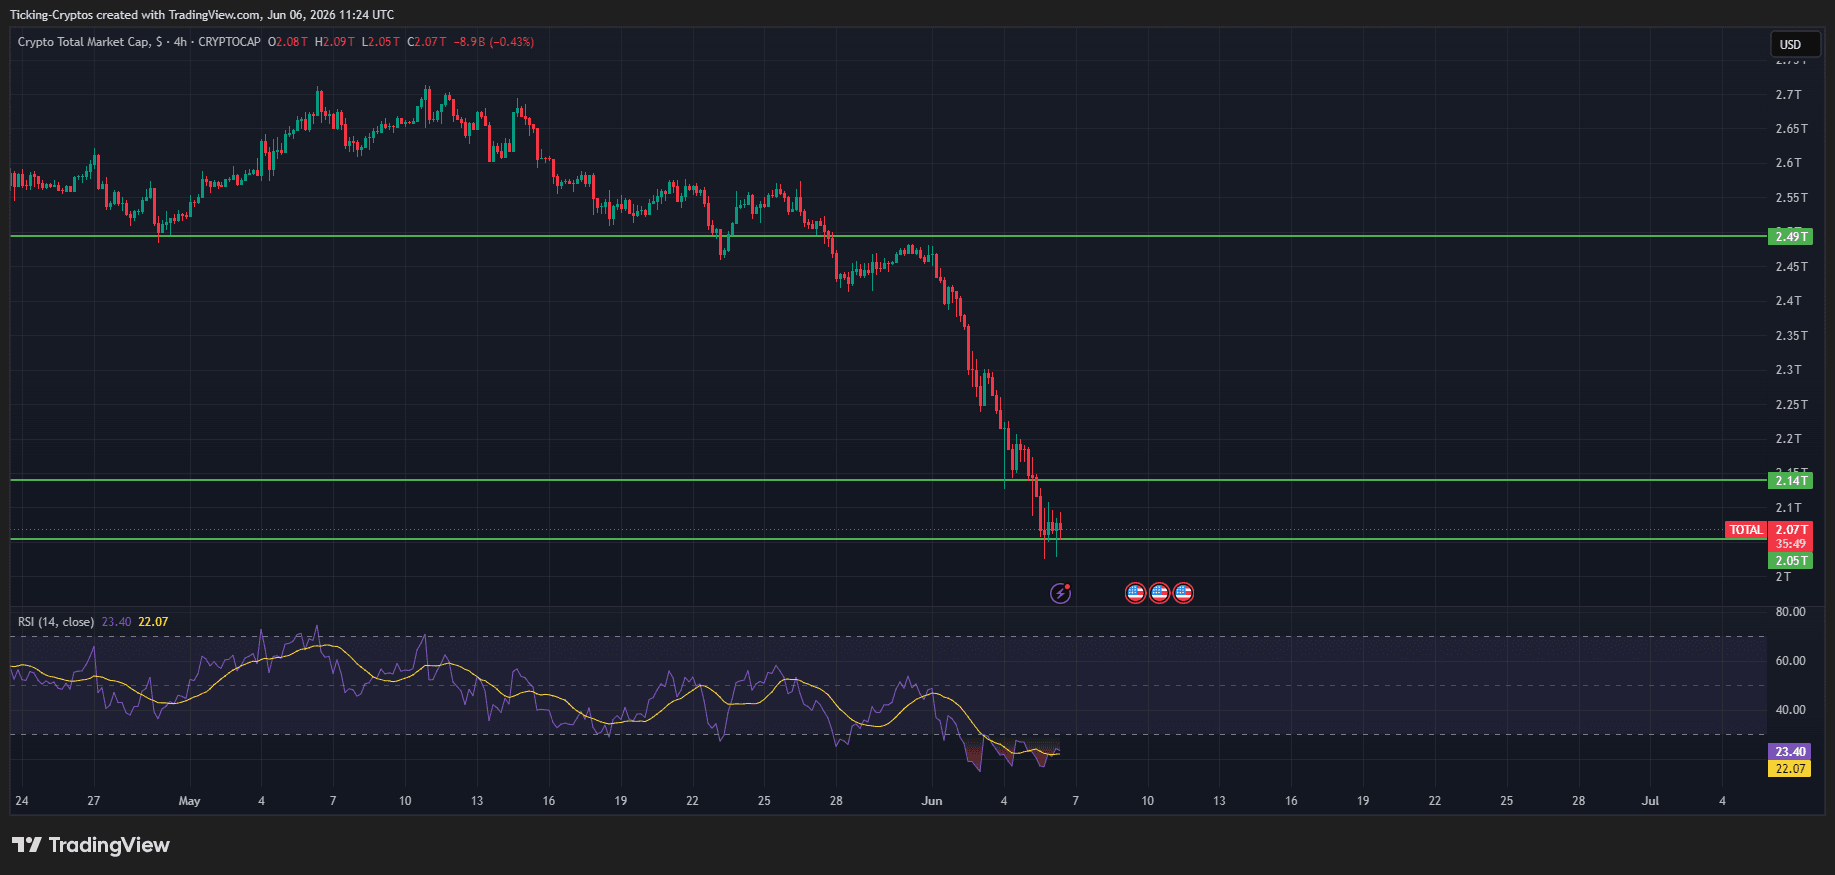
Why are Markets Down?
The primary trigger for the market-wide liquidation began with the release of the U.S. Bureau of Labor Statistics May employment report. The US economy added 172,000 nonfarm payroll jobs, obliterating Wall Street expectations of roughly 88,000.
While a robust labor market is typically a sign of economic health, it presents a major problem under current conditions. With inflation stubbornly stuck at 3.8% and crude oil trading at $90 per barrel, an overheating job market signals to the Federal Reserve that the economy is not cooling down. Consequently, the probability of an interest rate hike this year surged from 40% to 57% in a single day. Higher interest rates reduce the present value of risk assets, sending shockwaves through both tech equities and cryptocurrencies.
The AI Trade Cracks and Drags Down Tech
For months, the crypto market has enjoyed a strong correlation with high-growth artificial intelligence and semiconductor stocks. That correlation turned toxic when the AI tech narrative experienced its first major structural crack:
- Broadcom's Miss: Despite reporting a 48% increase in revenue and a 143% surge in AI chip sales, Broadcom stock crashed 12.6% because management failed to raise its forward-looking AI revenue targets.
- The Semiconductor Rout: A research report from SemiAnalysis revealed that Nvidia’s next-generation architecture will require roughly half the memory capacity previously priced in by the market. This sparked a global semiconductor sell-off, causing South Korea’s SK Hynix to drop 10%, Samsung to fall 6%, and South Korea's entire stock market to plunge 5.5%.
- Anthropic's Warning: Adding to the panic, AI safety firm Anthropic published a report warning that AI systems are nearing self-improvement capabilities without human intervention, calling for a global development pause.
This combination of decelerating corporate guidance and structural uncertainty forced institutional investors to question bloated tech valuations, causing a domino effect of liquidations that spilled directly into highly liquid crypto markets.
The Hidden Trillion-Dollar Liquidity Drain
Underneath the surface, a major liquidity crunch is actively starving the markets. Giant technology companies are preparing for massive public listings. SpaceX is targeting a $1.75 trillion public valuation next week, while both Anthropic and OpenAI have initialized filing processes.
Together, these upcoming listings represent between $4 trillion and $5 trillion in expected market value. Because cash reserves among institutional fund managers are at their lowest levels since early 2024, institutional players are forced to aggressively sell down their existing holdings—including highly liquid mega-cap cryptocurrencies—simply to raise the capital required to participate in these new listings.
Fed Leadership Uncertainty Sparks De-Risking
Compounding the panic is the upcoming Federal Open Market Committee (FOMC) meeting in 11 days. This marks the very first policy meeting for the newly appointed Federal Reserve Chair, Kevin Warsh, who took office under the Trump administration with market expectations of an aggressive rate-cutting agenda.
However, Chair Warsh is now walking straight into a macroeconomic trap of high inflation, surging energy prices, and a red-hot labor market. Because market participants have no historical precedent for how this new leadership will react to these conflicting metrics, institutional investors chose the safest option: aggressively de-risking portfolios and stepping to the sidelines.
Crypto Trading Strategy: How to Navigate a Market Crash
When systemic liquidations hit the digital asset space, emotional trading usually leads to severe capital destruction. Professional traders rely on strict risk-mitigation systems to preserve capital during a macro-driven market drawdown.
1. Capital Preservation via Stablecoins
During high-velocity crashes, velocity outweighs valuation. Converting portions of a portfolio into asset-backed stablecoins (such as USDC or USDT) removes directional market risk. This strategy halts portfolio drawdowns and builds dry powder, ensuring liquid capital is available to deploy once the market finds a structural bottom.
2. Dollar-Cost Averaging (DCA) Into Blue Chips
Attempting to catch the exact bottom of a crash is statistically unprofitable. A disciplined Dollar-Cost Averaging strategy breaks down your target investment allocation into fixed smaller amounts deployed at regular intervals (e.g., weekly or monthly). Focusing DCA allocations strictly on highly liquid blue-chip assets like $Bitcoin and $Ethereum minimizes the risk of holding illiquid altcoins that may fail to recover.
--> Check out our savings plan comparison tool to help you choose the best provider
3. Monitoring Derivative Liquidations and Funding Rates
Before entering new spot positions, traders should observe the derivatives market via platforms like Coinglass. A true market bottom is often preceded by a cascade of long liquidations and a shift in funding rates from positive to negative. When funding rates turn deeply negative, it indicates an oversold market where short sellers are paying a premium to hold their positions, often laying the groundwork for a short squeeze.
The cryptocurrency market faced severe downward pressure this past week, triggering sharp liquidations across several major alternative coins. While large-cap assets like Bitcoin struggled to maintain key support levels, multiple high-profile altcoins bore the brunt of the market sell-off, posting double-digit losses exceeding $25$.
Data from CoinMarketCap highlights a widespread correction driven by macro-economic factors, shifting regulatory environments, and liquidity drains from risk-on assets. Below is a detailed breakdown of the top five worst-performing altcoins over the last seven days.
1. Cardano (ADA)
$Cardano led the weekly losses among major layer-1 networks. The $ADA price plummeted by 32.19%, dropping its market capitalization to approximately $5.76 billion.
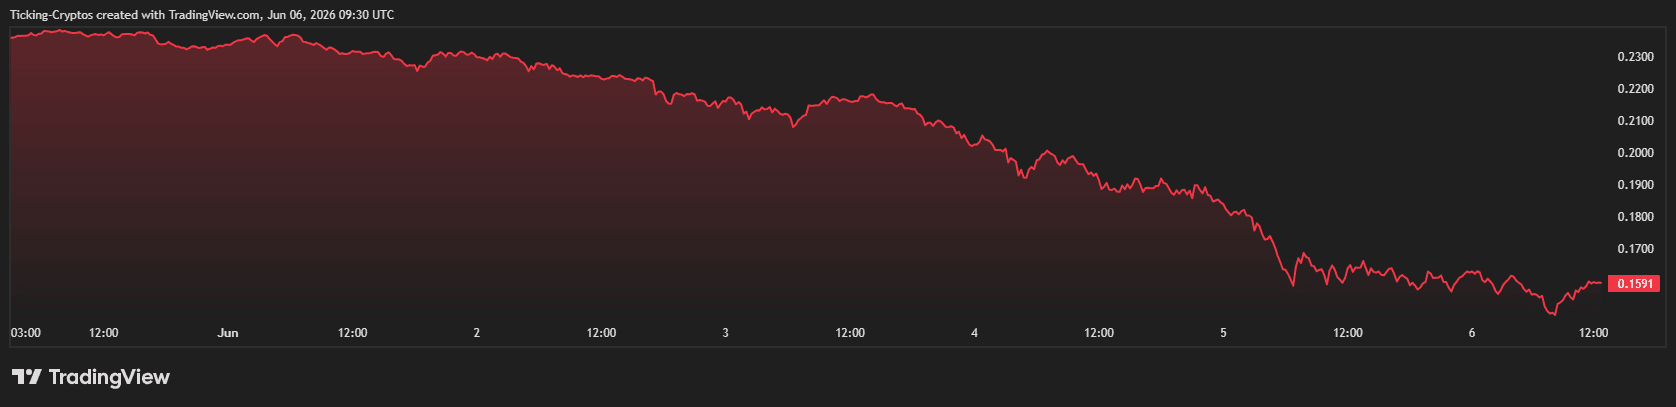
Despite continuous developer activity on the network, ADA struggled with a lack of short-term bullish catalysts. Heavy liquidations in futures markets exacerbated the spot price decline, pushing Cardano into heavily oversold territory on the daily relative strength index (RSI).
2. Aptos (APT)
$Aptos, another prominent layer-1 blockchain built for scalability, witnessed a 29.32% price reduction over the week. Trading at $0.6638 at the time of data collection, the asset's market cap contracted sharply to $544 million.
The steep drop is primarily attributed to a broader risk-off sentiment hitting newer smart-contract platforms, alongside scheduled token unlocks that increased circulating supply and diluted existing buy pressure.
3. Zcash (ZEC)
Privacy-centric cryptocurrency $Zcash experienced a volatile seven days. Despite booking a brief 19.34% recovery within a 24-hour window, its overall weekly performance stood at a negative 27.42%, trading at $374.80.
The sharp weekly decline reflects ongoing regulatory scrutiny surrounding privacy coins in various global jurisdictions, causing exchanges to de-risk and retail traders to reallocate capital into more transparent public ledgers.
4. Algorand (ALGO)
$Algorand fell by 27.06% over the past week, with its price sliding to $0.09321. The institutional-grade blockchain network saw its market cap shrink to $831 million.
ALGO’s downtrend mirrors the broader systemic outflow from decentralized finance (DeFi) ecosystems. The asset failed to sustain key psychological support levels, triggering automated stop-loss orders that accelerated the downward momentum.
5. Sei (SEI)
Rounding out the top five is $Sei, a sector-specific layer-1 blockchain optimized for trading. SEI registered a 26.12% loss over the seven-day period, pushing its price down to $0.04799 with a market cap of $340 million.
As a relatively new market entrant, SEI remains highly susceptible to aggressive speculative cycles. When broader market liquidity dries up, high-beta altcoins like SEI typically suffer deeper corrections as capital flows back into safer stables or fiat.
The Open Network (TON) ecosystem is facing severe operational turbulence as the native token, Toncoin ($TON), plummeted by over 18% in a sudden market rout, bottoming out at $1.53. The price collapse coincides with a cascade of critical infrastructure failures, leading to the shutdown of major decentralized applications, mini-programs, and ecosystem landing pages.
Multi-Chain Scaling Complexities Trigger Network Bottlenecks
The structural issues began mounting following recent protocol changes. While the network implemented sharding (fragmenting the blockchain into smaller subnets to split the transaction load), keeping those shards completely synchronized has proven difficult.
The dynamic nature of TON’s multi-chain system has created massive data bottlenecks. Blockchain monitoring tools reported heavy congestion, preventing decentralized wallets and validation layers from communicating seamlessly. Without stable cross-shard communication, the transaction finality slowed to a crawl, sparking panic among retail traders and automated liquidity providers.
Key Applications Go Dark: Fuse Mini-App and TON ID Offline
The most visible consequence of this infrastructure strain is the sudden dark state of key consumer applications. The Fuse Mini-App, a widely used application within the Telegram ecosystem for Web3 interaction, has completely stopped responding to user requests. Users trying to execute smart contract operations or interact with automated liquidity protocols have faced persistent timeout errors.

Simultaneously, the TON ID website, the foundational gateway for decentralized identity and user verification across the ecosystem, has gone completely down. Visitors are met with server connection failures, locking users out of decentralized applications (dApps) that rely on TON ID for authentication.
TON Ecosystem Status Monitor
- TON ID Website: OFFLINE (Server Timeout)
- Fuse Mini-App: UNRESPONSIVE (RPC Gateway Error)
- TON Connect Layer: INTERMITTENT DEGRADATION
Furthermore, users attempting to authorize actions through $TON Connect have reported severe lag, failing to link their non-custodial wallets like Tonkeeper to third-party Telegram bots.
Whales Liquidate Positions Amid Centralization Concerns
The sudden technical breakdown has amplified existing market anxieties regarding the distribution and governance of the network. Telegram recently stepped in to take a prominent role as the network's dominant validator, sparking a fierce debate among DeFi purists regarding the actual decentralization of the blockchain.
On-chain data indicates that large token holders, or whales, began aggressively offloading supply into the liquid pools as the technical issues surfaced. The massive sell-side pressure easily broke past the immediate local support levels of $1.45 to $1.38, forcing a rapid correction down to the $1.53 region.
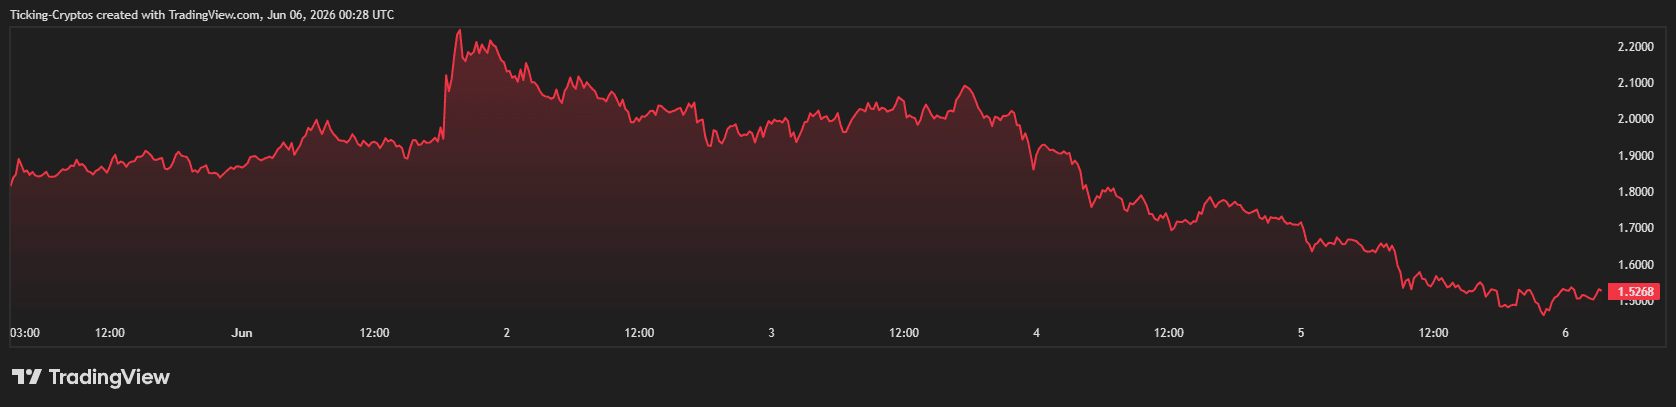
Ecosystem developers are currently scrambling to deploy hotfixes to the remote procedure call (RPC) nodes and node infrastructure to bring the front-end websites and mini-apps back online. However, until the synchronization issues between the network shards are fully resolved, trading volume remains highly volatile, and the risk of further liquidations hangs over the market.
Bitcoin Volatility Triggers Massive Leverage Unwinding
The cryptocurrency market faced intense selling pressure over the last 24 hours, driving massive liquidations across both major assets and altcoins. Bitcoin ($BTC) momentarily breached its critical psychological support level, dipping briefly below the $60,000 mark. This sharp downward move triggered a cascading wave of long liquidations throughout the derivatives market.
Following the brief plunge, aggressive buying volume at lower levels helped stabilize the premier cryptocurrency. Bitcoin managed an intraday recovery, readjusting back to its current trading price of $61,500. However, the brief breach of key support weakened market sentiment and left the altcoin sector highly vulnerable to deep, double-digit corrections.
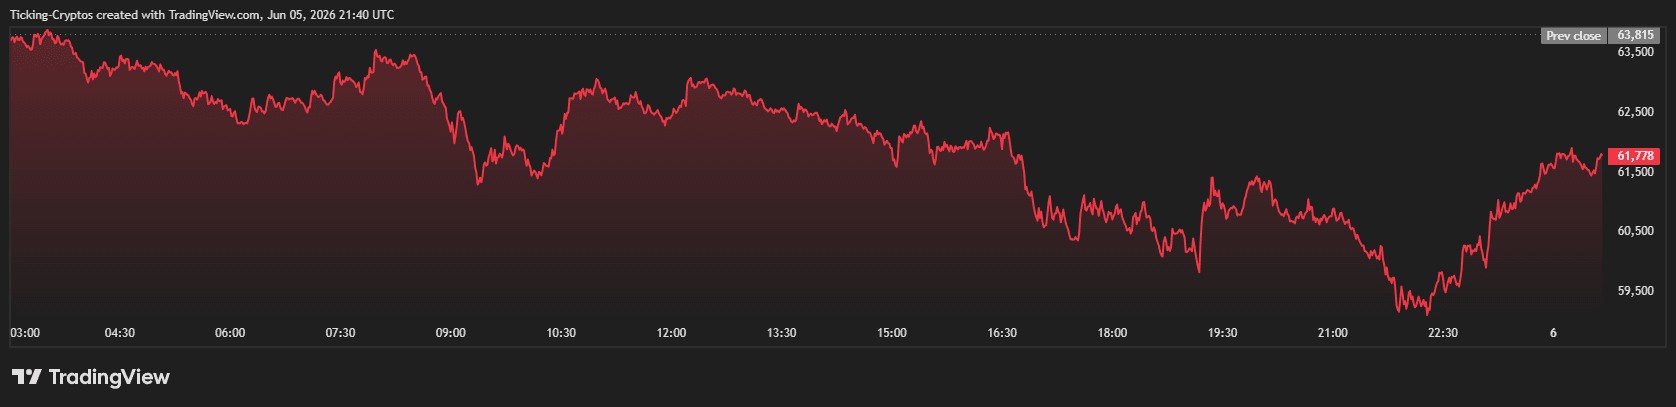
Top 6 Altcoin Losers
While $Bitcoin managed to reclaim some ground, the broader altcoin market suffered severe capital outflows. Data from exchanges highlights the top six digital assets that lost the most value over the past 24 hours.
1. Zcash (ZEC)
$Zcash emerged as the hardest-hit asset in the market, experiencing a massive sell-off.
- Current Price: $379.66
- 24-Hour Performance: -23.65%
- 7-Day Performance: -28.83%
- Market Capitalization: $6,343,409,995
Market Insight: Despite a minor 5.61% hourly rebound, ZEC remains deeply negative for the week, experiencing a rapid liquidation cascade from its recent local highs.
2. Stable (STABLE)
The $STABLE token saw its recent positive momentum completely reverse over the last day.
- Current Price: $0.03223
- 24-Hour Performance: -18.10%
- 7-Day Performance: -16.57%
- Market Capitalization: $751,997,254
Market Insight: Even with a strong Year-to-Date (YTD) performance sitting at +130.55%, the token could not escape the broader market correction, losing nearly a fifth of its value in 24 hours.
3. Midnight (NIGHT)
$Midnight continued its multi-day downward trajectory, recording heavy losses as trading volume dried up.
- Current Price: $0.03146
- 24-Hour Performance: -16.84%
- 7-Day Performance: -9.64%
- Market Capitalization: $522,589,999
Market Insight: NIGHT showed minor hourly volatility (-0.48%) but continues to struggle structurally, with its YTD performance down 64.82%.
4. Filecoin (FIL)
$Filecoin faced heavy distribution, breaking below key support levels as sellers dominated the order books.
- Current Price: $0.7450
- 24-Hour Performance: -14.70%
- 7-Day Performance: -22.07%
- Market Capitalization: $586,971,496
Market Insight: FIL managed a minor 0.84% green hourly candle, but its macro trend remains firmly bearish, dragging its YTD performance down to -42.49%.
5. Polygon (POL)
$Polygon recently migrated native token faced aggressive capital flight during the market-wide de-risking phase.
- Current Price: $0.07599
- 24-Hour Performance: -14.51%
- 7-Day Performance: -14.76%
- Market Capitalization: $809,782,175
Market Insight: POL showed signs of an intraday bounce, rising 2.63% in the last hour, though it remains restricted under heavy overhead resistance.
6. Monero (XMR)
The prominent privacy coin $Monero rounds out the top six losers, falling alongside its sector peer, Zcash.
- Current Price: $320.93
- 24-Hour Performance: -14.46%
- 7-Day Performance: -13.99%
- Market Capitalization: $5,920,152,029
Market Insight: XMR experienced a 3.40% hourly bounce as traders stepped in near local support, but the asset faces a 24.16% deficit on the year.
Decrypt
Terra Luna Classic was left behind after an epic collapse almost four years ago. But there’s a community of believers who haven’t given up.
Fallout from a bug that enabled undetectable Zcash counterfeiting shows that privacy can sometimes present tradeoffs, experts say.
Strategy shares tumbled alongside Bitcoin on Friday as the firm's flagship preferred stock also came under pressure.
The company behind Claude embedded engineers at the NSA for offensive cyber ops, then published a report warning AI could soon build itself without humans in the loop.
The price of Zcash cratered following the disclosure of a serious vulnerability for the privacy coin. Can ZEC make a comeback anytime soon?
U.Today - IT, AI and Fintech Daily News for You Today
BlackRock returns to the selling scene just a day after making the first Bitcoin purchase in nearly three weeks. This time, it sold $213 million worth of Bitcoin.
XRP ETFs have recorded the lowest weekly inflow since the past five weeks as momentum begins to slow in the new month and lesser capital entering into the product.
Zcash fell to a low of $250 following a two day drop before rebounding.
A large amount of Ethereum transfer has been traced to Ethereum’s co-founder, Joseph Lubin in a suspected sell-attempt as price volatility continues to intensify.
Bitcoin fell to $59,073, its lowest price level since October 2024 before slightly rebounding near $60,000.
Blockonomi
TLDR:
- PYUSD supply shrinks 31% from $4.2B ATH, dropping to $2.92B amid shifting liquidity flows in 2026
- Over $1B wiped from circulation as market volatility reduces stablecoin minting and exchange inflows
- PayPal expands PYUSD across 70 markets, boosting wallet usage and cross-border payment access globally
- Stablecoin remains mid-tier as USDT and USDC dominate broader crypto liquidity and settlement flows
PYUSD supply contraction has drawn attention across stablecoin markets as PayPal’s dollar-backed asset retraces from its $4.2 billion March peak to around $2.92 billion.
The movement reflects shifting liquidity conditions, softer market participation, and evolving usage patterns even as PayPal continues scaling PYUSD access across 70 global markets in 2026.
Supply Compression From Peak Levels Across Crypto Markets
PayPal’s $PYUSD stablecoin supply has shrunk 31% as circulating tokens fall sharply from the March 2026 peak of $4.2 billion to around $2.92 billion. The contraction removes over $1 billion in market value within a short trading window.
Issuance trends show reduced inflows across exchange wallets and payment channels during heightened volatility conditions across digital asset markets.
The decline aligns with broader pressure across crypto assets as Bitcoin retraced toward key technical zones near $60,000 during the same period.
Market participants shifted liquidity into stable holdings while reducing exposure to risk assets. PYUSD flows reflected similar behavior, with lower minting activity observed across regulated issuance channels and custodial reserves linked to PayPal’s stablecoin infrastructure operations globally.
Corporate and macro factors also influenced the contraction phase. PayPal faced earnings pressure and a leadership transition earlier in 2026, which impacted sentiment across its digital asset initiatives.
Regulatory uncertainty across payment corridors added further caution among institutional participants. Despite these conditions, PYUSD continued operating within PayPal’s payment ecosystem, maintaining utility across wallet transfers and merchant settlement layers.
Expansion Strategy Across Global Payment Infrastructure
PayPal’s $PYUSD stablecoin continues scaling access across 70 global markets. Users in Asia-Pacific, Europe, and Latin America can now hold, send, and receive PYUSD directly through PayPal accounts.
The rollout extends stablecoin functionality beyond the United States, integrating it into cross-border digital payment flows across retail and merchant ecosystems.
Merchant settlement remains a key focus of the expansion strategy. PYUSD enables payment proceeds to be accessed within minutes compared to traditional banking delays. This shift improves liquidity cycles for businesses operating across international markets.
PayPal’s blockchain-based settlement framework supports faster value transfer while reducing friction in cross-border commerce environments and digital transaction processing systems globally.
Within the broader stablecoin ecosystem, USDT and USDC continue to dominate circulation volumes, while PYUSD maintains a mid-tier position despite recent contraction.
The token remains backed by dollar deposits and short-term Treasury instruments through regulated issuance structures.
Continued integration into PayPal’s global infrastructure signals sustained operational use cases even as supply adjusts to changing market conditions.
The post PayPal’s $PYUSD Stablecoin Supply Shrinks 31% From $4.2B ATH to $2.92B appeared first on Blockonomi.
TLDR:
- ETH near $216.03B faced pressure as price volatility narrowed the gap with USDT at $ 187.35 B
- Stablecoin inflows lifted USDT dominance as traders rotated capital during risk-off market phases
- Liquidity shifts intensified as ETH derivatives liquidations accelerated downside capitalization impact
- Ranking compression emerged as valuation gap shrank to roughly $28.68B between ETH and USDT
Ethereum has lost its long-held market capitalization lead as Tether moves ahead during volatile trading conditions.
ETH stands near $186.263B, while USDT rises to about $187.05B, marking a rare reversal driven by liquidity shifts and stablecoin demand across markets.
Market Rotation and Capital Pressure
A notable shift has emerged in crypto rankings as Ethereum vs Tether market cap flippening takes shape across global exchanges.
Ethereum currently holds a valuation of approximately $186.263 billion, while Tether has moved slightly ahead at around $187.05 billion.
The difference between both assets now stands at less than $1 billion, making the gap extremely tight. As ETH faced renewed selling pressure, its market capitalization declined rapidly, with price volatility across major trading pairs and derivatives markets.
At the same time, traders increased allocation into USDT during risk-off conditions. This shift strengthened stablecoin liquidity across exchanges.
Consequently, Tether’s circulating supply expansion supported its rise above Ethereum in total market capitalization rankings.
Derivatives liquidations added further pressure on ETH valuation. As leveraged positions unwound, downward momentum intensified.
Meanwhile, USDT remained stable due to its peg structure, allowing it to maintain consistent valuation growth through demand-driven issuance.
Stablecoin Strength and Ethereum Valuation Compression
The Ethereum vs Tether market cap flippening reflects a structural contrast between volatile asset pricing and stablecoin mechanics.
Ethereum’s market cap is directly influenced by price movements, while Tether’s valuation is driven by supply expansion, now near $187.05 billion.
As Ethereum declined toward $186.263 billion, its ranking position weakened. This movement was not linked to network activity loss but rather short-term market pricing pressure and liquidity repositioning across exchanges during volatile sessions.
Meanwhile, stablecoin demand continued to rise across trading platforms and settlement channels. USDT became a preferred asset for capital preservation, especially during periods of uncertainty where traders reduced exposure to directional crypto assets.
Despite the temporary ranking shift, Ethereum remains a dominant smart contract platform. However, current market conditions allowed Tether’s stable valuation model to surpass ETH briefly, highlighting how liquidity flows can reshape capitalization rankings in compressed market environments.
The post Tether Flips Ethereum to Become Second Largest by Market Cap as ETH Drops to $186.263B appeared first on Blockonomi.
TLDR:
- Crypto liquidation heatmap recorded $1.28 billion in losses as market leverage rapidly unwound.
- Long positions suffered nearly $996 million in liquidations, far exceeding short-side losses.
- Bitcoin and Ethereum accounted for over $830 million of total liquidations during the selloff.
- More than 264,000 traders were liquidated as cascading margin calls accelerated declines.
Crypto liquidation heatmap data revealed one of the largest leverage flushes seen in recent weeks, with more than $1.28 billion erased from crypto derivatives markets in a single day.
The event exposed excessive bullish positioning as traders faced a rapid wave of forced liquidations across major digital assets.
Long Traders Bore the Brunt of the Market Unwind
The crypto liquidation heatmap showed a clear imbalance between bullish and bearish positions. Of the $1.28 billion liquidated during the period, nearly $996 million came from long positions, while short liquidations totaled about $289 million.
The figures suggest traders entered the session with strong expectations of further upside. However, once prices started weakening, leveraged positions quickly became vulnerable.
As margin levels deteriorated, exchanges automatically closed positions to limit losses, accelerating selling pressure throughout the market.
$1.36 BILLION got wiped out from the crypto market in the last 24 hours! pic.twitter.com/zgOSMdDlCA
— The Moon Show (@TheMoonShow) June 6, 2026
Data from liquidation trackers showed how quickly conditions worsened. What started as modest liquidations during the early hours evolved into a broad market deleveraging event.
The process created a chain reaction where each forced sale contributed to further downside pressure, triggering additional liquidations.
More than 264,000 traders were reportedly liquidated during the move. The scale of participation indicates that both retail and larger market participants were caught in the downturn. One of the largest reported liquidations involved a BTCUSD position valued at approximately $9.02 million.
Bitcoin and Ethereum Dominate Liquidation Activity
Bitcoin and Ethereum accounted for the majority of losses displayed on the crypto liquidation heatmap. Bitcoin registered approximately $476.53 million in liquidations, while Ethereum followed with around $354.02 million.
Source: CoinGlass
Combined, the two largest cryptocurrencies represented more than $830 million of the total liquidations. Such concentration reflects the amount of leveraged capital typically deployed in major digital assets, particularly during periods of strong market optimism.
Separate heatmap snapshots also placed Ethereum at the top of liquidation rankings in certain intervals. This trend is often observed when traders seek higher returns through ETH exposure during bullish phases. As sentiment shifted, those positions faced heavier pressure.
The timeline of liquidations further demonstrated the speed of the move. Losses climbed from roughly $7.82 million in the first hour to $40.76 million within four hours. By the 12-hour mark, liquidations had surpassed $336 million before ultimately reaching $1.28 billion.
While the selloff caused substantial losses, the event also removed a significant amount of leverage from the market.
The crypto liquidation heatmap captured a rapid transition from aggressive risk-taking to defensive positioning, illustrating how quickly sentiment can change within the digital asset sector.
The post $1.36 Billion Wiped Out of the Crypto Market After a Brutal 24-Hour Flush appeared first on Blockonomi.
For a long time, online gambling in the United States has been ruled by a small group of big brands. Caesars and DraftKings are two of the names that come up the most. Both have huge marketing budgets, strong sports ties, and loyal player bases. But the market is starting to change. Crypto-focused platforms are pulling more players away from the old names every month, and ZunaBet, launched in 2026, is one of the newer brands making waves.
This piece breaks down how Caesars and DraftKings stack up against each other, and where ZunaBet fits as a fresh option built for a different kind of player.
The Two Big Names in Traditional Betting
Caesars has roots that go back decades in physical casinos. The company brought that history online with Caesars Palace Online Casino and the Caesars Sportsbook. It runs on fiat currency, with deposits through cards, bank transfers, and PayPal. Its loyalty program ties online play to real-world rewards like hotel stays and meals at Caesars properties.
DraftKings came from a different starting point. It began with daily fantasy sports and grew into a full betting platform. Now it is one of the most recognized brands in US sports betting, with strong mobile apps and major league partnerships. It works in the same fiat-based, state-licensed system as Caesars.
Both brands are dependable and easy to use if you live in a supported state. But both also share the same downsides. They are limited by state laws, slower on payouts than crypto sites, and their game libraries are small compared to what global platforms offer. Their VIP programs follow the same point-and-tier setup that has been around for years.
ZunaBet Joins the Conversation
ZunaBet is a newer name that has been picking up steam since it launched in 2026. It is run by Strathvale Group Ltd and licensed in Anjouan. Unlike Caesars and DraftKings, which were built for the traditional US system, ZunaBet was designed as a crypto-first platform from day one. That changes a lot about how it feels to use.
The casino has over 11,000 games from more than 60 providers, including big names like Pragmatic Play, Hacksaw Gaming, Yggdrasil, BGaming, and Evolution. That library is far bigger than what most US-licensed sites can run. Players get slots, table games, and live dealer rooms all under one account.
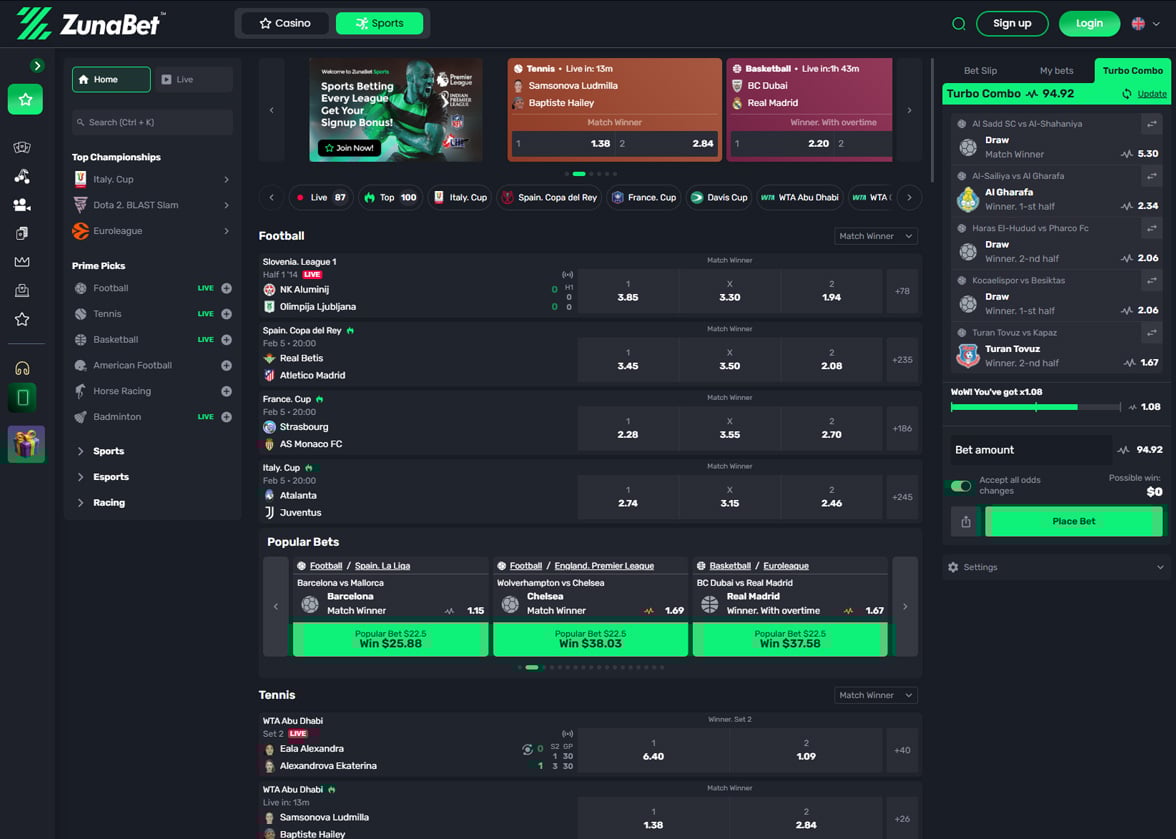
ZunaBet also runs a full sportsbook. It covers football, basketball, tennis, NHL, and other major sports, along with esports like CS2, Dota 2, League of Legends, and Valorant. Virtual sports and combat sports are part of the lineup too, which makes it a hybrid platform similar to DraftKings but with wider coverage.
Crypto Changes the Game
This is where the difference between ZunaBet and the older platforms really shows. Caesars and DraftKings deal in dollars. That means bank processing, possible holds, and slower withdrawals.
ZunaBet works with more than 20 cryptocurrencies, including Bitcoin, Ethereum, USDT across several chains, Solana, Dogecoin, Cardano, and XRP. There are no platform processing fees, and withdrawals move quickly. For players who already use crypto or want faster, cheaper transactions, this is a big upgrade.
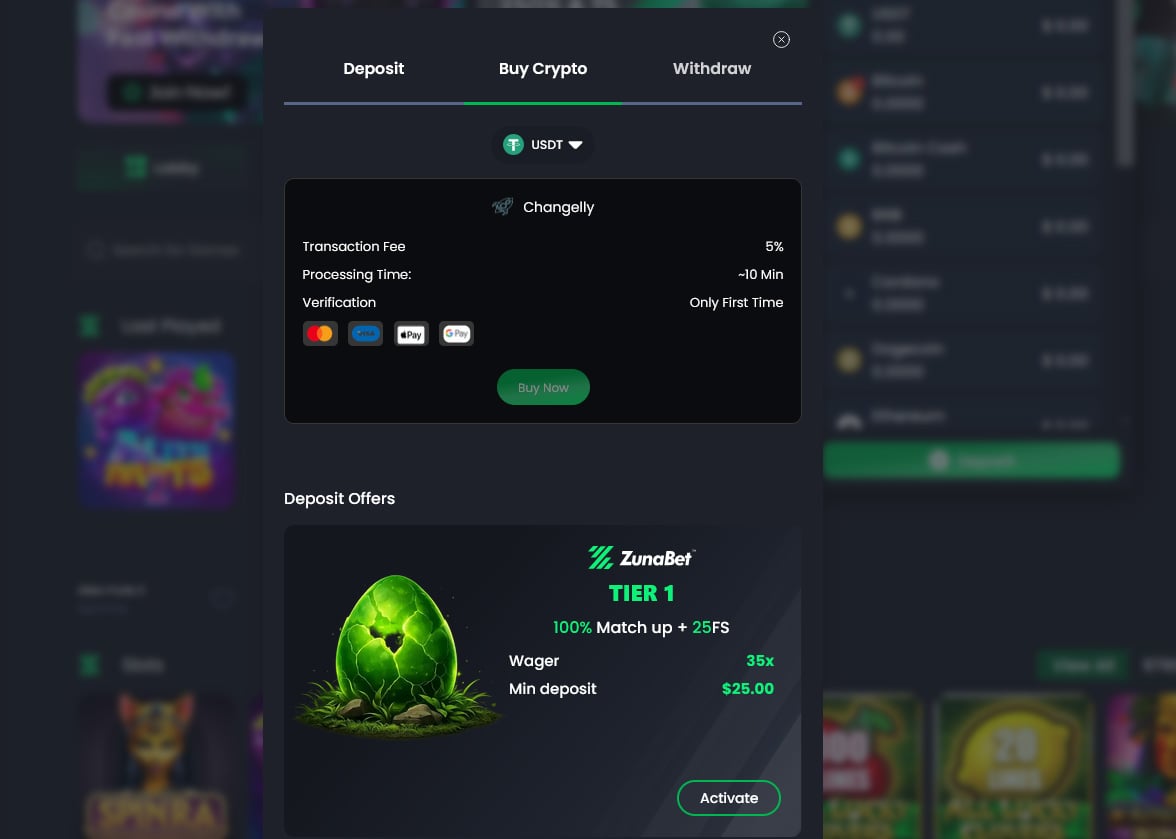
Crypto platforms also tend to operate globally instead of being locked to specific states. Players in many regions can get the full library and sportsbook without the geographic walls that come with US-based brands. For younger players who already live in a digital, crypto-friendly world, this is closer to what they expect from a modern platform.
How the Welcome Offers Compare
Caesars and DraftKings offer welcome bonuses that usually take the form of a deposit match or a risk-free first bet. These promos depend on state rules and often come with tight wagering requirements.
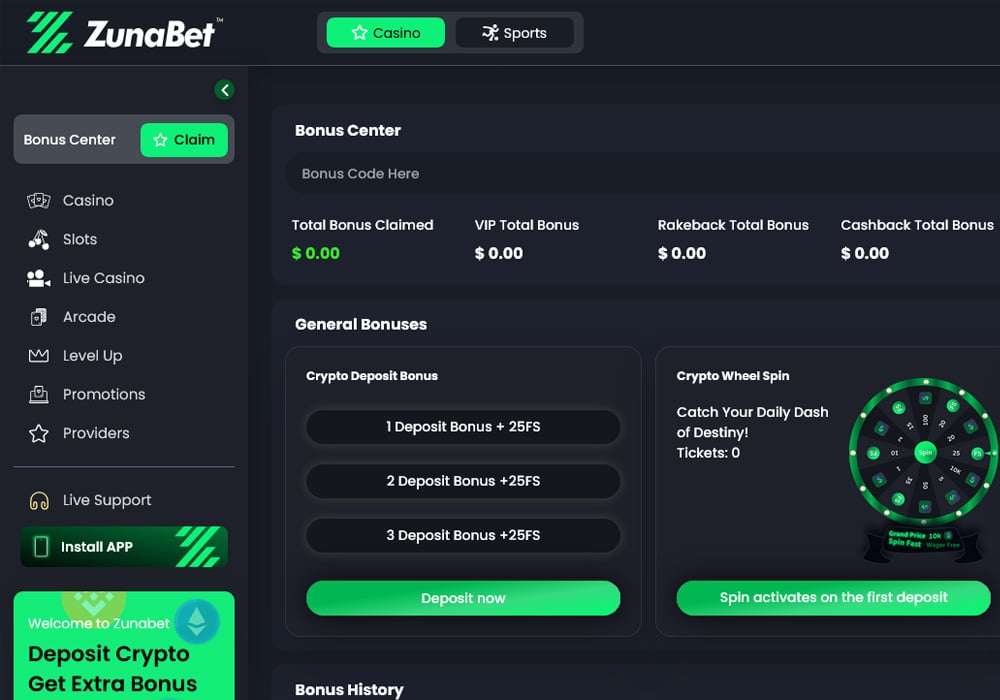
ZunaBet offers a welcome package worth up to $5,000 plus 75 free spins, split across three deposits. The first deposit comes with a 100% match up to $2,000 plus 25 spins. The second adds a 50% match up to $1,500 plus 25 spins. The third gives another 100% match up to $1,500 plus 25 spins. It is marketed as a 250% bonus across three deposits, giving new players more chances to try the platform than a single-deposit offer would.
Loyalty Programs Side by Side
Caesars Rewards is one of the most well-known loyalty programs in gambling. It connects online play to real-world perks at Caesars properties, which is great if you visit Las Vegas or Atlantic City. DraftKings Dynasty Rewards offers points you can swap for bonuses, free bets, and event tickets.
Both work, but both follow the same model that has been used for decades. ZunaBet takes a different approach. Its loyalty program is built around a dragon evolution theme with a mascot called Zuno. There are six tiers: Squire with 1% rakeback, Warden with 2%, Champion with 4%, Divine with 5%, Knight with 10%, and Ultimate with 20% rakeback at the top.
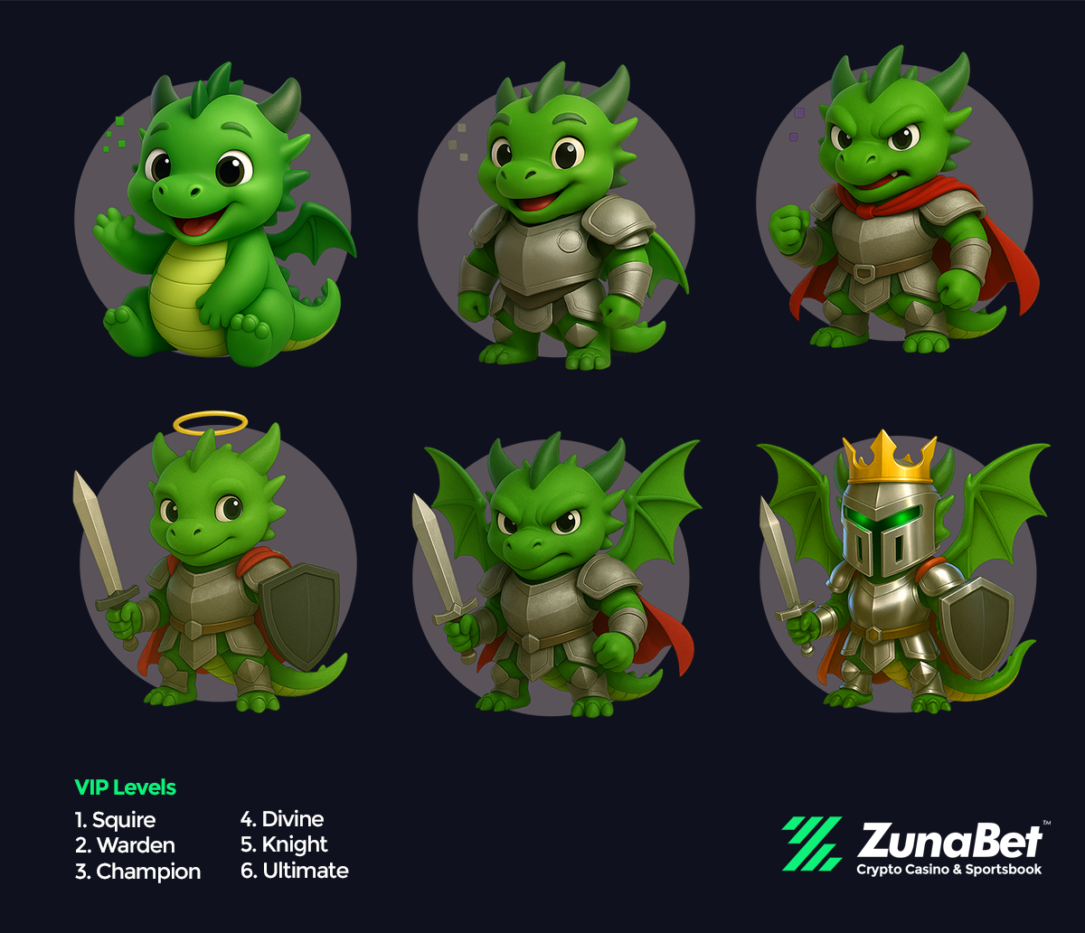
Players also earn tier-based free spins up to 1,000 spins, VIP club access, and double wheel spins as they level up. The whole setup feels more like progressing through a video game than collecting points on a card. For players who grew up with that kind of reward loop, it lands better than a standard VIP system.
Why ZunaBet Is the One to Watch
Caesars and DraftKings are still strong choices if you want a traditional, regulated US betting experience. Neither brand is going anywhere, and both have earned their place in the industry. But the way players pay, play, and stick with a platform is changing fast.
ZunaBet is built around that change. The crypto-first setup means quicker payments and lower fees. The game library is bigger than what the older brands can match. The sportsbook covers traditional sports and esports in one place. The dragon-themed loyalty program turns regular play into something that feels rewarding and fun to chase.
For players who want speed, variety, and a more modern feel, ZunaBet is one of the more exciting options out there right now. It is still an emerging platform, but everything about it points to where online casinos are heading next. A new generation of players expects crypto support, gamified rewards, and global access as standard features, not bonuses.
Caesars and DraftKings built what online betting looks like today. ZunaBet is one of the platforms shaping what it will look like tomorrow.
The post Caesars vs DraftKings: Where ZunaBet Enters the Conversation appeared first on Blockonomi.
TLDR:
- Goldman Sachs projects $7.6 trillion in cumulative AI infrastructure capex between 2026 and 2031.
- Nvidia is forecast to capture 75% of the $5.1 trillion compute layer over the six-year period.
- Power is the smallest budget segment at $358 billion but the critical bottleneck for full deployment.
- Vistra locked in a 20-year, 2,600 MW nuclear deal with Meta to meet surging AI power demand.
Goldman Sachs has released a detailed projection of artificial intelligence infrastructure capital expenditure, forecasting $7.6 trillion in cumulative spending from 2026 to 2031.
The breakdown covers three core layers: compute at $5.1 trillion, data centers at $2.1 trillion, and power at $358 billion.
The report identifies specific companies positioned to absorb capital across each segment. At $765 billion in 2026 alone, annual AI capex is expected to reach $1.6 trillion by 2031.
Compute and Data Center Demands Drive Infrastructure Buildout
Goldman Sachs AI infrastructure projections place Nvidia at the center of the compute layer. The firm assumes Nvidia will capture 75% of all compute spend over the forecast period, translating to roughly $3.8 trillion in cumulative revenue through its products. The baseline unit for this projection is the Rubin VR200 chip, priced at $80,500 per GPU.
Nvidia’s data center GPU gross margins sit at 75%, which is why major hyperscalers are developing custom silicon.
However, performance gaps mean those same companies continue purchasing Nvidia hardware in parallel. No current alternative matches its output at scale.
The data center layer reflects a sharp escalation in physical requirements. Standard cloud infrastructure runs between 5 and 15 kilowatts per rack.
Transitional Blackwell-era AI facilities operate at 130 to 200 kilowatts per rack. Next-generation AI factories running Rubin and Feynman chips require over 500 kilowatts per rack, with liquid cooling as the only viable thermal option.
Construction costs are rising alongside density. Traditional hyperscale data centers cost approximately $10 million per megawatt to build.
Next-generation AI data centers are being planned at $15 to $20 million per megawatt, a sharp increase driven by cooling and power infrastructure requirements.
Power Constraints and Key Companies Shape the Capital Cycle
Goldman Sachs AI infrastructure analysis identifies silicon useful life as the single largest variable in the model. At a three-year replacement cycle, cumulative compute depreciation reaches $3.99 trillion. A seven-year cycle drops that figure to $2.23 trillion, a difference of $1.76 trillion on one assumption.
Vertiv is positioned directly within the data center upgrade cycle. Every rack transitioning from 40 kilowatts to 500-plus kilowatts requires new liquid cooling systems and power distribution equipment. The liquid cooling market is projected to grow from $5.5 billion today to $15.75 billion by 2030.
Power, at $358 billion, is the smallest budget segment but the most operationally critical. Amazon CEO Andy Jassy captured the constraint plainly: “Our single biggest constraint is power.”
Grid connection timelines for large data centers extend into years, making early contracting essential for deployment.
Vistra has responded to that constraint by locking in long-term nuclear power purchase agreements. The company secured a 20-year deal with Meta covering over 2,600 megawatts of nuclear energy, along with a separate agreement with AWS.
Goldman Sachs and Jefferies both upgraded Vistra following the Meta announcement, according to Milk Road AI’s breakdown of the report.
The post Goldman Sachs Maps $7.6 Trillion AI Infrastructure Spending Through 2031 appeared first on Blockonomi.
CryptoPotato
As bitcoin (BTC) continues to weather the storms of the bear market, the asset’s OG holders are waking up. A few days ago, an anonymous holder redeemed a physical bitcoin 15 years after it was created, receiving 25 BTC from the redemption.
According to a tweet from Galaxy Research, the physical coin redeemed is an S1-COIN-25, part of the Casascius coins created between 2011 and 2013. The redemption netted over $1.78 million in bitcoin, calculated at current prices.
OG Holder Redeems 25 BTC
A Casascius coin is a physical token created by the early Bitcoin adopter and software engineer Mike Caldwell. The tokens were created with denominations of 0.5, 1, 5, 10, 25, 100, and 1,000 BTC, meaning they held real digital bitcoins. With receiving bitcoin addresses printed on the outside, each coin has a tamper-evident hologram concealing the matching private key at the back.
Caldwell created brass, fine silver, gold-plated coins, and gold-plated bars, with their sizes ranging from 25.4 mm to 30 mm in diameter. The bars would weigh about 12 ounces if they were solid gold, but since they are metal alloys with gold plating, they weigh 4.2 ounces instead. They were all available as pre-loaded BTC coins and bars and are currently available on secondary markets like eBay, even though Caldwell stopped production in 2013 because he was operating as a money transmitter without a license.
To redeem the coins, one has to peel the hologram at the back of the token to retrieve the private keys. The coin’s balance can be verified on platforms like Block Explorer by inputting the eight-character code seen on the outside of the coin.
From Conversation Pieces to Storage Vessels
Over the last 15 years, Casascius coin holders have redeemed their tokens for BTC, netting millions of dollars in profits. Some of the coins were worth less than $100 dollars at creation, but bitcoin’s rally over the years has increased their value significantly. These coins were created as conversation pieces to help talk to people about BTC; however, they ended up as forms of storing the asset long after their production.
The Casascius coin that was redeemed within the week was created in December 2011 alongside thousands of other coins. In fact, data from the Casascius tracker shows that there are 27,916 coins and bars in existence, 10,479 of those having been opened. The collective value of the coins and bars created now stands above $6.2 billion, given bitcoin’s latest price.
Meanwhile, the latest redemption comes as other OG holders wake up to move long-dormant assets.
The post OG Bitcoin Holder Wakes Up, Redeems Casascius Coin For 25 BTC After 15 Years appeared first on CryptoPotato.
In such times of distress, in which the broader crypto market has experienced a sudden and painful decline, Cardano’s co-founder decided to take a break after a short and bitter announcement on X.
Charles Hoskinson’s decision only worsened ADA’s positioning, as the asset tumbled by double digits on Friday and dumped below $0.19 at the time. It kept plunging in the following hours and slumped to under $0.16 later that day, which became its lowest price level since December 2020. The question we asked ChatGPT’s latest version is how low the token can go now.
Consequences for Cardano and ADA
The numbers paint a clear story for ADA. At one point on Friday, it was down by 14% on a 24-hour scale. The weekly losses are up to 30%, while the monthly decline is at 40%. The macro view paints an even more catastrophic picture, with a 75% value reduction in the past year and a whopping 94.7% drop since its all-time high seen in September 2021.
As such, Hoskinson’s move expectedly caused a lot of controversy immediately, with the social media comments exploding. A few praised his decision, others doubted it, and some lashed out.
ChatGPT reassured that Hoskinson has not resigned from Cardano, but the timing matters. His announcement came shortly after the shutdown of major ecosystem participants, the cancellation of Cardano’s flagship summit, and public warnings that additional projects and DeFi applications could disappear before the end of the year.
“The market is treating the move as a vote of no confidence. Whether that interpretation is fair or not is almost irrelevant. Crypto markets are driven by narratives and the current dominant one is that Cardano’s ecosystem is shrinking while competitors continue to attract developers, liquidity, and users,” the AI stated.
So, How Low?
After acknowledging that ADA has already erased years of gains with its drop below $0.17, ChatGPT warned that it could still have room to fall if sentiment continues deteriorating.
Its bearish scenario envisions another leg down, perhaps toward $0.12. If that level cracks, then Cardano’s native asset could be on the way down to even under $0.10. Extreme capitulation sees a decline to $0.08, while the “nuclear scenario” from the AI platform outlined $0.05 as the lowest target.
“For ADA to trade below five cents, Cardano would likely need to enter a prolonged death spiral involving developer departures, collapsing liquidity, and a broader crypto bear market,” it concluded.
The post How Low Could ADA Fall Without Hoskinson? AI Issues Stark Warning appeared first on CryptoPotato.
After plunging by several grand in the span of less than 12 hours, bitcoin finally rebounded from its multi-year low and now sits at around $61,000.
Although most altcoins are still in the red on a daily scale, they have managed to recover some of the losses. This is particularly true for ZEC, which bled out heavily yesterday, and PI, which marked consecutive all-time lows.
Bitcoin Recovers $2K
What a week it has been for bitcoin, and mostly for the bears. In fact, what a painful three-week period. The asset stood above $82,000 in mid-May before its calamity began, and it dumped to $74,000 at the end of the month. But that was just the start, as June, in just five days, brought a lot more pain.
Bitcoin quickly lost the $70,000 support, and then the bears were really in control. They started pushing it below one key support level after another. Thus, $68,000, $65,000, and $62,000 gave in before the asset came inches away from the $60,000 bottom that managed to hold it during the February crash.
Although the buyers successfully defended it at first, that level finally gave in yesterday, and bitcoin plunged to just over $59,000. This became its lowest price since before the November 2024 US presidential elections. After losing about $23,000 in weeks, BTC finally showed signs of a minor recovery and has bounced to $61,000 as of now.
Its market cap is up to $1.225 trillion on CG, while its dominance over the alts has reclaimed the 56% level.

ZEC, PI Rebound
Although most crypto assets plunged yesterday, Zcash became the worst performer after a vulnerability in its code was uncovered and Arthur Hayes dumped his entire stash. At one point, ZEC had dropped by over 50%, going from $630 to under $300. However, it has reacted swiftly and now trades above $370.
Pi Network’s native token marked several consecutive all-time lows after it dumped below $0.15 earlier this week. The latest, according to CoinGecko data, sits at under $0.12. However, it has managed to reclaim that level since then and now trades about 7% above the ATL.
ETH dumped to $1,500 yesterday but stands close to $1,600 now. BNB is back to $580, while XRP has returned to $1.10. XLM and CC are among the few alts in the green today.
The total crypto market cap dipped to $2.1 trillion yesterday, and although it has recovered some of its losses, it still sits below $2.2 trillion on CG.

The post Pi Network’s PI Token Rebounds After New ATL, BTC Quickly Reclaims $60K: Weekend Watch appeared first on CryptoPotato.
Despite outlining bullish predictions for several popular altcoins in the past few months, such as WLD, ZEC, HYPE, and NEAR, Arthur Hayes has publicly declared that he has sold almost all of his positions long before his targets were reached.
This has caused a significant backlash from the cryptocurrency community, as some believe his hype is only to drag people into those assets before he dumps them at higher prices.
Hayes Continues Selling, This Time WLD
It was just several days ago that Hayes said he would be holding WLD for at least the first week of SpaceX’s IPO, as both have Elon Musk as a key person. He predicted that the IPO would “melt people’s faces off.”
Hours ago, though, he changed his tune after showing the chart of SpaceX’s stock getting wrecked on Friday during the market-wide calamity. He argued that the newly listed shares are heading in the wrong direction, which is why he decided to dump his WLD stash.
Popular on-chain sleuth ZachXBT was among the first to call out Hayes on his controversial moves, asking how much “exit liquidity was created” from his followers over the past few days. He also brought up other major sales from Hayes.
As reported yesterday, the BitMEX co-founder disposed of his ZEC stash after developers revealed a Zcash code vulnerability that was already fixed at the time of his sale. Previously, he had also dumped HYPE and NEAR holdings after making some quite optimistic price predictions.
How much exit liquidity was created from your followers over the past couple days?
First NEAR HYPE ZEC
Now WLD pic.twitter.com/vyDXwCHRwO— ZachXBT (@zachxbt) June 6, 2026
Community Lashes Out
The analysts at Lookonchain also flagged his exits, especially since they arrived close to the assets’ price tops. Interestingly, all of them plunged in the hours after he disclosed his exodus and have returned to essentially the same levels where they were before his big price predictions.
Arthur Hayes(@CryptoHayes) called $ZEC, $NEAR, and $WLD.
He sold near the top, then disclosed his exit and turned bearish.$ZEC, $NEAR, and $WLD are now back to where they were before his calls. pic.twitter.com/IlvCqTHe3r
— Lookonchain (@lookonchain) June 6, 2026
Some of the comments below the posts on X were quite brutal, calling it a “douchebag” move for shilling an altcoin just hours before dumping it. Others noted that if any traders followed his moves, they were “small scammers” that were “scammed” by the “big scammer.”
The post Shilling Before Dumping? Why Crypto X Is Furious With Arthur Hayes After His Latest Sale appeared first on CryptoPotato.
Bitcoin’s price crash that began at the start of the business week culminated yesterday evening, at least for now, with a painful decline to a multi-year low of $59,100 on most exchanges.
This violent drop of roughly $23,000 in the span of just a few weeks might be regarded as a proper buy-the-dip opportunity, but popular analyst Ali Martinez believes the most lucrative levels are yet to come.
In a recent post on X following the Friday night massacre, Martinez said the “best risk-reward opportunities typically emerge” when the asset drops into the 1.0 or 0.8 MVRV Pricing Bands.
Despite the correction, BTC is still far from these levels, he added. In order to reach them, the cryptocurrency’s correction needs to extend further, as they currently sit just under $54,000 and over $43,000. Bitcoin hasn’t traded at such low levels in over two years.
I believe the best risk-reward opportunities typically emerge when Bitcoin $BTC drops into the 1.0 and 0.8 MVRV Pricing Bands.
Those levels currently sit at $53,900 and $43,130, respectively. pic.twitter.com/crHwe4NNwH
— Ali Charts (@alicharts) June 6, 2026
In contrast, fellow analyst Crypto Rover believes the bottom might be in, according to a signal that has successfully determined all previous ones. His advice was that investors turn into a full-on accumulation mode, as they will be called “lucky” in 2-3 years when the next bull cycle peaks.
However, on-chain metrics and key technical tools still do not indicate that BTC has bottomed out during this phase. In fact, some analysts envision a more profound decline to $50,000, while Peter Schiff, staying true to his nature, predicted a crash to $20,000 if that support level is lost.
The post Should You Buy BTC Now? Analyst Reveals the Best Bitcoin Entry Levels After the Crash appeared first on CryptoPotato.