Cryptocurrency Posts
Crypto Briefing
AI's rapid self-improvement in coding could necessitate global oversight, as human roles shift towards strategic oversight and architecture.
The post Claude now authors over 80% of code merged into its own codebase appeared first on Crypto Briefing.
Heightened US-Russia tensions over Cuba could destabilize global markets, impacting energy supplies and increasing demand for digital assets.
The post Putin confirms talks with US on potential military operation in Cuba, raising geopolitical risk for markets appeared first on Crypto Briefing.
SK Hynix's US listing could reshape AI chip supply dynamics, offering investors direct access to a key memory supplier amid rising demand.
The post SK Hynix receives strong backing from investors for US listing plan appeared first on Crypto Briefing.
The integration of USDC on Base by Modern Treasury could accelerate stablecoin adoption in enterprise payments, bridging crypto and traditional finance.
The post Modern Treasury adds USDC on Base to bridge stablecoin payments with traditional banking rails appeared first on Crypto Briefing.
SpaceX's delayed S&P 500 inclusion highlights the tension between traditional index criteria and the evolving landscape of megacap IPOs.
The post S&P 500 delays fast tracking SpaceX inclusion by at least a year appeared first on Crypto Briefing.
Bitcoin Magazine
Bitcoin Magazine

The Hyperinflation of 1971 at the Kindergarten
I’m pretty sure it was 1971, but it could have been 1972. In any case, it was in kindergarten, and I was five years old. Our teachers had set up a system to motivate us kids to behave well. They had hung a big board on the wall, with all of our names listed. If you were particularly well-behaved, kind, helpful, or polite, they drew a black dot next to your name. Misbehave, and they gave you a red one. It was all about following the kindergarten rules, and the absolute transparency of it motivated most of us to try our best.
At some point, an extra prize was introduced for exceptionally good behavior: a small piece of fabric. From the group’s standpoint, that was worth much more than the top ranking in a row of black dots. And it was tangible. You could prove your elite status, even out in the sandbox.
Eventually, a trading system developed between us kids. For a scrap of fabric, you could get a bucket of sifted sand. For two, you could get a piece of candy. Suddenly, we could trade labor (sifting sand) for status symbols or sweets.
Then one day, a new teacher arrived. For whatever reason, she much more generously handed out those scraps of fabric. She simply changed the rules governing their distribution. All of a sudden, everyone had them, and you had to spend four for a piece of candy instead of two. Some of the kids started to complain. Their hard-earned scraps of fabric were now worth less, and they demanded more of them.

As you’d expect, the fabric scraps were given out more and more freely. Before long, anyone could take as many as they wanted. Eventually, they were lying around all over the place. They were worthless. No one wanted them anymore. You couldn’t trade them for anything. And so, at just five years old, I experienced genuine hyperinflation.
What does this have to do with Bitcoin?
In kindergarten, the rules were simply changed. The new teacher wanted to be nice, we kids whined, and suddenly more and more fabric scraps were handed out.
The rules of Bitcoin simply cannot be changed.
It’s a completely different story with our fiat currencies. They too have rules. The problem is that no one can ensure those rules are actually followed. Here is an example: the European Central Bank is not allowed to permanently finance governments through bond purchases, yet it does so anyway, brazenly and with no one doing—or even being able to do—anything about it. And who would intervene anyway?
Here’s another example. The Maastricht Treaty’s Stability and Growth Pact stipulated that the budget deficits of EU member states could not exceed 3% of their GDP, although permissible exceptions were built in. However, between 2000 and 2010, the Stability Criteria were repeatedly violated without sanctions—not only by Greece (11 times) but also by larger countries such as Italy (seven times), France (six times), and Germany (five times). According to the Maastricht Treaty, there are clear sanctions for countries that unlawfully fail to adhere to the deficit limit. But not once has such a sanction been imposed. No attempt was ever even made.
This may have been politically expedient and justified for whatever reason, but it shows how difficult it is for us to adhere to the rules. It’s like the New Year’s resolutions that we make with the greatest of convictions, but then usually don’t stick to for very long. The result is what matters. Currencies inflate and, sooner or later, become worthless. The U.S. dollar has lost 97% of its value over the last hundred years. The British pound, which originally represented a pound of silver, has suffered the same fate. All because more and more new dollars, euros, or pounds have been created, or to put it differently, printed.
The outcome is the same: when the fabric scraps become worthless, everyone who holds them loses their wealth.
This cannot happen with Bitcoin. Its rules are fixed, and no one controls the system nor can they simply change those rules.

Discover more in Bitcoin: The Honest Money!
This excerpt is just the beginning. Dive deeper into how inflation devalues your money, your savings, and your time in Bitcoin: The Honest Money by Alex von Frankenberg, Ph.D. The paperback is available now.
Order your copy here!
This post The Hyperinflation of 1971 at the Kindergarten first appeared on Bitcoin Magazine and is written by Alex v. Frankenberg.
Bitcoin Magazine
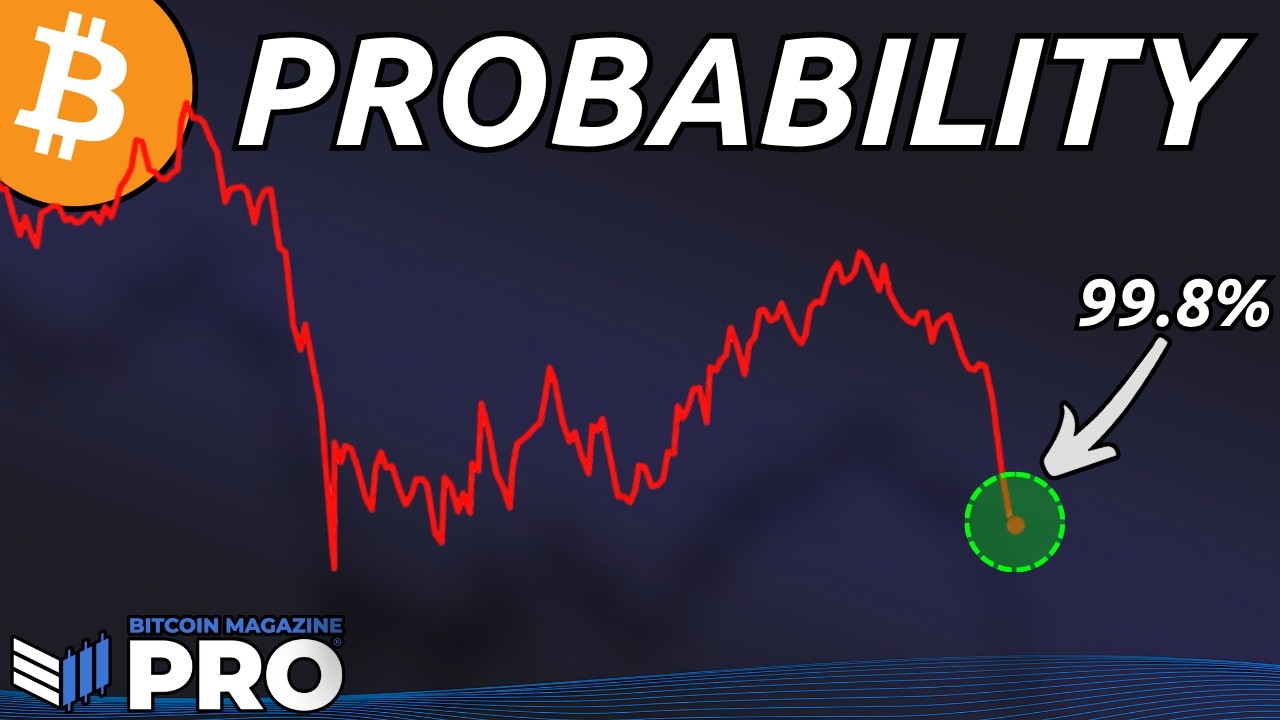
5th Worst Bitcoin Price Action Ever — I’m Buying At 99.8% Probability
The bitcoin price looks bad, but I’m buying. Price might go lower, it always can, but there is value at these levels, and I’m accumulating. I think it’s important to be honest about how I’m actually acting on the analysis I publish, rather than just presenting data from a distance. And right now, the data is saying something that has only been said a handful of times in Bitcoin’s entire history.
Let’s cut to the chase:
- The Crosby Ratio Z-score has one of the lowest readings in history.
- The RSI is at a level we’ve only encountered a handful of times in extreme market lows.
- Bitcoin has bounced off the 200-week moving average.
- The SOPR is in the bottom fifth percentile of all historical readings.
- The Mayer Multiple is also in its bottom fifth percentile.
The Crosby Ratio
The Crosby Ratio Z-score measures bitcoin’s price momentum and standardizes it for Bitcoin’s evolving volatility. It’s not a fixed threshold as it adjusts as the market matures and volatility compresses, making it applicable across every stage of Bitcoin’s history. The current reading is around -1.7. This means 99.8% of all days in Bitcoin’s history have registered a less extreme reading on this indicator.

Figure 1: The Crosby Ratio Z-Score has just dipped to one of its lowest ever values.
The list of instances where this reading has been as low: the recent drop to $60,000, the first break below $20,000 in 2022, the COVID crash in March 2020, and the 2018 bear market low. That’s it. Four occasions in over a decade of price history. Every single one of them turned out to be a significant accumulation opportunity.
The RSI
The Relative Strength Index is one of the most widely used momentum indicators across all markets. Bitcoin’s weekly RSI is currently at one of the lowest levels ever. The previous instances of readings this low were the 2015 bear market low, the 2018 bear market low, the COVID crash, and the recent drop to $60,000.

Figure 2: The Relative Strength Index is comparable to historical lows.
Two independent momentum indicators, measured completely differently, but producing the same short list of historical comparisons. That kind of confluence across methodologies isn’t something to dismiss.
The 200-Week Moving Average
The 200-Week Moving Average has served as bear market support throughout Bitcoin’s history. The only meaningful exception was the FTX collapse in late 2022, which caused a brief but sharp undershoot before a rapid recovery. Outside of that event, this level has held as a floor every single cycle.

Figure 3: Bitcoin currently sits just above its 200WMA.
View Live Chart
Bitcoin has just bounced off that level again. Directly beneath current prices sits the recent cycle low, creating the structure for a potential double bottom, one of the more reliable technical formations across any market. The 200-week moving average and the Bitcoin Realized Price converge in approximately the same zone, adding further weight to this level as meaningful structural support.
SOPR & The Mayer Multiple
The Spent Output Profit Ratio is currently in the bottom fifth percentile of all historical readings. This means the rate of realized losses across the Bitcoin network, the pace at which holders are selling at a loss, is in the deepest 5% of anything we’ve ever recorded. The selling that has driven this move has been predominantly short-term in nature; value days destroyed data confirms that long-term holders have largely not participated in this liquidation. These are short-term traders and leveraged positions being cleared out, and not the conviction holders capitulating.

Figure 4: The Spent Output Profit Ratio illustrates the severity of recent losses.
View Live Chart
The Mayer Multiple, which measures bitcoin’s price relative to its 200-day moving average, is simultaneously in its own bottom fifth percentile. When these two indicators have historically been in their lower extremes at the same time, the resulting accumulation opportunities have been exceptional. It has happened only a handful of times, and each instance has been followed by significant price appreciation.

Figure 5: The Mayer Multiple has reached levels corresponding to previous bear cycle lows.
To Sum It Up
I’ll be honest, the strength of the decline surprised me. I anticipated a pullback from the $80,000 resistance zone, but the move through $70,000 was sharper than expected. What hasn’t surprised me is the data that’s emerged as a result, because this kind of confluence across technical, on-chain, and momentum indicators has appeared before, and the market has consistently rewarded accumulation at these readings.
Could we go lower? Yes. The realized price sits not far beneath current levels and represents the next meaningful support zone if the low is revisited. I’m prepared for that scenario. But removing all emotion and looking purely at what the data is saying, five independent signals simultaneously in generational territory, this is not the moment to wait on the sidelines for a marginally better price.
Subscribe to Bitcoin Magazine Pro on YouTube for more expert market insights and analysis!
Disclaimer: This article is for informational purposes only and should not be considered financial advice. Always do your own research before making any investment decisions.
This post 5th Worst Bitcoin Price Action Ever — I’m Buying At 99.8% Probability first appeared on Bitcoin Magazine and is written by Matt Crosby.
Bitcoin Magazine

Bitcoin’s Pullback Tests Institutional Adoption Narrative as Pompliano Stays Bullish
Bitcoin’s recent price decline is testing one of the asset’s most prominent bullish narratives: that institutional adoption will stabilize volatility and support long-term growth.
Despite the downturn, ProCap Financial CEO Anthony Pompliano thinks that the broader trajectory remains intact, framing the current weakness as a natural phase in Bitcoin’s maturation into a mainstream financial asset.
Speaking on CNBC’s “Power Lunch,” Pompliano said Bitcoin’s integration into traditional finance is accelerating, pointing to growing interest from major institutions such as BlackRock CEO Larry Fink.
According to Pompliano, this shift represents the realization of a long-anticipated transition from a niche, ideologically driven asset to a widely held portfolio allocation.
“Bitcoin is maturing into a traditional finance asset,” Pompliano said, adding that institutional demand signals “what mass adoption looks like.”
Bitcoin has come under pressure in recent weeks, with prices retreating amid broader risk-off sentiment and capital rotation into equities, particularly in high-growth sectors like artificial intelligence and newly listed public companies.
The downturn has revived concerns that Bitcoin’s adoption cycle may be nearing saturation, limiting its ability to deliver the outsized returns seen in prior cycles.
Some argue that Bitcoin’s earlier growth was driven largely by rapid user adoption and speculative inflows — dynamics that may be harder to replicate now that the asset has reached a more mature phase.
As the CNBC host noted, the “adoption story” may have already peaked.
At the same time, some market participants, including Strategy’s Michael Saylor, have suggested capital could be rotating out of crypto into other high-momentum opportunities, including upcoming IPOs and AI-linked investments.
Pompliano: Rotation from bitcoin is natural, not structural
Speaking with CNBC, Pompliano pushed back on the idea that capital outflows signal structural weakness. Instead, he characterized the movement as typical portfolio rebalancing behavior.
“Capital chases momentum and returns,” he said, noting that Bitcoin’s liquidity makes it a convenient source of funds when investors pursue new opportunities.
The current market environment highlights a tension in Bitcoin’s evolution. While institutional adoption has broadened its investor base, it has also tied Bitcoin more closely to macroeconomic trends and cross-asset flows.
As a result, Bitcoin increasingly behaves like a risk asset during periods of market stress, declining alongside equities rather than acting as an uncorrelated hedge. This dynamic has complicated the narrative of Bitcoin as “digital gold,” particularly in the short term.
Still, Pompliano maintains that Bitcoin’s core fundamentals remain unchanged. He pointed to the network’s continued operation, decentralization, and predictable issuance schedule as evidence that the asset’s long-term value proposition is intact.
“Show me what has changed,” he said. “The network continues to do everything it is designed to do.”
Bitcoin as a ‘Savings Technology’
Pompliano reiterated his long-held view of Bitcoin as a hedge against fiat currency debasement, arguing that persistent government spending and monetary expansion underpin its long-term case.
He described Bitcoin as a “savings technology,” highlighting its historical compound annual growth rates — approximately 60% over the past decade and over 30% in the last three years — as evidence of its ability to preserve and grow capital over time.
In his view, Bitcoin’s role is less about short-term speculation and more about long-term wealth protection, akin to gold or real estate for previous generations.
This post Bitcoin’s Pullback Tests Institutional Adoption Narrative as Pompliano Stays Bullish first appeared on Bitcoin Magazine and is written by Micah Zimmerman.
Bitcoin Magazine

Bitcoin Price Plunges Below ‘Fire Sale’ Territory as Fear Index Reads 12 — Echoing the FTX Crash
Bitcoin price dropped to levels on Thursday that placed it below the “Fire Sale!” band on the Bitcoin Rainbow Chart — a depth not reached since the catastrophic FTX exchange collapse in November 2022 — as the Fear and Greed Index registered a reading of 12 out of 100, deep in “Extreme Fear” territory.
Bitcoin price opened today near $63,500 after sliding below $62,000 last night. That puts BTC below even the most discounted valuation band on the Bitcoin Rainbow Chart — a level the model historically flags as a rare and extreme buying signal.
The Bitcoin Rainbow Chart is somewhat of a logarithmic growth curve overlaid with color-coded sentiment bands. The deepest band — labeled “Basically a Fire Sale!” — represents the lowest tier of the model’s projected fair value range. When Bitcoin trades beneath it, the asset sits outside the historical channel that has contained BTC’s long-term price behavior.
JUST IN: Bitcoin is now below the "Fire Sale" territory for the second time in 4 years
— Bitcoin Magazine (@BitcoinMagazine) June 4, 2026
Buy the dippic.twitter.com/oU6qudhn6M

The last confirmed breach of the “Fire Sale!” floor occurred during the FTX exchange collapse in November 2022, when Sam Bankman-Fried’s crypto empire imploded and BTC cratered under forced selling pressure across the market. That event remains one of the most severe liquidity crises in crypto history.
Per Bitcoin Magazine Pro data from March 2026, Bitcoin price had already begun testing below the “Fire Sale!” zone — described at the time as “its first drop into this area since the FTX-induced crash”.
The renewed descent on June 4 deepens that breach, with the coin shedding ground for the second consecutive week.
Bitcoin price and market in ‘Extreme Fear’
The Fear and Greed Index, which runs on a scale of 0 to 100, registered 12 on Thursday — placing the market squarely in “Extreme Fear”. The index aggregates volatility, market momentum, social sentiment, and derivatives data into a single score.
A reading below 25 signals extreme fear, a condition that, by the index’s own framework, has historically preceded price recovery periods.
February 2026 saw the index touch an all-time low of 5, driven by a 52% drawdown from Bitcoin price’s peak of $126,000. Thursday’s reading of 12 sits just above that nadir, as Bitcoin price continues its slide from cycle highs.
On X today, Strategy’s Michael Saylor argued the sell-off reflects institutional capital rotating into AI infrastructure rather than a deterioration in Bitcoin’s fundamentals. The decline may have been compounded by concerns over Strategy selling 32 BTC to fund preferred-share dividends — its first bitcoin sale since 2022 — despite the company recently reducing debt by repurchasing $1.5 billion of convertible notes at a discount.
This post Bitcoin Price Plunges Below ‘Fire Sale’ Territory as Fear Index Reads 12 — Echoing the FTX Crash first appeared on Bitcoin Magazine and is written by Micah Zimmerman.
Bitcoin Magazine

Schwab Strategist: Bitcoin’s $60,000 Mining Cost Could Mark the Cycle Bottom
Bitcoin is in a bear market. That much is not in dispute.
What Jim Ferraioli, Director of Digital Currencies Research and Strategy at Charles Schwab, argued Wednesday on Bloomberg is more precise and more structural: this selloff has a measurable cost floor, and that floor is built not from sentiment or chart patterns, but from the physics of energy consumption.
The numbers frame the drawdown in context. Bitcoin peaked at $126,000 in the fall before collapsing to roughly $60,000 in February — a 50% correction that, while brutal for recent buyers, falls far short of the 75%-plus implosions that defined prior Bitcoin bear markets.
Ferraioli’s core analytical framework centers on one question: what does it cost to manufacture Bitcoin? The answer creates a natural gravitational floor that has held across multiple cycles.
For the most efficient miners — those operating at scale with next-generation ASIC hardware and access to the cheapest wholesale energy — the cost to produce one Bitcoin sits at approximately $60,000, Ferraioli said.
That figure is not arbitrary. It represents the all-in expense of powering a facility at roughly $0.07 per kilowatt-hour with the most advanced semiconductor fleets available.
The less efficient miners — those with older ASIC hardware, higher energy costs, and thinner operational margins — carry a production cost of approximately $95,000 per BTC, according to Glassnode data cited in Schwab’s May 2026 research report. That gap between $60,000 and $95,000 defines Bitcoin’s current valuation range.
Bitcoin’s energy floor: Why $60,000 may mark the bottom
Ferraioli argues that in deep bear markets, the cost of production for the best miners has historically served as the bottom. February’s low near $60,000 aligns almost precisely with that level, as well as BTC’s 200-week moving average.
The BTC selling pressure is not random. It is demographically specific. The investors driving forced liquidations are those who acquired Bitcoin during the past 18 months — buyers who rode the asset from sub-$80,000 up to $126,000 and then watched gains evaporate in full.
Schwab tracks two cost-basis metrics to quantify this pressure: the average acquisition cost for U.S. spot ETF and ETP holders, which stands near $83,000, and the active investor cost basis — excluding coins rewarded to miners — which sits near $78,000.
Both figures sit well above current spot prices, putting the majority of recent entrants into unrealized loss positions and reinforcing $83,000 as a ceiling of overhead supply rather than a floor of support.
Glassnode’s on-chain data corroborates this dynamic. Bitcoin’s latest attempted rally stalled at the aggregate ETF cost basis near $83,000, with total realized losses spiking to $1.35 billion per day and long-term holders capitulating from cycle-top positions. Hedge funds represent roughly 30% of spot ETP ownership but are operating market-neutral, executing basis trades rather than taking directional views — meaning they provide no natural bid when prices fall.
Here is where Ferraioli’s analysis turns constructive. Every major publicly traded Bitcoin miner has announced a pivot toward high-performance computing (HPC) for AI inference workloads. The economics on their face appear to favor abandoning mining: inference generates higher net revenue per megawatt-hour than Bitcoin mining during peak demand windows.
But demand for AI inference is not uniform across 24 hours. Models run hard during business hours and sit idle overnight and on weekends.
That creates a structural opportunity that does not displace BTC mining — it layers on top of it. Schwab’s analysis models Bitcoin as the optimal baseload monetization of power during off-peak hours, with inference overlaid during peak business-hour demand.
A data center operating this hybrid model maximizes utilization across the full 24-hour cycle rather than leaving capacity dark when inference demand falls away. For miners, this translates to more stable revenue, reduced forced BTC sales to cover operating costs, and lower structural risk across bear market cycles.
Bitcoin is backed by energy
The underlying thesis is one of energy economics. Bitcoin has no earnings, no free cash flow, and no CEO issuing guidance. Its value, in Ferraioli’s framework, derives from the energy cost required to produce it — a cost that is transparent, verifiable, and historically durable.
In commodity markets, price cannot sustainably trade below cost of production. Producers shut down, supply contracts, and equilibrium resets higher.
Bitcoin follows this same logic: when spot prices fall toward $60,000, the least efficient miners shut down operations, the network’s hash rate adjusts through Bitcoin’s difficulty mechanism, and the cost to produce each new coin falls.
As of May 2026, the average mining cost across all Bitcoin miners sits near $85,604, with the Bitcoin price trading in the mid-$60,000s — meaning the network as a whole is operating at a loss, a configuration that has historically preceded recoveries, not further collapse.
This post Schwab Strategist: Bitcoin’s $60,000 Mining Cost Could Mark the Cycle Bottom first appeared on Bitcoin Magazine and is written by Micah Zimmerman.
CryptoSlate
Charles Hoskinson raised the possibility of splitting Cardano after the collapse of one of its best-known ecosystem tools exposed a deeper fight over money, governance, and who has the power to keep builders alive on the network.
This week, the Cardano founder floated what he called a “nuclear option,” saying a new Cardano could be launched through proof of burn if the existing ecosystem cannot change how it funds and commercializes projects.
The statement came after TapTools, one of Cardano’s most widely used analytics and infrastructure platforms, said it would begin winding down operations over the next two weeks following leadership departures, mounting costs, and the loss of key technical capacity.
Hoskinson responded with a long, emotional address that turned a project closure into a broader indictment of Cardano’s governance and commercial strategy.
Hours later, he posted on X:
I’m taking a break. TTYL.


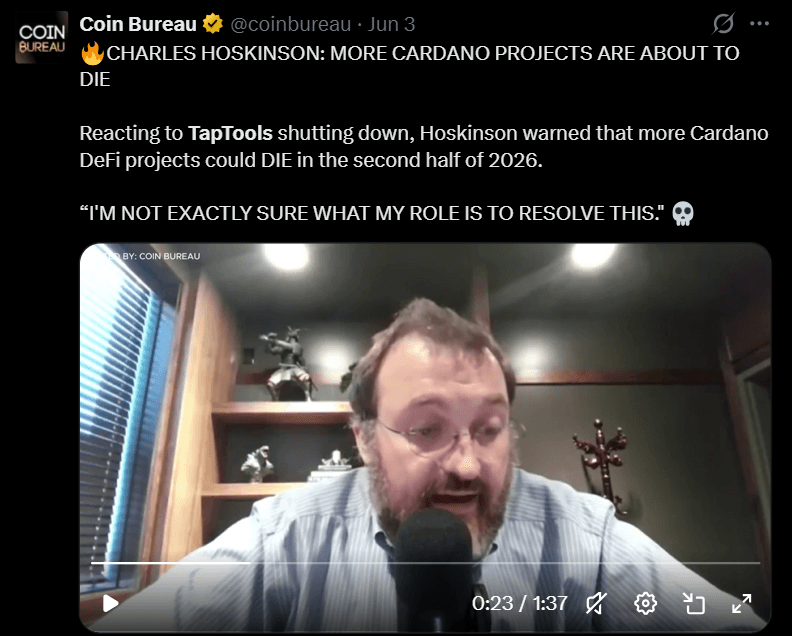
More Cardano DeFi apps will die, Hoskinson warns
Hoskinson said TapTools’ closure was unlikely to be an isolated failure, saying:
This year is going to be very hard, especially the second half of the year for Cardano. We are probably going to see more dApps in DeFi die and a consolidation happen
The warning landed as Cardano’s DeFi economy remained small by broader crypto standards and under renewed strain.
DeFiLlama data showed about $115 million in total value locked on Cardano, with the network’s DeFi TVL down more than 5% over 24 hours. Cardano’s 24-hour DEX volume stood near $6.3 million, while its stablecoin market was roughly $55 million.
Those figures point to the commercial problem behind Hoskinson’s remarks. Cardano still has a large brand and a committed community, but the financial activity available to sustain infrastructure providers, exchanges, lending apps, and analytics platforms remains limited.
For teams that rely on subscriptions, API revenue, token activity, treasury funding, or outside investment, a thin market can quickly become an operating crisis.
Indeed, TapTools had framed its closure as the result of that pressure rather than a loss of belief in Cardano.
The platform said it had served more than 1 million users, supported hundreds of projects through its API, published hundreds of articles, and generated hundreds of millions of social impressions for Cardano builders.
However, the team said the departure of co-founders, including its chief technology officer and chief operating officer, had created a gap it could not quickly repair. A backend developer had stepped into the CTO role, but that replacement also decided to leave.
The company said it had tried to lower infrastructure costs, improve efficiency, and develop new products. Still, it concluded that it could not responsibly commit to the future without a credible acquisition path or fresh resources.
For Hoskinson, the announcement confirmed a problem he said had been visible for months. He said TapTools had been part of his daily routine and called its closure a loss for the broader ecosystem.
He also pointed to JPEG Store as another sign that older Cardano projects were struggling to survive the current cycle. He added:
I would suspect others are coming very soon. There’s going to be a wave of failures in the ecosystem.
The founder says he does not hold the levers
Hoskinson’s central argument was that Cardano’s public market still treats him as the person responsible for the network’s direction, even though the formal powers needed to change that direction now sit elsewhere.
He said he does not control Cardano’s treasury, does not hold governance keys, cannot initiate a hard fork, cannot change protocol parameters, and does not own the Cardano trademark.
He said the resources created to grow and govern the ecosystem were assigned to separate entities rather than to him personally.
The comments cut into one of Cardano’s most sensitive political tensions. The network has spent years moving toward community governance, with delegated representatives, treasury rules, and other bodies taking on greater responsibility for funding and protocol decisions.
That structure limits founder control by design. It also means there is no single executive authority able to rescue struggling businesses, redirect treasury funds, or impose a commercial strategy when market conditions worsen.
Hoskinson said he had proposed multiple ways to prepare for that pressure, including a sovereign wealth fund, stablecoin reserves, an ecosystem index, and acquisitions of struggling infrastructure projects.
He argued those efforts were either rejected, delayed, or criticized by voters and community members who opposed spending treasury funds or feared centralization.
He noted:
There is a deranged psychopathy that has infected Cardano. You can see it at the bottom of each of my tweets. There are people whose only purpose now is to attack me. Every video I make, every tweet, every output, it is a growing chorus.
His frustration was aimed at that contradiction. When he tries to acquire or commercialize projects, he said critics accuse him of consolidating power. When he does not intervene, those same critics blame him for allowing builders to fail.
He stated:
You do not want commercialization, but then you punish everybody when commercialization does not occur. You say Cardano is not a ghost chain, but the things needed to prevent that, you do not care about.
Cardano's treasury politics move into the market
The speech landed at a difficult moment for Cardano as the blockchain network's ADA token fell below $0.20 for the first time in more than five years.
This extends a yearlong decline that has erased much of the token’s value and deepened pressure on builders whose businesses depend on user activity, treasury funding, or investor confidence.
Meanwhile, the decline has also sharpened the debate over whether Cardano’s governance system can fund growth quickly enough to keep pace with rival blockchain ecosystems.
According to Hoskinson:
Every person who has tried to use the treasury for commercialization gets attacked. Every program has to be pushed through with enormous effort to reach two-thirds voting, and most people do not have the political power, will or grit to get through that process.
For context, Cardano’s flagship 2026 Summit in Singapore was canceled after a treasury funding proposal failed to meet the two-thirds approval threshold required under the network’s governance rules.
Hoskinson argued that Cardano’s technology has continued to advance, citing expected work such as Leios. But he said technology alone would not be enough if the ecosystem could not fund businesses, support builders, and create incentives for commercial use.
His remarks were unusually blunt. He accused parts of the community of creating a hostile environment for builders and said some critics appeared more interested in proving Cardano had failed than helping the network recover.
According to him:
We as a community have to have a schism. We can no longer admit people whose only purpose is to burn the entire ecosystem down. It is the builders versus the non-builders, the doers versus the pessimists and cynics.
He said teams seeking treasury money or commercial support are often attacked before and after funding votes, making the system unattractive for serious operators.

A break raises the stakes
Hoskinson did not announce a formal exit from Cardano. His later post saying he was taking a break appeared to reflect exhaustion with the public fight rather than a resignation from the ecosystem.
Still, the timing amplified the message. A founder who remains Cardano’s most recognizable public advocate had just told the community that more projects may collapse, that he lacks the authority to stop it, and that the network must choose leadership, strategy, and funding mechanisms or risk managing decline.
Meanwhile, he pointed out that his “nuclear option” could be a way to separate builders from hostile critics and reset tokenomics and institutional funding.
He stated:
There are options. We could launch a new Cardano and have a proof of burn. That would be the most extreme option because those people would not migrate. They would be left behind in the environment they created, with no market, no volume and no commercialization. That is the nuclear option.
That suggestion reflected how far the conflict has moved from routine governance debate. Hoskinson’s complaint is no longer simply that voters rejected a proposal or that ADA’s price has fallen.
He argues that Cardano lacks an executive function capable of turning treasury resources, technical progress, and community support into a coordinated growth plan.
The consequences are now visible through business closures. TapTools said it remained open to acquisition or sustainable funding, but its shutdown notice gave Cardano a concrete example of what can happen when useful infrastructure cannot cover costs or retain key staff.
Considering this, Hoskinson told delegators to examine whether their DReps are helping the ecosystem grow or blocking the decisions needed to support builders.
He urged the community to take a week, study the failures, and decide whether it wants constitutional changes, treasury changes, executive changes, or even a more radical protocol path.
The post Cardano founder floats splitting his own blockchain after warning more apps will die appeared first on CryptoSlate.
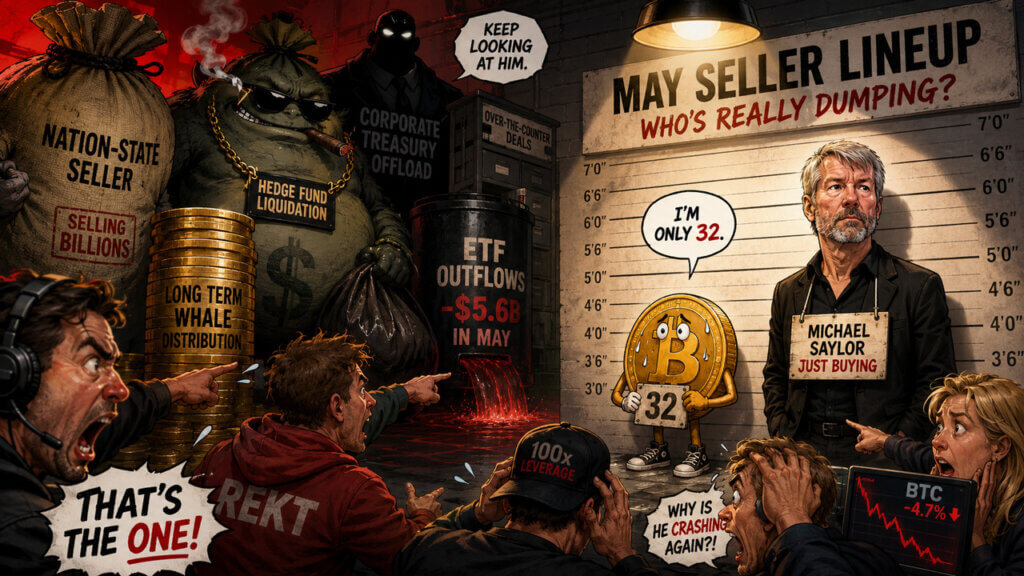
Bitcoin traders have identified Michael Saylor as a new suspect in the latest sell-off, while the numbers tell a different story.
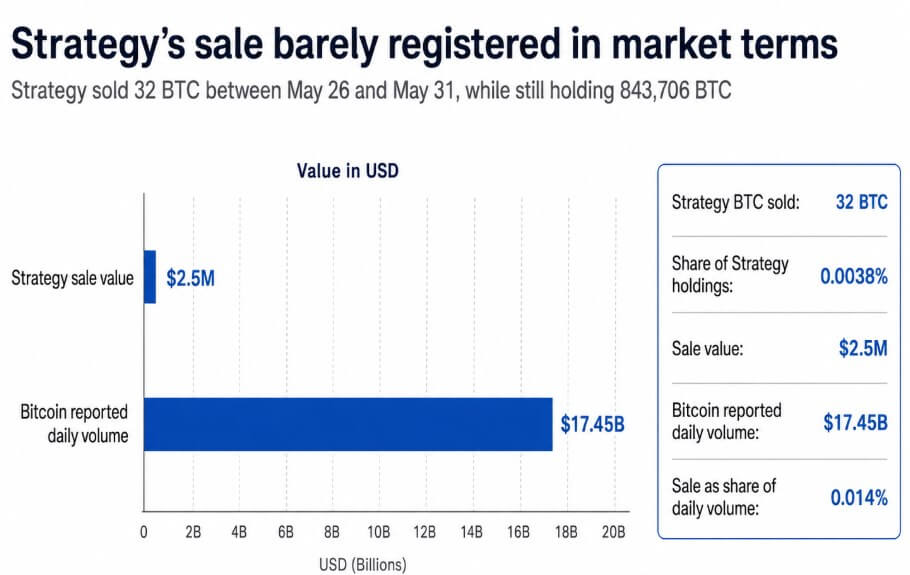
Strategy disclosed in a June 1 Form 8-K that it sold just 32 BTC between May 26 and May 31 for $2.5 million, at an average net price of $77,135, with proceeds earmarked to fund preferred-stock distributions.
The company still held 843,706 BTC as of May 31, with that sale representing 0.0038% of Strategy's total holdings and roughly 0.014% of Bitcoin's reported daily volume of $17.45 billion on that day.
A sale of that size carries no supply-side weight against a $17 billion daily market, and it lands as a narrative event that cracks a story traders had built their confidence on.
Bitcoin fell below $71,500 after the disclosure, a drop also attributed to Iran-related geopolitical tensions and over $90 million in BTC-tracked futures liquidations, making Strategy's sale one of several.
The bigger sellers hiding in May
Four other companies accounted for the bulk of public treasury Bitcoin reductions in May, and their combined total dwarfed Strategy's sale.
According to BitcoinTreasuries, public-company Bitcoin reductions totaled roughly 7,500 BTC during the month, with Strategy's 32 BTC counted in the following month's tally because of its June 1 filing date.
Excluding Strategy, MARA cut 3,386 BTC, Core Scientific reduced by 1,990 BTC, Sequans shed 1,481 BTC, and Prenetics exited 502 BTC, a combined 7,359 BTC.
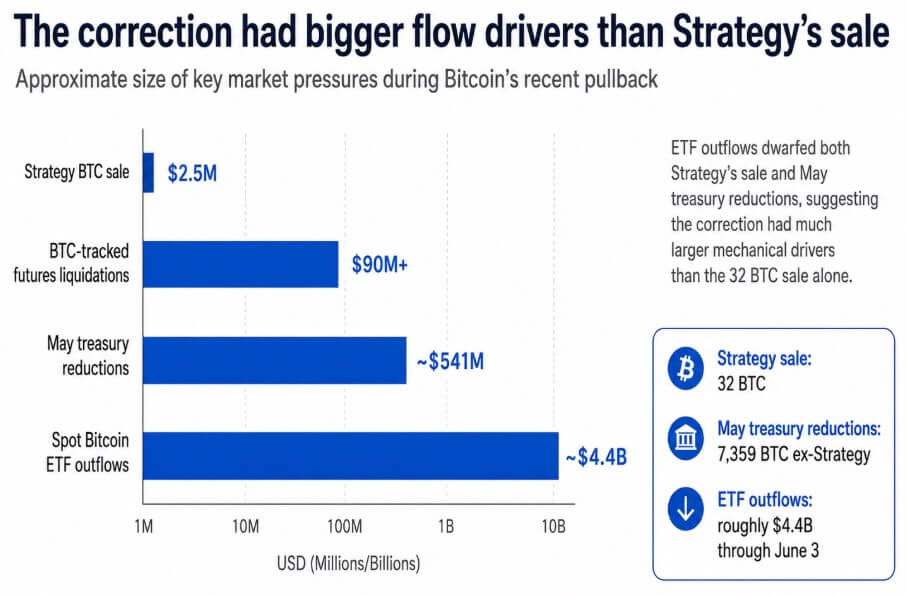
At Bitcoin's May 31 price of $73,579, that reduction carried a face value of roughly $541 million, about 230 times the size of Strategy's sale.
| Company | BTC reduction | Approx. value at $73,579 BTC | Context |
|---|---|---|---|
| MARA | 3,386 BTC | ~$249M | Linked to March note repurchase activity |
| Core Scientific | 1,990 BTC | ~$146M | Backdated-entry methodology caveat |
| Sequans | 1,481 BTC | ~$109M | Debt redemption / treasury strategy unwind |
| Prenetics | 502 BTC | ~$37M | Full exit from BTC treasury position |
| Total | 7,359 BTC | ~$541M | Not a coordinated May dump |
BitcoinTreasuries noted that its May recap used a methodology that incorporated backdated entries and specifically flagged Core Scientific's 1,990 BTC reduction as one that would not have appeared under its previous method.
MARA's larger reduction also traced back to a March disclosure, when the company sold 15,133 BTC between Mar. 4 and Mar. 25 to fund $1 billion in convertible-note repurchases, not a fresh May decision.
Sequans was unwinding a failed Bitcoin treasury strategy to redeem debt, and Prenetics had already authorized a full exit from Bitcoin to redirect capital toward its IM8 health business.
Each reduction had its own logic and timeline, and none reflected a shared judgment that May was a good time to sell.
The net picture from BitcoinTreasuries makes the dump thesis harder to sustain, as public Bitcoin treasury companies added or disclosed 51,000 BTC before the May reductions and 43,500 BTC net after the reductions.
Why Saylor's sale landed differently
The market's disproportionate reaction to 32 BTC reflects Strategy's position as the symbol of corporate permanence in Bitcoin.
Since 2020, Michael Saylor has built that reputation into the company's identity as an accumulator that never distributes and treats every dip as a buying opportunity. That positioning attracted a class of investors who used Strategy as a proxy for conviction that corporations would become structural Bitcoin buyers.
A single sale to meet a preferred-stock distribution obligation left the accumulation thesis intact mechanically, but it introduced a variable that Strategy has ongoing financial obligations, and Bitcoin is the only asset available to meet them.
The follow-on anxiety is rational, even if the immediate reaction was overblown, since Strategy carries debt and preferred stock obligations with fixed distributions.
If Bitcoin prices fall further, the spread between those obligations and the company's ability to fund them through equity issuance or operating cash narrows.
The 32 BTC sale confirmed that the option to sell exists and that management will exercise it under sufficient financial stress.
Traders who built positions on the premise of a permanent buyer now have to price in an occasional seller, and that repricing does not require a large sale to begin.
The correction's actual anatomy
Attributing Bitcoin's more than 12% weekly decline solely to treasury selling misreads the flow data.
US-traded spot Bitcoin ETFs saw roughly $4.4 billion in outflows over the last 13 recorded trading days through June 3.
Those outflows dwarf Strategy's $2.5 million sale and the combined $541 million in May treasury reductions by an order of magnitude.
Geopolitical tensions tied to Iran added a separate risk-off layer, and futures liquidations exceeding $90 million amplified whatever directional move was already underway.
Strategy's disclosure entered that environment as a narrative accelerant, traders looking for a reason to reduce exposure found one, and the symbolic weight of Saylor selling gave the move a headline that stuck.
Standard Chartered's Geoffrey Kendrick maintained a $100,000 year-end 2026 Bitcoin target after the decline, treating the drawdown as a positioning reset.
That framing holds as long as the ETF outflow cycle reverses and treasury-sector net accumulation continues, and gives way if Strategy or other debt-carrying treasury holders face sustained stress requiring liquidation at scale.
What the treasury model now has to prove
If the market absorbs that small tactical sales can fund obligations without ending the accumulation thesis, Strategy's June 1 disclosure becomes a governance footnote.
Net treasury accumulation of 43,500 BTC in May, continued ETF inflows once the current outflow cycle exhausts itself, and Standard Chartered's unchanged price target all support that reading.
Bitcoin stabilizes, Strategy's premium to net asset value recovers, and the 32 BTC sale gets filed under balance-sheet housekeeping.
If investors reprice the treasury model instead, deciding that firms carrying debt and preferred obligations are conditional buyers, May becomes a template for repeated headline risk.
Every quarterly filing season, every preferred distribution date, every convertible-note maturity creates a window for another small sale that lands with outsized narrative force.
The price correction from that repricing would come from the erosion of the premium investors assigned to Strategy's perpetual-accumulation posture.
Corporate Bitcoin treasuries built their market value partly on the promise of one-way buying, and the 32 BTC sale raised the question of how many times a permanent buyer can sell before the market stops treating it as permanent.
The post Bitcoin traders blamed Saylor’s 32 BTC sale but larger selling pressure built elsewhere appeared first on CryptoSlate.
Bitcoin fell after the May US labor report gave markets a reason to delay the next Federal Reserve easing trade, turning a stronger jobs number into a tighter-liquidity problem for crypto.
The May Employment Situation report said nonfarm payroll employment rose by 172,000 in May, while the unemployment rate held at 4.3%.
TradingEconomics release-screen data put the gain well above an 85,000 consensus estimate. That gap was large enough to push the first market interpretation toward higher Treasury yields, a stronger dollar, and pressure on assets that benefit from cheaper money.

That is why Bitcoin reacted less like an inflation hedge and more like a high-duration risk asset. CryptoSlate showed BTC trading near $60,000 on June 5, down 5% over 24 hours and 17% over seven days.
The labor print added another macro shock to a market that was already fragile after its slide from the low-$60,000 range.
The key issue for Bitcoin is that the labor market looked firm enough to reduce the urgency for rate cuts, while the internal details were soft enough to keep traders debating whether the first hawkish move should last.

The jobs beat carried a catch
The headline number did the initial damage. A 172,000 payroll gain against an 85,000 consensus is the kind of surprise that usually lifts front-end yields because it weakens the argument that the Fed needs to move quickly to protect employment.
The unemployment rate staying at 4.3% added to that first reaction by removing the risk of an obvious labor-market downside shock.
For Bitcoin, the path from jobs data to price pressure is direct. Stronger labor data can keep policy rates higher for longer, which supports the dollar and raises the hurdle for speculative assets that do not produce yield.
When that happens, traders often reduce exposure first in assets most sensitive to liquidity, including long-duration technology shares and crypto.
But the composition made the report more complicated than the headline. According to the TradingEconomics calendar data, government payrolls rose by 52,000, while private payrolls were 120,000.
Private hiring remained positive and beat consensus, but it slowed sharply from the prior pace shown on the release screen.
The split changes the market interpretation because government hiring is less informative about cyclical corporate demand than private-sector payroll growth. A government-heavy payroll beat can still move yields, especially in the first minutes after release.
Discretionary traders may give it less weight than a broad private-sector acceleration.
Wage data also kept the print from looking like a clean overheating shock. Average hourly earnings rose 0.3% month over month, matching expectations, while yearly wage growth slowed to 3.4% from the prior month in the TradingEconomics screen.
That leaves the Fed without an easy case for cuts, while falling short of a wage surprise that would force a more aggressive bond selloff by itself.
Participation was steady, average weekly hours were unchanged, and the broader U-6 unemployment rate improved. Taken together, the data pointed to a labor market that is still resilient, while stopping short of a broad acceleration signal.
That is the tension markets had to price. The headline says the economy can handle tighter policy for longer. The details say private-sector momentum is cooling, yearly wage growth eased, and the payroll beat leaned heavily on public-sector hiring.
Why Bitcoin felt it first
Bitcoin has spent much of 2026 trading as a macro-sensitive liquidity asset. CryptoSlate noted earlier in the week that jobs data had become a direct test for BTC.
Cooling employment can soften the dollar and pull capital back toward risk, while strong labor data keeps the case for elevated rates intact.
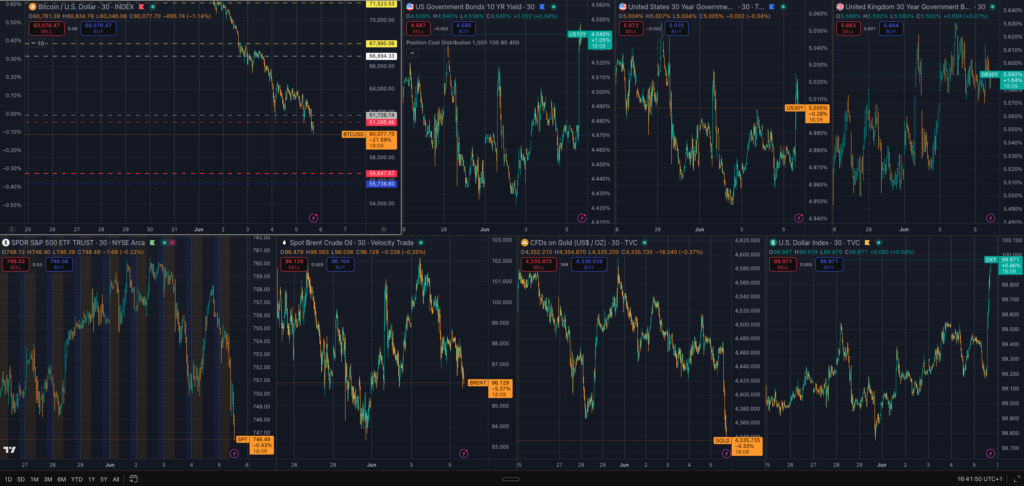
Friday's report pushed the market toward the second outcome. Chart context showed US yields and the dollar rising after the release, while Bitcoin, gold, and equities came under pressure.
That combination points to a higher-for-longer reaction instead of a recession scare.
That distinction is central to the Bitcoin reaction. A recessionary jobs report would usually push yields lower, weigh on the dollar, and potentially give gold and duration-sensitive assets a bid as traders price faster easing.
Friday's setup was the opposite. The jobs market looked strong enough to delay the relief trade, so the dollar tightened financial conditions and Bitcoin took the hit.
The move also landed on a market already testing support. CryptoSlate's prior coverage of Bitcoin's $63,000 slide framed BTC as caught between ETF demand, AI equity appetite, and the need to reclaim the $66,900 to $70,000 area.
A hawkish payroll surprise makes that repair harder because it increases competition for capital and reduces the near-term case for easier financial conditions.

The report created two paths, with the first reaction following the most obvious transmission channel. Higher yields make cash and bonds more attractive at the margin. A stronger dollar tightens global liquidity.
Together, they make it harder for Bitcoin to trade as a scarce-asset story in the short run, even if that long-term narrative remains intact.
Brent's relative resilience in the chart context also helps explain the macro message. Oil holding up while Bitcoin and gold sold off suggests traders were treating the report as growth that is firm enough to keep the Fed patient.
The second-round test
The next test is whether markets keep trading the 172,000 headline payroll beat or shift toward the softer private-sector and wage details.
If the two-year Treasury yield and DXY hold their post-release gains, Bitcoin remains under pressure from the same channel that hit it immediately after the report: fewer near-term rate-cut expectations, tighter dollar liquidity, and weaker appetite for high-beta risk.
In that scenario, the market is accepting the hawkish interpretation and BTC's ability to reclaim its first breakdown area becomes the key signal.
If yields fade and the dollar gives back the spike, the market is likely moving to the second interpretation. That would mean traders are discounting the government-heavy portion of the payroll gain, giving more weight to the slowdown in private hiring, and treating cooling yearly wage growth as a limit on the hawkish repricing.
Both outcomes keep the signal mixed rather than cleanly bullish or bearish. The employment data reduced the urgency for Fed cuts, which is negative for Bitcoin's liquidity setup.
The internal details also stopped short of a broad overheating message, which is why the follow-through depends on whether rates and the dollar keep confirming the first move.
For now, the labor report gave Bitcoin holders an uncomfortable answer: the economy may still be strong enough to keep the Fed patient, yet soft enough under the surface to keep doubts about private-sector momentum alive.
That leaves BTC trading the same question as the rest of risk: whether markets care more about the headline beat or the softer parts underneath it.
The post Bitcoin price craters to $60,000 as BTC bulls get jobs report they were hoping to avoid appeared first on CryptoSlate.
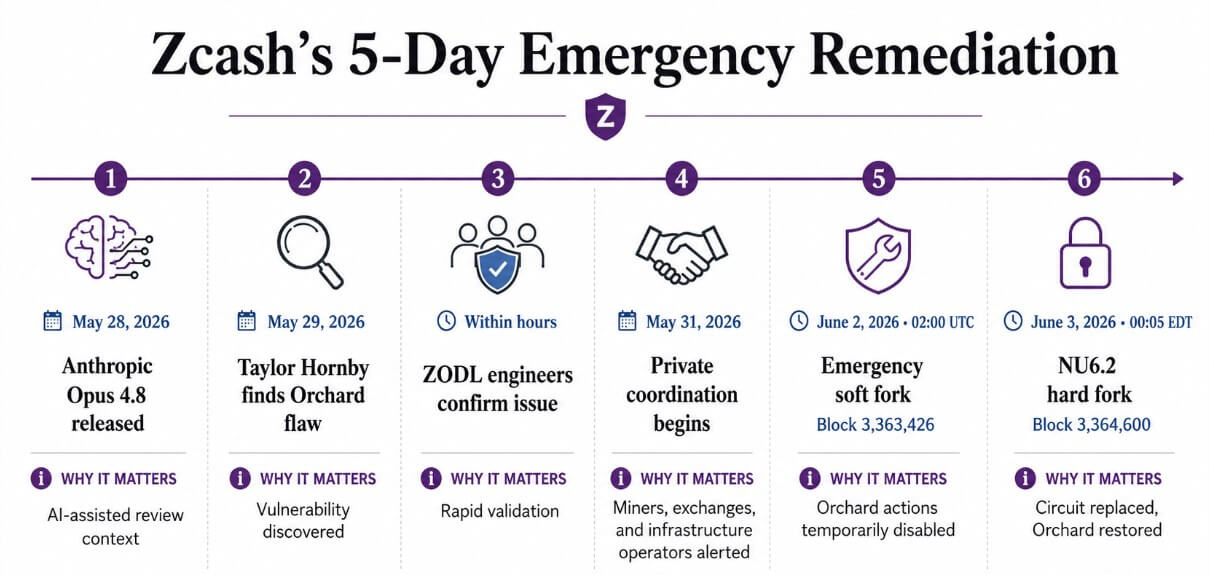
The exploit that nearly broke Zcash originated inside the zero-knowledge proof circuit that powers Orchard, Zcash's newest shielded pool, and the cryptographic core of its private transaction system.
Taylor Hornby, a security researcher at Shielded Labs, found it on May 29 during a targeted protocol security review.
Within hours, ZODL engineers confirmed the flaw, and Zcash executed an emergency soft fork, then a full consensus hard fork, to close it.
According to Shielded Labs, Hornby used Anthropic's Opus 4.8, released the day before on May 28, alongside a custom AI harness and prompts, to produce a complete local exploit in a regtest environment.
If applied to mainnet, the exploit could have generated unlimited counterfeit ZEC within Orchard without detection.
Zcash's official position is that there is no evidence of mainnet exploitation, no unauthorized value creation has been detected, and the 21 million ZEC supply cap stays intact, protected by the turnstile mechanism that tracks value moving between pools.
Shielded Labs holds a harder line, warning that Orchard's privacy properties make it cryptographically difficult to prove the supply was never tampered with, and proposing a further upgrade to route coins through turnstile accounting so anyone can verify integrity directly.
ZEC traded as high as $611 intraday before the disclosure and fell sharply, settling around $421 as the market priced the difference between “patched” and “proven clean.”
The broader frame is that AI-assisted exploits are moving from targeting DeFi protocols to directly affecting the money layer.
The bug that required a consensus upgrade
Orchard's proof circuit contained a soundness bug: a proof system accepted something it should have rejected, and fixing it required updating the pinned verifying key embedded in the circuit.
The update process constitutes a consensus-level change and demands coordinated network agreement between miners, exchanges, wallet providers, and infrastructure operators, all moving together on a compressed timeline.
The emergency soft fork was activated at 02:00 UTC on June 2 at block 3,363,426, temporarily disabling Orchard actions.
The NU6.2 hard fork followed on June 3 at 00:05 EDT at block 3,364,600, replacing the circuit and restoring full Orchard functionality. Zcash coordinated the response in secret and under market stress while the chain kept running, and the remediation timeline from discovery to hard-fork activation was less than 5 days.
AI at the money layer
Opus 4.8 launched with improved coding and reasoning benchmarks, and Shielded Labs says Hornby used it alongside a custom AI harness to conduct a targeted review of the Orchard circuit, producing a working local exploit that would have functioned on mainnet.
Zcash has not independently verified the specific role of AI in the research process, but the claim fits a pattern that extends well beyond Zcash.
In February 2026, Octane disclosed that its AI found a high-severity bug in Nethermind, an Ethereum execution client, that could have caused local block production to stop for roughly 38% of Ethereum validators. The vulnerability was patched before it was exploited and was rooted in client infrastructure.
A January 2026 arXiv paper on AI-agent exploit generation found a 63% success rate on a smart contract benchmark, app-layer research demonstrating the same compression of the vulnerability discovery loop that Orchard and Nethermind now show one level deeper.
| Layer | Old AI/security focus | 2026 examples | Why it matters |
|---|---|---|---|
| App layer | Smart contracts, DeFi protocols, bridges | AI-agent exploit generation benchmark with 63% success rate | Protocol-specific losses |
| Client infrastructure | Execution clients, validators, node software | Octane AI finding Nethermind bug affecting roughly 38% of validators | Could impair chain liveness |
| Proof / money layer | ZK circuits, supply accounting, validity rules | Zcash Orchard soundness bug | Could affect whether private money is valid |
| Operational control layer | Keys, wallets, access systems | TRM / Hacken trend toward keys, wallets, control planes | Attacks bypass contract code entirely |
TRM Labs' 2026 Crypto Crime Report counted $2.87 billion stolen across nearly 150 hacks in 2025, with adversaries concentrating attacks on keys, wallets, and control planes. These are the operational and cryptographic infrastructure beneath the contract code, where the Zcash and Nethermind disclosures sit.
The prove-the-negative problem
Public blockchains make money auditable by design, with every transaction visible, every balance derivable from the chain state.
Privacy coins invert that guarantee, and Zcash's entire value proposition is that Orchard balances and transaction amounts stay hidden from outside observers.
That inversion creates a tension when a soundness bug appears in the proof circuit, since the same privacy that protects users also makes it impossible to scan Orchard's history for evidence of counterfeit value.
Zcash Foundation's answer is the turnstile mechanism, which tracks aggregate value flows entering and leaving each shielded pool without revealing individual transactions.
Turnstile analysis found no evidence of unauthorized value creation in the window before remediation. Shielded Labs' proposed next upgrade would route existing Orchard coins back through turnstile accounting, creating an on-chain record that anyone could verify, converting a probabilistic assurance into a cryptographic one.
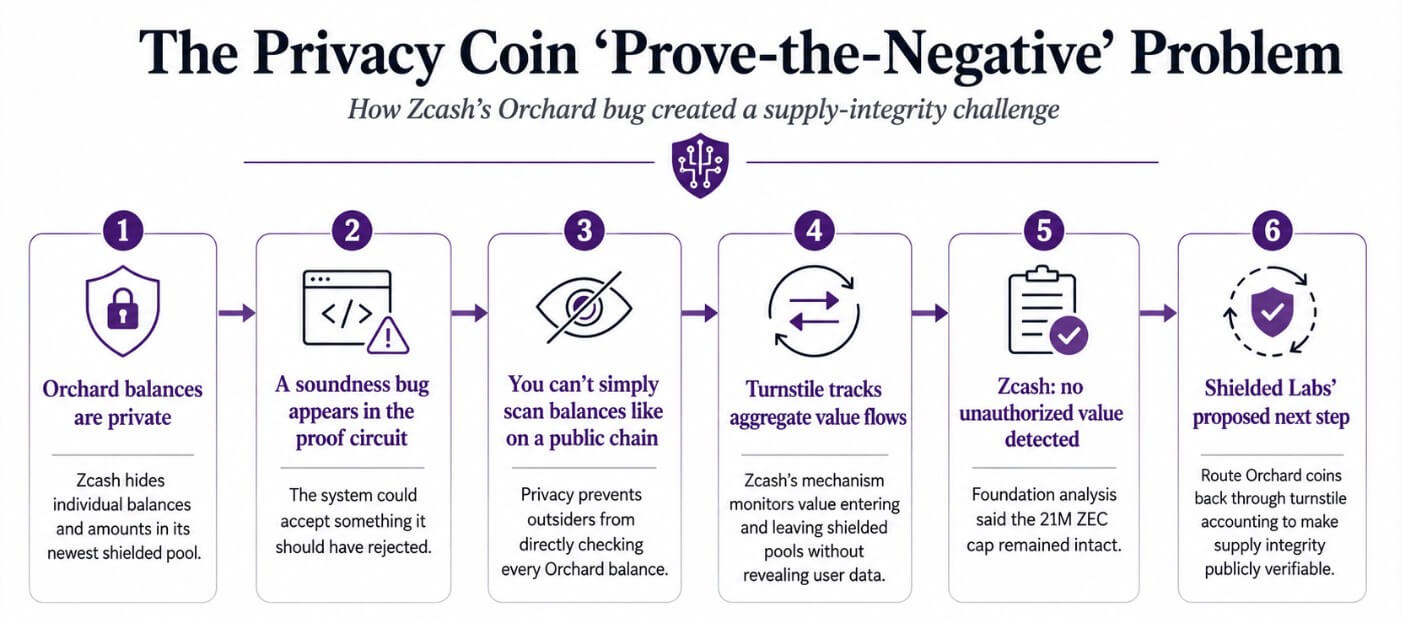
Until that upgrade completes, the window between “no detected exploitation” and “provably clean supply” persists.
If AI-assisted security reviews become standard practice for base-layer infrastructure, including proof circuits, consensus clients, validator logic, and supply-accounting mechanisms, the Zcash incident serves as a proof-of-process.
AI found a deep flaw, coordinated disclosure contained it, and a proposed follow-on upgrade closes the epistemic gap.
Octane's Nethermind disclosure follows the same template, and the chains that build coordinated response capacity around AI-assisted audits absorb these findings before adversaries can reach them.
Hacken's report for the first quarter logged $482.6 million in stolen funds across 44 incidents, with wallet compromises overtaking code bugs in value in major DeFi incidents.
AI-assisted adversaries operate without disclosure obligations, and that same infrastructure layer is where attacks are already concentrating. A researcher with Hornby's toolkit and malicious intent who finds a comparable flaw before the defenders do faces a target whose privacy properties prevent post hoc detection.
ZEC's sharp intraday move after disclosure reflects that the market has already priced in a patched bug in a privacy coin's proof circuit, leaving a residual confidence discount that no press release can fully close, because the assurance the system needs to provide is the hardest for a privacy system to give.
Consensus clients, proof circuits, and supply rules are the layer AI-assisted research reached in 2026, and every major chain's security posture now needs to account for a threat model that did not exist when those systems were designed.
The post AI-assisted Zcash flaw exposes the supply integrity gap an emergency fork could not fully close appeared first on CryptoSlate.
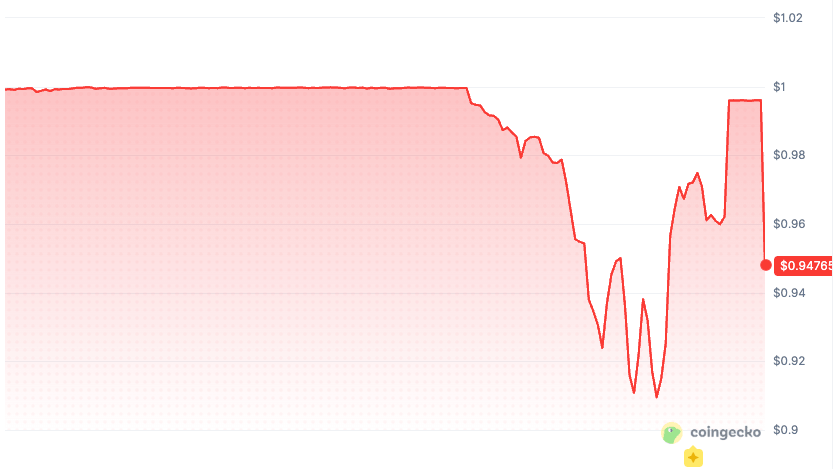
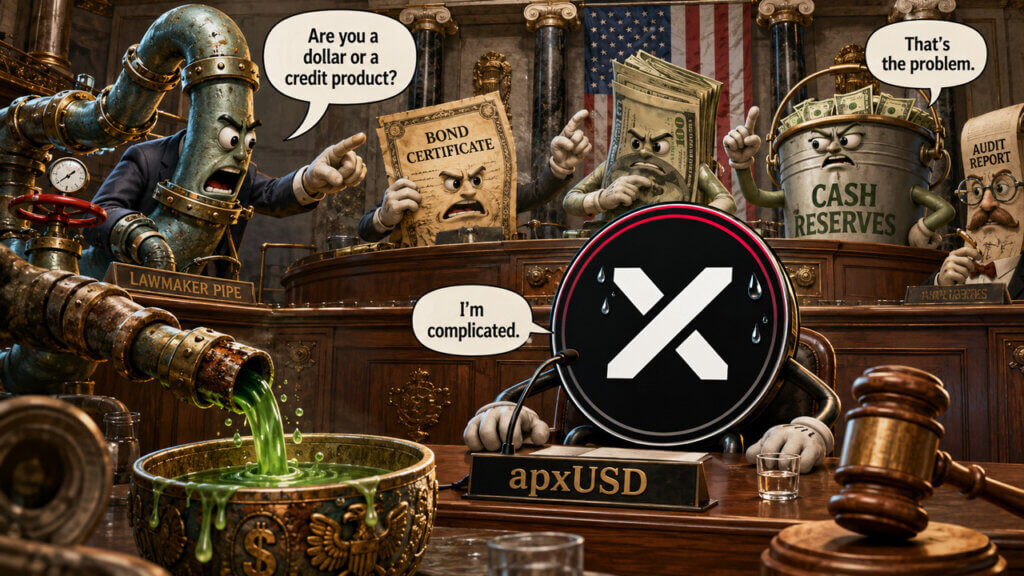
Apyx's apxUSD fell below its dollar reference on June 4 as Bitcoin traded near $63,000, putting DeFi dollar peg risk back in focus.
A Bitget report said the token briefly touched $0.93 during the selloff. The report framed Apyx's response as a design point: apxUSD's reserve risk is largely borne by Strategy's STRC preferred stock, with cash serving as part of a broader buffer.
Data at the time showed an even wider 24-hour range, from $0.9094 to $0.9984, with apxUSD trading around $0.9176 and volume rising to roughly $74.6 million.
The mechanics put apxUSD in a different category than a normal stablecoin peg scare. Bitcoin was down 5.77% over 24 hours, and the pressure showing up in apxUSD also reflected a public-market preferred share becoming part of DeFi's dollar collateral stack.
A dollar token built on preferred equity
Apyx describes apxUSD as a synthetic dollar backed by a basket of preferred shares issued by Digital Asset Treasury companies.
The same documentation says apxUSD is intended for use as collateral and as a quote asset across DeFi and CeFi, while the yield generated by the collateral stack is routed to apyUSD, the protocol's savings asset.
The key collateral link is STRC, Strategy's Variable Rate Series A Perpetual Stretch Preferred Stock. Apyx's peg stability model says apxUSD currently primarily uses STRC as its core collateral asset.
STRC is structured around a $100 stated amount, but the price-stability tool is economic. It is built around Strategy's ability to adjust dividends and encourage trading near the reference value.
A dollar token built on preferred-share collateral can look strange through a USDC lens and more coherent through a credit lens.
Apyx says apxUSD adds overcollateralization, a cash and Treasury buffer, cross-market arbitrage, and possible hedging strategies. The protocol also says in its own risk section that apxUSD may trade above or below a $1 reference value.
That disclosure turns the June 4 move into a cleaner market-structure event. The sharper question is whether DeFi users are pricing a dollar-like asset correctly when its collateral can behave like public preferred equity under stress.
Circle's reserve model for USDC is built around a different promise. Circle says USDC is redeemable 1:1 for dollars and backed by highly liquid cash and cash-equivalent assets.
Most USDC reserves are held in the Circle Reserve Fund, which can contain cash, short-dated US Treasuries, and overnight Treasury repurchase agreements.
apxUSD's design points somewhere else. Apyx's collateral allocation page states that backing can be dynamically allocated across DAT preferred shares, with cash and short-term Treasuries serving as a liquidity buffer.
Kraken's listing note for apxUSD also describes the asset as backed by variable-rate DAT preferred shares. It says minting and redemption are restricted to authorized institutional participants, with redemptions settled in USDC while the underlying preferred equity remains outside the redemption flow.

That access model becomes important during volatility. An authorized participant may have a primary pathway through the protocol. A normal holder generally faces the market in front of them, whether that means a DEX pool, a centralized exchange order book, or another DeFi route.
Apyx's FAQ also flags liquidity risk directly, noting that users who acquire apxUSD via DEX swaps may experience slippage when liquidity is low. It also says apyUSD exits follow an asynchronous model with an approximately 30-day cooldown.
The result is a stablecoin-like instrument whose dollar behavior depends on more than the issuer's stated reference price. It depends on STRC's market price, apxUSD/USDC liquidity depth, whitelisted arbitrage, the reserve buffer, and whether DeFi users are trying to exit the same route at the same time.
Strategy's preferred stack is now DeFi collateral risk
STRC is more than a ticker in the background. Strategy's own STRC page describes it as perpetual preferred stock paying an annual dividend rate of 11.50% in cash, with the rate adjusted monthly to encourage trading around the $100 par value.

The same page also warns that returns, liquidity, future performance, and cash dividends are not guaranteed. It says the preferred securities lack collateral claims on Strategy's Bitcoin holdings.
Strategy's latest filing added another layer to the market's read on that structure. In a June 1 Form 8-K, the company disclosed that it sold 32 BTC between May 26 and May 31 for about $2.5 million, with proceeds expected to fund distributions on preferred stock.
The filing also said Strategy held 843,706 BTC as of May 31 and maintained the STRC dividend rate at 11.50% for monthly periods beginning June 1.
That filing is channel context for a market now connecting Strategy's preferred dividends, Bitcoin treasury liquidity, STRC's par-seeking design, and DeFi collateral products.
CryptoSlate has already covered how Strategy's preferred stack has become part of its broader funding machine, including the risk around selling BTC to fund preferred payouts and why STRC has become a key funding gauge.
apxUSD extends that issue into DeFi. The preferred share has moved beyond a capital-markets instrument held in brokerage accounts. It is also part of an onchain dollar product that traders may use as liquidity, collateral, and yield infrastructure.
The June 4 move exposed that bridge. DAT preferred shares are being marketed as lower-volatility, income-paying instruments tied to companies that hold crypto, and Apyx is turning that public-market yield into programmable stablecoin infrastructure.
DeFi can capture headline yield, but it can also capture credit, liquidity, confidence, and exit-route risk.
The DeFi footprint is already large enough to matter
The apxUSD selloff reached a token with meaningful market plumbing. DefiLlama's RWA dashboard showed active apxUSD DeFi exposure concentrated in Pendle and Curve, with Pendle at $118.22 million and 64.62% of listed active TVL, and Curve at $44.63 million and 24.39% of listed active TVL.

Morpho Blue was much smaller at about $751,647, yet its presence is relevant because lending markets can turn price moves into collateral questions.
CoinGecko also showed the Curve apxUSD/USDC pair as the most active market, with about $48.5 million of 24-hour volume. That is the venue-level reality behind the phrase “stable collateral.”
If a token is used as a quote asset, a liquidity-pool asset, or a yield-trading input, a move toward 93 cents reaches beyond the chart. It changes slippage, pool balances, fixed-yield assumptions, and the risk calculation for anyone treating the token like cash.
The point travels beyond apxUSD. DAT preferred shares are being marketed as lower-volatility, income-paying instruments tied to companies that hold crypto. Apyx is turning that public-market yield into programmable stablecoin infrastructure.
The June 4 move showed that the bridge cuts both ways: DeFi can import the yield, but it can also import the credit, liquidity, and confidence risk.
The next test is straightforward. If STRC returns toward par, apxUSD liquidity holds, and the token moves back toward its reference value, the episode will look like a live stress test of a design that Apyx already said allows price variability.
If STRC stays discounted, the reserve dashboard shows less cushion than users assumed, or DeFi venues report liquidations or emergency parameter changes, the market may start treating apxUSD less like a standard stablecoin and more like a credit-linked collateral token.
The key signals are now visible: STRC's price versus par, Apyx's current reserve mix, apxUSD/USDC liquidity depth, Pendle and Curve exposure, Morpho collateral behavior, and Strategy's next dividend-rate decision.
Putting Wall Street preferred equity into DeFi leaves it with a market price. That market price is now part of the collateral risk.
The post A stablecoin tied to Strategy stock depegs putting a new DeFi dollar risk in focus as Bitcoin sells off appeared first on CryptoSlate.
CryptoTicker.io
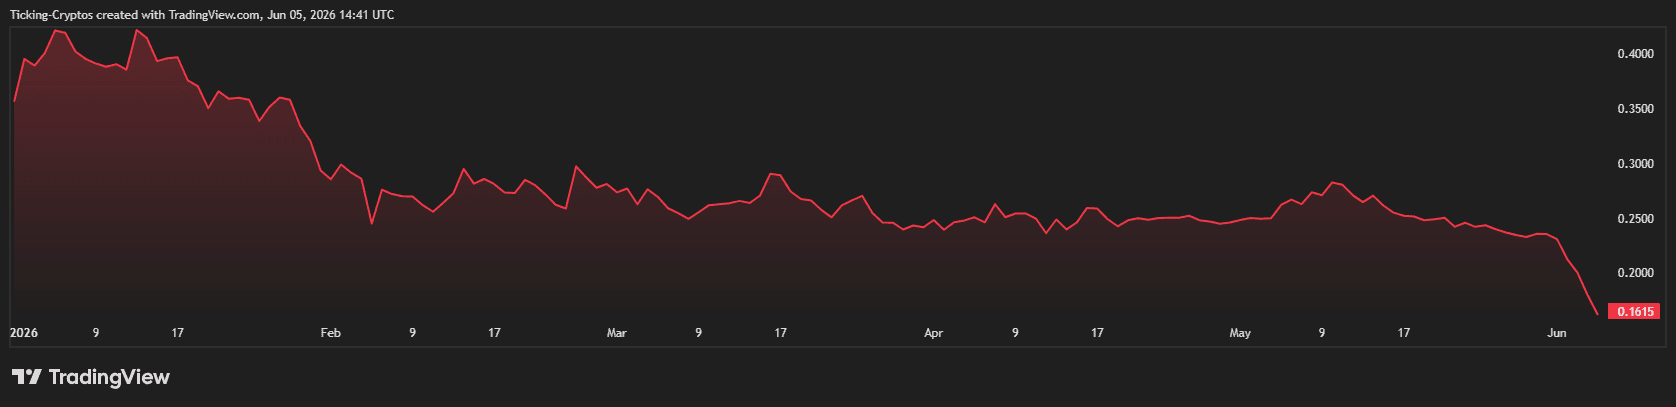
Hoskinson Announces Break as ADA Dips Below $0.20
Charles Hoskinson, the founder of Cardano and CEO of Input Output Global (IOG), has announced a temporary departure from public channels. This sudden decision follows a series of sharp warnings he issued to the community regarding structural and financial pain within the layer-1 network’s decentralized finance (DeFi) ecosystem.
On June 3, 2026, Hoskinson posted a brief message on X stating, "I'm taking a break. TTYL," sending shockwaves through native token holders. The announcement triggered an immediate double-digit sell-off, pushing the price of ADA down past the critical $0.20 threshold for the first time in five years. However, he later posted that "he's not leaving", making the community feel lost.

TapTools Collapse Signals Broader Governance and Funding Crises
The developer break comes immediately after Hoskinson warned investors to brace for a "wave of failures" among Cardano-based decentralized applications (dApps). The market anxiety is driven by concrete closures within the ecosystem, notably the abrupt shutdown of popular data analytics platform TapTools.
In a recent video address to the community, Hoskinson emphasized that broader macroeconomic pressures and gridlocked on-chain governance are suffocating smaller projects:
"I said at the beginning of the year we were going to see a lot of people collapse because the markets are really bad. This is where we're at as an ecosystem."
Compounding these ecosystem pressures, the $Cardano community recently exercised its decentralized governance powers to reject a key treasury funding initiative, leading to the cancellation of the highly anticipated 2026 Singapore Summit. Concurrently, IOG is navigating tense negotiations as decentralized governance members delay approval for the "Cardano Vision 2026" development roadmap, which requests a budget of 32.92 million ADA.
Cardano Price Analysis: ADA Coin Crashing HARD
The cascading negative sentiment has heavily impacted ADA's market valuation. According to data tracked on major trading venues, $ADA reached an intra-day low of $0.198. This marks a staggering 93% decline from its all-time high of $3.09 achieved in late 2021.
While liquidations spike across alternative layer-1 protocols, the Cardano community faces a critical choice regarding how to deploy treasury resources without over-centralizing network decisions. Analysts are closely watching the conclusion of the ongoing roadmap vote on June 8 to determine if a relief rally or further consolidation will follow.
Zcash has become the biggest crypto crasher today, with $ZEC dropping more than 40% as the broader market selloff accelerates. While Bitcoin, Ethereum, Solana, XRP, Cardano, and Dogecoin are all under pressure, the ZEC crash stands out because it appears to be driven by a more specific and damaging narrative.
The sharp move comes after reports of a critical Zcash vulnerability, claims that Claude AI helped identify the bug, growing concerns over whether counterfeit ZEC could have been created, and renewed attention around large whale short positions. Together with heavy crypto liquidations, this has pushed $ZEC into one of its most aggressive selloffs of the year.
Zcash Price Analysis: ZEC Coin Dumps Over 40%
Zcash is currently trading around $306, down more than 42% in 24 hours, making it the worst-performing major crypto asset among the top coins today. Its market cap has fallen to nearly $5.1 billion, while 24-hour volume surged to around $2.78 billion, showing that the move is not only sharp but also heavily traded.
This type of volume spike during a crash usually signals panic selling, forced liquidations, and aggressive short-side positioning. The ZEC technical rating also remains in strong sell territory, which confirms that momentum is still heavily bearish.
The move is especially important because Zcash was previously one of the stronger-performing privacy coins. Now, the same momentum that helped push ZEC higher appears to be reversing quickly.
Why the Zcash Crash Is Different From the Rest of the Market
The broader crypto market is already weak, but the ZEC crash has extra pressure because it is not only linked to market sentiment. Several Zcash-specific factors are now weighing on the token.
1. AI-Linked Vulnerability Fear Hits ZEC Confidence
The biggest trigger behind the crash appears to be the recent Zcash bug scare. Market posts claimed that a critical vulnerability could have allowed attackers to create unlimited counterfeit ZEC before the issue was patched.
What makes this story more sensitive is the AI angle. Several tweets suggested that Claude AI helped discover or expose the vulnerability. This created a new fear in the market: if AI tools can identify deep protocol weaknesses, older or privacy-focused crypto projects may face stronger security scrutiny.
Even if the bug has been fixed, traders are still reacting to uncertainty. In crypto, confidence often breaks faster than it recovers, especially when the concern touches supply integrity.
2. Whale Short Trades Add More Pressure
Another major reason behind the ZEC crash is the narrative around whale short positions. Some market posts claimed that a trader who previously made major profits shorting before a major crypto crash also opened a short position against ZEC before the dump.
This kind of story can quickly damage sentiment. When retail traders see large wallets profiting from a collapse, it creates the impression that smart money was positioned early. Whether the whale caused the crash or simply benefited from it, the result is the same: more fear, more selling, and weaker confidence in the short term.
3. Liquidations Turn the Drop Into a Cascade
The Zcash crash is also happening during a wider crypto liquidation wave. Recent market posts showed billions of dollars in leveraged crypto positions being wiped out over the past few days.
When leverage is high, a sharp drop can quickly become a liquidation cascade. Long positions are forced to close, stop-losses are triggered, and the selling pressure accelerates. For ZEC, this likely made the move much more violent than a normal correction.
Tip: Use Volatility With a Long-Term Strategy
Market crashes can feel extreme, but they also remind investors why risk management matters. Instead of reacting emotionally to every red candle, many long-term investors use a crypto savings plan to build exposure gradually through dollar-cost averaging.
This means investing a fixed amount over time instead of trying to guess the exact bottom. In volatile assets like ZEC, BTC, or ETH, this approach can reduce the pressure of timing every move perfectly.
Start your crypto savings plan and build your position steadily through every market cycle.
4. Privacy Coins Face Extra Market Pressure
Zcash is not a normal altcoin. It belongs to the privacy coin category, which often faces more scrutiny than other crypto assets. Privacy coins are built around confidential transactions, but that also makes investors more sensitive to security issues, exchange support risks, and regulatory pressure.
This is why the bug scare hit ZEC harder than it may have hit another token. Any question about supply, security, or network integrity becomes more serious when the asset already operates in a controversial category.
Zcash Price Prediction: Next Critical Support Targets for ZEC
With ZEC now trading near the $300 zone, traders are watching whether the price can stabilize or continue lower. After such a steep crash, short-term rebounds are possible, but the overall structure remains weak until ZEC reclaims key resistance levels.
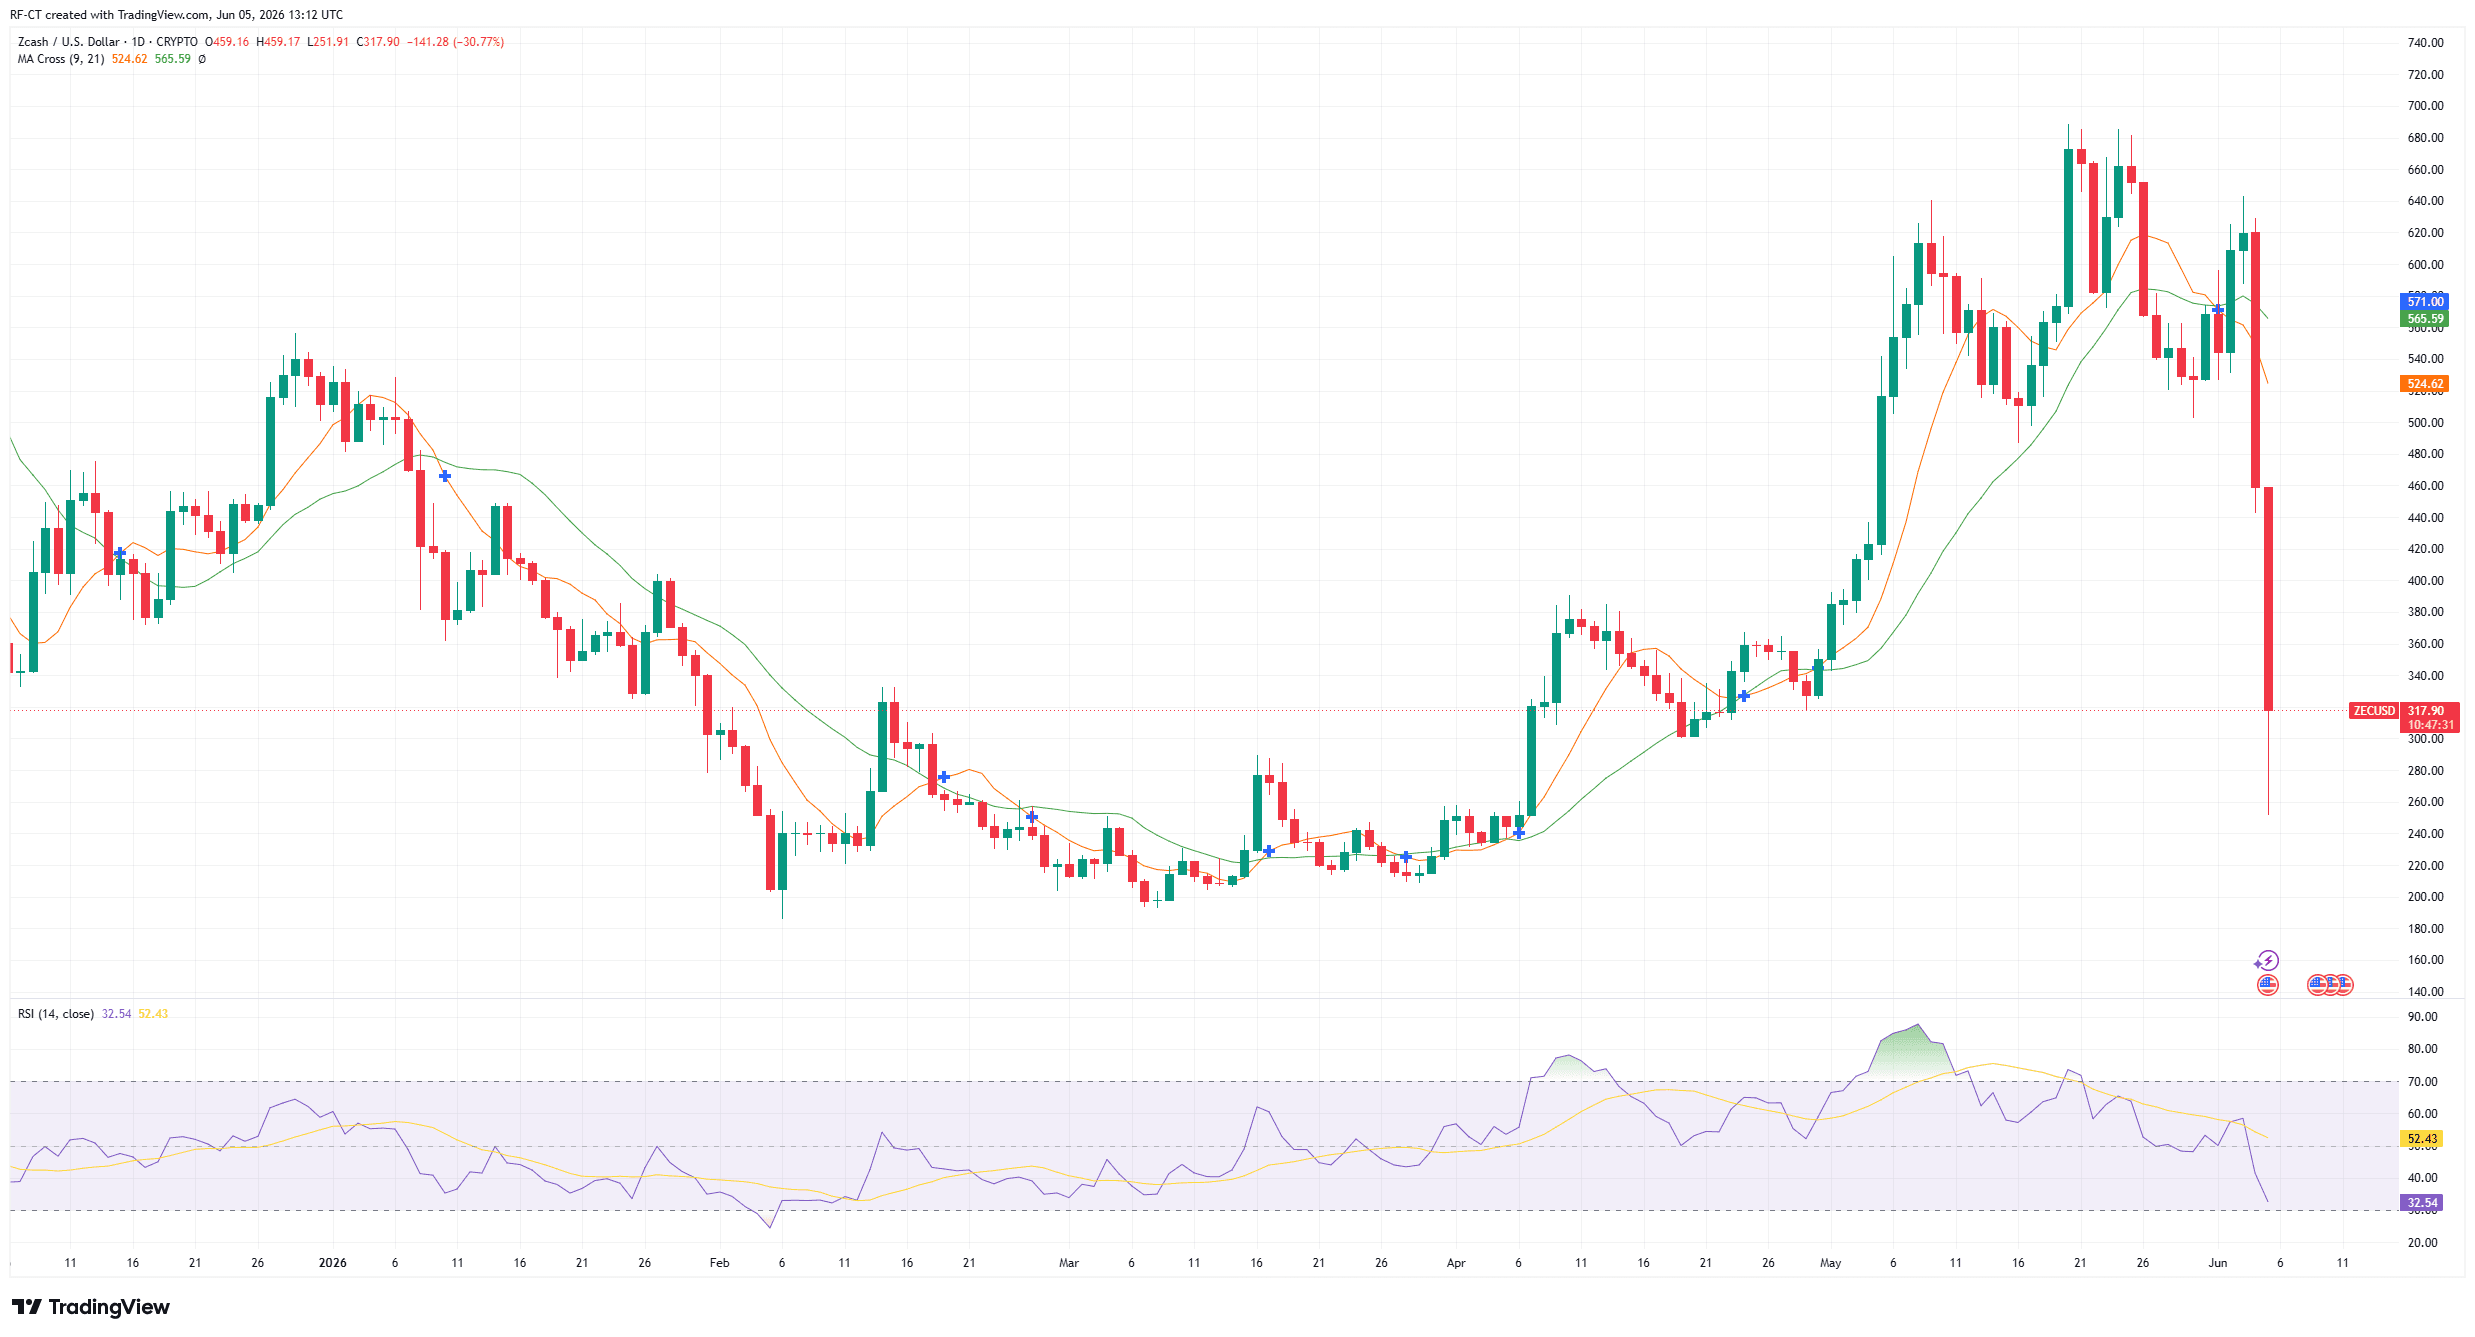
Immediate Support: $300
The first major support area is the psychological $300 level. If ZEC holds above this zone, the token could attempt a short-term relief bounce after the extreme selloff.
However, if $300 breaks clearly, more traders may exit positions, and another wave of liquidation pressure could follow.
Next Downside Target: $280
If selling continues, the next important area to watch is around $280. This would represent another major step lower and could confirm that the crash is not yet fully exhausted.
A move toward this zone would likely keep sentiment extremely weak, especially if the broader crypto market remains red.
Deeper Capitulation Zone: $250
If the AI bug narrative continues spreading and traders remain uncertain about the vulnerability, ZEC could test a deeper capitulation zone near $250. This would signal a stronger breakdown and could erase even more of Zcash’s recent gains.
Key Resistance: $350 and $400
For ZEC to recover, bulls need to push the price back above $350 first. A stronger recovery would require a move toward $400, where sellers may start defending the previous breakdown zone.
Without a reclaim of these levels, any bounce could remain temporary.
Current Crypto Prices at a Glance
The broader market is also under heavy pressure, but ZEC remains the biggest outlier today:
- Bitcoin ($BTC): around $61,978
- Ethereum ($ETH): around $1,655
- XRP ($XRP): around $1.11
- Solana ($SOL): around $65.66
- Cardano ($ADA): around $0.16
- Zcash ($ZEC): around $306, down over 40%
- Dogecoin ($DOGE): around $0.083
Is the Zcash Crash Over?
The ZEC crash may slow down if the market receives clear confirmation that the vulnerability was fully patched and that no counterfeit ZEC was created. A strong public explanation from the Zcash ecosystem could help reduce panic.
However, the short-term risk remains high. The combination of an AI-linked bug scare, whale short activity, privacy coin uncertainty, and broad market liquidations makes this crash more serious than a normal pullback.
For now, $ZEC remains one of the most watched coins in the market, not because of a bullish breakout, but because it is leading the crypto crash.
More from CryptoTicker
Crypto markets are under heavy pressure, but volatility often creates the most important opportunities for active traders and long-term investors. Discover the best crypto exchanges and take advantage of current market movements.
$ZEC, $BTC, $ETH, $SOL, $XRP, $ADA, $DOGE
The digital asset market is facing a severe wave of deleveraging, forcing Bitcoin ($BTC) to give up the critical $63,000 support level. Broad macroeconomic tightening, driven by persistent inflationary pressures and delayed interest rate cut expectations from the Federal Reserve, has severely weakened risk appetite. Furthermore, a rotation of capital into high-growth technology equities alongside persistent spot ETF outflows—which recently marked a record $4.4 billion multi-day exodus—has accelerated the downward momentum.
Bitcoin's structure is heavily skewed to the downside, with sellers maintaining firm control over the short-term trend. While the breach below $63,000 has already shaken retail confidence, technical data indicates that the next structural move could be far more worrisome for market bulls.
Bitcoin Price Analysis: BTC Coin Slides Under $63,000
The continuous decline of $Bitcoin has systematically dismantled major psychological thresholds over the last month. After failing to sustain its positioning within the $70,000 and $66,000 handling zones, heavy distribution took over. This triggered severe cascading liquidations across crypto derivative platforms, amounting to over $3 billion in wiped-out market leverage within a two-day window.
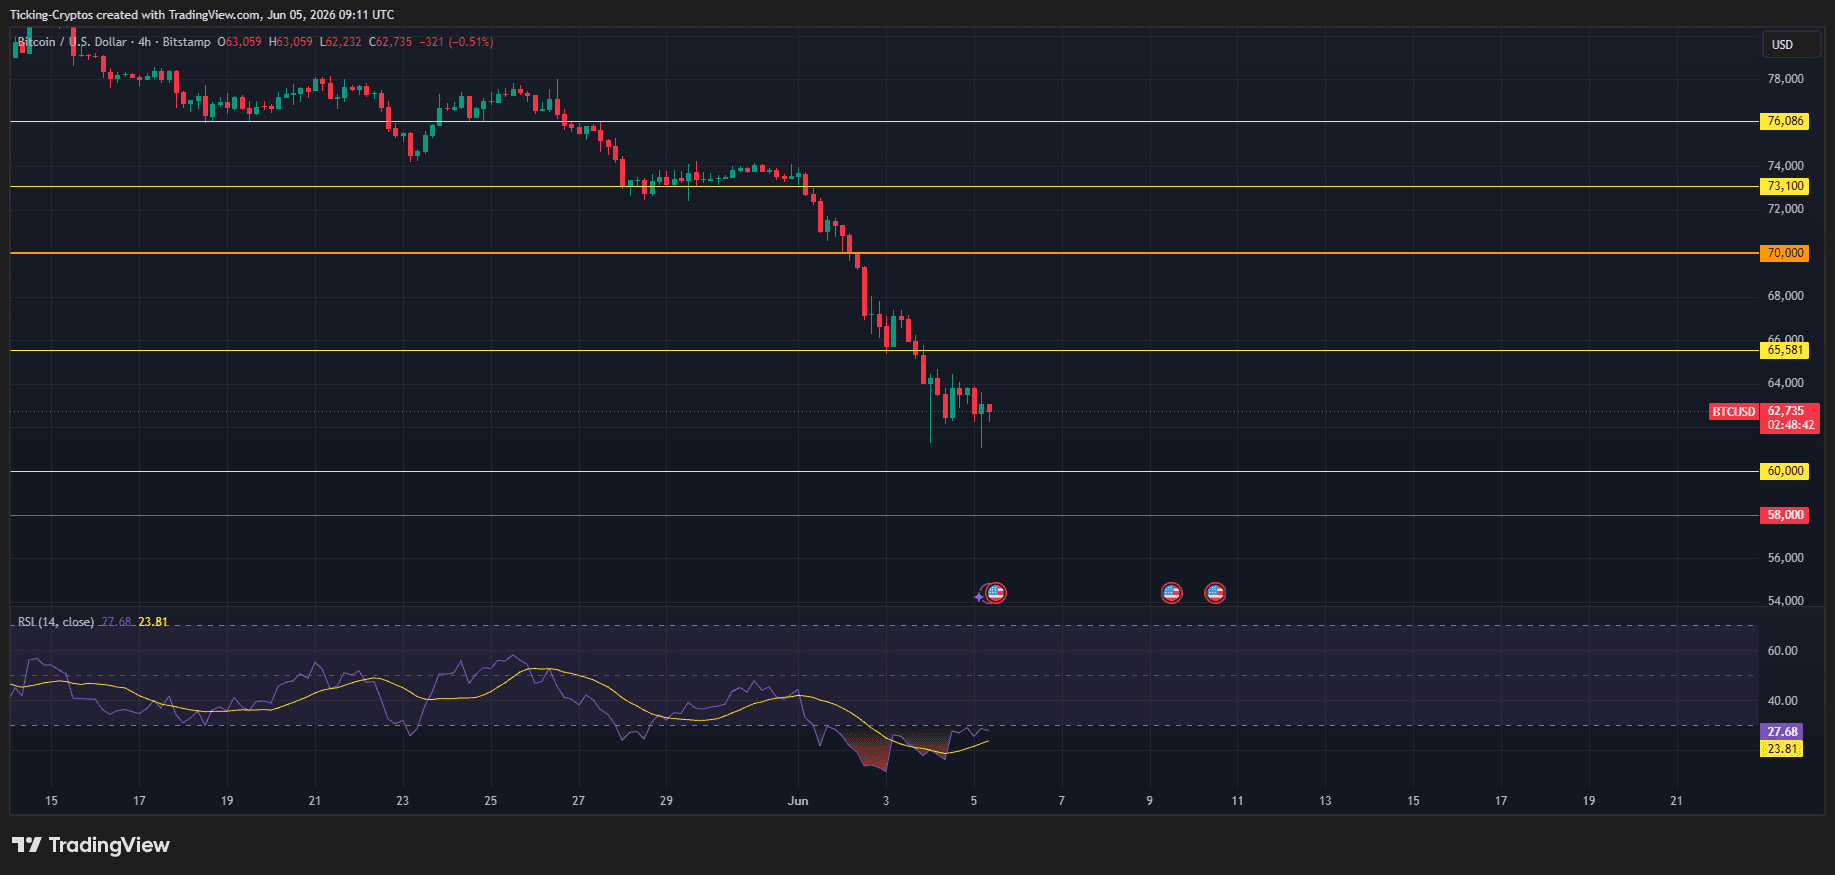
As depicted by live market action, BTC pushed down to an intraday low of $62,232 before experiencing minor structural consolidation toward $62,735.
- The RSI Factor: The 14-period Relative Strength Index (RSI) on the 4-hour chart is firmly embedded inside the oversold territory, printing a low reading of 27.68.
- Market Sentiment: Typically, an RSI falling below the 30 boundary suggests an asset is locally overextended to the downside. However, the accompanying volume spikes indicate aggressive spot distribution rather than a clean exhaustion of sellers, meaning a sudden trend reversal is not yet confirmed.
Why the Next Price Move is Worrisome
The breakdown below $63,000 is not just a localized correction; it signals a fundamental breakdown of the multi-month accumulation range. Market analysts point to several compounding technical factors that make the immediate outlook highly precarious.
1. Moving Average Convergence Flips to Resistance
Bitcoin remains pinned below its 20, 50, and 100-day moving averages. The velocity of the latest drop has widened the gap between the spot price and these core indicators, meaning any short-term relief rally will face immense overhead selling pressure at every minor step upward.
2. Institutional capitulation and ETF Outflows
The primary engine of the 2024–2025 bull cycle was consistent institutional demand via spot ETFs. The reversal of this trend into a historic 13-day outflow streak demonstrates that institutional risk metrics are forcing a reduction in crypto exposure. Without institutional buyers absorbing spot supply, order books remain thin and highly vulnerable to flash crashes.
💡Tip: Turn volatility into a long-term advantage
Market downturns often feel uncomfortable, but they can be some of the best opportunities for long-term investors. Instead of trying to time the market, a crypto savings plan lets you invest a fixed amount regularly and benefit from dollar-cost averaging (DCA). This means you automatically buy more crypto when prices are low and less when they are high, smoothing out volatility over time.
Start your Bitcoin savings plan today and steadily build your portfolio through every market cycle.
3. Macro Headwinds: Inflation and the Fed
Macro factors continue to act as a significant drag. Rising global crude oil prices, fueled by ongoing geopolitical tensions, have driven up corporate production and transportation costs. This sticky inflation has effectively erased the Federal Reserve's near-term rate-cut plans, with some officials even floating the possibility of interest rate hikes. Higher-for-longer interest rates structurally drain liquidity away from speculative risk assets like cryptocurrencies and redirect it toward traditional yield-bearing instruments.
Bitcoin Price Prediction: Next Critical Support Targets for BTC
With the $63,000 baseline now flipping into immediate overhead resistance, market observers are watching key horizontal support bands to evaluate where a macro price floor will settle.
Immediate Support: $60,000
The primary line in the sand for bulls sits directly at the $60,000 psychological milestone. According to multi-month trading data, this area represents a historic liquidity pocket where buyers have previously formed a defensive line. If $60,000 is invalidated on a weekly closing basis, it will likely spark an additional wave of automated stop-loss liquidations.
Macro Capitulation Floor: $58,000
Should macroeconomic or geopolitical conditions deteriorate further, the ultimate major defense line rests at $58,000. A descent into this territory would signify a deeper market capitulation, resetting open interest metrics completely before an organic base can be constructed.
Key Overhead Resistance: $65,581 and $70,000
For Bitcoin to neutralize its current bearish structure, the bulls must forcefully reclaim the $65,581 resistance line. Breaking above this level would provide the technical validation needed to shift short-term momentum and open the door for a retest of the major $70,000 supply zone.
Current Crypto Prices at a Glance
The systemic selloff has triggered broad-based declines across all high-market-cap digital assets. Based on aggregate market data, here is how the top cryptocurrencies are performing:
- Bitcoin ($BTC$): $62,735.00
- Ethereum ($ETH$): $1,664.72
- Binance Coin ($BNB$): $588.39
- XRP ($XRP$): $1.12
- Solana ($SOL$): $65.57
The cryptocurrency market is under significant downward pressure, causing the Ethereum price to fall below the psychologically important mark of $1,700. Ongoing macroeconomic stress factors, outflows from spot ETFs, and systematic liquidations of long positions have plunged the second-largest cryptocurrency into a deep correction phase.
Based on current market data from the 4-hour charts, Ethereum is currently in a heavily oversold area. For traders and investors, the urgent question now is where the price floor can be established.
Ethereum Price Analysis: ETH Coin Breaks Below $1,700
The market structure of Ethereum has continuously deteriorated over the past few weeks. After the bulls failed to sustain the price above the psychological level of $2,000, selling pressure accelerated significantly when the horizontal support zone at $1,800 was breached.
The recent drop pushed ETH down to a daily low of $1,661.90 before a slight consolidation began around the mark of $1,663.72.
- The RSI Factor: The Relative Strength Index (RSI) on the 4-hour chart has slipped deep into the oversold territory, currently sitting at a value of 19.00.
- Market Sentiment: An RSI value below 30 typically signals that an asset has fallen too much in the short term. However, the dominant bearish momentum indicates that a definitive trend reversal has yet to be initiated. Many traders are waiting for a stabilization of the overall market, which often heavily depends on the movements of the market leader $Bitcoin.
Crypto Crash? Invest Long-Term with a Savings Plan
Strong price declines can be unsettling, but they often provide attractive entry opportunities for long-term investors. With a crypto savings plan, you invest a fixed amount regularly and benefit from the cost-averaging effect (DCA). This way, you automatically buy more coins at lower prices and fewer at higher prices, without needing to find the perfect entry point.
Start your Crypto Savings Plan now and build your portfolio step by step.
The Next Critical Supports for ETH
As the $1,700 mark now serves as immediate resistance, market participants are monitoring the historical volume profile and key horizontal chart levels to identify potential turning points.
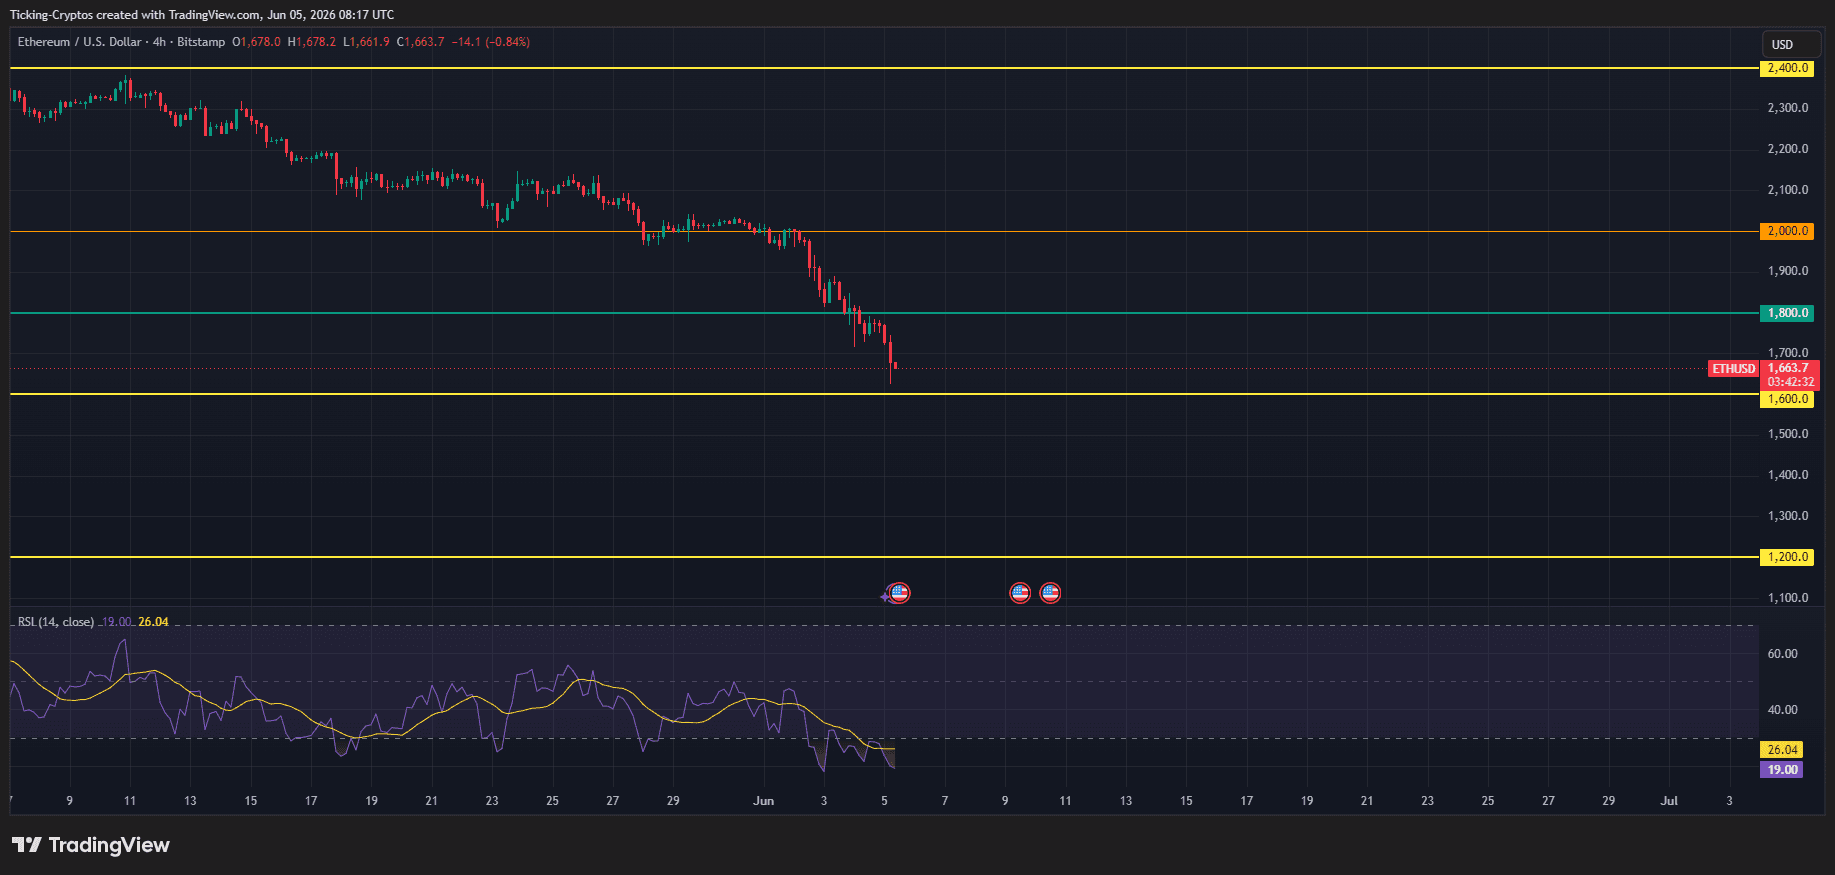
1. The Immediate Floor: $1,600
The $1,600 mark represents the primary defense line for the bulls. This area serves as a significant psychological barrier and has historically been a zone where more buyers have entered the market (accumulation zone). If the bulls do not act aggressively here, further liquidations are at risk.
2. Macro Support: $1,200
If macroeconomic pressure on risk assets persists or intensifies, the next major long-term price floor lies in the $1,200 range. A drop into this zone would signify a severe capitulation event for the current market cycle.
3. Resistances to be Reclaimed: $1,800 and $2,000
For the short-term bearish market structure to neutralize, $Ethereum must first establish a stable base above $1,600 and then reclaim the $1,800 mark. Only a sustainable breakout above this resistance would pave the way for a retest of the $2,000 level.
Current Crypto Prices at a Glance
The correction is currently affecting the entire digital currency space. Based on the latest aggregate data from major exchanges, the key cryptocurrencies are priced as follows:
- Bitcoin ($BTC): $62,641.90
- Ethereum ($ETH): $1,664.72
- Binance Coin ($BNB): $588.39
- XRP ($XRP): $1.12
- Solana ($SOL): $65.57
Zcash is one of the biggest losers in the crypto market today, with $ZEC price dropping by more than 10% in 24 hours while the broader market also trades under pressure. The sharp Zcash crash comes after a strong rally that pushed the privacy coin back into the spotlight, making it more exposed to profit-taking once sentiment turned bearish.
According to Binance market data, Zcash was trading around the $540 range, down more than 11% in 24 hours, with a market cap near $9 billion and 24-hour trading volume above $1.3 billion. The token also moved between a 24-hour high above $631 and a low near $538, showing how aggressive the sell-off became during the day.
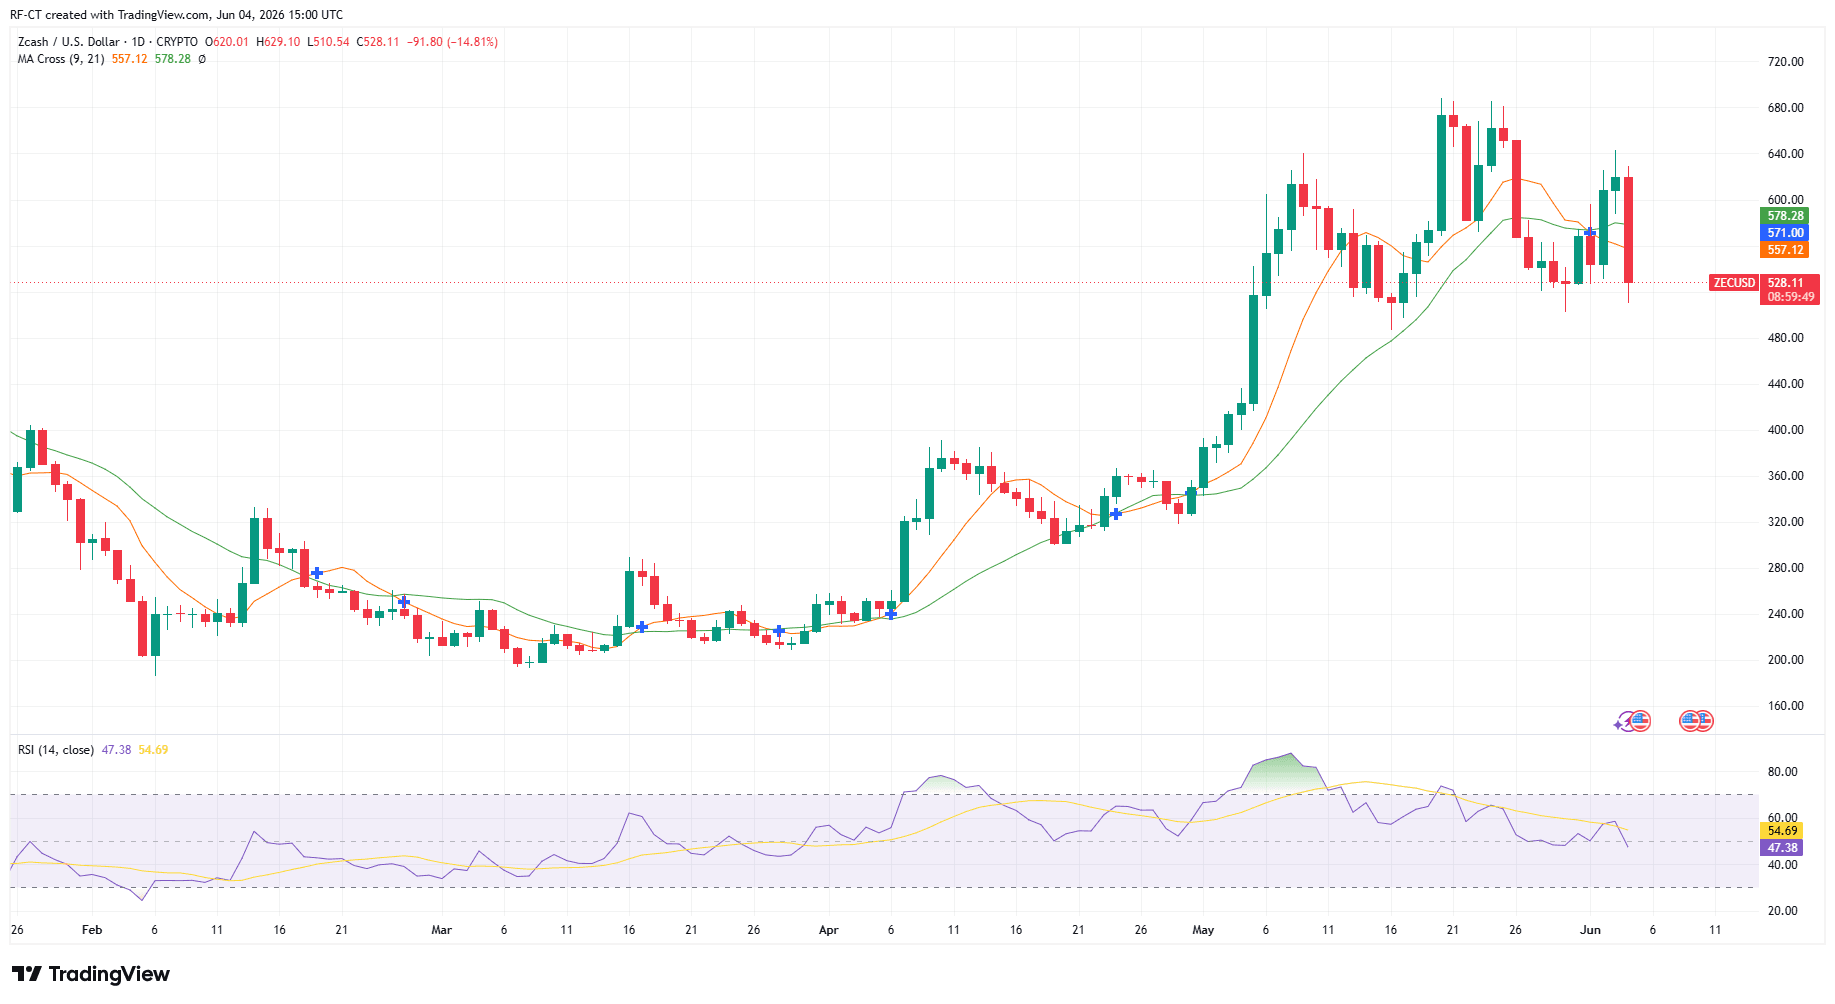
Why Is Zcash Crashing Today?
The main reason behind the Zcash crash is not one single event. Instead, ZEC is being hit by a combination of profit-taking, market-wide weakness, technical uncertainty, and fear around recent network-related headlines.
ZEC had already rallied strongly before the current correction. The privacy coin became one of the strongest performers in the market as traders rotated into privacy-focused crypto assets. Business Insider recently reported that Zcash had surged sharply over the past month while Bitcoin gained much less, driven by renewed interest in financial privacy and institutional attention around ZEC.
This matters because assets that rise the fastest often fall the hardest when the market turns red. Traders who entered ZEC earlier may now be locking in profits, especially after the coin moved into overextended territory.
ZEC Rally Made the Correction More Violent
Zcash did not enter this crash from a weak position. It entered it after a major rally.
That is why the correction looks sharper than in many other altcoins. When a token gains strong momentum in a short period, late buyers often enter near the top. Once the price starts falling, these buyers may exit quickly, adding more selling pressure.
This creates a chain reaction:
ZEC pumps strongly, traders chase the move, the broader market turns bearish, profit-taking starts, leveraged positions get squeezed, and the price drops faster than the rest of the market.
In simple terms, ZEC is crashing the most because it had more gains to give back.
Zcash Network Headlines Added More Fear
Another key reason behind the Zcash crash is the confusion around the network.
Reports on June 3 suggested that the Zcash blockchain appeared to stop producing blocks for several hours. However, later explanations said the issue may have been related to block explorers rather than the blockchain itself. CoinDesk reported that the apparent disruption was mainly linked to block explorers tracking activity incorrectly, not necessarily a full chain failure.
Zcash network was fully functional and that the apparent problem came from some block explorer applications being connected to a faulty node.
Even if the network was not actually down, the timing was bad. In a nervous market, headlines about a possible blockchain issue can quickly trigger fear, uncertainty, and doubt. For traders, that can be enough reason to sell first and ask questions later.
Emergency Orchard Bug Fix Increased Short-Term Risk Sentiment
The Zcash crash also comes shortly after an emergency upgrade related to the Orchard shielded pool.
Zcash Foundation released Zebra updates after engineers found and fixed a critical soundness bug in the Orchard Action circuit. Reports stated that the emergency response included Zebra 4.5.3 and Zebra 5.0.0, with no known exploit reported.
CoinMarketCap also reported that Zcash completed an emergency upgrade to fix the critical Orchard privacy pool bug, adding that no funds were lost and user privacy was not affected.
Still, the market does not always wait for full technical explanations. Words like “critical bug,” “emergency upgrade,” and “privacy pool” can create short-term panic, especially around a privacy-focused coin where trust in the protocol is essential.
Privacy Coin Narrative Is Still Strong, But Volatile
Zcash has benefited from a stronger privacy coin narrative in 2026. As blockchain transparency, AI surveillance, and financial data tracking become bigger topics, some traders see ZEC as a hedge against total on-chain visibility.
This narrative helped ZEC outperform many major cryptocurrencies recently. However, strong narratives can also become crowded trades. When too many traders are positioned in the same direction, any negative headline or market pullback can cause a sharp reversal.
That is exactly what appears to be happening now. ZEC is not necessarily crashing because the privacy narrative is dead. It is crashing because the rally became too crowded, too fast.
Zcash Price Analysis: Key Levels to Watch
From a technical perspective, ZEC’s drop below the $600 area is important. The token recently traded above $631 before falling toward the $540 range, according to Binance data.
The next important levels to watch are:
- $540–$520: This is the immediate support zone. If ZEC holds this area, the crash may slow down.
- $500: This is the psychological level. A break below $500 could trigger more panic selling.
- $600: This is now the key recovery level. If ZEC reclaims $600, traders may regain confidence.
- $630–$650: This is the recent resistance zone. A move back above this area would suggest that buyers are returning strongly.
For now, the chart suggests that ZEC is in a correction phase after a strong rally. The next move depends on whether buyers defend the $520–$540 zone or whether the sell-off continues toward $500.
Is the Zcash Crash a Buying Opportunity or a Warning Sign?
The Zcash crash could be seen in two ways.
For bullish traders, this may be a normal correction after a major rally. ZEC still has a strong privacy narrative, renewed market attention, and growing discussion around financial confidentiality in crypto.
For cautious traders, the crash is a warning that ZEC became overheated. The combination of a strong rally, emergency bug-fix headlines, and confusion around network activity shows that ZEC remains a high-volatility asset.
The most important point is that Zcash is not falling in isolation. The broader crypto market is also under pressure. But ZEC is falling harder because it had already become one of the most aggressive recent movers.
Final Thoughts: Why ZEC Is Crashing the Most
Zcash is crashing harder than the rest of the crypto market because it entered the sell-off from an overextended position. The recent ZEC rally attracted strong attention, but it also created room for heavy profit-taking.
At the same time, network-related confusion and the emergency Orchard bug fix added short-term fear. Even though reports suggest that no funds were lost and the blockchain was not necessarily offline, the headlines were enough to pressure traders during an already weak market.
For now, the Zcash crash looks like a mix of profit-taking, technical correction, market-wide weakness, and fear-driven selling. If ZEC holds above the $520–$540 support zone, the correction may stabilize. But if the price breaks below $500, the sell-off could deepen further.
$ZEC
Decrypt
Fallout from a bug that enabled undetectable Zcash counterfeiting shows that privacy can sometimes present tradeoffs, experts say.
Strategy shares tumbled alongside Bitcoin on Friday as the firm's flagship preferred stock also came under pressure.
The company behind Claude embedded engineers at the NSA for offensive cyber ops, then published a report warning AI could soon build itself without humans in the loop.
The price of Zcash cratered following the disclosure of a serious vulnerability for the privacy coin. Can ZEC make a comeback anytime soon?
The crypto tax bills—the first of their kind to be deliberated by congressional leadership—will be discussed at a House hearing on Tuesday.
U.Today - IT, AI and Fintech Daily News for You Today
Ripple’s David Schwartz laid out an ambitious roadmap for the XRP Ledger.
Bitcoin has plunged below the $60,000 mark for the first time since 2024, crashing through its 200-week moving average.
Prominent economist Robin Brooks has declared that gold's days as a reliable safe-haven asset are officially over.
Peter Schiff dismisses claims that Bitcoin’s ongoing price dip was influenced by Strategy’s recent 32 BTC sale, noting that there’s more to it.
As SHIB drops 15%, a dormant whale broke a 10-month silence to move 400B tokens via a BitGo smart contract.
Blockonomi
TLDR:
- The U.S. added 172,000 jobs in May, nearly doubling forecasts and pushing rate hike odds to 57% in one day.
- Broadcom’s refusal to raise AI targets triggered a 12.6% stock drop, sparking fears of overvalued AI positions.
- SemiAnalysis reported Nvidia’s new chips need half the expected memory, sending SK Hynix and Samsung shares sharply lower.
- SpaceX, Anthropic, and OpenAI listings worth $4–$5 trillion are forcing fund managers to sell holdings to raise cash.
Global financial markets suffered a broad and sharp decline on Friday, erasing approximately $2.5 trillion in a single trading session.
The S&P 500 dropped 1.65%, while the Nasdaq fell 2.60%. Gold, silver, and Bitcoin also recorded steep losses. A combination of stronger-than-expected jobs data, cracks in the artificial intelligence trade, and looming liquidity concerns drove the widespread sell-off across asset classes.
Hot Jobs Report Rattles Rate Cut Expectations
The U.S. economy added 172,000 jobs in May, nearly double Wall Street’s forecast of 88,000. That surprise reading sent shockwaves through markets almost immediately after the open.
With inflation running at 3.8% and oil prices at $90 per barrel, the strong labor data changed the rate outlook sharply.
The probability of a Federal Reserve rate hike this year jumped from 40% to 57% in one session. Higher rates reduce the present value of future earnings, making growth and tech stocks less attractive. Investors responded by rotating out of those positions quickly.
As noted by market analyst account Bull Theory on X, “A labor market this strong tells the Fed it cannot cut interest rates and may actually need to raise them.” That shift in sentiment accelerated selling pressure across equity markets.
EVERYTHING THAT COULD GO WRONG FOR MARKETS WENT WRONG TODAY.
S&P 500 down -1.65%, wiping out $1.14 trillion.
Nasdaq down -2.60%, wiping out $1.11 trillion.
Gold down -3.38%, wiping out $1 trillion.
Silver down -6.9%, wiping out $280 billion.
Bitcoin down -6.31%, wiping out… pic.twitter.com/jiDtnvok7u— Bull Theory (@BullTheoryio) June 5, 2026
Adding to the uncertainty, new Fed Chair Kevin Warsh holds his first policy meeting in 11 days. Appointed under expectations of rate cuts, he now faces hot inflation, elevated oil, and a tight labor market. That uncertainty alone pushed many fund managers toward reducing risk.
AI Trade Cracks Under Pressure From Multiple Fronts
Broadcom reported record quarterly earnings, with revenue up 48% and AI chip sales climbing 143%. Yet the stock fell 12.6% after the company declined to raise its AI revenue targets. That single decision prompted investors to question whether AI valuations had grown too stretched.
Research firm SemiAnalysis then reported that Nvidia’s next-generation AI chips would require roughly half the memory previously priced into analyst models. SK Hynix fell nearly 10% on the news, while Samsung dropped over 6%. South Korea’s broader market declined 5.5% in a single session.
Anthropic also released a report warning that AI systems are approaching the ability to improve themselves without human input. The firm called for a global pause in AI development.
Coming alongside the chip memory news and Broadcom’s miss, it deepened fears about whether business models can sustain the current pace of AI growth.
Meanwhile, a liquidity drain looms over markets. SpaceX is set to go public next week at a $1.75 trillion valuation. Anthropic and OpenAI are also preparing listings.
Together, these three companies represent $4 to $5 trillion in potential capital demand. Fund managers are selling existing holdings to raise cash, adding further pressure to an already stressed market.
The post Market Sell-Off Wipes $2.5 Trillion as Jobs Data, AI Concerns Shake Investors appeared first on Blockonomi.
TLDR:
- The SEC is developing a framework to list and trade tokenized securities under the “innovation without arbitrage” principle.
- SEC and CFTC are jointly identifying rulebook gaps covering swap reporting, portfolio margining, and product definitions.
- The CFTC approved Kalshi’s proposal to trade Bitcoin perpetual futures, leaving other assets open for case-by-case review.
- The SEC is targeting a 23-by-5 equity market trading transition and reviewing legacy rules like Regulation NMS by year-end.
The SEC is actively developing a framework for the listing and trading of tokenized securities, guided by the principle of “innovation without arbitrage.”
SEC Trading and Markets Director Jamie Selway outlined this direction at the Piper Sandler Global Exchange & Fintech Conference on June 4, 2026, in New York.
The framework aims to modernize U.S. capital markets while protecting existing market structure. Regulators are working to ensure new entrants and legacy providers are treated equally under the new rules.
SEC Pushes Forward on Tokenized Securities Framework
Chairman Atkins has directed the Division of Trading and Markets to develop a framework for tokenized securities listing and trading.
The guiding principle, “innovation without arbitrage,” is designed to prevent unfair advantages for either new or established market participants.
Selway described the principle plainly, saying the Division aims “to advantage neither new entrants nor legacy providers over the other.”
The SEC’s goal is to foster a healthy ecosystem for tokenized securities without disrupting existing, well-functioning markets.
The Division has been engaging with both traditional finance incumbents and decentralized finance new entrants. These conversations span the full range of tokenized securities operations, covering primary issuance, secondary trading, and custody.
Staff statements on custody and trading have already been issued as part of this groundwork. The Division is now working toward an “innovation exemption” recommendation to allow certain trading venues to trade tokenized securities.
Major market infrastructure players are already responding to this regulatory direction. The DTCC announced plans to facilitate limited production trades of tokenized securities through DTC’s service starting July 2026. A broader rollout is planned for October 2026.
Nasdaq and the NYSE have also separately announced plans to develop platforms for trading and on-chain settlement of tokenized securities.
Selway also confirmed the SEC is working to facilitate a transition to 23-by-5 equity market operation by the end of 2026. The Division is additionally reviewing legacy rules such as Regulation NMS and the Consolidated Audit Trail for modernization.
These efforts are part of a broader push to drive efficiency and competition across U.S. capital markets. Together, these steps position the SEC as an active architect of next-generation market infrastructure.
SEC-CFTC Coordination Shapes the Path for Tokenized Markets
The tokenized securities framework does not exist in isolation. The SEC and CFTC are coordinating in parallel on rules that touch both agencies’ jurisdictions.
Chairman Atkins stated directly that “firms should not be shuffled back and forth between regulators when a product touches elements of both regulatory frameworks.” He added that “where jurisdiction overlaps, the most effective response is a coordinated one.”
Both agencies are jointly identifying areas where their rulebooks lack clarity or compatibility. Swap and security-based swap data reporting, portfolio margining, and product definitions have been identified as initial focus areas.
The SEC also approved Nasdaq PHLX’s proposal to list cash-settled Bitcoin index options on May 22. These actions reflect a deliberate, step-by-step approach to building a coherent cross-agency framework.
Selway stressed two core responsibilities that must anchor the tokenized securities framework. Regulators must clearly distinguish investing from gambling, even as technology blurs traditional boundaries.
They must also prevent excessive leverage from reaching unsophisticated retail investors through new tokenized products.
Selway put it directly, warning against “extending unhealthy levels of leverage to the unsophisticated and unsuspecting” as markets evolve.
Industry participants were also urged to engage constructively rather than exploit jurisdictional gaps. Selway warned that venue shopping and unreasonable expectations will undermine harmonization efforts. He called on firms to bring forward their best ideas for reducing regulatory friction through public input.
He framed the stakes clearly, saying that by “delivering true innovations” and avoiding key pitfalls, industry organizations “can deliver value to your clients, your investors, your world-leading industry, and our great Nation.”
The post SEC Builds Tokenized Securities Framework Guided by “Innovation Without Arbitrage” Principle appeared first on Blockonomi.
TLDR
- BlackRock recorded $47.66 million in Bitcoin ETF inflows on June 5.
- The inflow ended a 13-day streak of consecutive outflows for the fund.
- Bitcoin traded near $61,000 during the same session.
- The asset declined more than 15% over the past week.
- The broader Bitcoin ETF market continued to face pressure.
BlackRock ended a 13-day outflow streak with fresh capital entering its Bitcoin ETF on June 5. The fund attracted $47.66 million in new inflows during its latest session. The reversal occurred as Bitcoin retested $61,000 and extended weekly losses beyond 15%.
BlackRock ETF Posts $47.66M Daily Inflow
Data from SosoValue showed BlackRock’s Bitcoin ETF added $47.66 million on Friday. The inflow marked the product’s first positive session in nearly two weeks. The fund had recorded consecutive red days as institutions reduced exposure.
The broader Bitcoin ETF market experienced steady withdrawals for almost three weeks. However, BlackRock reversed that pattern with a single day of fresh allocations. Market data confirmed that other issuers still faced pressure during the same session.
Bitcoin price traded near $61,000 when the inflow occurred. The price level matched levels last seen in February 2024. Over the past week, Bitcoin declined more than 15% as volatility persisted.
Bitcoin Price Weakness Continues Across Market
Bitcoin extended its decline as traders reassessed risk exposure. The asset moved lower during the week and tested support near $61,000. Market charts reflected sustained selling pressure across major exchanges.
The broader crypto market also remained under strain. Major tokens retested 2024 price levels during recent sessions. Total market capitalization contracted as liquidity tightened.
Despite falling prices, BlackRock attracted fresh ETF capital. The timing contrasted with earlier sessions when funds saw redemptions. Market participants linked prior outflows to ongoing volatility and reduced institutional appetite.
BlackRock’s reversal sparked discussion across trading desks. Some analysts cited positioning ahead of potential price stabilization. However, no official statement explained the sudden inflow.
SosoValue data confirmed that BlackRock led daily inflows within the ETF segment. Other products posted either neutral or negative flows during the session. The update highlighted a divergence within the ETF landscape.
Bitcoin remained below its October 2025 peak of $126,000. The asset traded more than 50% lower than that record. Weekly declines compounded the broader market drawdown.
Institutional ETF flows often track broader sentiment shifts. This session broke a 13 day sequence of capital withdrawals. BlackRock’s daily report reflected renewed allocation activity.
The crypto market continued trading in the red zone. Prices across leading assets remained under pressure. Exchange volumes reflected cautious positioning.
BlackRock’s Bitcoin ETF recovery arrived during heightened volatility. The inflow stood at $47.66 million for the trading day. SosoValue published the data on Friday, June 5.
Bitcoin held near $61,000 at the close of the session. The weekly decline exceeded 15% at that point. ETF flow data remained the latest confirmed update from market trackers.
The post BlackRock Records First Bitcoin ETF Inflow in 13 Days appeared first on Blockonomi.
TLDR
- Michael Saylor says Bitcoin should balance purity and adoption.
- Bitcoin traded below $61,000 and fell over 25% in a month.
- Saylor outlined four ideologies shaping Bitcoin’s future.
- Strategy sold 32 BTC worth about $2.5 million this week.
- The firm still holds more than 844,700 BTC on its balance sheet.
Bitcoin hovered near two-year lows as Michael Saylor published a new essay on the network’s direction. He argued that Bitcoin should balance competing visions instead of choosing one path. The comments came as BTC traded below $61,000 and extended monthly losses beyond 25%.
Bitcoin Ideologies Clash as Prices Slide
Saylor outlined four Bitcoin ideologies in a Friday post on X. He named maximalists, capitalists, technologists, and fundamentalists as core camps shaping the network.
He wrote, “The mission is not to choose between purity and adoption, or between innovation and stability.” He added, “The mission is to ensure that Bitcoin remains Bitcoin while the world builds on it.”
He described the base layer as “sacred infrastructure” that must remain stable. However, he said Bitcoin, the asset, should integrate with companies, banks, and nation-state reserves.
The essay addressed tensions tied to Bitcoin’s deeper ties with traditional finance. Corporate treasuries, exchange-traded funds, and capital markets now influence demand patterns. BTC traded at $60,717 on Friday and showed a 5.35% daily decline.
The asset has dropped more than 50% from its October 2025 high of $126,000. It has also recorded one of its steepest pullbacks since the 2022 bear market. The downturn has intensified debate over Bitcoin’s direction and market structure.
Strategy’s Bitcoin Moves Draw Scrutiny
Strategy has expanded preferred stock offerings to finance additional Bitcoin purchases. The firm holds more than 844,700 BTC on its balance sheet. However, it disclosed the sale of 32 BTC for about $2.5 million earlier this week.
The sale represents a small fraction of total holdings. Still, critics questioned whether larger sales could follow. CNBC host Jim Cramer responded to a video by Strive CEO Matt Cole and said, “Saylor murdered Bitcoin.”
Strategy has not announced further disposals since the disclosure. The company continues to position Bitcoin as a treasury reserve asset. Meanwhile, BTC price weakness has shaped investor and analyst commentary.
Analysts Debate Path to a Sustainable Bottom
Grayscale Head of Research Zach Pandl said Strategy faces limits at current share prices. He stated that further accumulation may require new sources of demand. He said the market needs broader participation to find a “sustainable bottom.”
Standard Chartered Head of Digital Assets Research Geoffrey Kendrick offered a different view. He said Bitcoin’s low is “almost in” based on steady spot ETF holdings. He also suggested Strategy could repurchase more BTC than it recently sold.
Kendrick said renewed buying would signal that the worst of the selloff has passed. For now, Bitcoin remains under pressure as analysts assess demand conditions. BTC last traded below $61,000, down more than 25% over the past month.
The post Saylor Says Bitcoin Must Balance Purity and Growth appeared first on Blockonomi.
TLDR:
- Bitcoin has fallen below the median holder’s breakeven level for the first time since 2022.
- Glassnode data identifies the $46K-$54K range as the highest-probability Bitcoin bottom zone.
- The CVDD model near $46K has historically served as a reliable anchor during cycle lows.
- Bitcoin’s drawdowns are becoming shallower, supporting a higher floor than prior bear markets.
Where is the Bitcoin bottom? That question has gained urgency after Bitcoin fell to nearly $62,000, placing the asset about 50% below its all-time high.
The decline has pushed Bitcoin into a valuation range that has historically coincided with major cycle lows. According to market analyst Rafael, several long-term on-chain indicators now cluster around levels that previously acted as bear market floors.
While no model can identify an exact bottom in advance, current data offers a framework for assessing where support may emerge.
Bitcoin Approaches Historical Bottoming Levels
In a recent X thread, Rafael examined several valuation metrics used to identify potential cycle bottoms. He noted that Bitcoin has dropped below the median holder’s breakeven level for the first time since December 2022.
1/ Where is the #Bitcoin bottom?$BTC has fallen to $62K, nearly 50% below its ATH and down 24% in a month.
Price has now worked through the upper rungs of our pricing framework, moving into the cluster of valuation levels where past cycles have found their floor.
pic.twitter.com/Yo7qJoQesH
— Rafael (@n3ocortex) June 5, 2026
The analyst pointed to the Median Realized Price near $64,100 and the 200-week moving average around $61,700. Together, these metrics form an important support cluster that has attracted market attention.
According to the thread, Bitcoin has spent only about 7% of its history trading below the Median MVRV level. That makes the current price zone relatively uncommon compared with the broader trading history of the asset.
Rafael also outlined deeper support levels beneath the 200-week moving average. These include the Realized Price at roughly $54,000, CVDD near $46,000, Balanced Price around $40,000, and Delta Price close to $35,000. Previous bear market lows have typically entered this range before recovering.
Where Data Suggests the Bitcoin Bottom Could Form
The analysis places particular emphasis on the CVDD model. Rafael noted that across prior market cycles, Bitcoin’s ultimate lows frequently formed within a narrow range above the CVDD level.
According to the data, previous cycle bottoms generally occurred between 1.05 and 1.18 times the CVDD value. While other valuation metrics were occasionally breached, CVDD consistently served as a reliable anchor during major downturns.
With CVDD currently sitting near $46,200, the analyst identified a higher-probability bottom zone between $46,000 and $54,000. This range spans from the CVDD level to the Realized Price and represents the area where historical cycle floors have often developed.
Below that sits a deeper capitulation range between $35,000 and $40,000, defined by the Balanced Price and Delta Price models. Rafael noted that Bitcoin has traded in this lower zone during less than 3% of all trading days.
The analyst also observed that Bitcoin drawdowns have become progressively shallower over time. Earlier cycles recorded declines of approximately 85%, 84%, and 77%.
The current cycle has fallen around 50% from its peak. Although a deeper correction cannot be ruled out, the trend suggests the more likely Bitcoin bottom may reside within the $46,000 to $54,000 range rather than the lower capitulation zone.
Rafael stressed that no valuation model can predict an exact bottom. Instead, investors should view these levels as probability zones that help track changing market conditions.
For recovery, he identified the $75,000 to $79,000 region as the first major area Bitcoin would need to reclaim to signal improving market structure.
The post Where Is the Bitcoin Bottom? Glassnode Data Identifies the Most Likely BTC Floor Zones appeared first on Blockonomi.
CryptoPotato
It was difficult to imagine in mid-May how much the cryptocurrency landscape could change for the worse in such a painful manner in the following three weeks. Aside from BTC, which dumped beneath $60,000 for the first time since November 2024, and ETH plummeting to a 14-month low, XRP also slipped below crucial support levels and marked a 19-month low of under $1.10 on Friday.
The question now is whether this last defense above the crucial psychological level at $1.00 will hold, or if the cross-border token is headed toward an inevitable crash into the cents territory.
What Happens When Bears Take Complete Control?
The popular AI solution’s new version noted that the most realistic first bearish target sits at $0.90 if XRP dumps below $1.00 soon, which appears more and more likely given the current market conditions. Just for reference, BTC broke down below $60,000 earlier today, reaching its lowest price tag since before the US elections in late 2024.
XRP also dumped to its lowest level since those eventful days in November 2024, as it currently sits below $1.10. After breaking below its last major support level, $1.00 is now in focus; another leg down could test it soon.

If the token indeed dips to $0.90, this would represent another 18%-20% decline and likely coincide with continued weakness across the market, ChatGPT added.
However, it outlined even lower targets if the bulls fall out completely, with the even more bearish option seeing the asset dumping to $0.75-$0.80.
The capitulation scenario envisions another drop to $0.60, but this remains a “low-probability outcome.”
“For XRP to collapse that far, investors would likely need to face a combination of macroeconomic turmoil, a broader crypto bear market, and the disappearance of key bullish narratives such as ETF optimism and institutional adoption,” the AI platform noted.
A Violent Rebound?
ChatGPT also offered a different viewpoint, which shows that XRP could be “approaching the point where conditions become favorable for a relief rally.” Basing its projection on some historical developments, especially for previous Junes during US midterm election years, it explained that “pessimism often preceded major recoveries.”
Consequently, it outlined a possible and quick rebound to $1.25 and even $1.40 if buyers successfully defend the $1.05-$1.10 support region, which is to be seen in the next days or even hours.
The post XRP Holders Won’t Like What ChatGPT’s New Version Predicts Next appeared first on CryptoPotato.
Many popular altcoins, including Ethereum (ETH), Ripple (XRP), and Solana (SOL), have declined by 5%-8% over the past day, in line with the broader market’s bearish conditions.
Four lesser-known tokens, however, experienced much more substantial losses, and the main culprit is Binance.
What Happened?
The world’s largest crypto exchange conducted yet another review of the digital assets listed on its platform to assess whether they meet industry requirements, including team commitment, level of development activity, trading volume, adequate liquidity, network stability, and more.
Following the analysis, it decided to terminate all services with Contentos (COS), Dar Open Network (D), Highstreet (HIGH), and MOBOX (MBOX). The delisting effort is scheduled for June 19, but the announcement has already caused a price collapse for the affected coins. All of them have plummeted by more than 25% daily, with COS the biggest loser, down around 31%.
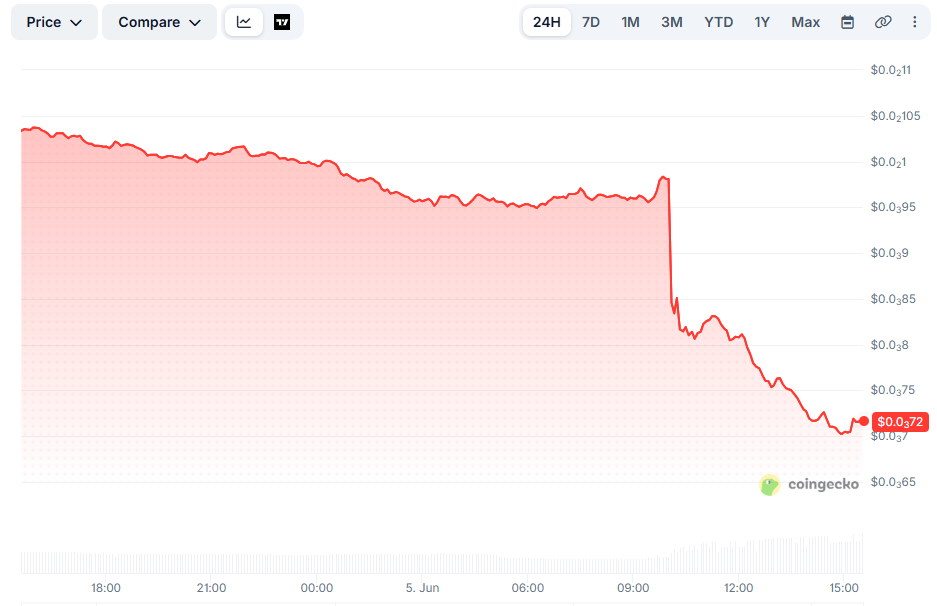
Such dramatic price swings shouldn’t be surprising, as losing support from a heavyweight like Binance typically results in thinner liquidity, reduced availability, and reputational damage.
A few weeks ago, the exchange said goodbye to Automata (ATA), Harvest Finance (FARM), Enzyme (MLN), Phoenix (PHB), and Syscoin (SYS), sparking similar price reactions.
Binance also removed the trading pairs AXL/BTC, CRV/BTC, EGLD/BTC, OPN/BNB, POL/ETH, QTUM/USDC, and SKY/BTC. However, the move didn’t trigger a massive price drop, as the termination of all trading services for those assets might have.
Additional Announcements
The company disclosed that it will support the NEAR Protocol (NEAR) network upgrade and hard fork. The development is scheduled for June 10 and will include a temporary suspension of token deposits and withdrawals on that blockchain.
Binance promised to handle all technical requirements involved for users, assuring that operations will be restored once the upgraded network is “deemed to be stable.” It also said that token trading will not be affected.
This is a standard procedure carried out multiple times in the past, and so far there haven’t been any reports of major complications. Towards the end of May, Binance briefly halted deposits and withdrawals on the Ethereum network to perform wallet maintenance. Prior to that, it implemented such measures to support improvements across other ecosystems, including Cardano and BNB Chain.
The post Binance Sparked a Massive Crash for 4 Altcoins: Check out How appeared first on CryptoPotato.
Bitcoin has moved beyond being a narrow technical experiment or niche monetary protest, according to Strategy Chairman Michael Saylor. He believes the crypto asset is now the dominant digital monetary network and is a global asset with wide implications for individuals, institutions, corporations, banks, capital markets, and nation-states.
As Bitcoin expands, Saylor said that the community is naturally splitting into four overlapping ideologies that shape how people think about its future development, adoption, and protection, even though all share a belief in Bitcoin’s importance.
Four Ideological Camps
In his latest post on X, Saylor identified these groups as Maximalists, Capitalists, Technologists, and Fundamentalists, each emphasizing a different priority in how the world’s largest crypto asset should evolve.
Bitcoin Maximalists, for one, see BTC as the dominant monetary network and a breakthrough in digital scarcity. They focus on its role as incorruptible money, a long-term store of value, protection against inflation and monetary instability, and a “moral and civilizational advance” in economic systems, while stressing “there is no second best,” though they risk being unclear on how BTC integrates into broader financial systems.
Bitcoin Capitalists, on the other hand, view BTC as digital capital that should integrate deeply into global markets including banks, corporations, securities, credit instruments, and sovereign systems, emphasizing institutional adoption, custody, lending, and capital market products. But this group faces risks of “reckless financialization” and added complexity.
Meanwhile, Bitcoin Technologists focus on the continuous improvement of the protocol, including scalability, privacy, usability, and security. They believe that “responsible protocol improvement is not corruption.” They are of the view that BTC must keep evolving to remain useful, though they risk introducing harmful changes if base-layer modifications undermine stability.
Bitcoin Fundamentalists focus on preservation of BTC’s core properties such as decentralization, self-custody, immutability, censorship resistance, and permissionless access. They warn against institutional capture or protocol dilution. However, Saylor said that they may risk limiting broader adoption if they reject too much integration or change.
Saylor explained these ideologies are not mutually exclusive, but different forces serving distinct roles in the ecosystem: Maximalists provide conviction, Capitalists drive adoption, Technologists enable innovation, and Fundamentalists safeguard core principles.
The central tension lies in balancing these perspectives since each can become problematic if taken to extremes. In Saylor’s view, the healthiest path forward is a synthesis.
“The strongest path forward is not reckless change, institutional capture, or isolationist purity. It is disciplined expansion. Bitcoin’s power comes from the fact that it can serve many constituencies without belonging to any one of them.”
Bitcoin’s Ideological Battles
Over time, Bitcoin’s internal camps have often clashed over how the network should evolve. Maximalists frequently resisted changes they see as unnecessary or harmful to Bitcoin’s core design. This tension became especially clear during the scaling and block size debates, where different groups pushed competing visions for BTC’s future.
Even major upgrades were difficult to agree on. For example, the SegWit upgrade was proposed in late 2015 but activated after years of debate following the block size wars.
The post Bitcoin’s Future Is Now a Four-Way Ideological Battle, According to Michael Saylor appeared first on CryptoPotato.
The team behind the controversial crypto project rolled out a major upgrade intended to strengthen the entire ecosystem.
Nonetheless, the positive news failed to trigger a rebound for PI, whose valuation nosedived to yet another all-time low.
Upgrade Completed
Pi Network has made significant progress in recent months. In February, the Core Team unveiled protocol version 19.6, followed by an upgrade to v19.9. Later on, they introduced the highly anticipated v20.2, which set the foundation for smart contract capabilities.
Last month, the team announced a migration to protocols v22 and v23, setting June 2 as the deadline to complete the transition to v24. This development was disclosed on Pi Network’s official X account earlier today (June 5).
“Great job to all Nodes! This was one of the most challenging migrations,” the message reads.
The upgrade to protocol 24 is primarily focused on enhancing the underlying infrastructure that supports node operations and mainnet activity. The Core Team revealed that migration to v25 is next in line, with June 18 designated as the completion deadline.
In addition to the protocol update, Pi Network has recently advanced further in the gaming field. As CryptoPotato reported, CiDi Games (a Pi Network Ventures portfolio company) released four new games for Pioneers. Those include Coin Whack, Fruit Stack, Gemnova, and RainbowCubes.
PI Price Outlook
Despite the aforementioned developments, PI’s valuation remains heavily suppressed by the bear market and the latest pullback, which swept through the entire crypto market.
Earlier this week, it collapsed to a new all-time low of around $0.12, representing a 33% decline for the month and a whopping 96% crash from the historic peak of $3 witnessed at the start of 2025. PI’s market capitalization has fallen to roughly $1.3 billion, making it the 58th-largest cryptocurrency.
Certain factors signal that a further correction could be on the way. Data show that the number of PI coins stored on exchanges has soared by over 500,000 in the past 24 hours, bringing the total to over 550 million. This suggests that numerous investors have transferred their holdings to centralized platforms, thus increasing immediate selling pressure.
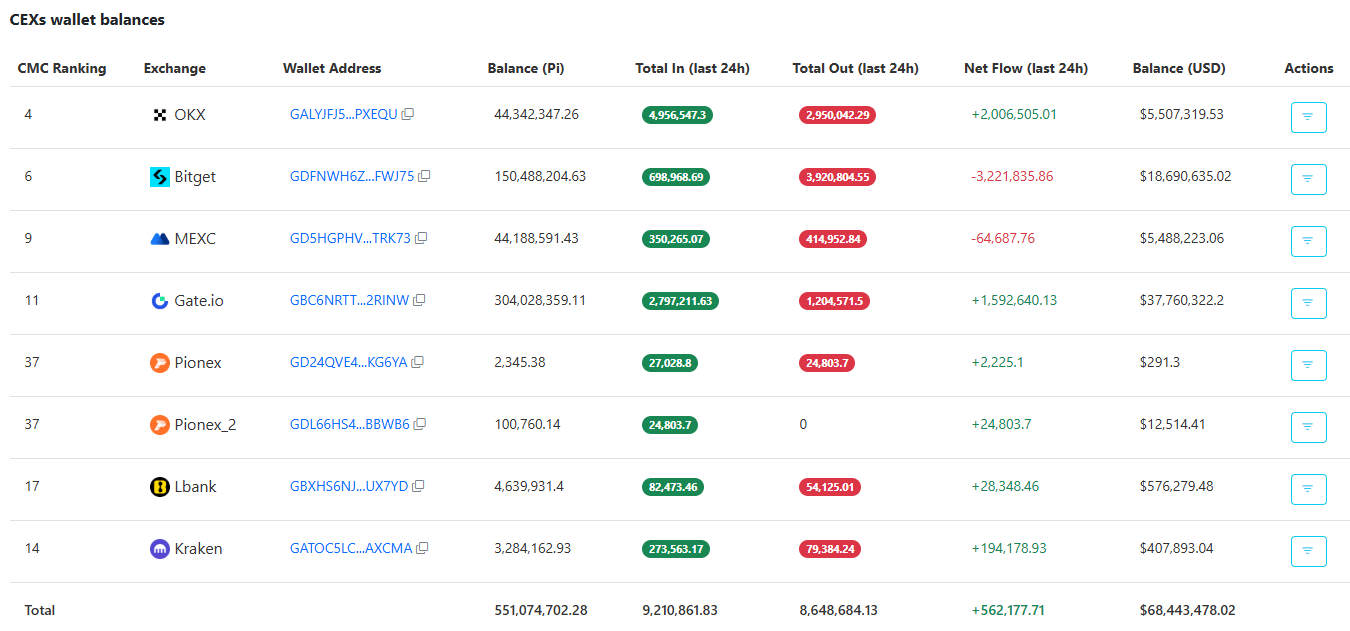
The upcoming token unlocks are next on the list, with approximately 160 million PI set to enter circulation over the next 30 days. June 11 stands out as the record day when 16 million coins will be released. This development doesn’t guarantee a steeper downfall, but it will allow some investors to cash out tokens they have been holding for a long time.
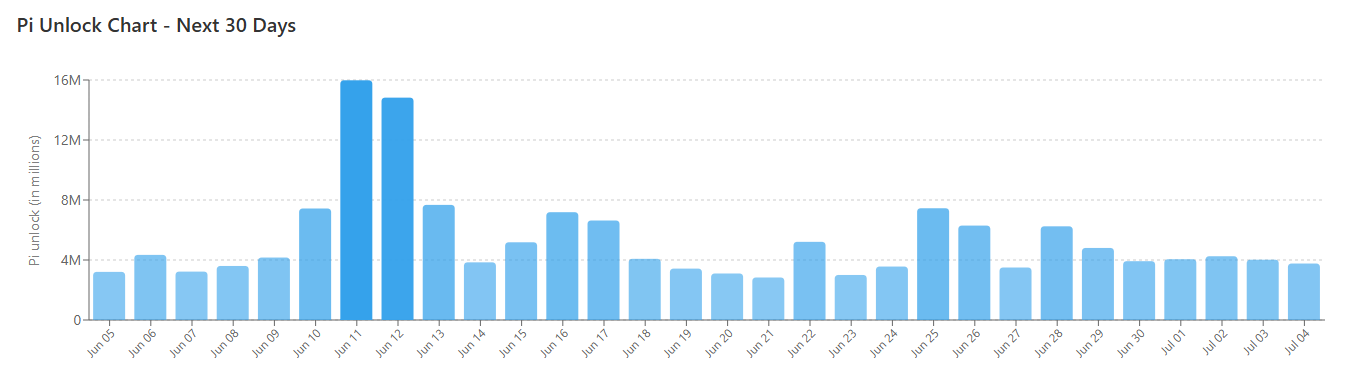
The post Pi Network Completes a Major Milestone, Yet PI’s Price Keeps Bleeding: Details appeared first on CryptoPotato.
The cryptocurrency market continues to suffer.
Over the past 24 hours, Bitcoin’s price has fallen by a considerable 5.5%. More notably, it dipped below the coveted $60,000 level for the first time since October 2024.

As CryptoPotato reported earlier, the move reflects a broader market downturn where altcoins are suffering equally, if not worse than Bitcoin.
This has resulted in a whopping $1.5 billion worth of liquidated derivatives positions throughout the past 24 hours, as the downturn doesn’t appear to ease.
BTC’s price has bounced slightly after dropping to $59,743 and it’s interesting to see if this level will be able to halt further downside.
Moreover, the most recent crash comes as the US jobs report was posted a few hours ago. According to it, the US economy has managed to add 172,000 jobs in May, which exceeded expectations of 85,000.
The unemployment rate was 4.3%, which is in line with expectations, making this the second-strongest US jobs report in the past 13 months.
Despite the news, the S&P 500 tumbled 1.7% on the day, which suggests that the risk-on trade is growing colder, at least for now. This is further confirmed by declines in the NYSE Composite, Nasdaq Composite, as well as the Dow Jones Industrial Average.
In other words, the drop is not isolated to crypto, but the fact is that it has been far more pronouneced.
The post Bitcoin’s Price Drops Below $60K for the First Time Since October 2024 appeared first on CryptoPotato.