Cryptocurrency Posts
Crypto Briefing
Canada's AI strategy could significantly transform its economy by boosting AI adoption, creating jobs, and enhancing domestic tech capabilities.
The post Canada launches national AI strategy, offers funding and resources for innovation appeared first on Crypto Briefing.
The semiconductor sector's volatility highlights the fragility of market confidence, impacting investment strategies and sector stability.
The post Micron Technology faces market-cap wipeout as Broadcom pressures chip stocks appeared first on Crypto Briefing.
SpaceX's exclusion of Chinese investors highlights escalating US-China tensions, impacting global investment dynamics and tech sector collaborations.
The post SpaceX bars Hong Kong and China investors from $75B IPO over arms export rules appeared first on Crypto Briefing.
The Cross-Chain API could significantly enhance DeFi's accessibility and efficiency, but its success hinges on robust bridge security.
The post 0x Project launches Cross-Chain API for seamless payment flows across 25+ blockchains appeared first on Crypto Briefing.
Israel's troop deployment may escalate regional tensions, complicating peace prospects and impacting diplomatic and economic stability.
The post Israel deploys troops to Azerbaijan, UAE, Iraq, Somaliland amid Iran conflict appeared first on Crypto Briefing.
Bitcoin Magazine
Bitcoin Magazine

Bitcoin’s Pullback Tests Institutional Adoption Narrative as Pompliano Stays Bullish
Bitcoin’s recent price decline is testing one of the asset’s most prominent bullish narratives: that institutional adoption will stabilize volatility and support long-term growth.
Despite the downturn, ProCap Financial CEO Anthony Pompliano thinks that the broader trajectory remains intact, framing the current weakness as a natural phase in Bitcoin’s maturation into a mainstream financial asset.
Speaking on CNBC’s “Power Lunch,” Pompliano said Bitcoin’s integration into traditional finance is accelerating, pointing to growing interest from major institutions such as BlackRock CEO Larry Fink.
According to Pompliano, this shift represents the realization of a long-anticipated transition from a niche, ideologically driven asset to a widely held portfolio allocation.
“Bitcoin is maturing into a traditional finance asset,” Pompliano said, adding that institutional demand signals “what mass adoption looks like.”
Bitcoin has come under pressure in recent weeks, with prices retreating amid broader risk-off sentiment and capital rotation into equities, particularly in high-growth sectors like artificial intelligence and newly listed public companies.
The downturn has revived concerns that Bitcoin’s adoption cycle may be nearing saturation, limiting its ability to deliver the outsized returns seen in prior cycles.
Some argue that Bitcoin’s earlier growth was driven largely by rapid user adoption and speculative inflows — dynamics that may be harder to replicate now that the asset has reached a more mature phase.
As the CNBC host noted, the “adoption story” may have already peaked.
At the same time, some market participants, including Strategy’s Michael Saylor, have suggested capital could be rotating out of crypto into other high-momentum opportunities, including upcoming IPOs and AI-linked investments.
Pompliano: Rotation from bitcoin is natural, not structural
Speaking with CNBC, Pompliano pushed back on the idea that capital outflows signal structural weakness. Instead, he characterized the movement as typical portfolio rebalancing behavior.
“Capital chases momentum and returns,” he said, noting that Bitcoin’s liquidity makes it a convenient source of funds when investors pursue new opportunities.
The current market environment highlights a tension in Bitcoin’s evolution. While institutional adoption has broadened its investor base, it has also tied Bitcoin more closely to macroeconomic trends and cross-asset flows.
As a result, Bitcoin increasingly behaves like a risk asset during periods of market stress, declining alongside equities rather than acting as an uncorrelated hedge. This dynamic has complicated the narrative of Bitcoin as “digital gold,” particularly in the short term.
Still, Pompliano maintains that Bitcoin’s core fundamentals remain unchanged. He pointed to the network’s continued operation, decentralization, and predictable issuance schedule as evidence that the asset’s long-term value proposition is intact.
“Show me what has changed,” he said. “The network continues to do everything it is designed to do.”
Bitcoin as a ‘Savings Technology’
Pompliano reiterated his long-held view of Bitcoin as a hedge against fiat currency debasement, arguing that persistent government spending and monetary expansion underpin its long-term case.
He described Bitcoin as a “savings technology,” highlighting its historical compound annual growth rates — approximately 60% over the past decade and over 30% in the last three years — as evidence of its ability to preserve and grow capital over time.
In his view, Bitcoin’s role is less about short-term speculation and more about long-term wealth protection, akin to gold or real estate for previous generations.
This post Bitcoin’s Pullback Tests Institutional Adoption Narrative as Pompliano Stays Bullish first appeared on Bitcoin Magazine and is written by Micah Zimmerman.
Bitcoin Magazine

Bitcoin Price Plunges Below ‘Fire Sale’ Territory as Fear Index Reads 12 — Echoing the FTX Crash
Bitcoin price dropped to levels on Thursday that placed it below the “Fire Sale!” band on the Bitcoin Rainbow Chart — a depth not reached since the catastrophic FTX exchange collapse in November 2022 — as the Fear and Greed Index registered a reading of 12 out of 100, deep in “Extreme Fear” territory.
Bitcoin price opened today near $63,500 after sliding below $62,000 last night. That puts BTC below even the most discounted valuation band on the Bitcoin Rainbow Chart — a level the model historically flags as a rare and extreme buying signal.
The Bitcoin Rainbow Chart is somewhat of a logarithmic growth curve overlaid with color-coded sentiment bands. The deepest band — labeled “Basically a Fire Sale!” — represents the lowest tier of the model’s projected fair value range. When Bitcoin trades beneath it, the asset sits outside the historical channel that has contained BTC’s long-term price behavior.
JUST IN: Bitcoin is now below the "Fire Sale" territory for the second time in 4 years
— Bitcoin Magazine (@BitcoinMagazine) June 4, 2026
Buy the dippic.twitter.com/oU6qudhn6M
The last confirmed breach of the “Fire Sale!” floor occurred during the FTX exchange collapse in November 2022, when Sam Bankman-Fried’s crypto empire imploded and BTC cratered under forced selling pressure across the market. That event remains one of the most severe liquidity crises in crypto history.
Per Bitcoin Magazine Pro data from March 2026, Bitcoin price had already begun testing below the “Fire Sale!” zone — described at the time as “its first drop into this area since the FTX-induced crash”.
The renewed descent on June 4 deepens that breach, with the coin shedding ground for the second consecutive week.
Bitcoin price and market in ‘Extreme Fear’
The Fear and Greed Index, which runs on a scale of 0 to 100, registered 12 on Thursday — placing the market squarely in “Extreme Fear”. The index aggregates volatility, market momentum, social sentiment, and derivatives data into a single score.
A reading below 25 signals extreme fear, a condition that, by the index’s own framework, has historically preceded price recovery periods.
February 2026 saw the index touch an all-time low of 5, driven by a 52% drawdown from Bitcoin price’s peak of $126,000. Thursday’s reading of 12 sits just above that nadir, as Bitcoin price continues its slide from cycle highs.
On X today, Strategy’s Michael Saylor argued the sell-off reflects institutional capital rotating into AI infrastructure rather than a deterioration in Bitcoin’s fundamentals. The decline may have been compounded by concerns over Strategy selling 32 BTC to fund preferred-share dividends — its first bitcoin sale since 2022 — despite the company recently reducing debt by repurchasing $1.5 billion of convertible notes at a discount.
This post Bitcoin Price Plunges Below ‘Fire Sale’ Territory as Fear Index Reads 12 — Echoing the FTX Crash first appeared on Bitcoin Magazine and is written by Micah Zimmerman.
Bitcoin Magazine

Schwab Strategist: Bitcoin’s $60,000 Mining Cost Could Mark the Cycle Bottom
Bitcoin is in a bear market. That much is not in dispute.
What Jim Ferraioli, Director of Digital Currencies Research and Strategy at Charles Schwab, argued Wednesday on Bloomberg is more precise and more structural: this selloff has a measurable cost floor, and that floor is built not from sentiment or chart patterns, but from the physics of energy consumption.
The numbers frame the drawdown in context. Bitcoin peaked at $126,000 in the fall before collapsing to roughly $60,000 in February — a 50% correction that, while brutal for recent buyers, falls far short of the 75%-plus implosions that defined prior Bitcoin bear markets.
Ferraioli’s core analytical framework centers on one question: what does it cost to manufacture Bitcoin? The answer creates a natural gravitational floor that has held across multiple cycles.
For the most efficient miners — those operating at scale with next-generation ASIC hardware and access to the cheapest wholesale energy — the cost to produce one Bitcoin sits at approximately $60,000, Ferraioli said.
That figure is not arbitrary. It represents the all-in expense of powering a facility at roughly $0.07 per kilowatt-hour with the most advanced semiconductor fleets available.
The less efficient miners — those with older ASIC hardware, higher energy costs, and thinner operational margins — carry a production cost of approximately $95,000 per BTC, according to Glassnode data cited in Schwab’s May 2026 research report. That gap between $60,000 and $95,000 defines Bitcoin’s current valuation range.
Bitcoin’s energy floor: Why $60,000 may mark the bottom
Ferraioli argues that in deep bear markets, the cost of production for the best miners has historically served as the bottom. February’s low near $60,000 aligns almost precisely with that level, as well as BTC’s 200-week moving average.
The BTC selling pressure is not random. It is demographically specific. The investors driving forced liquidations are those who acquired Bitcoin during the past 18 months — buyers who rode the asset from sub-$80,000 up to $126,000 and then watched gains evaporate in full.
Schwab tracks two cost-basis metrics to quantify this pressure: the average acquisition cost for U.S. spot ETF and ETP holders, which stands near $83,000, and the active investor cost basis — excluding coins rewarded to miners — which sits near $78,000.
Both figures sit well above current spot prices, putting the majority of recent entrants into unrealized loss positions and reinforcing $83,000 as a ceiling of overhead supply rather than a floor of support.
Glassnode’s on-chain data corroborates this dynamic. Bitcoin’s latest attempted rally stalled at the aggregate ETF cost basis near $83,000, with total realized losses spiking to $1.35 billion per day and long-term holders capitulating from cycle-top positions. Hedge funds represent roughly 30% of spot ETP ownership but are operating market-neutral, executing basis trades rather than taking directional views — meaning they provide no natural bid when prices fall.
Here is where Ferraioli’s analysis turns constructive. Every major publicly traded Bitcoin miner has announced a pivot toward high-performance computing (HPC) for AI inference workloads. The economics on their face appear to favor abandoning mining: inference generates higher net revenue per megawatt-hour than Bitcoin mining during peak demand windows.
But demand for AI inference is not uniform across 24 hours. Models run hard during business hours and sit idle overnight and on weekends.
That creates a structural opportunity that does not displace BTC mining — it layers on top of it. Schwab’s analysis models Bitcoin as the optimal baseload monetization of power during off-peak hours, with inference overlaid during peak business-hour demand.
A data center operating this hybrid model maximizes utilization across the full 24-hour cycle rather than leaving capacity dark when inference demand falls away. For miners, this translates to more stable revenue, reduced forced BTC sales to cover operating costs, and lower structural risk across bear market cycles.
Bitcoin is backed by energy
The underlying thesis is one of energy economics. Bitcoin has no earnings, no free cash flow, and no CEO issuing guidance. Its value, in Ferraioli’s framework, derives from the energy cost required to produce it — a cost that is transparent, verifiable, and historically durable.
In commodity markets, price cannot sustainably trade below cost of production. Producers shut down, supply contracts, and equilibrium resets higher.
Bitcoin follows this same logic: when spot prices fall toward $60,000, the least efficient miners shut down operations, the network’s hash rate adjusts through Bitcoin’s difficulty mechanism, and the cost to produce each new coin falls.
As of May 2026, the average mining cost across all Bitcoin miners sits near $85,604, with the Bitcoin price trading in the mid-$60,000s — meaning the network as a whole is operating at a loss, a configuration that has historically preceded recoveries, not further collapse.
This post Schwab Strategist: Bitcoin’s $60,000 Mining Cost Could Mark the Cycle Bottom first appeared on Bitcoin Magazine and is written by Micah Zimmerman.
Bitcoin Magazine

Bitcoin Privacy in 2026: A Practical Guide
Bitcoin privacy has come a long way since the early days of Bitcoin. Once marketed as anonymous, Bitcoin can be best described as a pseudonymous currency and monetary system. It does not need user personal information whatsoever to function, but companies built around it often associate user public keys — Bitcoin accounts — with user information. They do this to comply with legacy financial regimes, and in some cases, for ease of use.
As a result, users might share or expose personal information to such companies as their home IP address, which can be used to identify the users’ internet service provider, and from there, the users’ physical address. As well as their personal name, phone number, shipping address, etc. All of this information in the wrong hands can put people at risk of physical and economic harm.
It is important to note that Bitcoin does not fundamentally have a privacy problem, as many critics suggest. The modern world has a privacy problem, which it has so far failed to address, leading to regular hacks of user data across every aspect of society, from the banking sector to social networks, from government agencies to the military. The digital society we increasingly inhabit is more often than not incapable of securing user data.
Bitcoin, unlike all other comparable institutions, does not need user data to function. It is actually one of the few financial tools available for the privacy-conscious individual. Cash is the other alternative, which limits the distance at which transactions can be made and brings with it a full bag of other downsides.
But, as a digital system, can Bitcoin actually be used privately, given how prominent KYCed exchanges are, and how data-hungry modern software companies have become? The answer to this question might surprise you.
Privacy from whom?
Depending on the jurisdiction you live in and the local laws or state of your country, some risks or threats are more pressing than others. Some countries throughout the world have at times imposed heavy capital controls on their citizens, often simply enforcing the cash grabs at the banking level. Bitcoin, if held in self-custody and with the right amount of privacy, can protect users from this threat.
In other cases, the nation state is stable enough, but organized crime has run amok, leading to targeted phishing schemes and even kidnappings, like in the case of France, where honest and hard-working individuals pay their crypto taxes, and as a result of local laws, enter the public record as having crypto. Leading to an alarming rise in related home invasions.
Last but not least, there are activists who might be operating under oppressive regimes, debanked and isolated from civil institutions, Bitcoin used in subtle ways can be their only monetary respite. Depending on the situation, some tools and tactics will be better for the job than others.
Privacy also does not mean that you can not be a law-abiding citizen. Strong privacy laws exist in many countries, meant to protect civilians from a variety of threats, while also enabling compliance with tax laws, for example. Privacy does not mean you have something to hide, as Joseph Goebbels, Hitler’s infamous chief of propaganda, once suggested. Instead, it is the ability to choose who you disclose your business to. It is a fundamental pillar of democracy.
Network Privacy
First things first, we have to protect your IP address, the ID your internet service provider gives your computer devices, including your mobile phone. The most popular way to deal with this is to get a VPN.
Not all VPNs are created equal; however, many are rumored to keep logs and sell your data. On this front, it’s important to do deeper research than the marketing and ask around from people who are paranoid enough to know better.
In the Bitcoin space, Mullvad VPN has a good reputation. They have been accepting Bitcoin for their services for a very long time, and are super easy to use. They are used alongside Tor and have an option to block all traffic that does not go through the VPN. One account can support multiple devices, including mobile.
Tor Browser, the infamous gateway into the dark web, is also an important tool to have handy. Many privacy tools we will discuss below support Tor connectivity, often having the required libraries built in, so you just have to push a button on the app to use the Tor network. The apps will be a little bit slower, as Tor does its anonymization magic, just FYI. Brave Browser also deserves a mention here, as it blocks most advertisement tracking and has built-in Tor support.
Getting Bitcoin Privately
The biggest challenge to Bitcoin privacy is actually how users accumulate it. Exchanges, broker-like private companies that facilitate the trade of bitcoin for fiat currency, have emerged as the most efficient and effective way to buy bitcoin. They have managed to survive hostile legal regimes, hacker groups and overzealous law-enforcement agencies by often over-complying with financial regulations that require them to collect massive amounts of personal user data.
Privacy-preserving alternatives to buy and sell bitcoin for fiat have, in turn, been harassed by government agencies regularly, often failing to survive or keep their market foothold against centralized alternatives. An excellent example of this dynamic was the first major peer to peer bitcoin to fiat exchange called LocalBitcoins, which shut down after 10 years of operation since at least 2013. The company faced increasing pressure from regulators in Finland, forced to implement KYC in 2019, and eventually shut down during the 2023 bear market and Operation Chokepoint 2.0.
LocalBitcoins connected buyers and sellers, serving as an escrow for Bitcoin, while the fiat went from the buyer to the seller’s bank account. LocalBitcoins, which pioneered the model, never touched the fiat and did not know the banking information of the seller. Such information would only move up the chain to the operators in the case of disputes. If both buyer and seller were happy with the fiat transfer, the BTC was released from escrow to the buyer.
This semi-decentralized exchange model, pioneered by LocalBitcoins, is generally called a P2P Bitcoin exchange, though many variations of it exist, with a wide range of privacy trade-offs, over the years.
Today, Bisq.network is perhaps one of the most renowned predecessors of LocalBitcoins. Taking a page from the centralized downfall of LocalBitcoins, Bisq attempted to create a Tor-anonymized, decentralized trading platform to allow buyers and sellers of bitcoin to connect all over the world. Bisq still operates today and has a variety of software tools available. Users can run Bisq on their local machines and control their account with their phones with Bisq Connect, or they can simply be notified of trade alerts via Bisq Notifications. There’s also a dedicated mobile app called Bisq Easy.
Volume for Bisq is estimated at almost 5 million dollars a month, which is low by centralized exchange standards, but good enough for civilian-grade dollar cost average purchases over time. It’s important to understand a couple of things when using Bisq. First, you should always pick a counterparty with a very high reputation. You should also pay attention to the commission they charge. It is normal for sellers to charge 5% above spot price or more, so look for the cheapest, highest-reputation option. The Bisq Easy app has a great user interface and teaches users new to P2P the basics quite well.
There’s a variety of other P2P exchanges and platforms in active use throughout the world. As a general rule, when doing P2P, it is best to keep purchases or trades small enough that you don’t take unnecessary risks. They should be significant enough to be worth your time, but any amounts above $10,000 is probably way too much. The Dollar cost average strategy, as a result, works very well with P2P stacking.
Another way to get Bitcoin with good privacy is to find your local Bitcoin community. Many major cities throughout the world have active Bitcoin communities. If there are none where you live, you might be surprised how many people show up if you start a Bitcoin meetup. From there, slow trust building with local bitcoiners might open up the opportunity to buy some BTC from them for cash. Many bitcoiners get paid in bitcoin for their work and often need to sell some to cover fiat expenses, creating an opportunity for P2P trades in real life.
Last but not least, offer your skills in exchange for Bitcoin, start a project or a Bitcoin dedicated brand. This will give you a great deal of control over how you handle information about your Bitcoin revenue.
Onchain Privacy
However, once you have some Bitcoin, there are a variety of things you can do to keep that information secure from prying eyes. Bitcoin, unlike any other money before it, functions as a public network, with its full transaction history auditable by anyone, though not tied to the holders’ personal information, but instead their public address or pseudonymous Bitcoin account number.
These public addresses live on the blockchain, and data firms can try to connect the dots about who is moving money where, especially when they collaborate with exchanges on data sharing or when other relevant information enters the public domain. Users can protect themselves from onchain analytics by using a variety of tools and tactics.
Run your own node
In order to minimize who you share information with about your addresses and balances, it becomes important for privacy reasons to run your own Bitcoin node, otherwise you are always fundamentally asking someone else running a node, what your balance is. All wallets that don’t explicitly run a Bitcoin full node on your machine have to run one on their servers, or redirect your requests to a public node someone might be hosting for charitable or not-so-charitable reasons.
While having network privacy, such as through the use of a VPN, can protect you from the risks of not running your own node, the next step in that self-sovereign, privacy setup is certainly taking control of the node you query, and thus becoming an active participant in the Bitcoin network.
Sparrow Wallet, an increasingly popular desktop wallet which has excellent support for privacy features, hardware wallets and advanced Bitcoin features like multi-signature accounts and Silent Payments, has great documentation on how to run and use your own node. Their conclusion is that Fulcrum, a wrapper on top of Bitcoin core that makes the blockchain data available to external wallets, is the way to go.
As a desktop wallet, Sparrow would work within your home network, letting you access the Bitcoin blockchain with strong privacy. If you wanted to connect to it from your phone or laptop from outside of your local network, you would need to run a Tor hidden service at home, a Tor tunnel of sorts, to access your node remotely in a secure and private way.
Boltz Exchange
Boltz is a Bitcoin-to-crypto, non-custodial exchange. It never touches fiat, and never holds custody of user funds. Users trade against Boltz using a technology under the hood called atomic swaps which means neither party has to trust the other during the trade, the crypto is moved essentially at the same time from the seller to the buyer and viceversa.
Boltz can be used without sharing any personal information and can be accessed through Tor, allowing Bitcoin users to leverage the benefits of other blockchains and payment networks if they so wish, with strong privacy.
One such network accessible via Boltz is the Liquid blockchain, a Bitcoin-denominated and collateralized federated ‘side chain’ with strong privacy features. Another example is the Lightning network, which has powerful potential privacy benefits as it is fundamentally off-chain, leaving a simple public record. Boltz can be used to convert Bitcoin to stablecoins as well on most major blockchains, letting bitcoiners access the broader crypto industry and its market integrations through a high privacy bridge.
Boltz can be used on their website or by downloading a standalone open source web app. A CLI is also available for advanced users, and since the whole stack is open source, users can even self-host the Boltz suite themselves for their business. Boltz, as a result, removes the need for centralized exchanges to move across blockchain rails, eliminating the corresponding privacy risk.
The Liquid Network
The Liquid Network, a federated blockchain created by Blockstream, is slowly becoming an important infrastructure to the Bitcoin industry. Launched in 2018, the chain is a modified fork of Bitcoin with its native asset LBTC, pegged to Bitcoin directly. To mint LBTC, you have to deposit BTC into the federation’s multisig, and to get your BTC out, you can depeg or sell your LBTC for BTC on a variety of atomic swap exchanges. While its consensus structure is different than Bitcoin’s and fundamentally permissioned, it rests on the shoulders of a double-digit group of industry-leading companies throughout the world, and has remained quite stable since it went live.
One of the interesting things about it is its privacy features; transactions on Liquid have their amounts and asset type encrypted by default. Addresses can be seen to move assets from A to B on-chain, but which asset and how much of it is encrypted, only for the involved parties to see. It uses a cryptographic technique called Confidential Transactions, pioneered by Bitcoin wizards like Adam Back, Andrew Poelstra, Mark Friedenbach, Gregory Maxwell, and Pieter Wuille. Liquid is also quite cheap to use, and has faster block times than Bitcoin, making it an interesting tool in the Bitcoin privacy tool belt, specifically with privacy bridges like Boltz exchange.
Blockstream has a mobile wallet that is quite powerful and easy to use, which supports the liquid network.
Silent Payments
Silent Payments are a novel kind of Bitcoin address that reframes the way auditing of balances happens on Bitcoin. The whole point of being able to see addresses and how much BTC is in them on the blockchain is so that users can easily verify the total supply and thus the economic integrity of the Bitcoin monetary network.
Silent payments (SP) let users receive Bitcoin in such a way that the link between the SP address and the corresponding Bitcoin public address is publicly severed. The technology is quite powerful and has a long history of development in the Bitcoin industry, gaining growing adoption in recent years.
Of the few wallets that can receive Silent Payments so far, Sparrow wallet is likely the best across the board, supporting a full range of privacy features, including connection to the user’s own node. Silent Payment addresses can be reused, so users can generate one and take it on the go, then check their balances on their desktop or laptop using Sparrow. For extra privacy, users can run a Frigate server alongside Sparrow, which deals with the Silent Payments magic in a self-hosted way.
Payjoin
Another notable technology that works quite well with the rest is Payjoin. With a dedicated foundation and wallet support growing every day, this simple transaction-building technique breaks the heuristics used by blockchain analytics to identify individual users and their flows across the chain. Sparrow wallet, alongside many others, supports Payjoin, as it continues to grow into what may become the HTTPS of Bitcoin payments.
Coinjoin
Once the bread and butter of Bitcoin privacy, Coinjoins wallets like Wasabi let you mix your Bitcoin with other people’s in a non-custodial way. The technique has significant upsides when done well, and is still used by many to this day, though it also comes with some tricky downsides. Gustavo, an entrepreneur and writer for Bitcoin Optech, says that “Wasabi works better than ever IMO, and is by far the most liquid and effective bitcoin privacy solution.” Liquidity equates to more privacy when it comes to Coinjoins. “Kruw.io is the dominating coordinator: it has over 97% of the market’s liquidity.” with “30,000 btc volume per month, about 4000 btc of fresh btc inputs.”
Coinjoins became so effective and popular that they led to the landmark Samourai Wallet case, which had its own implementation of the technology, an ongoing cultural fight for the right to privacy.
Gustavo also listed some of the downsides involved with Coinjoins that users should consider, such as the risk that a centralized exchange might be able to tell your bitcoins were moved through a coinjoin, which looks like a big cloud of transactions on-chain. And that there is some known risk of data leaks on the side of the coordinator, a server someone has to run to help users atomically mix coins with each other. However, he believes the technology only continues to improve and patch those holes, saying that “the attack surface has decreased since the last discussion in 2024.”
The Lightning and eCash Networks
Last but not least are the eCash and the Lightning Network. Fundamentally off-chain bitcoin native transaction protocols, they have a key benefit over all the onchain privacy solutions, that they do not leave a footprint on the public blockchain. As a result, privacy is theoretically far easier to achieve. In practice, however, there’s still a lot of work to do, since the most private ways to use the Lightning network are the most difficult from a user experience perspective, requiring the user to run their own Lightning node and manage their own liquidity.
While there are many easy-to-use lightning wallets in the market, most, if not all, require a certain level of data sharing trust with the servers of the wallet company. Something that network privacy can help alleviate.
Ecash is also emerging as a strong privacy technology, though it still falls short on adoption in the West. Wallets like Fedi and Cashu are on the cutting edge, letting users transact with unprecedented privacy in Bitcoin terms, though at the cost of trusting custodial mints, which collateralize the ecash tokens with Bitcoin.
Conclusion
Overall, the tools of Bitcoin privacy continue to improve as the industry’s passion for the topic has not waned. Some are easier to leverage than others. But, as Satoshi Nakamoto has demonstrated, those who take their privacy seriously are the only ones who are able to keep it.
This post Bitcoin Privacy in 2026: A Practical Guide first appeared on Bitcoin Magazine and is written by Juan Galt.
Bitcoin Magazine

Michael Saylor Calls Bitcoin’s Drop a ‘Capital Rotation’ to AI as BTC Slides Below $62,000
Bitcoin fell to as low as $61,400 overnight before trimming losses to $62,400 in premarket hours Thursday, down 7% over the past 24 hours and more than 14% over the past week. Strategy and Michael Saylor’s MSTR is down nearly 15% in 5 trading days.
The drop has pushed bitcoin into a technical bear market, with bitcoin now off 22.7% from its four-week high, wiping out more than $600 billion in total crypto market value.
At the center of the debate is Strategy Executive Chairman Michael Saylor, who took to X on Thursday morning to offer his read on the selloff.
“Capital markets are funding the AI buildout at historic scale: ~$400B over 6 months,” Saylor wrote. “Bitcoin ETFs have seen ~$4B of outflows since May 14, pressuring BTC. This is a capital rotation, not a Bitcoin impairment. Volatility creates opportunity.”
Saylor’s thesis holds that institutions are pulling money from bitcoin and redirecting it into artificial intelligence infrastructure — a trade, not a verdict on the asset. The AI spending figures give his argument weight. Wall Street consensus puts combined hyperscaler capital expenditures above $600 billion for 2026 alone, with CreditSights estimating roughly $450 billion of that flowing into AI hardware, servers, and networking gear.
Saylor sells some bitcoin
But Saylor’s words arrived with a footnote that bears found hard to ignore. Strategy, the largest corporate bitcoin holder in the world with 843,706 BTC, disclosed in a June 1 Form 8-K that it sold 32 bitcoin between May 26 and May 31 at an average price of $77,135 per coin, raising $2.5 million net of expenses. The stated purpose: to fund dividend payments on the company’s STRC preferred shares.
In dollar terms, the sale is a rounding error against a position worth roughly $61 billion. In psychological terms, the market treated it as a break in character.
Strategy had not sold a single bitcoin since late 2022, and Saylor’s identity as an unwavering bitcoin accumulator had become a market signal in its own right. Analysts said the move deepened bearish sentiment and accelerated the price decline.
Two weeks ago and one week before the sale, Strategy shifted its focus from buying bitcoin to strengthening its balance sheet, repurchasing $1.5 billion of its 0% convertible notes due 2029 for approximately $1.38 billion in cash—an 8% discount that reduced its debt obligations by roughly $120 million.
The move lowered the company’s outstanding convertible debt from $8.2 billion to $6.7 billion while leaving it with an $871 million cash reserve. At the time, Strategy held 843,738 BTC at the time and said it planned to rebuild its liquidity buffer through future capital raises.
This post Michael Saylor Calls Bitcoin’s Drop a ‘Capital Rotation’ to AI as BTC Slides Below $62,000 first appeared on Bitcoin Magazine and is written by Micah Zimmerman.
CryptoSlate
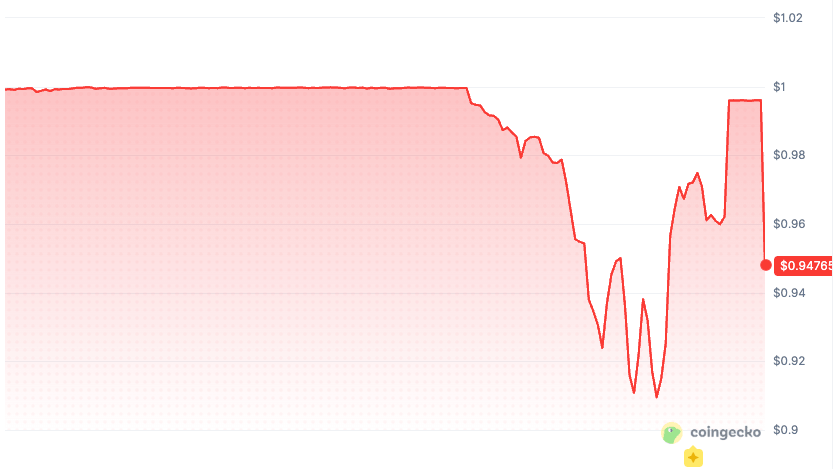
Apyx's apxUSD fell below its dollar reference on June 4 as Bitcoin traded near $63,000, putting DeFi dollar peg risk back in focus.
A Bitget report said the token briefly touched $0.93 during the selloff. The report framed Apyx's response as a design point: apxUSD's reserve risk is largely borne by Strategy's STRC preferred stock, with cash serving as part of a broader buffer.
Data at the time showed an even wider 24-hour range, from $0.9094 to $0.9984, with apxUSD trading around $0.9176 and volume rising to roughly $74.6 million.
The mechanics put apxUSD in a different category than a normal stablecoin peg scare. Bitcoin was down 5.77% over 24 hours, and the pressure showing up in apxUSD also reflected a public-market preferred share becoming part of DeFi's dollar collateral stack.
A dollar token built on preferred equity
Apyx describes apxUSD as a synthetic dollar backed by a basket of preferred shares issued by Digital Asset Treasury companies.
The same documentation says apxUSD is intended for use as collateral and as a quote asset across DeFi and CeFi, while the yield generated by the collateral stack is routed to apyUSD, the protocol's savings asset.
The key collateral link is STRC, Strategy's Variable Rate Series A Perpetual Stretch Preferred Stock. Apyx's peg stability model says apxUSD currently primarily uses STRC as its core collateral asset.
STRC is structured around a $100 stated amount, but the price-stability tool is economic. It is built around Strategy's ability to adjust dividends and encourage trading near the reference value.
A dollar token built on preferred-share collateral can look strange through a USDC lens and more coherent through a credit lens.
Apyx says apxUSD adds overcollateralization, a cash and Treasury buffer, cross-market arbitrage, and possible hedging strategies. The protocol also says in its own risk section that apxUSD may trade above or below a $1 reference value.
That disclosure turns the June 4 move into a cleaner market-structure event. The sharper question is whether DeFi users are pricing a dollar-like asset correctly when its collateral can behave like public preferred equity under stress.
Circle's reserve model for USDC is built around a different promise. Circle says USDC is redeemable 1:1 for dollars and backed by highly liquid cash and cash-equivalent assets.
Most USDC reserves are held in the Circle Reserve Fund, which can contain cash, short-dated US Treasuries, and overnight Treasury repurchase agreements.
apxUSD's design points somewhere else. Apyx's collateral allocation page states that backing can be dynamically allocated across DAT preferred shares, with cash and short-term Treasuries serving as a liquidity buffer.
Kraken's listing note for apxUSD also describes the asset as backed by variable-rate DAT preferred shares. It says minting and redemption are restricted to authorized institutional participants, with redemptions settled in USDC while the underlying preferred equity remains outside the redemption flow.
That access model becomes important during volatility. An authorized participant may have a primary pathway through the protocol. A normal holder generally faces the market in front of them, whether that means a DEX pool, a centralized exchange order book, or another DeFi route.
Apyx's FAQ also flags liquidity risk directly, noting that users who acquire apxUSD via DEX swaps may experience slippage when liquidity is low. It also says apyUSD exits follow an asynchronous model with an approximately 30-day cooldown.
The result is a stablecoin-like instrument whose dollar behavior depends on more than the issuer's stated reference price. It depends on STRC's market price, apxUSD/USDC liquidity depth, whitelisted arbitrage, the reserve buffer, and whether DeFi users are trying to exit the same route at the same time.
Strategy's preferred stack is now DeFi collateral risk
STRC is more than a ticker in the background. Strategy's own STRC page describes it as perpetual preferred stock paying an annual dividend rate of 11.50% in cash, with the rate adjusted monthly to encourage trading around the $100 par value.

The same page also warns that returns, liquidity, future performance, and cash dividends are not guaranteed. It says the preferred securities lack collateral claims on Strategy's Bitcoin holdings.
Strategy's latest filing added another layer to the market's read on that structure. In a June 1 Form 8-K, the company disclosed that it sold 32 BTC between May 26 and May 31 for about $2.5 million, with proceeds expected to fund distributions on preferred stock.
The filing also said Strategy held 843,706 BTC as of May 31 and maintained the STRC dividend rate at 11.50% for monthly periods beginning June 1.
That filing is channel context for a market now connecting Strategy's preferred dividends, Bitcoin treasury liquidity, STRC's par-seeking design, and DeFi collateral products.
CryptoSlate has already covered how Strategy's preferred stack has become part of its broader funding machine, including the risk around selling BTC to fund preferred payouts and why STRC has become a key funding gauge.
apxUSD extends that issue into DeFi. The preferred share has moved beyond a capital-markets instrument held in brokerage accounts. It is also part of an onchain dollar product that traders may use as liquidity, collateral, and yield infrastructure.
The June 4 move exposed that bridge. DAT preferred shares are being marketed as lower-volatility, income-paying instruments tied to companies that hold crypto, and Apyx is turning that public-market yield into programmable stablecoin infrastructure.
DeFi can capture headline yield, but it can also capture credit, liquidity, confidence, and exit-route risk.
The DeFi footprint is already large enough to matter
The apxUSD selloff reached a token with meaningful market plumbing. DefiLlama's RWA dashboard showed active apxUSD DeFi exposure concentrated in Pendle and Curve, with Pendle at $118.22 million and 64.62% of listed active TVL, and Curve at $44.63 million and 24.39% of listed active TVL.

Morpho Blue was much smaller at about $751,647, yet its presence is relevant because lending markets can turn price moves into collateral questions.
CoinGecko also showed the Curve apxUSD/USDC pair as the most active market, with about $48.5 million of 24-hour volume. That is the venue-level reality behind the phrase “stable collateral.”
If a token is used as a quote asset, a liquidity-pool asset, or a yield-trading input, a move toward 93 cents reaches beyond the chart. It changes slippage, pool balances, fixed-yield assumptions, and the risk calculation for anyone treating the token like cash.
The point travels beyond apxUSD. DAT preferred shares are being marketed as lower-volatility, income-paying instruments tied to companies that hold crypto. Apyx is turning that public-market yield into programmable stablecoin infrastructure.
The June 4 move showed that the bridge cuts both ways: DeFi can import the yield, but it can also import the credit, liquidity, and confidence risk.
The next test is straightforward. If STRC returns toward par, apxUSD liquidity holds, and the token moves back toward its reference value, the episode will look like a live stress test of a design that Apyx already said allows price variability.
If STRC stays discounted, the reserve dashboard shows less cushion than users assumed, or DeFi venues report liquidations or emergency parameter changes, the market may start treating apxUSD less like a standard stablecoin and more like a credit-linked collateral token.
The key signals are now visible: STRC's price versus par, Apyx's current reserve mix, apxUSD/USDC liquidity depth, Pendle and Curve exposure, Morpho collateral behavior, and Strategy's next dividend-rate decision.
Putting Wall Street preferred equity into DeFi leaves it with a market price. That market price is now part of the collateral risk.
The post A stablecoin tied to Strategy stock depegs putting a new DeFi dollar risk in focus as Bitcoin sells off appeared first on CryptoSlate.
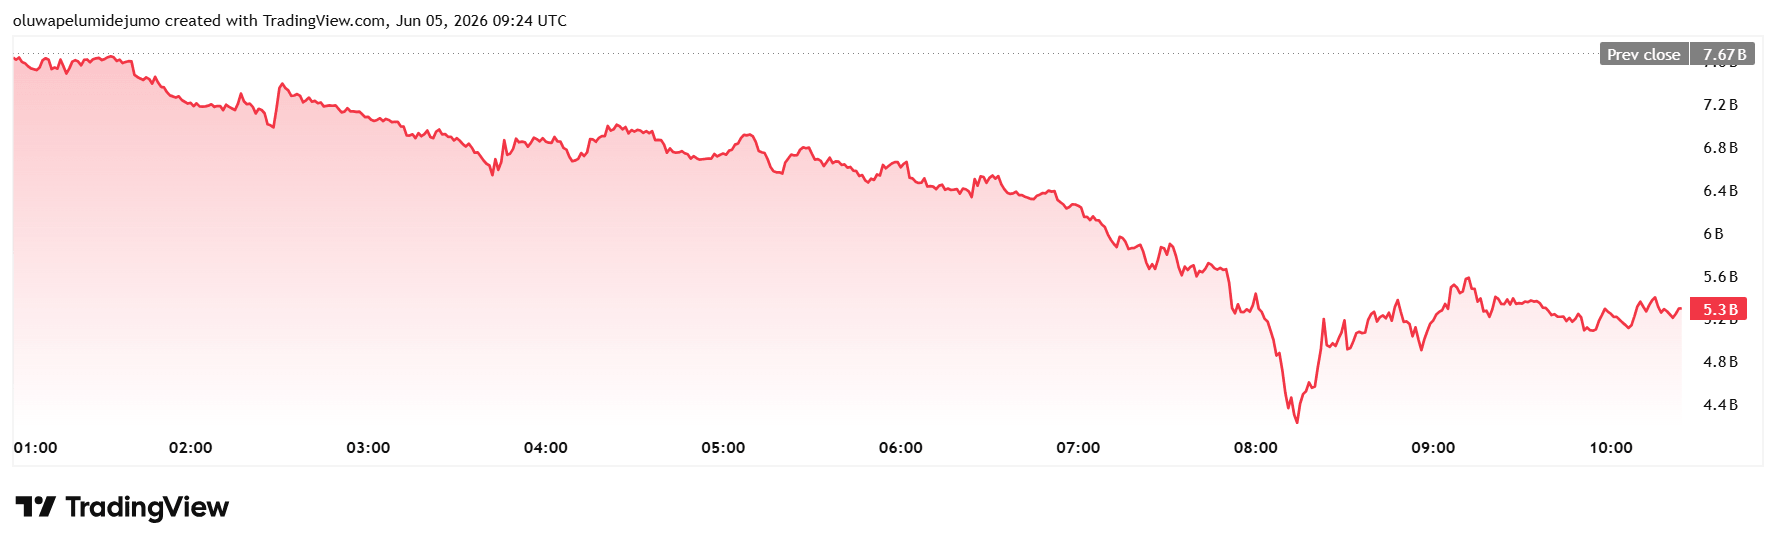
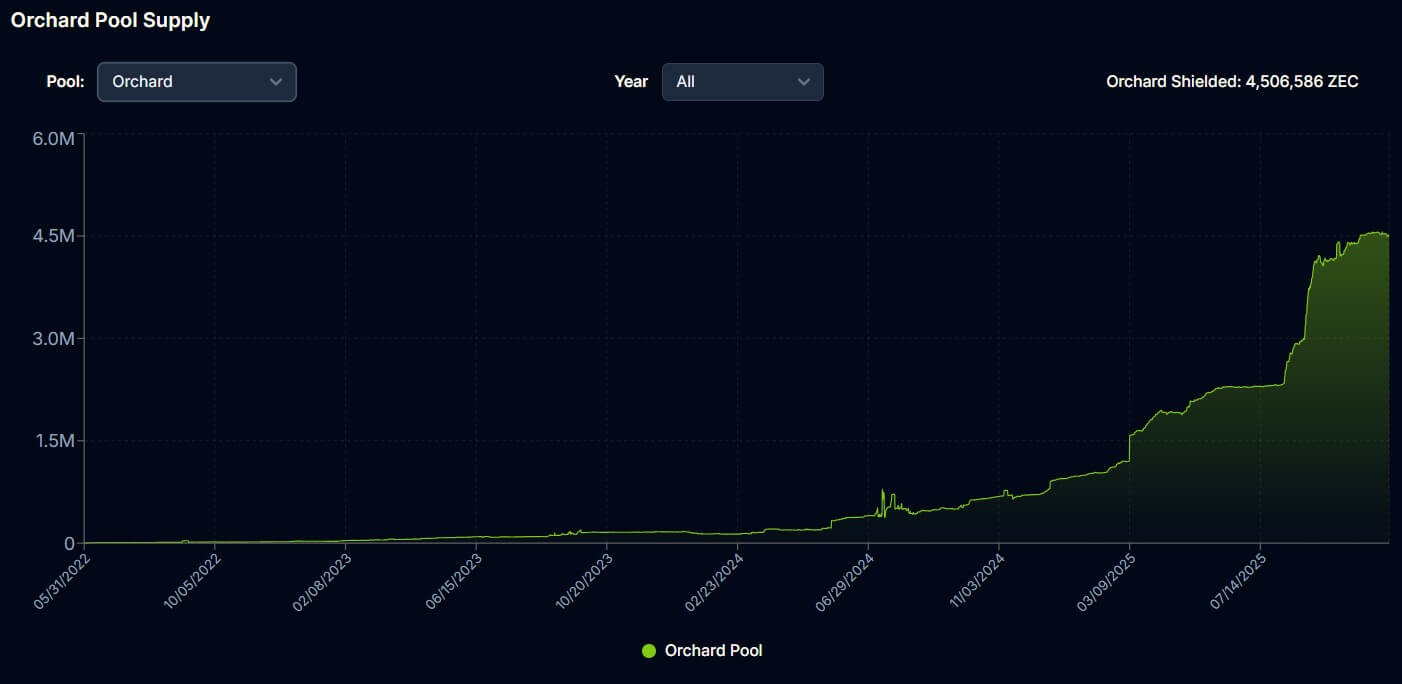
Zcash lost more than $5 billion in market value after its developers, using Anthropic's Claude AI, discovered a long-running flaw in one of its privacy systems that could have enabled counterfeit tokens to be created without easy detection.
In response to this disclosure, data from CryptoSlate showed that ZEC fell more than 50% to as low as $255 before recovering to about $321 as of press time. This represents a sharp reversal for an asset that had climbed more than 1,000% over the past year as traders revived a broader bet on financial privacy.
The price decline caused the privacy-focused token’s market capitalization to fall from about $ 10 billion to roughly $ 4.5 billion during the reporting period. It has climbed to $5.3 billion as of press time.
Still, Zcash developers maintain that the vulnerability was found before attackers could use it, patched within days, and resolved through an emergency network upgrade.
However, the disclosure struck at a more difficult question for Zcash investors: how much assurance markets require when the affected system is built to conceal transaction amounts and wallet histories by design.
A private-money rally breaks on a public disclosure
Zcash was launched in 2016 as one of the earliest attempts to build private digital money. Unlike Bitcoin, whose ledger allows anyone to trace balances and transactions,
Zcash lets users move funds through shielded addresses that obscure amounts, senders, and recipients. This design has given the token renewed relevance as governments, exchanges, and analytics firms have expanded their ability to monitor public blockchains.
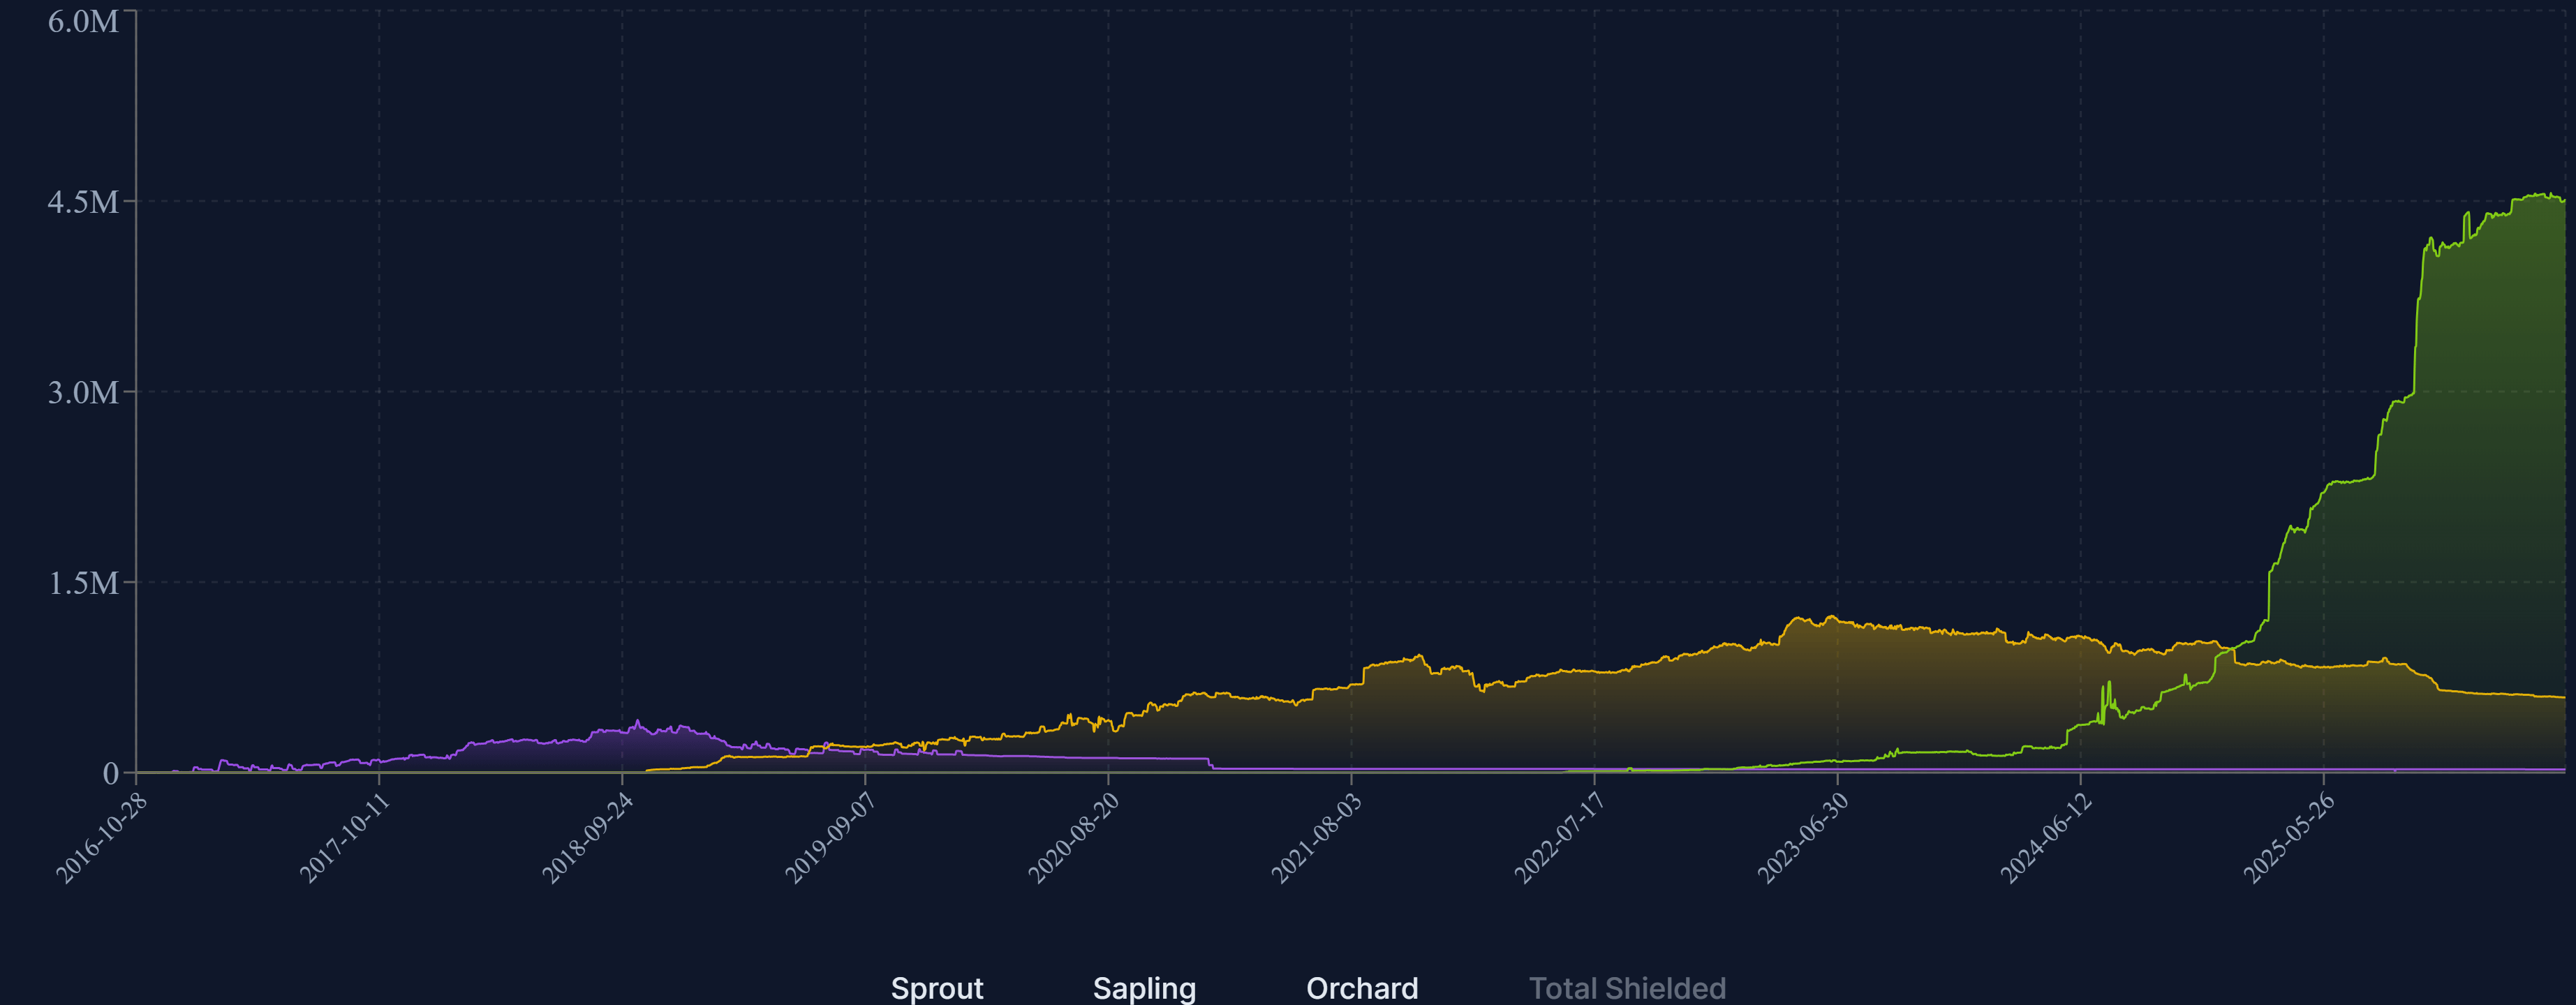
Data from Zechub shows that roughly 30% of circulating ZEC, equivalent to more than 5 million coins, now sits in shielded addresses.
The recent rally reflected that shift. Traders had treated ZEC as one of the clearest vehicles for a privacy trade, helped by rising anxiety over surveillance, artificial intelligence, and state access to financial data.
However, that momentum abruptly reversed after Shielded Labs published a detailed disclosure about a vulnerability in Orchard, Zcash’s most advanced shielded pool.

Shielded Labs said the flaw was discovered May 29 by Taylor Hornby, a security engineer it engaged in April to search for protocol vulnerabilities before malicious actors could find them.
Hornby used Anthropic’s Opus 4.8 artificial intelligence model while conducting a targeted review of Orchard’s cryptographic circuit.
The review found a bug that could have allowed an attacker to create counterfeit ZEC inside Orchard without detection. Shielded Labs said Hornby wrote a complete exploit and tested it in a local environment, where it generated unlimited counterfeit ZEC that appeared valid.
Hornby immediately disclosed the issue to Zcash Open Development Lab, which coordinated an emergency response.
Then, the network developers introduced a temporary network change to disable affected Orchard actions before rolling out a hard-fork upgrade that corrected the vulnerability and restored full functionality.
The bug sat inside Zcash’s shielded pool for years
The vulnerability was especially sensitive because Orchard has been active since May 2022. That means the flaw existed for about four years despite repeated reviews by cryptographers, engineers, and auditors.
For a layperson, the issue can be understood as a flaw in the rulebook that governs private Zcash transactions.
A shielded transaction includes a mathematical proof showing that it followed the protocol’s rules without revealing the amount or history of the coins. In Orchard’s case, one of those rules was written loosely enough that false information could still pass as valid.
Essentially, that flaw was in the implementation of the Orchard circuit, the set of instructions that determines whether a private transaction should be accepted.
In a transparent blockchain, a supply problem is easier to inspect because balances and transfers are visible. In a shielded pool, the system deliberately hides that information, and users rely on the correctness of the circuit to ensure that every private transaction follows the rules.
Mert Mumtaz, the co-founder and CEO of Helius, pointed out that most privacy protocols have this vulnerability, arguing that:
“In theory, with a zk privacy protocol (not just zcash), you could have a bug in a circuit that inflates supply provided someone extremely sophisticated finds it and somehow exploits it undetected (the difference between a regular defi exploit is that it's harder to detect).”
This is one of the reasons why the market reaction to Zcash's case was so severe.
While Zcash developers said there was no evidence that the bug had been exploited, and several Zcash backers argued that the quick disclosure and patch showed the network’s security process working.
For context, Gemini co-founder Cameron Winklevoss said:
“Zcash has unparalleled cryptographers, security engineers, and security researchers. And the community is heavily focused on continuous improvement and hardening the network. That's why it engages world class security researchers to look for bugs. And that's why the recent potential exploit was found. It wasn't by accident and it's a vote of confidence, not a cause for alarm.”
However, privacy coins face a narrower margin for doubt. Their value depends not only on secrecy but on confidence that secrecy has not weakened the monetary guarantees underneath it.
Due to this, BitMEX co-founder Arthur Hayes said he sold his entire ZEC position after reassessing the privacy thesis. Hayes said it was unlikely counterfeit ZEC had been created, but the inability to formally prove that point changed the way he viewed the trade.
He stated:
“The privacy from AI, govt, big tech narrative demands perfection not improbability.”
Shielded Labs acknowledged that uncertainty directly and conceded that there was no definitive way to determine through cryptography alone whether an exploitation occurred before the fix.
The proposed fix shifts the burden back to verification
Due to the current uncertainty in the market, Shielded Labs proposed a network upgrade that would create a new shielded pool and use turnstile accounting on coins migrating out of Orchard.
Market observers noted that this proposal is an attempt to answer the market’s central concern. If Zcash cannot prove from Orchard’s internal records alone that counterfeit coins were never created, it can try to force a migration path that reconciles value as coins move into a new system.
That process would be technically complex and socially sensitive. If no counterfeit ZEC exists, migration could help restore confidence. If a mismatch emerged, the community would face harder questions over which balances should be honored and how to protect users who held funds in the affected pool.
Meanwhile, Josh Swihart, founder of the Zcash-focused firm ZODL, said the more important long-term issue is how to prevent similar vulnerabilities from recurring. He pointed to formal verification, a process that uses mathematical proofs to confirm that a circuit’s implementation matches its intended rules.
Formal verification would reduce reliance on human review of a large and complex rulebook. Instead of asking auditors to catch every edge case by inspection, developers can create a concise specification and use computer-checked proofs to verify that the implementation follows it.
That approach is becoming more important as privacy systems become more sophisticated. Orchard was built for performance and contains special cases that make it harder to review manually. A simpler and formally verified circuit could reduce the surface area for this type of mistake.
Zcash developers and affiliated teams are now pursuing multiple security efforts, including continued work with Hornby, formal verification of Orchard’s circuit, and additional security hiring.
Shielded Labs also said a detailed proposal for supply-verification upgrades could follow shortly.
AI turns old bugs into immediate market risks
The Zcash disclosure highlights a fundamental shift in the economics of software security. While artificial intelligence did not create the Orchard vulnerability, it severely compressed the timeline between a hidden risk and its public discovery.
This acceleration poses a systemic challenge to the broader digital asset sector.
Cryptocurrency protocols rely on open-source code and complex financial logic to govern massive pools of capital, making them highly attractive targets. Decentralized finance (DeFi) applications, cross-chain bridges, and layer-1 blockchains have all suffered from foundational bugs missed during initial audits.
That threat is moving fast enough to alarm industry veterans. Last month, OpenZeppelin co-founder Manuel Aráoz urged investors to exit DeFi altogether, warning that AI agents are now capable of identifying vulnerabilities far faster than human reviewers.
The caution arrives as the DeFi sector faces mounting pressure, having lost over $1.1 billion to exploits in the past year.
Compounding these structural fears is Anthropic’s quiet unveiling of Claude Mythos. The vulnerability-seeking AI model was deemed too dangerous for public release by the San Francisco-based company, underscoring the potential for sudden, irreversible losses if such tools fall into the wrong hands.
In an interview with CryptoSlate, Deddy Lavid, chief executive of blockchain security firm Cyvers, emphasized the scale of the problem, estimating that the sector's financial exposure to AI-driven exploits easily ranges from hundreds of millions to billions of dollars.
Ultimately, AI presents a double-edged sword for blockchain infrastructure. As these models become more sophisticated, they drastically lower the cost and effort required for attackers to find weaknesses, while simultaneously giving defensive researchers the tools to patch them faster.
This dual-use reality shaped the response from prominent crypto executives. Grayscale Chairman Barry Silbert framed the Zcash episode as clear evidence that digital assets have fully entered an “AI-enabled” threat environment.
Yet, industry advocates maintain that the fundamentals of protocol defense remain the same.
Gemini co-founder Tyler Winklevoss noted that software security has always been a continuous race between developers and malicious actors.
According to him, artificial intelligence has simply accelerated the pace for both sides. He stated:
“AI doesn't change this game of cat and mouse, it just accelerates it. Every piece of software has to run this race. There's no escaping it.”
The post Zcash loses over $5 billion after AI finds 4-year bug that could have created fake hidden coins appeared first on CryptoSlate.
Bitcoin just tested an intraday low of $61,349, triggered roughly $1.76 billion in liquidations with long positions absorbing more than $1.5 billion of that total, and then bounced toward the mid-$63,000s.
Funding rates flipped deeply negative, open interest reset sharply, and the Crypto Fear & Greed Index fell to 12, a level in extreme fear territory.
That is a meaningful amount of technical work compressed into a short window, and the buyers who need to absorb the remaining supply have yet to confirm their return.
| Market phase | What it means | Current BTC evidence |
|---|---|---|
| Liquidation bottom | Forced sellers are flushed out | $1.76B liquidations; $1.5B+ from longs; funding deeply negative; open interest reset |
| Demand bottom | New buyers absorb remaining supply | Not confirmed yet; ETF outflows persist; exchange inflows rose; spot sellers still active |
What the crash reset
Lacie Zhang, research analyst at Bitget Wallet, argues the technical work from this flush was real. In a note, she said that the $1.76 billion liquidation wave, concentrated in long positions, cleared the most crowded bullish leverage from the order book.
Funding rates moving deeply negative indicate that the leverage bias has shifted from overheated longs to defensives, and the sharp open interest reset means speculative positioning is considerably cleaner than it was last week.
Zhang also frames the equity comparison, noting that the Dow fell 1.2%, the S&P 500 dropped 0.7%, and the Nasdaq declined 0.9% over the same period, with no comparable deleveraging event.
Bitcoin's 24/7 structure, higher leverage, and more reactive participant base mean it tends to price macro stress faster than equity markets, compressing what equities may absorb over weeks into a few sessions.
On that read, crypto may already be closer to clearing this macro episode than traditional markets are, with a retest of $55,000-$57,000 still plausible if ETF outflows persist, but the probability window for that range is narrowing as technical conditions reset.
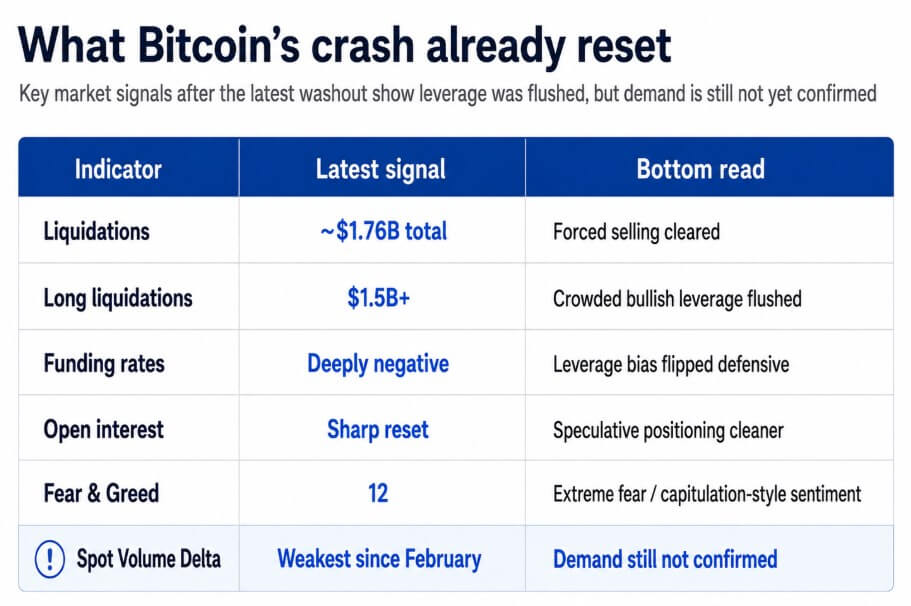
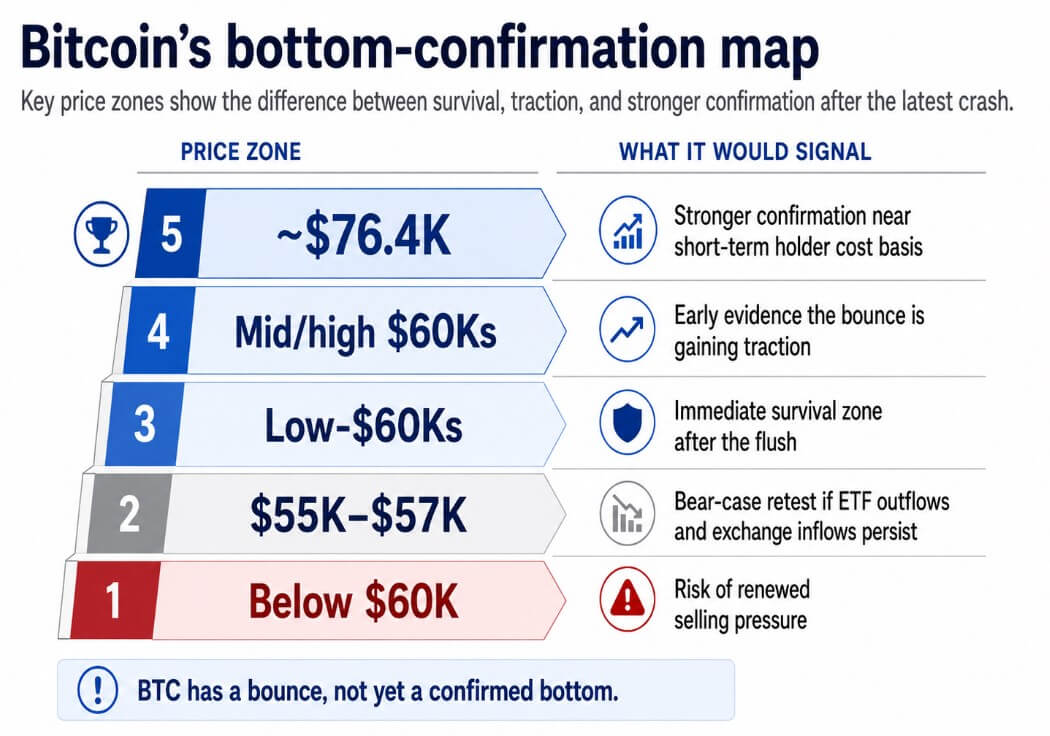
Glassnode's June 3 report notes that Bitcoin had fallen 13% over seven days, the short-term holder cost basis had declined to roughly $76,400, and the 7-day Spot Volume Delta had turned decisively negative, reaching its weakest level since February.
Spot sellers were dominating order books even as prices bounced, and Glassnode concluded the market still lacked evidence of a durable demand response.
Standard Chartered's Geoffrey Kendrick maintained a $100,000 year-end 2026 Bitcoin target and said much of the selling may already be over, but also flagged that a move below $60,000 would risk triggering a fresh wave of selling with no natural floor visible below that level.
Why the bounce is still under suspicion
Nicolai Sondergaard, research analyst at Nansen, reads the exchange flow data as a direct challenge to the recovery narrative.
BTC and ETH both recorded net exchange inflows over the 24 hours following the bounce from $61,000, the first such reversal since the June 1 lows. Traders moving coins onto exchanges are positioning to sell or reduce exposure, and the timing after a bounce points to participants using the recovery as exit liquidity.
The ETF data reinforces Sondergaard's caution, as US-traded spot Bitcoin ETFs extended their outflow streak to 13 consecutive sessions, accumulating roughly $4.4 billion in withdrawals.
Sondergaard frames this outflow run as mostly confirmatory of deteriorating sentiment and draws a harder line, saying that pension allocators and RIAs operating under compliance mandates do not quickly rebuild exposure after reducing it.
The institutional bid that helped carry Bitcoin from $50,000 to $126,000 across 2024 and 2025, in the form of a structural demand layer from allocators who could only access BTC through the ETF wrapper, has been withdrawing since May, and its return will move at the pace of compliance review cycles.
Sondergaard also notes that leveraged long positioning has not fully normalized, meaning the market may still carry more cleanup ahead even after the liquidation wave.
The checklist for a confirmed bottom
The low-$60,000s represent the immediate survival zone where the market absorbed the latest flush, with the $60,000 handle itself acting as the psychological threshold Kendrick identified as the dividing line between containment and acceleration.
A retest of $55,000-$57,000 represents the bear case if exchange inflows and ETF outflows persist through the week.
Recovery into the mid-to-high $60,000s would represent early traction for the bounce, while the short-term holder cost basis near $76,400 is the stronger confirmation zone, a level where buyers who entered during the last rally return to breakeven.
ETF outflows need to slow or reverse, which would point out that the institutional buyer class has stopped withdrawing liquidity, while BTC and ETH exchange inflows need to fade, reducing the near-term sell overhang.
Whale accumulation needs to strengthen to show that large entities are actively absorbing supply. Funding rates need to normalize without open interest immediately re-leveraging, because a clean reset that gets crowded again within days produces the same fragility the market just unwound.
And spot buying needs to drive the recovery by actively filling the order book, with liquidated longs gone and new bids taking their place.
Until those conditions show up in the data, Bitcoin has completed the forced-selling phase of this correction, while the voluntary sellers, such as the ETF redemptions, the exchange depositors, and the compliance-driven de-riskers, are still active, and the bounce off $61,500 stays a positioning event until buyers confirm it as a floor.
The post Bitcoin crashed and flushed leverage out, but is the bottom here yet? appeared first on CryptoSlate.
A Casascius coin tied to 25 BTC moved this week, converting a 2011 physical Bitcoin artifact into spendable BTC during a broader market selloff.
Galaxy Research identified the item as an S1-COIN-25 Casascius physical Bitcoin, a large-denomination piece from the era when Bitcoin could still be handed across a table as a loaded coin. The reported alert valued the 25 BTC at about $1.78 million at the time.
The on-chain sequence is more precise than a simple cash-out. The watched address received a 25 BTC output in block 156,413 on Dec. 7, 2011. It later accumulated small dust outputs before spending its funded outputs this week.
The first 2026 spend landed on June 3 at block 952,159. That transaction spent 25.00002187 BTC from the address and returned 24.98998 BTC to the same address after fees and dust handling.
A second transaction on June 4 at block 952,267 moved 24.98996629 BTC to a SegWit address, leaving the watched address with no balance.
The event proves a status change rather than a confirmed sale. Bitcoin, once attached to a physical collectible, became spendable via a normal wallet path. The chain shows movement away from the old address without any evidence of an exchange deposit, custodian route, or sale.
What the Bitcoin blockchain shows
The June 3 transaction matters because it exposed activity from an address that had carried its original 25 BTC output since 2011. The spend returned most of the value to the same address, so a one-line address history can overstate what changed.
The June 4 transaction completed the visible move. The final spend sent 24.98996629 BTC from the watched address to bc1qn5snfwq447vge9ynnz66xqm9kpam9eu34z52dk. The fee was 1,371 sats.
After that, Blockstream's address view showed no remaining balance. The holder's reason remains unknown, and the available record ends with a transfer to another Bitcoin address.
That boundary matters for market interpretation. Old coins moving can look like holder behavior during a selloff, while the available data only establishes transfer to a recipient address.
CryptoSlate applied a similar standard to Mt. Gox-linked wallet movements, treating the first transfer as a warning light until later routing showed more. The same discipline applies here, where the next useful signal is onward routing.

For now, the address history supports the following conclusion: a long-dormant, Casascius-attributed 25 BTC address became active, then sent nearly all of its remaining balance away from the original address.
Casascius attribution and on-chain proof do separate jobs. The visible chain proves the key was used. Galaxy-attributed secondary coverage supplies the label that makes it a physical-coin event.
Keeping those layers separate preserves the cultural hook without turning a tracker alert into more certainty than the record can carry.
A move from an old address becomes supply-only if subsequent routing points to a venue where coins can be sold or financed.
Until then, the strongest verifiable signal is a custody transition. A private key once hidden in a physical object has been used, and the BTC now sits outside the original Casascius-attributed address.
Why a Physical Coin Still Matters
Casascius coins occupy a strange place in Bitcoin history because they turned a purely digital bearer asset into a physical object. The original site describes pieces with their own Bitcoin address and a redeemable private key sealed inside.
The Casascius FAQ explains the tamper-evident hologram and the rationale behind making a physical Bitcoin as a proof-of-concept and conversation piece.
That design created a trade-off outside ordinary wallet custody. Leaving the hologram intact preserves the object as a loaded collectible. Peeling it gives the holder control over the BTC, but changes the item from a funded artifact into a spent collectible.
The owner is choosing between numismatic scarcity and direct wallet liquidity. That choice makes this move more distinctive than a dormant wallet transfer.
A standard wallet can sit idle for years and then move without changing its form. A Casascius redemption changes the nature of the thing itself.
The coin can still exist as a physical object, but its main economic value has shifted back to Bitcoin on-chain.
CryptoSlate covered a larger version of that tension in 2025, when a holder unlocked about $10 million from a rare Casascius bar. That case also forced a choice between keeping a scarce, loaded relic and redeeming the BTC.

The current 25 BTC move lands differently because of timing. Bitcoin was already under pressure, and old-wallet activity carries a sharper edge when leverage is unwinding.
CryptoSlate's Bitcoin price page shows BTC near $63,000 on June 4, down 5.7% over 24 hours, 13.8% over seven days, and 22% over 30 days.
At that snapshot price, 25 BTC is worth about $1.58 million, which is already below the $1.78 million recently reported in the Galaxy-attributed alert.
Routing, Not Folklore
Bitcoin fell from $71,765 to $67,895 on June 2, triggering about $394 million in one-hour liquidations as leveraged long positions unwound.
That selloff makes any movement from old BTC addresses feel more consequential than it would during a calm rally.
The cultural signal and the trading signal are different. The cultural signal is clear: one of Bitcoin's early physical storage formats appears to have rejoined the ordinary liquidity layer.
The trading signal remains unresolved. The watched BTC has left the original address, while the available data leaves open whether it will be sold, stored, pledged, or moved again.
Casascius redemptions connect the Bitcoin of forums, holograms, and physical experiments with the Bitcoin of ETFs, market-cap dashboards, and institutional liquidity.
A physical coin from 2011 can sit untouched for years, then become on-chain BTC in a market where every old coin movement is scanned for supply pressure.
It is a small event compared with Mt. Gox balances, ETF flows, or miner selling, but it is vivid because the holder had to alter a collectible to make the BTC liquid.
The next signal is simple. If the June 4 recipient address routes funds toward an exchange, custodian, mixer, or known liquidity venue, the signal moves from culture and custody into market supply.
If it stays parked, the event remains a clean example of Bitcoin's long memory: old keys, old objects, and old storage habits can still wake up when the asset around them has become a global market.
The post A 2011 physical Bitcoin loaded with 25 BTC was just unlocked during the $62k selloff appeared first on CryptoSlate.
Bitcoin is enduring a multi-front assault on its spot market liquidity as exchange-traded funds, short-term speculators, and cryptocurrency miners simultaneously distribute assets.
This coordinated selling pressure has drained market demand at the fastest pace since the 2022 collapse of the Terra/Luna ecosystem.
As a result, BTC's price has tanked 12% over the past week, pushing the top crypto towards the $60,000 level amid heavy hedging activities from market traders. BTC is exchanging hands at $64,036 as of press time, according to CryptoSlate's data.
Yet, this spot-market flush has created a structural paradox that could still catapult BTC's value.
The volume of selling has twisted the derivatives market into an increasingly lopsided shape where a record wall of short positions now anchors the market.
However, while traditional spot indicators point downward, any pause in selling could spark a mechanical short squeeze and turn the traders betting against Bitcoin into the forced buyers who fuel its next rally.
Bitcoin ETF exodus runs after the AI trade
The primary driver behind Bitcoin’s recent price weakness is a sharp reversal in institutional capital flows. Spot Bitcoin ETFs recently logged a 13-day streak of consecutive liquidations between mid-May and early June.
According to Galaxy Research, these funds shed 59,351 BTC, pulling roughly $4.33 billion out of the market.
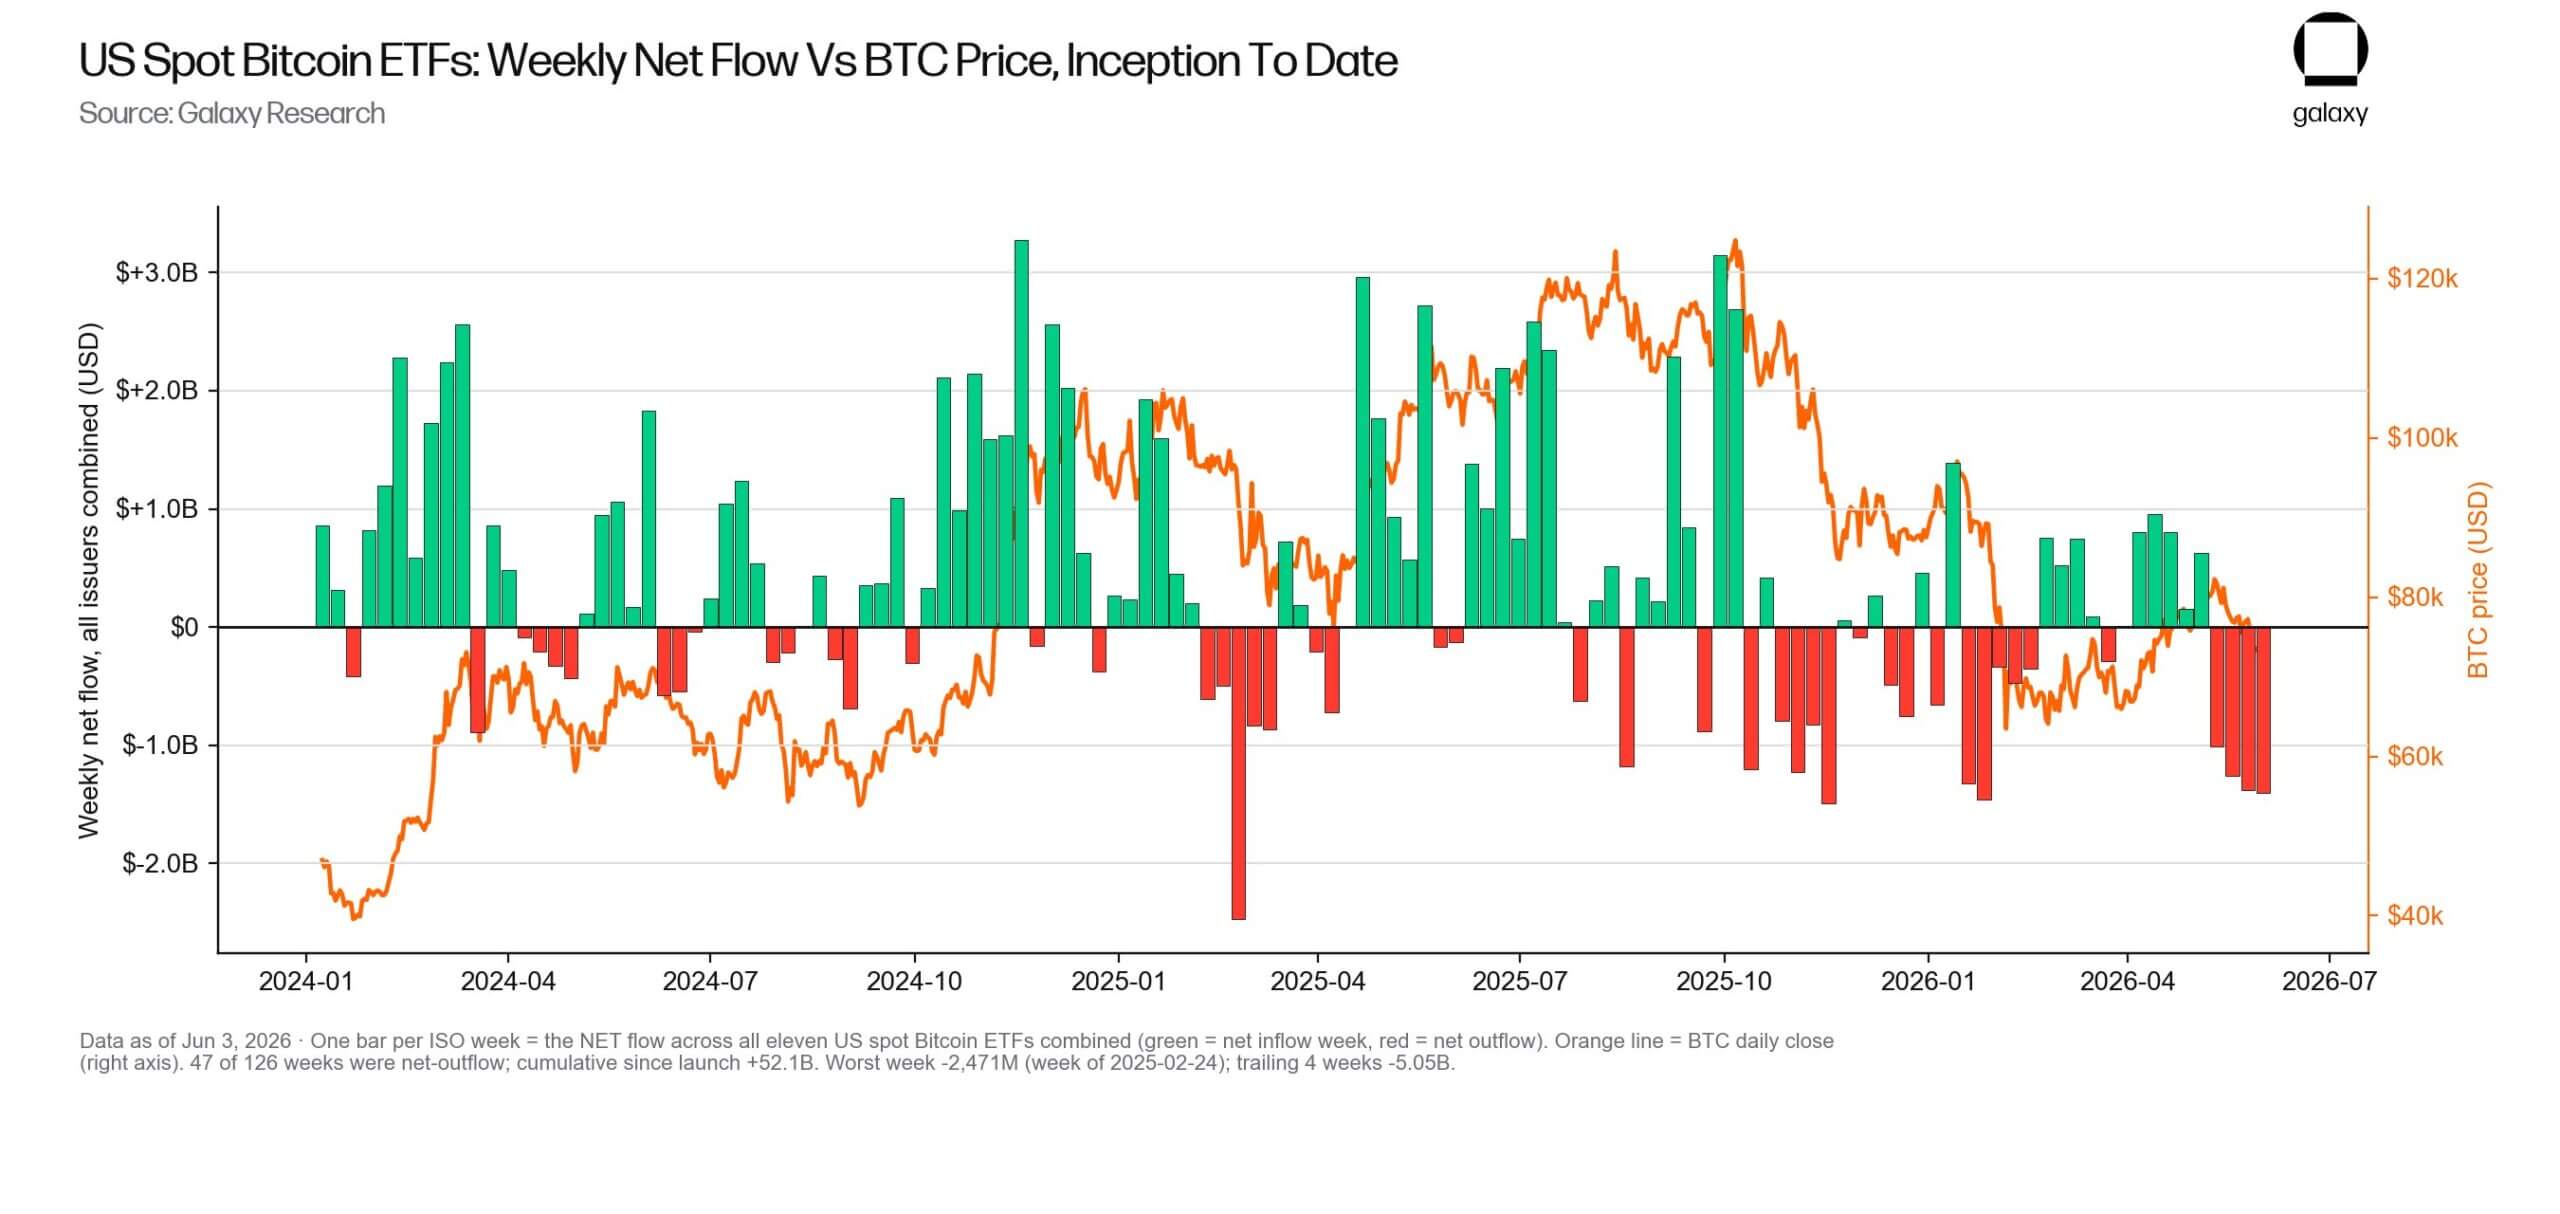
Over a seven-day window, the funds lost $2.78 billion, representing the worst such outflow on record for Bitcoin. The bleeding continued over a 10-day window with $3.06 billion in outflows. The 14-day window saw $4.21 billion exit the market, while the 20-day trailing window recorded $5.42 billion in outflows, shedding 73,080 BTC.
Galaxy Research noted this 20-day period is the single largest outflow window by both dollar value and total Bitcoin volume on record.
Industry executives view this as a macroeconomic realignment rather than an internal failure of the digital asset class. Traditional capital markets are currently routing approximately $400 billion into artificial intelligence infrastructure over a six-month window.
Michael Saylor, chairman of Strategy, said:
“This is a capital rotation, not a Bitcoin impairment. Capital markets are funding the AI buildout at historic scale. Volatility creates opportunity.”
Jeff Park, an advisor at Bitwise, echoed this sentiment. He suggested traders are tapping their Bitcoin allocations to fund the market’s upcoming “hot ball of money” trades, shifting liquidity to chase tech firms like SpaceX and Anthropic.
Moving forward, Park noted, this correlation breakdown will itself become the fuel for future market moves.
Speculative panic and miner capitulation
As institutional support softened, retail and short-term holders entered a phase of outright capitulation.
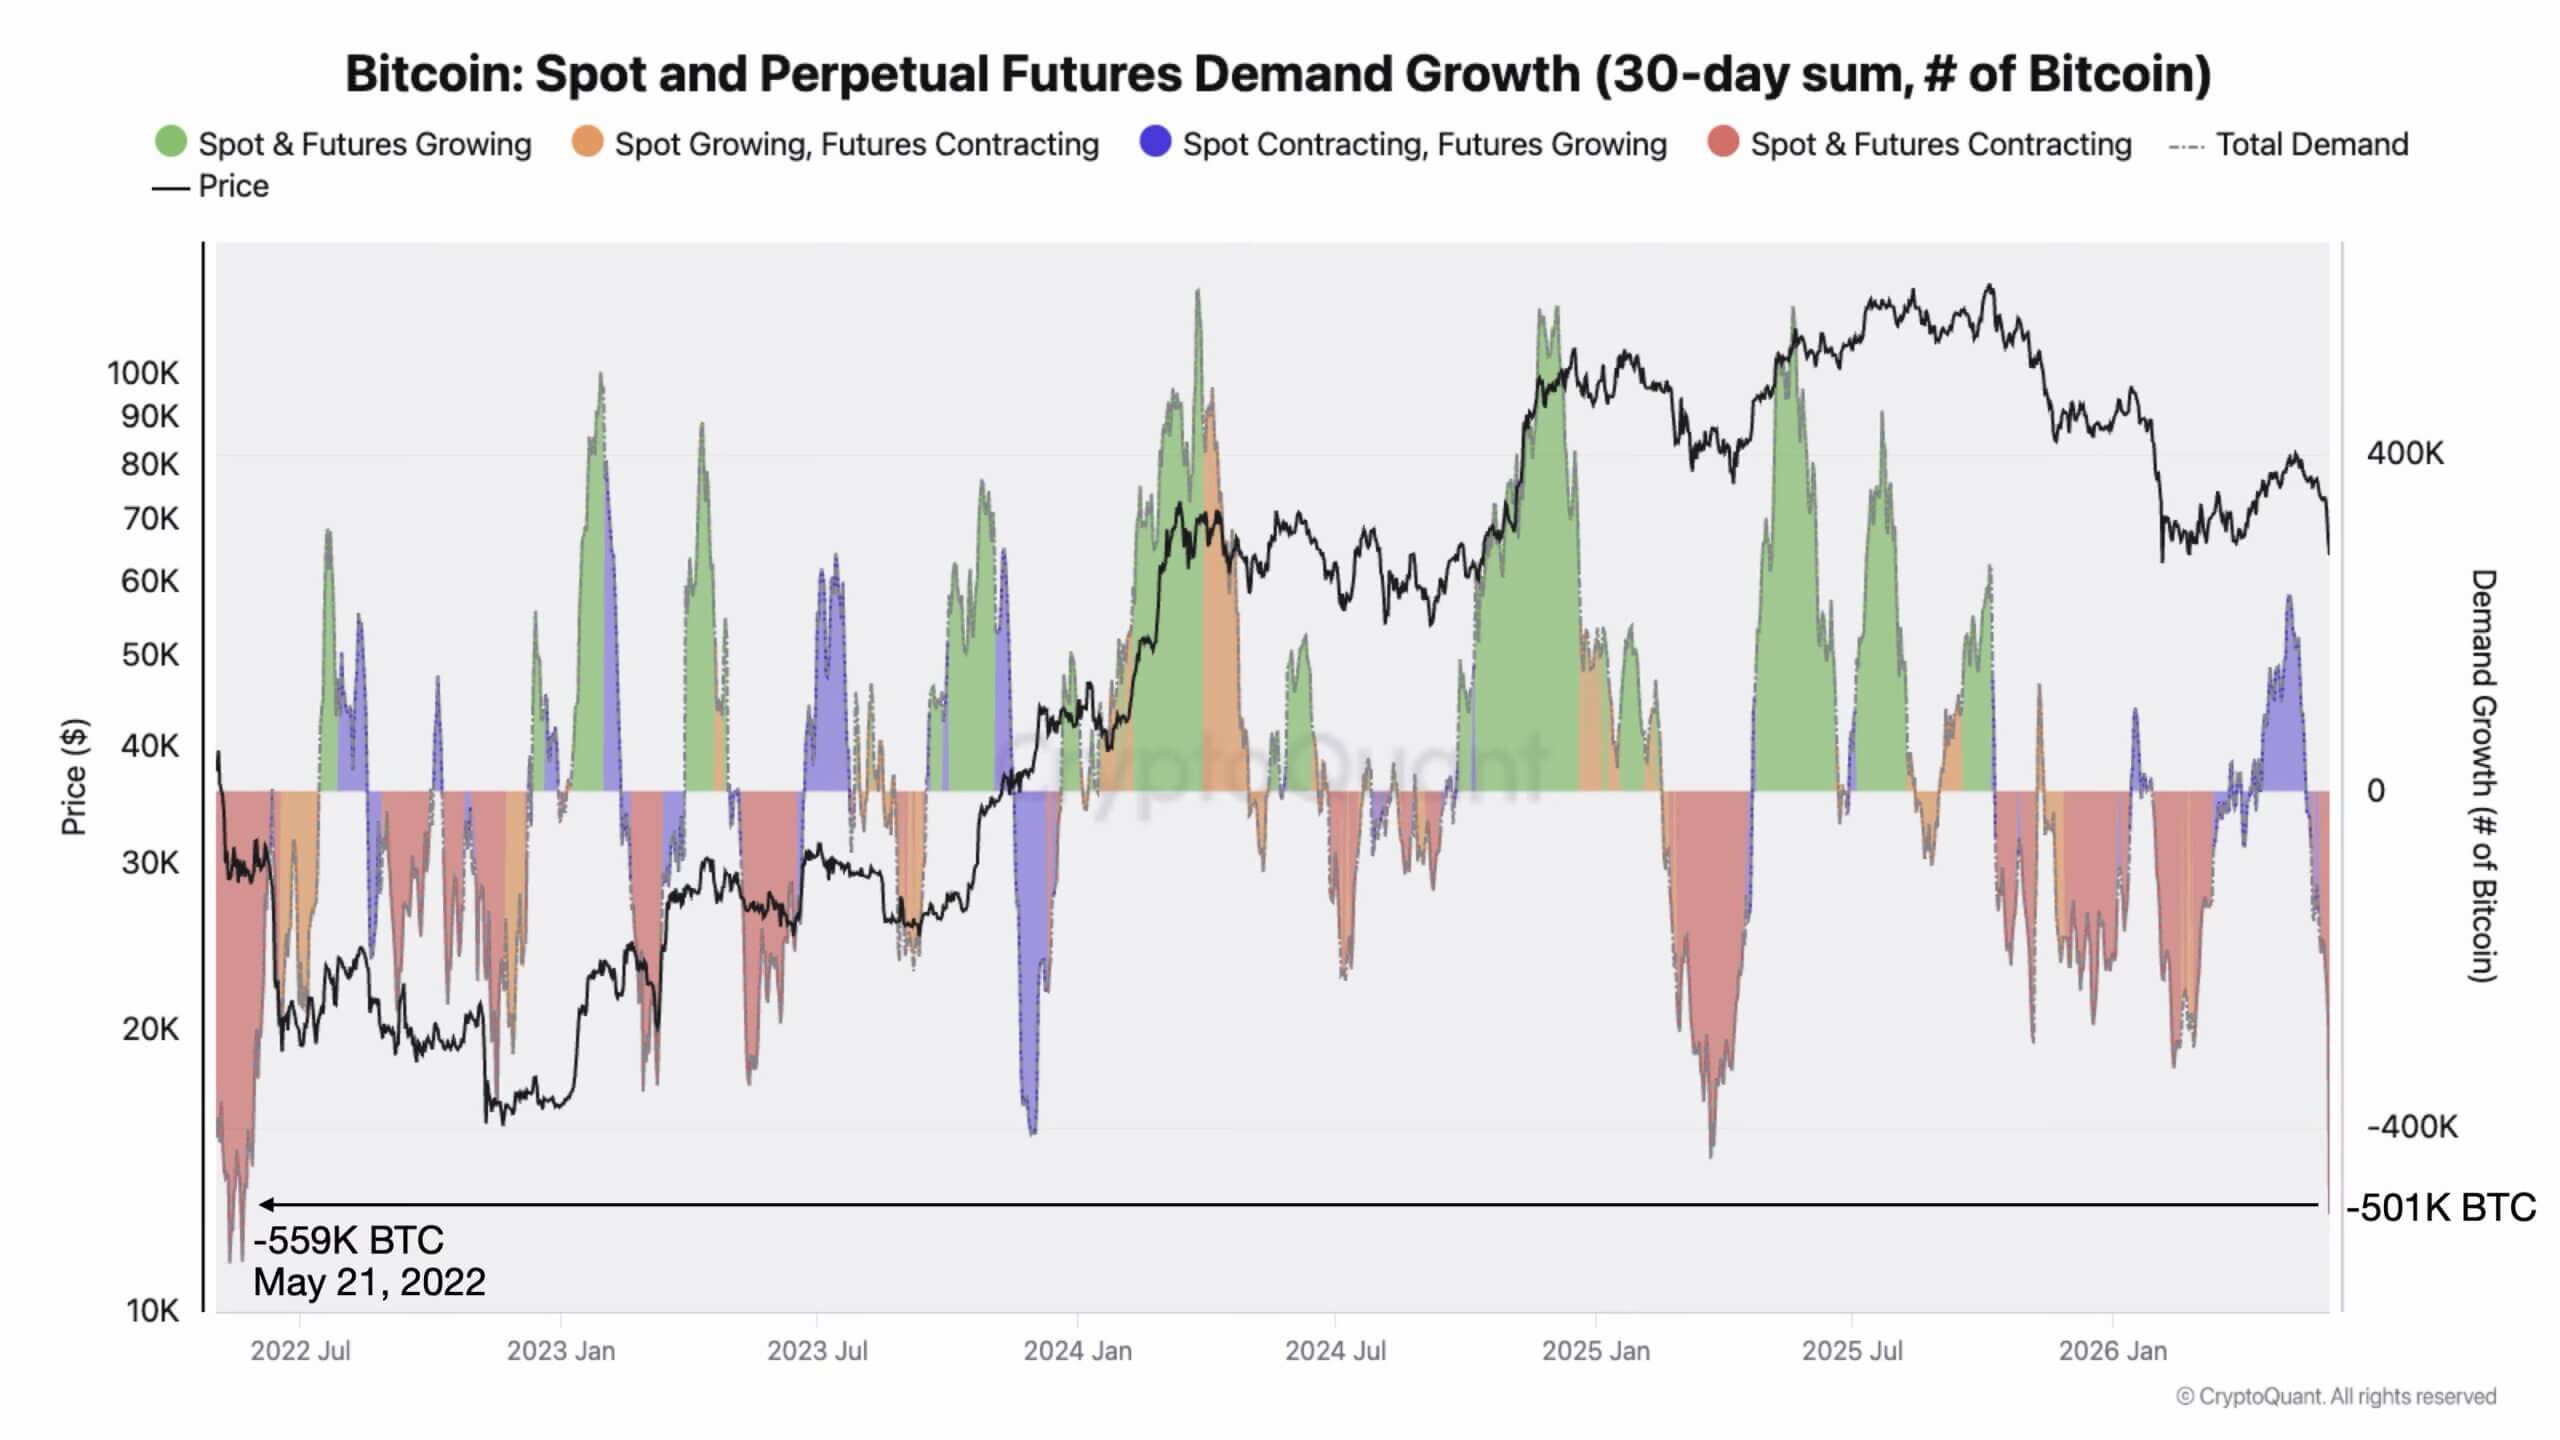
CryptoQuant data shows that overall Bitcoin demand, which is a combination of the speculative and spot market purchasing, contracted by 501,000 BTC over the past month.
At the same time, short-term BTC holders are driving the most concentrated loss-driven transfers of the year.
Over a 24-hour window, these holders moved 53,800 BTC directly onto exchanges. CryptoQuant researchers highlighted the critical split: 100% of these coins moved while at a loss, while profit-side inflows collapsed to zero.
This means that these underwater buyers are choosing to liquidate their positions directly into market weakness rather than wait out the volatility.
Historically, CryptoQuant noted, peaks in loss-driven inflows from short-term holders cluster around local capitulation events. They mark weak hands, flushing out, and supply transferring from over-leveraged late entrants to higher-conviction holders.
Adding to the overhead supply, BTC miners are also moving coins. CryptoQuant noted that on June 2, Bitcoin miner inflows to the Binance exchange spiked to 24,716 BTC, surpassing a previous February peak by 6.8%.
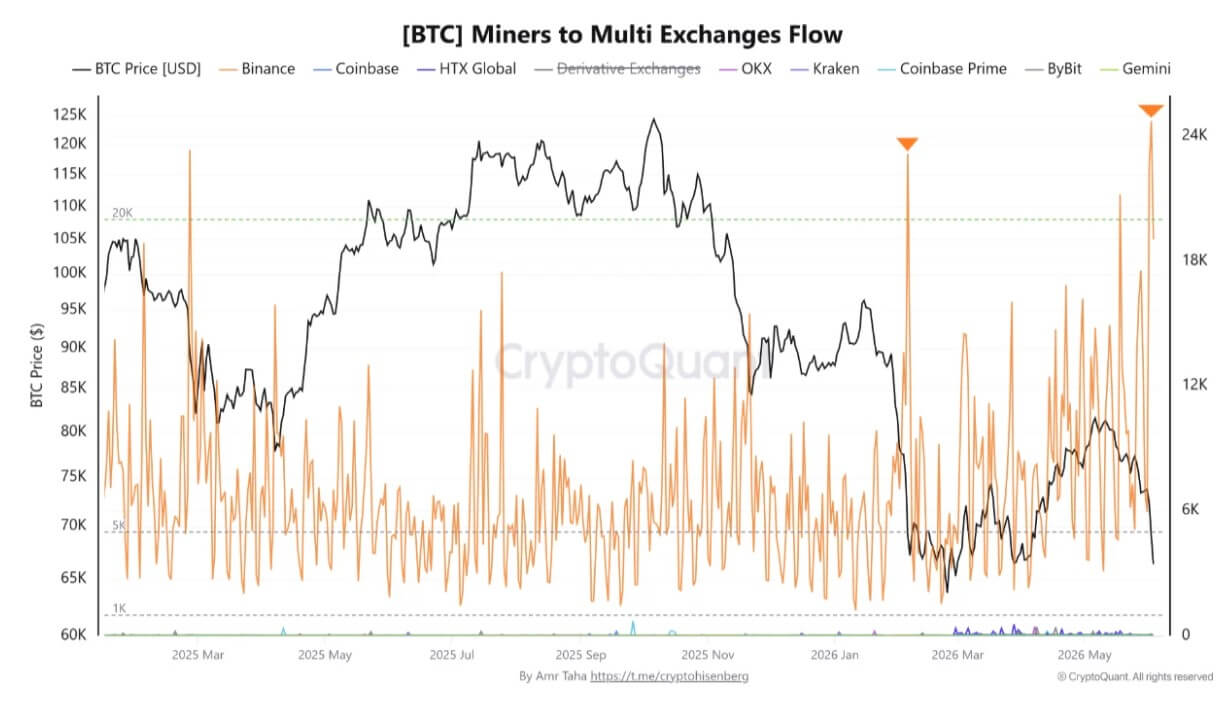
CryptoQuant researchers pointed out that large miner inflows do not confirm immediate, open-market selling. Miners frequently move coins for strategic purposes, including hedging, liquidity management, or internal treasury rebalancing.
However, concentrating this volume of Bitcoin on a single exchange means miner-held supply has moved directly adjacent to market liquidity.
If these inflows remain elevated in the coming days, traders may interpret the data as a sign of renewed miner distribution.
The supply absorption puzzle
This relentless selling creates a structural puzzle when contrasted with long-term accumulation data. While short-term speculators flee, veteran investors are aggressively absorbing the overhead supply.
Brian HoonJong Paik, CEO of the Bitcoin-focused firm Smash Fi, pointed out that long-term holders added 200,000 BTC to their wallets this month and now control 16.3 million BTC, which is sitting near their all-time high holdings.
Paik said:
“The people who have held Bitcoin the longest are not selling into this weakness. They are buying your panic.”
Yet, the sheer volume of coins hitting the market indicates a massive change of hands.
CryptoQuant CEO Ki Young Ju noted that historically, bear markets conclude only after the spot price falls below the realized price. This metric places the current average investor cost basis around $53,000.
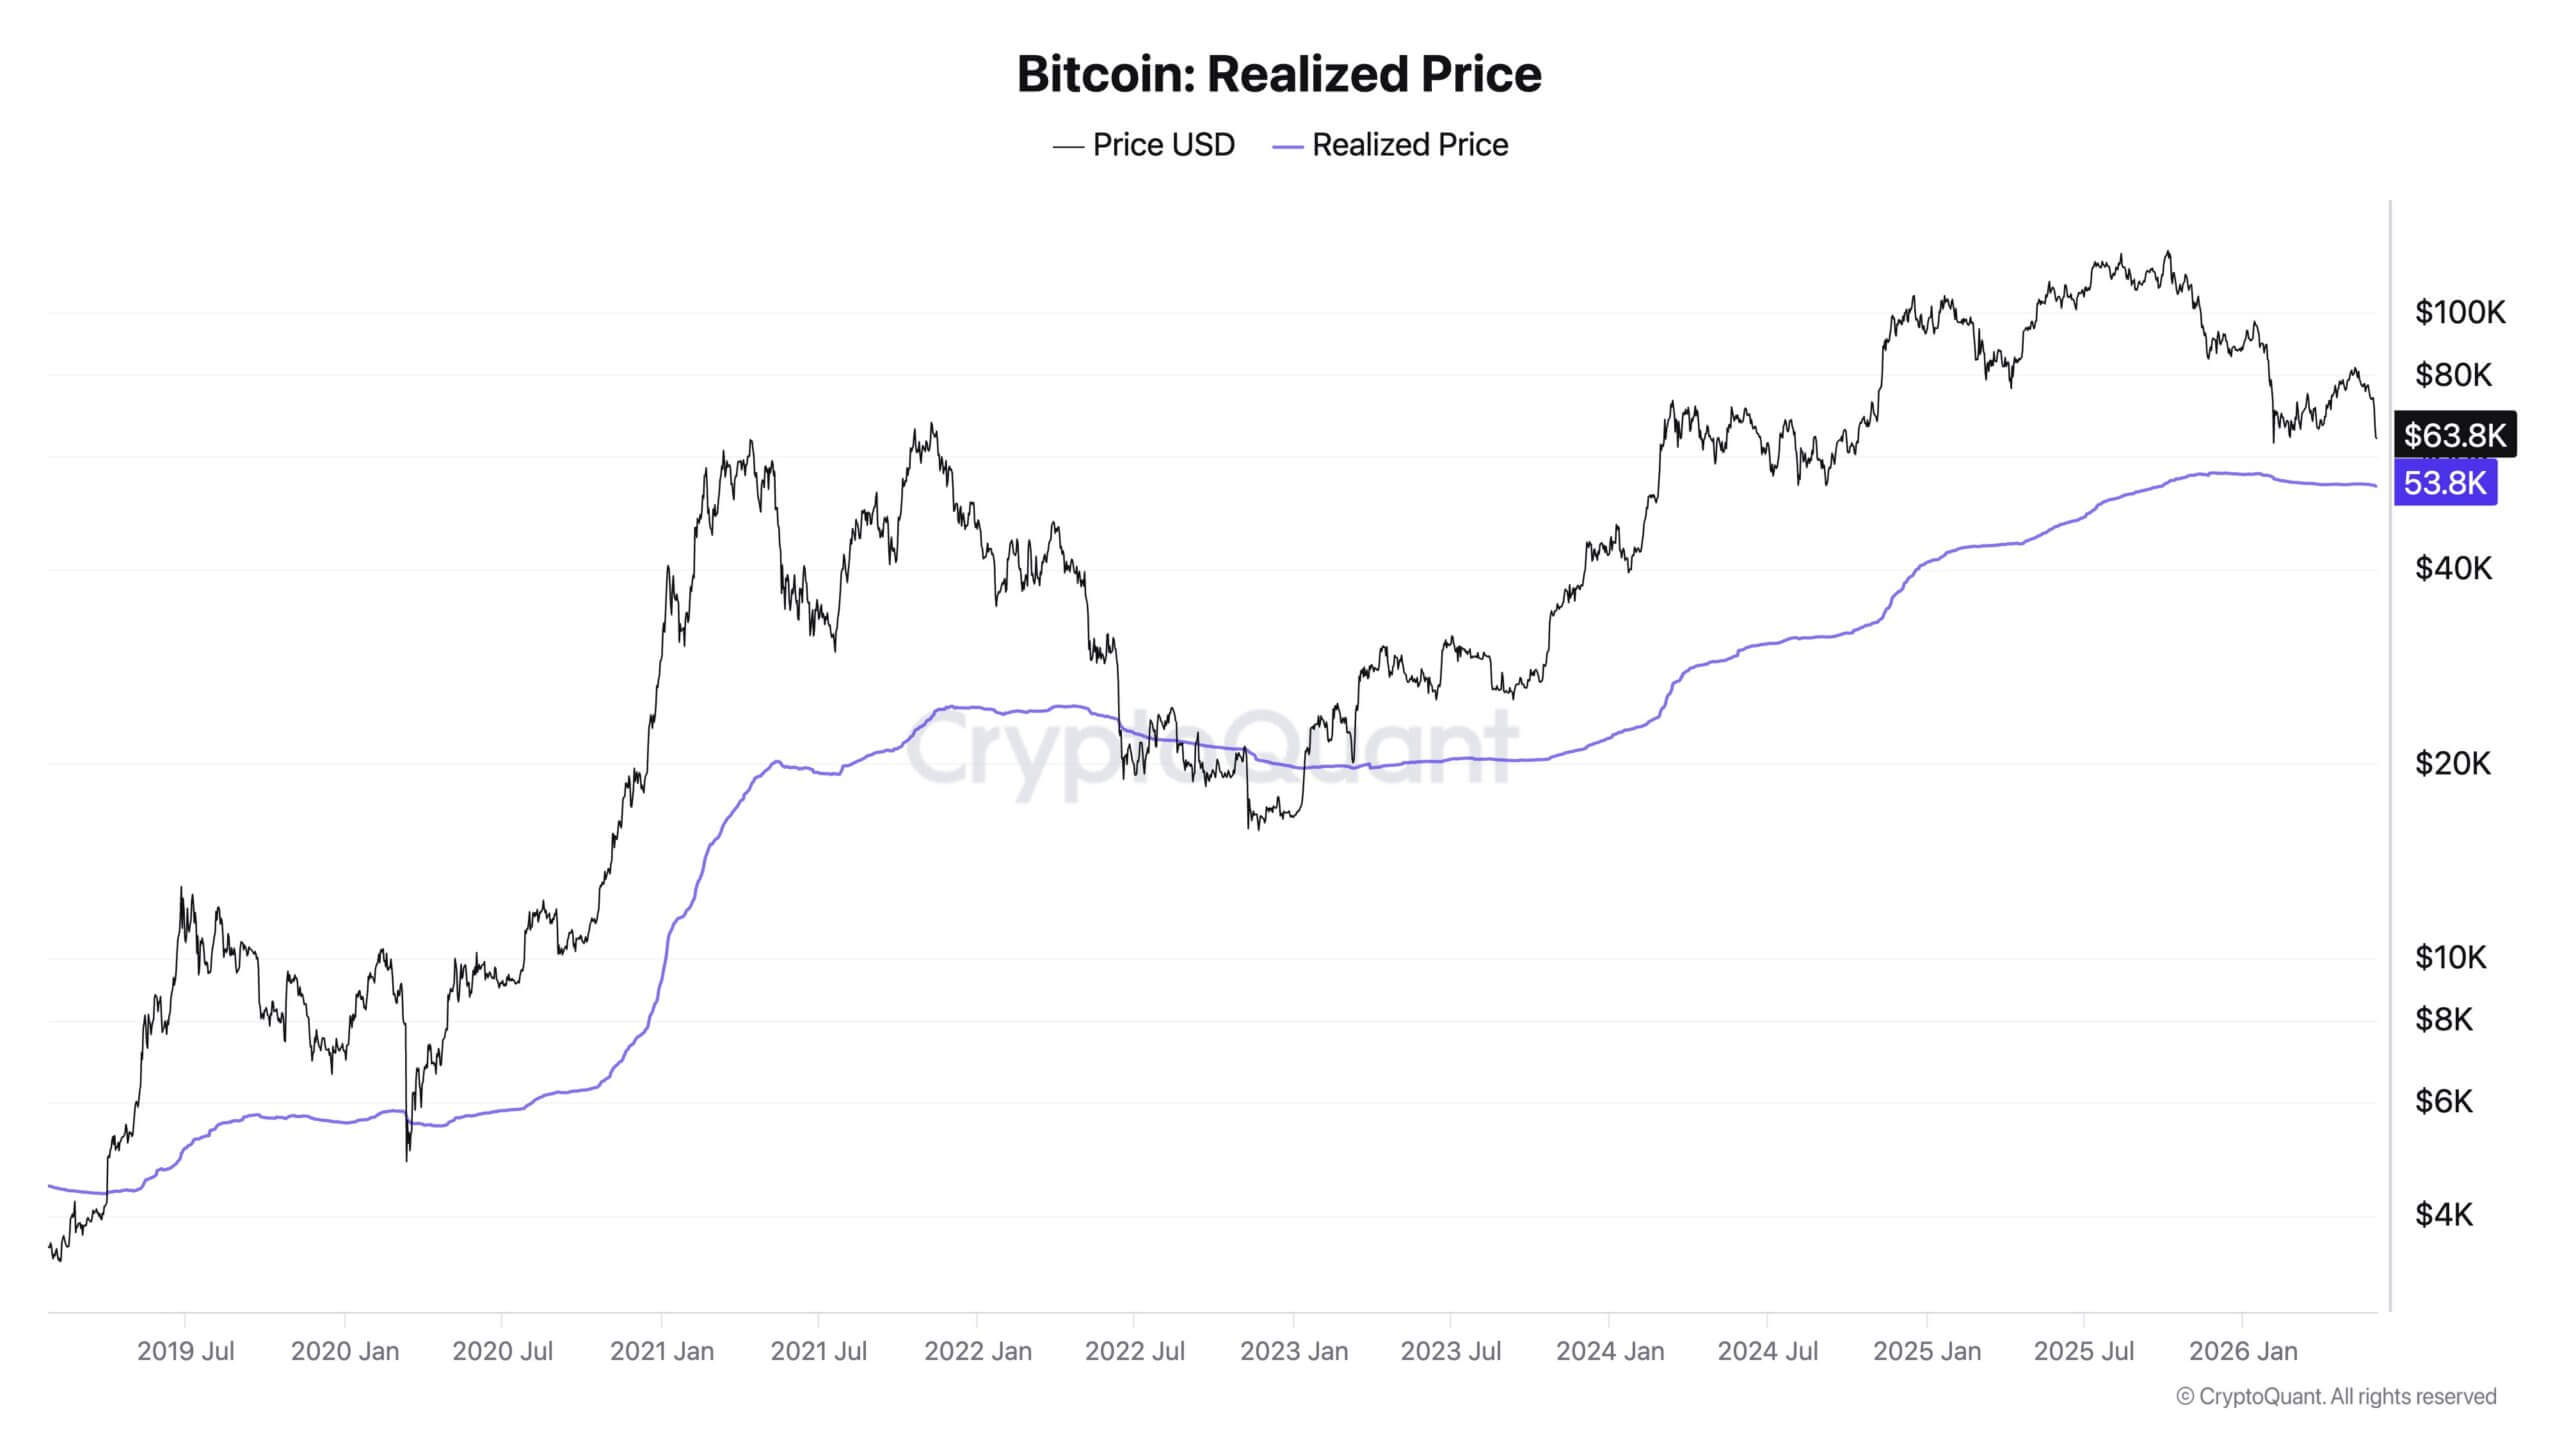
Reaching that level, however, should theoretically prove difficult given the wall of institutional capital that has entered the market.
Ki Young Ju broke down the math to illustrate the scale of this absorption: Since January 2023, Strategy (formerly MicroStrategy) bought 711,206 BTC and sold only 32, effectively locking up 711,174 coins.
Furthermore, since Bitcoin traded at $63,000 in March 2024, spot ETFs absorbed an additional 509,102 BTC, while Strategy acquired another 650,706 BTC.
In total, institutions swallowed 1,240,808 BTC, yet the spot price remains anchored at the same level.
For context, total global exchange reserves hover around 2.7 million BTC, and Satoshi Nakamoto’s estimated holdings equal roughly 1 million BTC.
Despite the market absorbing a supply shock larger than Satoshi’s entire stack, the price remains suppressed.
This dynamic highlights that while traditional long-term holders and institutions accumulate heavily, an unusually motivated cohort of sellers continues to cap any upward momentum.
BTC's coiled spring set-up
While the spot market paints a picture of exhaustion, the derivatives market has transformed into a coiled spring. The rush to short Bitcoin during this slide has created a top-heavy leverage structure.
Data from analytics firm Alphractal shows a dramatic 72-hour shift in the global liquidation map. On the first day of the flush, the market sat at 66% short-heavy.
By day two, it reached 76%. By day three, the market shifted to an extreme 89% short bias. The metric now pits $98.3 billion in short positions against a $12.2 billion long stack.
The short-to-long ratio sits at 8.06x. Because the market has already washed out most leveraged longs, limited downside risk remains on the chart. The downside magnetic level at $61,054 holds just $1.3 billion in long liquidations.
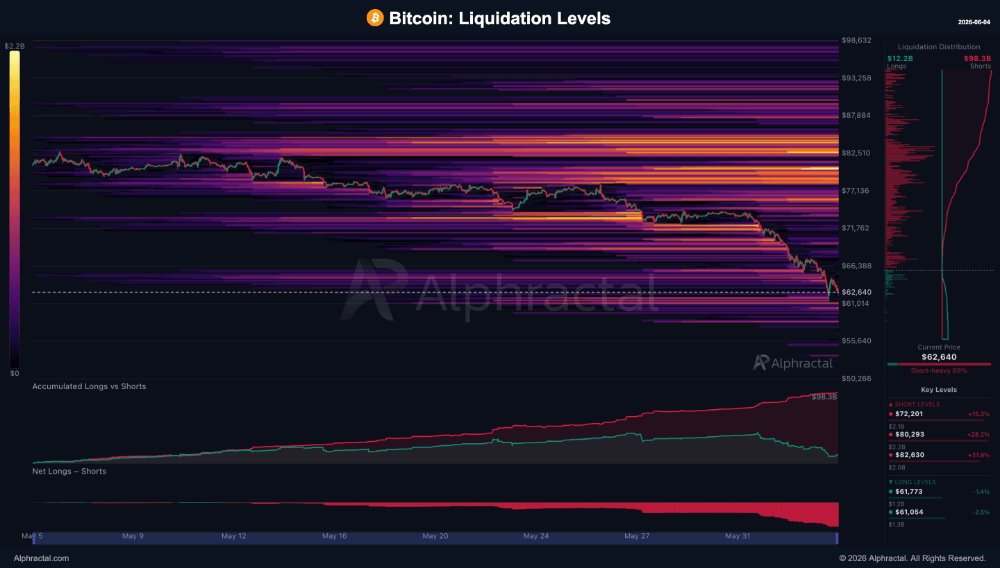
Conversely, the upside is heavily clustered with short liquidation triggers. A modest upward move opens up three waves of forced buying: $2.1 billion at $72,201; another $2.2 billion at $80,293; and a final $2.0 billion layer resting at $82,630.
According to Alphractal, short sellers have stacked more than $6.3 billion in sensitive liquidation triggers between 15% and 32% above the current spot price.
The closest structural analog to this dataset occurred in November 2022, when the same metric printed an 84% short-heavy reading. Over the following 11 sessions, Bitcoin surged approximately 24%.
Bitcoin currently faces undeniable spot pressure from miners, panicked retail traders, and fleeing ETF capital.
However, by over-allocating into bearish trades, the market has set a mechanical trap.
The underlying selling pressure remains real, but the resulting structural imbalance means that the slightest pause in spot distribution could easily trigger a violent, upward cascade powered entirely by the traders betting on Bitcoin's decline.
The post Bitcoin’s selloff is creating the short-heavy setup that could reverse it fast appeared first on CryptoSlate.
CryptoTicker.io
The digital asset market is facing a severe wave of deleveraging, forcing Bitcoin ($BTC) to give up the critical $63,000 support level. Broad macroeconomic tightening, driven by persistent inflationary pressures and delayed interest rate cut expectations from the Federal Reserve, has severely weakened risk appetite. Furthermore, a rotation of capital into high-growth technology equities alongside persistent spot ETF outflows—which recently marked a record $4.4 billion multi-day exodus—has accelerated the downward momentum.
Bitcoin's structure is heavily skewed to the downside, with sellers maintaining firm control over the short-term trend. While the breach below $63,000 has already shaken retail confidence, technical data indicates that the next structural move could be far more worrisome for market bulls.
Bitcoin Price Analysis: BTC Coin Slides Under $63,000
The continuous decline of $Bitcoin has systematically dismantled major psychological thresholds over the last month. After failing to sustain its positioning within the $70,000 and $66,000 handling zones, heavy distribution took over. This triggered severe cascading liquidations across crypto derivative platforms, amounting to over $3 billion in wiped-out market leverage within a two-day window.
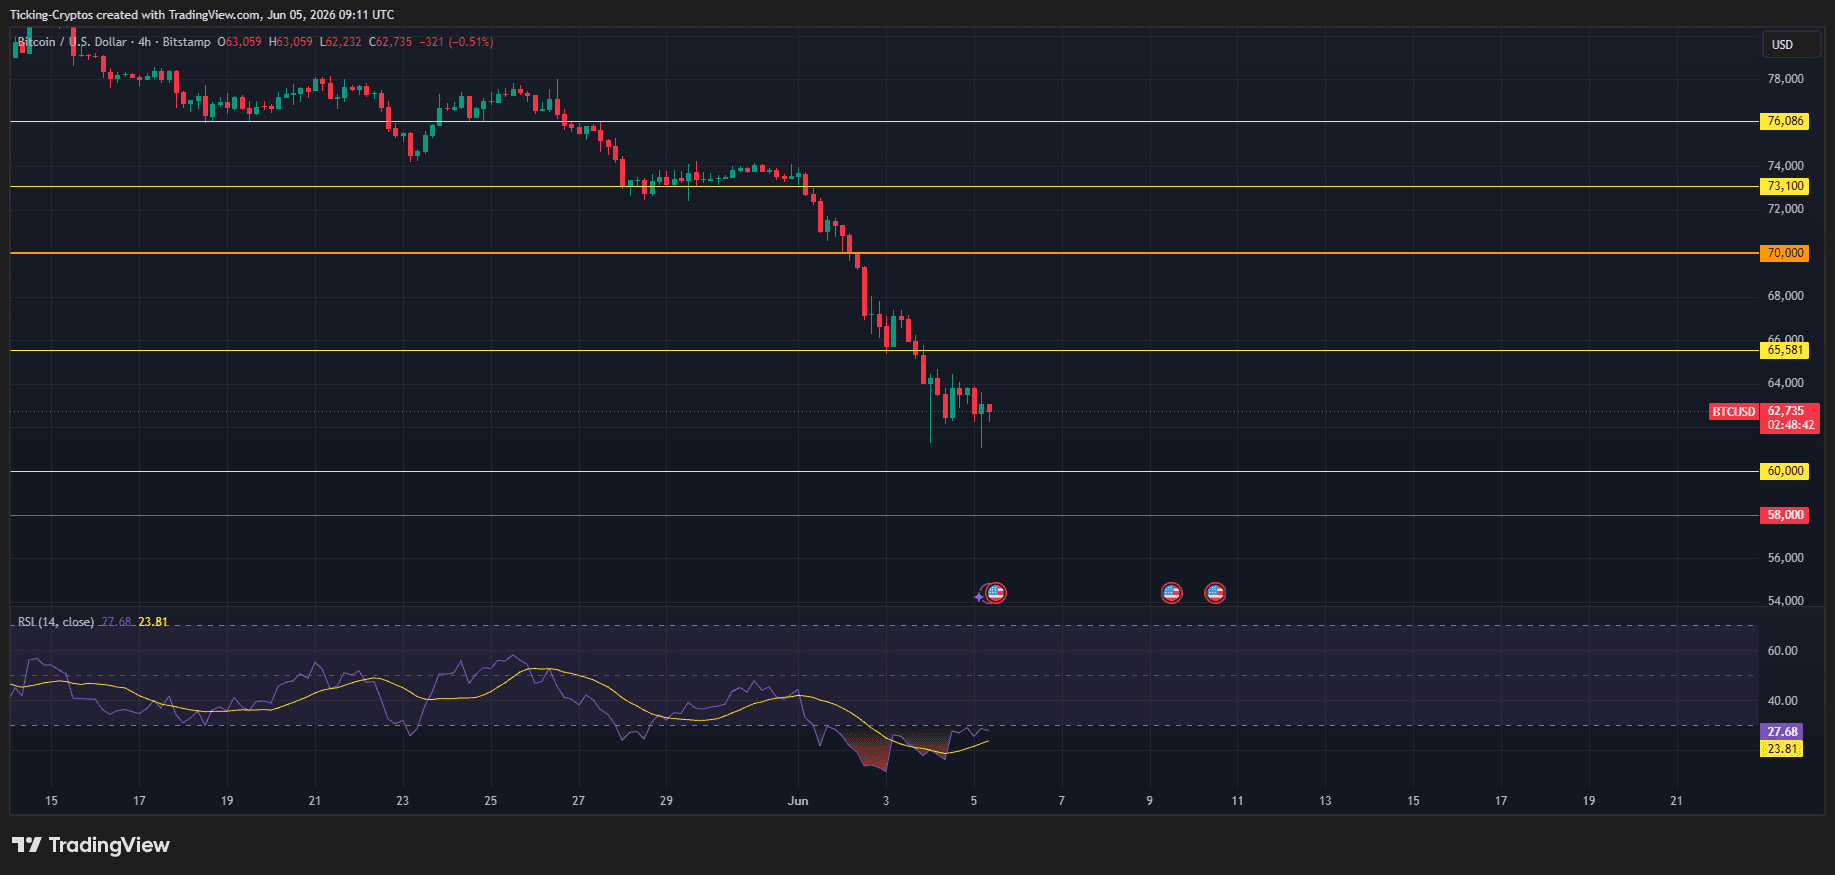
As depicted by live market action, BTC pushed down to an intraday low of $62,232 before experiencing minor structural consolidation toward $62,735.
- The RSI Factor: The 14-period Relative Strength Index (RSI) on the 4-hour chart is firmly embedded inside the oversold territory, printing a low reading of 27.68.
- Market Sentiment: Typically, an RSI falling below the 30 boundary suggests an asset is locally overextended to the downside. However, the accompanying volume spikes indicate aggressive spot distribution rather than a clean exhaustion of sellers, meaning a sudden trend reversal is not yet confirmed.
Why the Next Price Move is Worrisome
The breakdown below $63,000 is not just a localized correction; it signals a fundamental breakdown of the multi-month accumulation range. Market analysts point to several compounding technical factors that make the immediate outlook highly precarious.
1. Moving Average Convergence Flips to Resistance
Bitcoin remains pinned below its 20, 50, and 100-day moving averages. The velocity of the latest drop has widened the gap between the spot price and these core indicators, meaning any short-term relief rally will face immense overhead selling pressure at every minor step upward.
2. Institutional capitulation and ETF Outflows
The primary engine of the 2024–2025 bull cycle was consistent institutional demand via spot ETFs. The reversal of this trend into a historic 13-day outflow streak demonstrates that institutional risk metrics are forcing a reduction in crypto exposure. Without institutional buyers absorbing spot supply, order books remain thin and highly vulnerable to flash crashes.
💡Tip: Turn volatility into a long-term advantage
Market downturns often feel uncomfortable, but they can be some of the best opportunities for long-term investors. Instead of trying to time the market, a crypto savings plan lets you invest a fixed amount regularly and benefit from dollar-cost averaging (DCA). This means you automatically buy more crypto when prices are low and less when they are high, smoothing out volatility over time.
Start your Bitcoin savings plan today and steadily build your portfolio through every market cycle.
3. Macro Headwinds: Inflation and the Fed
Macro factors continue to act as a significant drag. Rising global crude oil prices, fueled by ongoing geopolitical tensions, have driven up corporate production and transportation costs. This sticky inflation has effectively erased the Federal Reserve's near-term rate-cut plans, with some officials even floating the possibility of interest rate hikes. Higher-for-longer interest rates structurally drain liquidity away from speculative risk assets like cryptocurrencies and redirect it toward traditional yield-bearing instruments.
Bitcoin Price Prediction: Next Critical Support Targets for BTC
With the $63,000 baseline now flipping into immediate overhead resistance, market observers are watching key horizontal support bands to evaluate where a macro price floor will settle.
Immediate Support: $60,000
The primary line in the sand for bulls sits directly at the $60,000 psychological milestone. According to multi-month trading data, this area represents a historic liquidity pocket where buyers have previously formed a defensive line. If $60,000 is invalidated on a weekly closing basis, it will likely spark an additional wave of automated stop-loss liquidations.
Macro Capitulation Floor: $58,000
Should macroeconomic or geopolitical conditions deteriorate further, the ultimate major defense line rests at $58,000. A descent into this territory would signify a deeper market capitulation, resetting open interest metrics completely before an organic base can be constructed.
Key Overhead Resistance: $65,581 and $70,000
For Bitcoin to neutralize its current bearish structure, the bulls must forcefully reclaim the $65,581 resistance line. Breaking above this level would provide the technical validation needed to shift short-term momentum and open the door for a retest of the major $70,000 supply zone.
Current Crypto Prices at a Glance
The systemic selloff has triggered broad-based declines across all high-market-cap digital assets. Based on aggregate market data, here is how the top cryptocurrencies are performing:
- Bitcoin ($BTC$): $62,735.00
- Ethereum ($ETH$): $1,664.72
- Binance Coin ($BNB$): $588.39
- XRP ($XRP$): $1.12
- Solana ($SOL$): $65.57
The cryptocurrency market is under significant downward pressure, causing the Ethereum price to fall below the psychologically important mark of $1,700. Ongoing macroeconomic stress factors, outflows from spot ETFs, and systematic liquidations of long positions have plunged the second-largest cryptocurrency into a deep correction phase.
Based on current market data from the 4-hour charts, Ethereum is currently in a heavily oversold area. For traders and investors, the urgent question now is where the price floor can be established.
Ethereum Price Analysis: ETH Coin Breaks Below $1,700
The market structure of Ethereum has continuously deteriorated over the past few weeks. After the bulls failed to sustain the price above the psychological level of $2,000, selling pressure accelerated significantly when the horizontal support zone at $1,800 was breached.
The recent drop pushed ETH down to a daily low of $1,661.90 before a slight consolidation began around the mark of $1,663.72.
- The RSI Factor: The Relative Strength Index (RSI) on the 4-hour chart has slipped deep into the oversold territory, currently sitting at a value of 19.00.
- Market Sentiment: An RSI value below 30 typically signals that an asset has fallen too much in the short term. However, the dominant bearish momentum indicates that a definitive trend reversal has yet to be initiated. Many traders are waiting for a stabilization of the overall market, which often heavily depends on the movements of the market leader $Bitcoin.
Crypto Crash? Invest Long-Term with a Savings Plan
Strong price declines can be unsettling, but they often provide attractive entry opportunities for long-term investors. With a crypto savings plan, you invest a fixed amount regularly and benefit from the cost-averaging effect (DCA). This way, you automatically buy more coins at lower prices and fewer at higher prices, without needing to find the perfect entry point.
Start your Crypto Savings Plan now and build your portfolio step by step.
The Next Critical Supports for ETH
As the $1,700 mark now serves as immediate resistance, market participants are monitoring the historical volume profile and key horizontal chart levels to identify potential turning points.
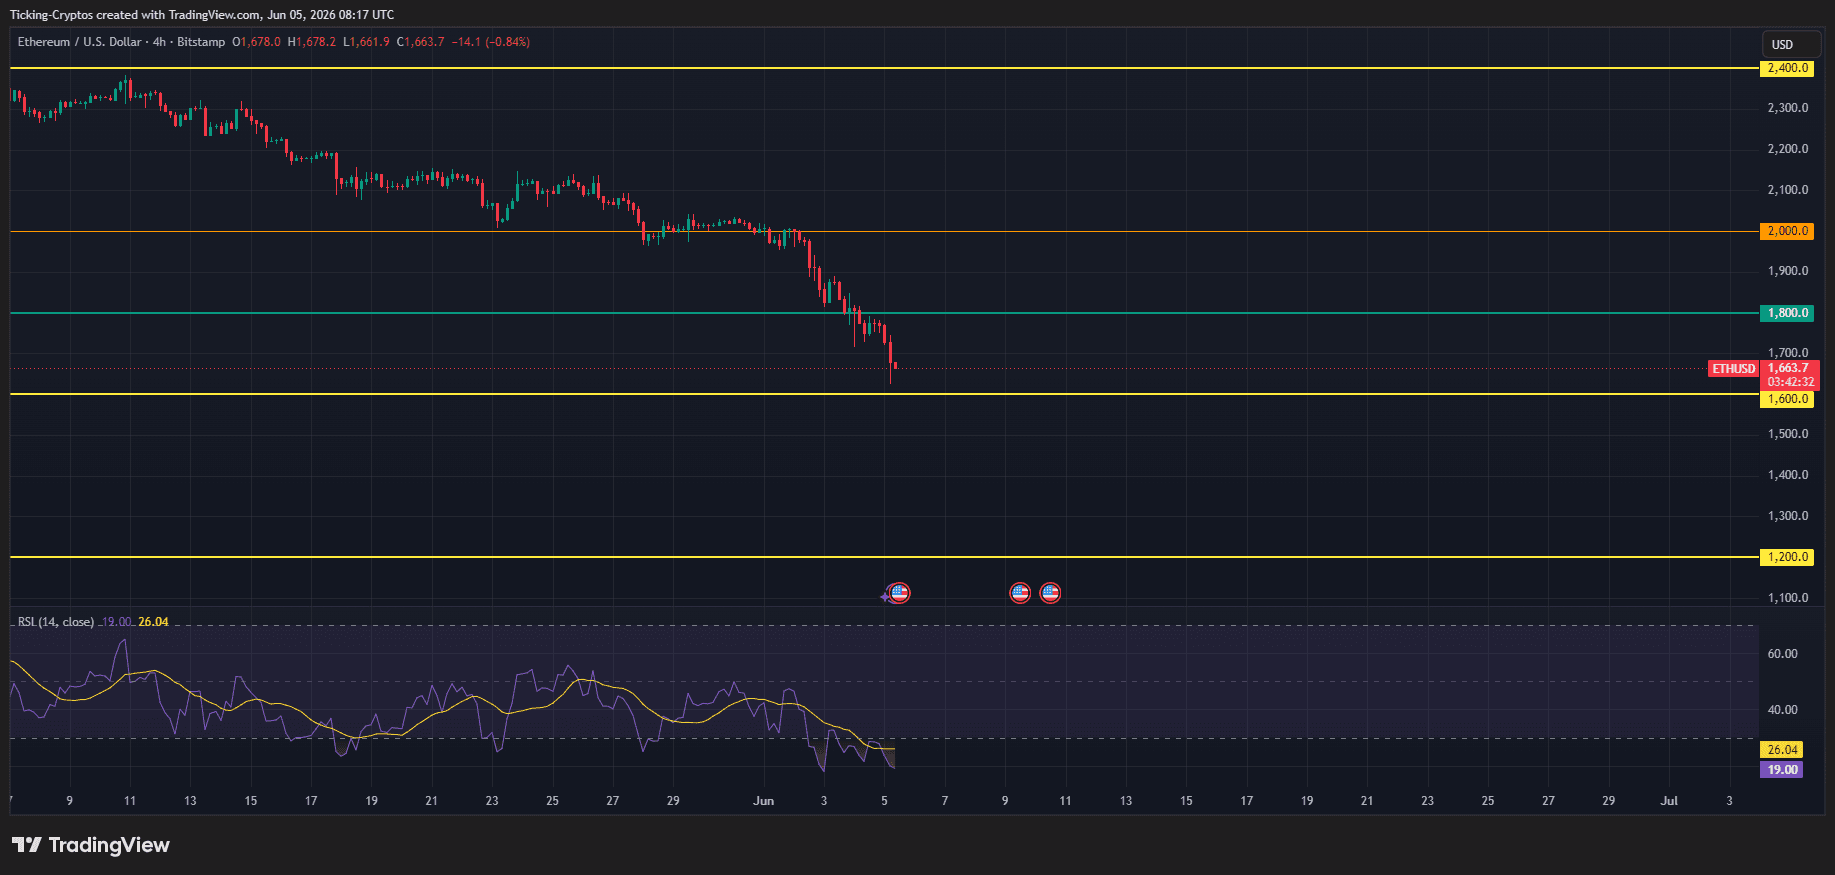
1. The Immediate Floor: $1,600
The $1,600 mark represents the primary defense line for the bulls. This area serves as a significant psychological barrier and has historically been a zone where more buyers have entered the market (accumulation zone). If the bulls do not act aggressively here, further liquidations are at risk.
2. Macro Support: $1,200
If macroeconomic pressure on risk assets persists or intensifies, the next major long-term price floor lies in the $1,200 range. A drop into this zone would signify a severe capitulation event for the current market cycle.
3. Resistances to be Reclaimed: $1,800 and $2,000
For the short-term bearish market structure to neutralize, $Ethereum must first establish a stable base above $1,600 and then reclaim the $1,800 mark. Only a sustainable breakout above this resistance would pave the way for a retest of the $2,000 level.
Current Crypto Prices at a Glance
The correction is currently affecting the entire digital currency space. Based on the latest aggregate data from major exchanges, the key cryptocurrencies are priced as follows:
- Bitcoin ($BTC): $62,641.90
- Ethereum ($ETH): $1,664.72
- Binance Coin ($BNB): $588.39
- XRP ($XRP): $1.12
- Solana ($SOL): $65.57
Zcash is one of the biggest losers in the crypto market today, with $ZEC price dropping by more than 10% in 24 hours while the broader market also trades under pressure. The sharp Zcash crash comes after a strong rally that pushed the privacy coin back into the spotlight, making it more exposed to profit-taking once sentiment turned bearish.
According to Binance market data, Zcash was trading around the $540 range, down more than 11% in 24 hours, with a market cap near $9 billion and 24-hour trading volume above $1.3 billion. The token also moved between a 24-hour high above $631 and a low near $538, showing how aggressive the sell-off became during the day.
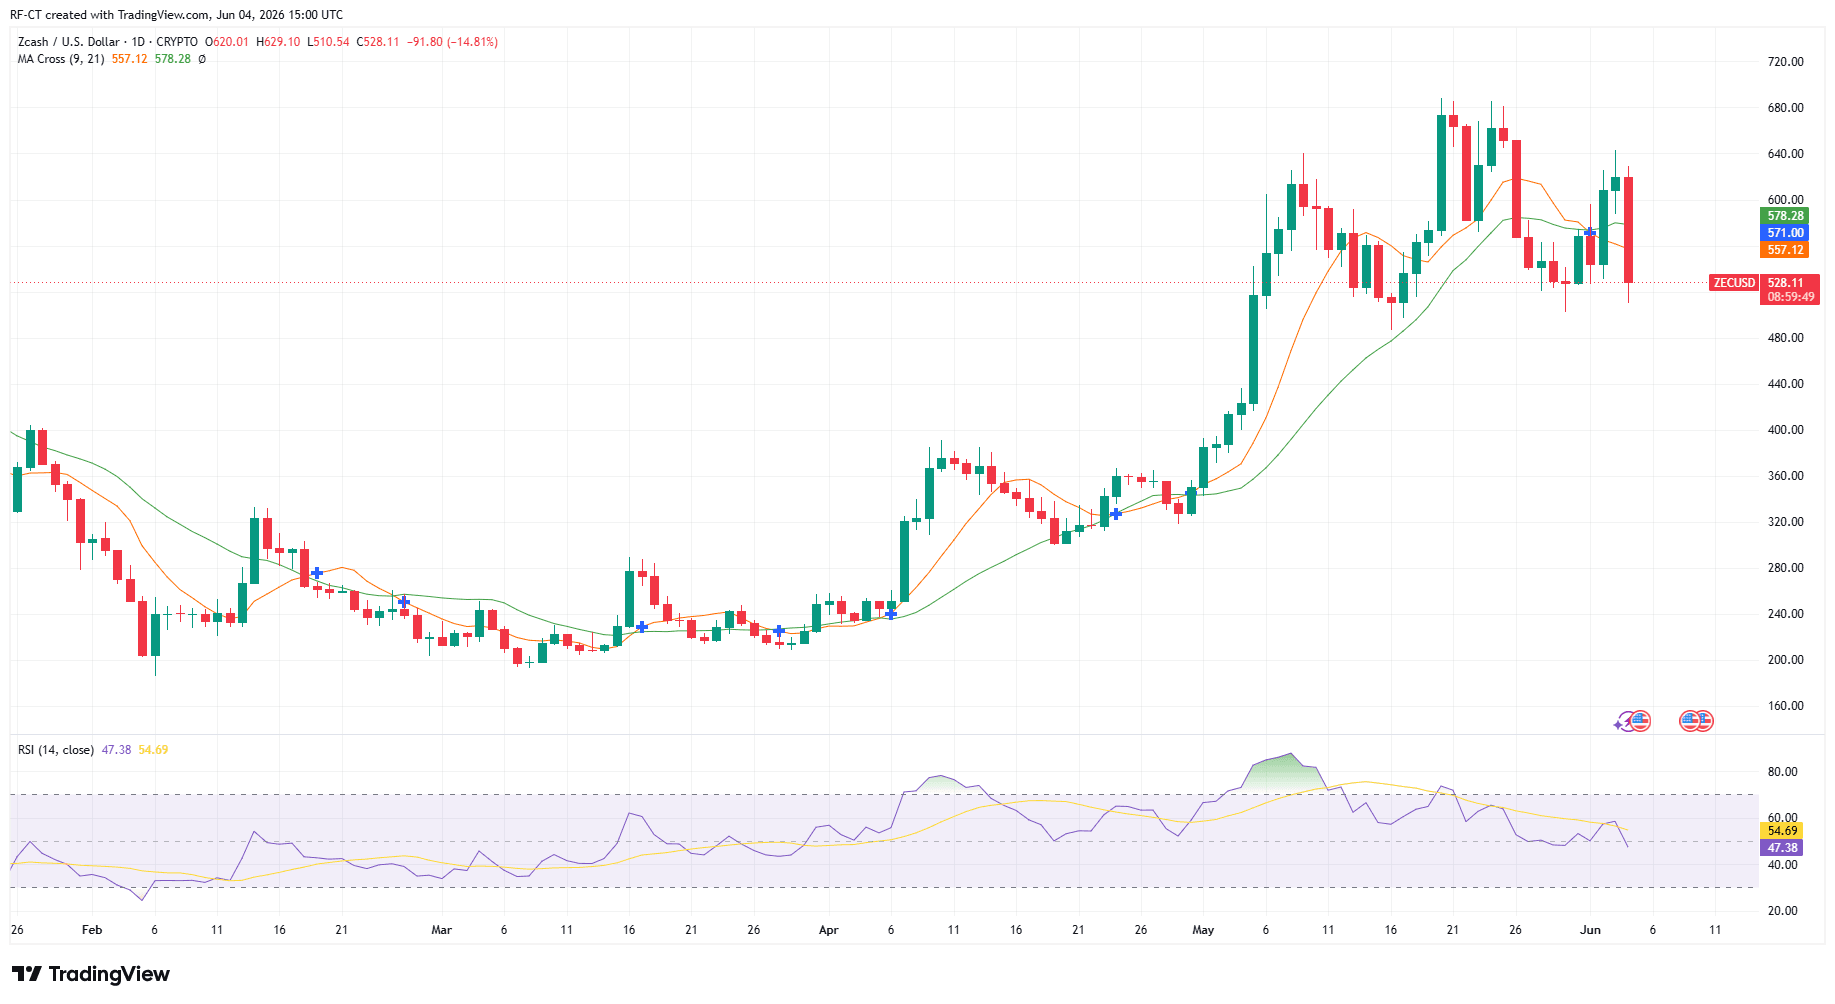
Why Is Zcash Crashing Today?
The main reason behind the Zcash crash is not one single event. Instead, ZEC is being hit by a combination of profit-taking, market-wide weakness, technical uncertainty, and fear around recent network-related headlines.
ZEC had already rallied strongly before the current correction. The privacy coin became one of the strongest performers in the market as traders rotated into privacy-focused crypto assets. Business Insider recently reported that Zcash had surged sharply over the past month while Bitcoin gained much less, driven by renewed interest in financial privacy and institutional attention around ZEC.
This matters because assets that rise the fastest often fall the hardest when the market turns red. Traders who entered ZEC earlier may now be locking in profits, especially after the coin moved into overextended territory.
ZEC Rally Made the Correction More Violent
Zcash did not enter this crash from a weak position. It entered it after a major rally.
That is why the correction looks sharper than in many other altcoins. When a token gains strong momentum in a short period, late buyers often enter near the top. Once the price starts falling, these buyers may exit quickly, adding more selling pressure.
This creates a chain reaction:
ZEC pumps strongly, traders chase the move, the broader market turns bearish, profit-taking starts, leveraged positions get squeezed, and the price drops faster than the rest of the market.
In simple terms, ZEC is crashing the most because it had more gains to give back.
Zcash Network Headlines Added More Fear
Another key reason behind the Zcash crash is the confusion around the network.
Reports on June 3 suggested that the Zcash blockchain appeared to stop producing blocks for several hours. However, later explanations said the issue may have been related to block explorers rather than the blockchain itself. CoinDesk reported that the apparent disruption was mainly linked to block explorers tracking activity incorrectly, not necessarily a full chain failure.
Zcash network was fully functional and that the apparent problem came from some block explorer applications being connected to a faulty node.
Even if the network was not actually down, the timing was bad. In a nervous market, headlines about a possible blockchain issue can quickly trigger fear, uncertainty, and doubt. For traders, that can be enough reason to sell first and ask questions later.
Emergency Orchard Bug Fix Increased Short-Term Risk Sentiment
The Zcash crash also comes shortly after an emergency upgrade related to the Orchard shielded pool.
Zcash Foundation released Zebra updates after engineers found and fixed a critical soundness bug in the Orchard Action circuit. Reports stated that the emergency response included Zebra 4.5.3 and Zebra 5.0.0, with no known exploit reported.
CoinMarketCap also reported that Zcash completed an emergency upgrade to fix the critical Orchard privacy pool bug, adding that no funds were lost and user privacy was not affected.
Still, the market does not always wait for full technical explanations. Words like “critical bug,” “emergency upgrade,” and “privacy pool” can create short-term panic, especially around a privacy-focused coin where trust in the protocol is essential.
Privacy Coin Narrative Is Still Strong, But Volatile
Zcash has benefited from a stronger privacy coin narrative in 2026. As blockchain transparency, AI surveillance, and financial data tracking become bigger topics, some traders see ZEC as a hedge against total on-chain visibility.
This narrative helped ZEC outperform many major cryptocurrencies recently. However, strong narratives can also become crowded trades. When too many traders are positioned in the same direction, any negative headline or market pullback can cause a sharp reversal.
That is exactly what appears to be happening now. ZEC is not necessarily crashing because the privacy narrative is dead. It is crashing because the rally became too crowded, too fast.
Zcash Price Analysis: Key Levels to Watch
From a technical perspective, ZEC’s drop below the $600 area is important. The token recently traded above $631 before falling toward the $540 range, according to Binance data.
The next important levels to watch are:
- $540–$520: This is the immediate support zone. If ZEC holds this area, the crash may slow down.
- $500: This is the psychological level. A break below $500 could trigger more panic selling.
- $600: This is now the key recovery level. If ZEC reclaims $600, traders may regain confidence.
- $630–$650: This is the recent resistance zone. A move back above this area would suggest that buyers are returning strongly.
For now, the chart suggests that ZEC is in a correction phase after a strong rally. The next move depends on whether buyers defend the $520–$540 zone or whether the sell-off continues toward $500.
Is the Zcash Crash a Buying Opportunity or a Warning Sign?
The Zcash crash could be seen in two ways.
For bullish traders, this may be a normal correction after a major rally. ZEC still has a strong privacy narrative, renewed market attention, and growing discussion around financial confidentiality in crypto.
For cautious traders, the crash is a warning that ZEC became overheated. The combination of a strong rally, emergency bug-fix headlines, and confusion around network activity shows that ZEC remains a high-volatility asset.
The most important point is that Zcash is not falling in isolation. The broader crypto market is also under pressure. But ZEC is falling harder because it had already become one of the most aggressive recent movers.
Final Thoughts: Why ZEC Is Crashing the Most
Zcash is crashing harder than the rest of the crypto market because it entered the sell-off from an overextended position. The recent ZEC rally attracted strong attention, but it also created room for heavy profit-taking.
At the same time, network-related confusion and the emergency Orchard bug fix added short-term fear. Even though reports suggest that no funds were lost and the blockchain was not necessarily offline, the headlines were enough to pressure traders during an already weak market.
For now, the Zcash crash looks like a mix of profit-taking, technical correction, market-wide weakness, and fear-driven selling. If ZEC holds above the $520–$540 support zone, the correction may stabilize. But if the price breaks below $500, the sell-off could deepen further.
$ZEC
Cardano Crash June 2026: ADA Drops Below $0.20
The Cardano crash in June 2026 has become one of the biggest talking points in the crypto market, as ADA fell sharply while the broader market also turned red. At the time of writing, Cardano is trading around $0.188, after falling from an intraday high near $0.214. This means ADA is down by roughly 12% in 24 hours, underperforming major cryptocurrencies such as Bitcoin, Ethereum, XRP, and Solana.
The broader crypto market is also under pressure. Bitcoin is trading around $63,900, down from an intraday high near $66,799, confirming that the weakness is not limited to Cardano alone. However, the size of ADA’s decline shows that Cardano is facing deeper selling pressure than most top crypto assets.
Why Is Cardano Crashing?
The Cardano crash is not caused by one single factor. Instead, ADA is being hit by a combination of market-wide weakness, technical breakdowns, and Cardano-specific concerns.
The first major reason is the broader crypto market decline. When Bitcoin falls sharply, altcoins usually react with even stronger losses. This pattern is visible again, as Bitcoin, Ethereum, Solana, XRP, and several other major coins are trading in the red.
But Cardano’s decline is stronger because ADA is also dealing with negative ecosystem sentiment. Recent reports highlighted concerns after TapTools, a Cardano analytics platform, announced that it would wind down operations after nearly four years. The platform cited executive departures and rising operating costs as reasons behind the shutdown.
TapTools Shutdown Adds Pressure on ADA
The TapTools shutdown matters because it is not only about one platform closing. For many investors, it raises broader questions about the strength of the Cardano ecosystem, especially during a difficult market cycle.
Cardano founder Charles Hoskinson also warned that more projects could fail in 2026, pointing to harsh market conditions and funding challenges across the ecosystem. His comments added more pressure to ADA at a time when traders were already nervous.
This created a negative feedback loop: weak market conditions hurt Cardano projects, project closures hurt sentiment, and weaker sentiment pushes ADA lower.
Cardano Summit 2026 Cancellation Hurts Confidence
Another factor behind the Cardano crash is the cancellation of Cardano Summit 2026 in Singapore. The event was cancelled after a treasury funding proposal failed to reach the required two-thirds supermajority under Cardano’s governance rules. A smaller EMURGO proposal for TOKEN2049 Singapore was approved, but the cancellation of the flagship summit still created concerns around governance alignment and ecosystem momentum.
This does not mean Cardano governance is broken. In fact, it shows that Cardano’s decentralized voting system has real power. However, from a market perspective, the failed vote added to the bearish narrative around ADA at the wrong time.
ADA Price Prediction: Can Cardano Recover?
From a technical perspective, ADA’s biggest problem is the loss of the $0.20 level. This is both a psychological and technical zone. If Cardano fails to recover above $0.20 quickly, traders may continue to treat the chart as bearish.
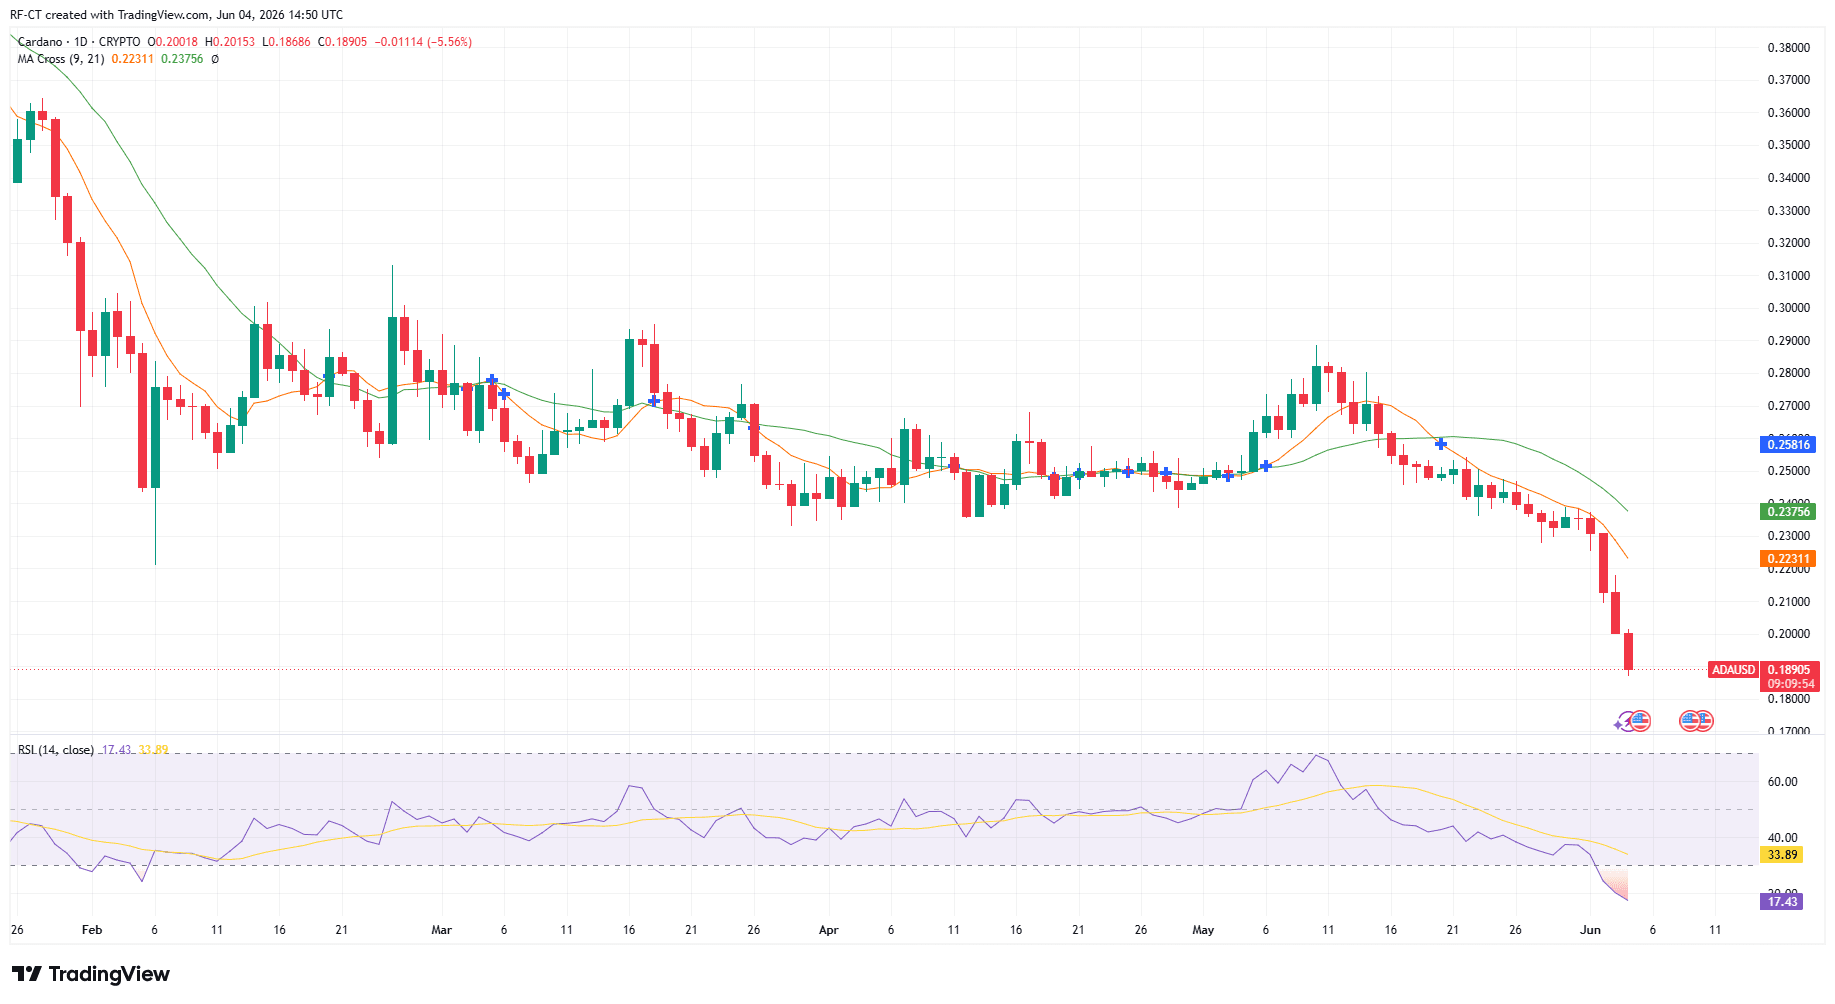
The next important recovery zone is between $0.22 and $0.24. ADA needs to reclaim this area to reduce bearish pressure and show that buyers are stepping back in. Without that recovery, Cardano could remain vulnerable to further downside.
However, if the broader crypto market stabilizes and Bitcoin rebounds, ADA could attempt a short-term recovery. The main question is whether Cardano-specific sentiment can improve after the recent TapTools shutdown, governance controversy, and ecosystem concerns.
Is the Cardano Crash a Buying Opportunity?
The Cardano crash June 2026 could attract long-term believers who see ADA at historically low levels. However, the current setup remains risky. ADA is not only falling because of the market; it is also facing real questions about ecosystem activity, project funding, and investor confidence.
For short-term traders, the most important level is $0.20. A reclaim of this level could trigger a relief bounce. For longer-term investors, the more important question is whether Cardano can prove that its ecosystem still has enough builders, users, and funding support to compete with faster-growing blockchain networks.
Final Thoughts
The Cardano crash in June 2026 shows how quickly sentiment can shift in the crypto market. ADA is falling harder than most major cryptocurrencies because the token is being hit from several sides at once: a weak crypto market, a technical breakdown below $0.20, the TapTools shutdown, Charles Hoskinson’s warning about possible ecosystem failures, and the cancellation of Cardano Summit 2026.
Cardano is not finished, but the market is clearly demanding stronger proof of growth. Until ADA reclaims key levels and ecosystem confidence improves, the Cardano price prediction remains cautious.
$ADA, $Cardano
The cryptocurrency market is experiencing renewed selling pressure, and Ripple’s native token has become one of the hardest-hit major altcoins. The latest technical developments point to an accelerating XRP price crash, with the asset violating a critical psychological and structural baseline that had previously kept buyers in the game.
Data from the 4-hour XRP/USD chart reveals that the digital asset has officially broken below the key 1.20 support level, shifting market control entirely over to the bears.
XRP Price Analysis: How XRP Coin Crashed
$XRP has been locked in a well-defined downtrend for several weeks. This structural decline is clearly demarcated by a prominent descending yellow trendline that has consistently capped any attempt at a bullish reversal.
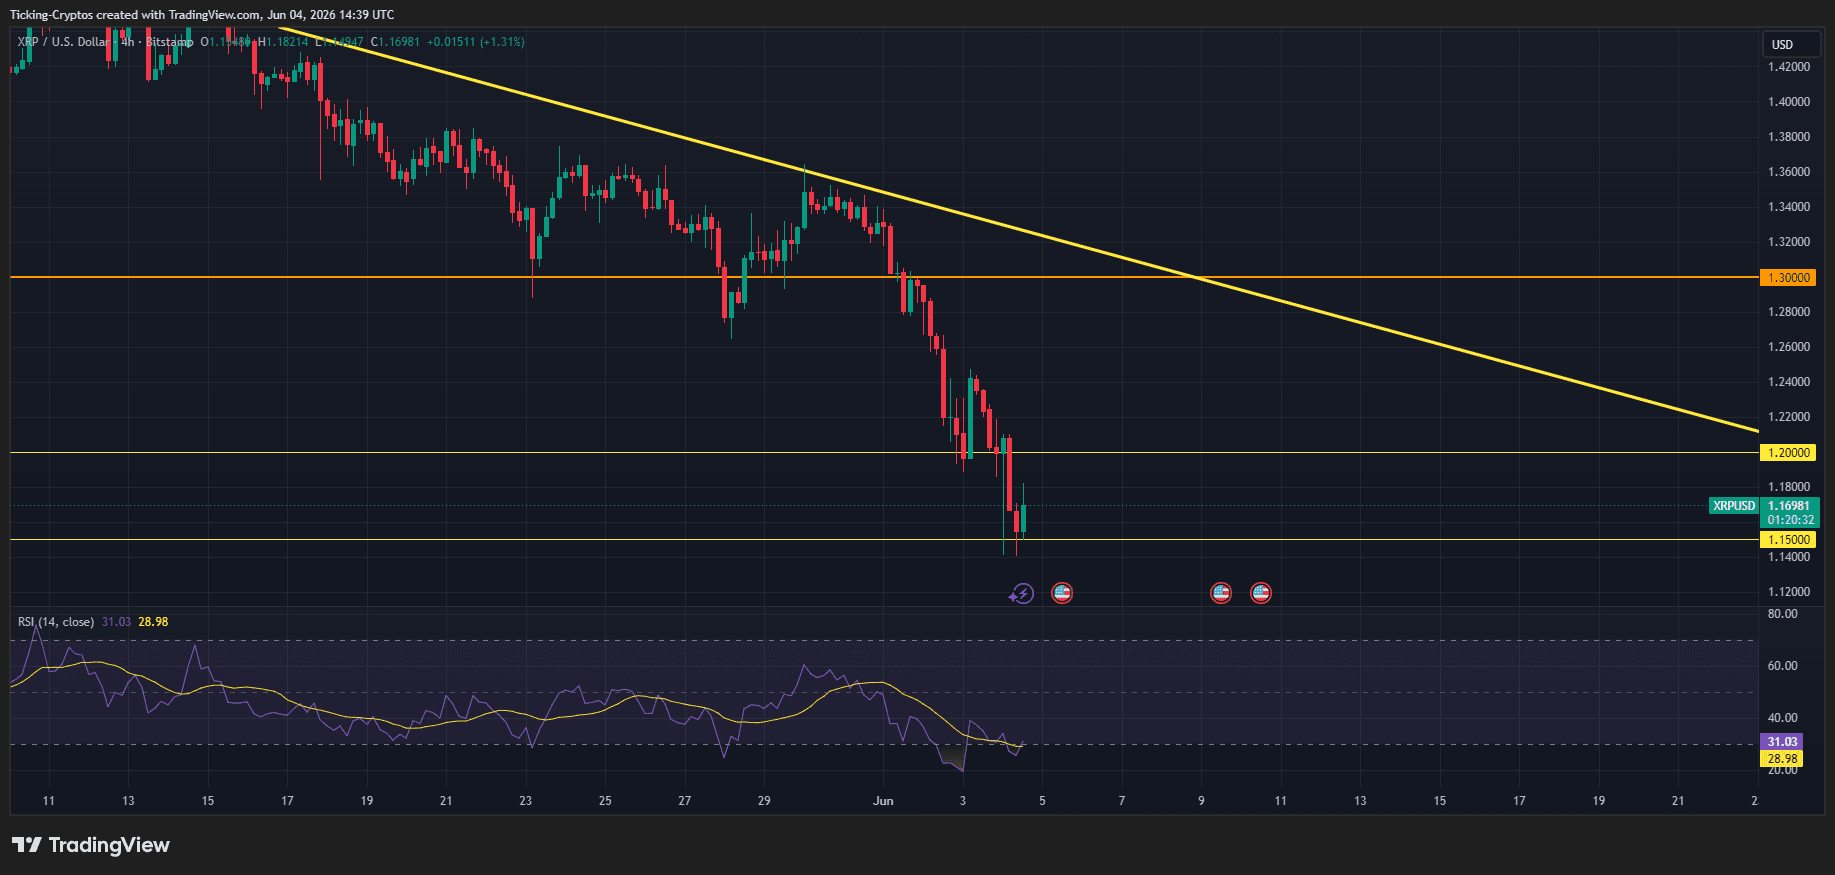
The breakdown unfolded rapidly through several distinct phases:
- The Consolidative Failure: XRP initially consolidated below a major horizontal resistance level at 1.30. Unable to muster enough buying volume to test or break this ceiling, sellers gradually pushed the asset lower.
- The Critical Breach: The horizontal line at 1.20 represented a vital historical defense mechanism for bulls. However, consecutive red 4-hour candles shows the price cutting straight through this level with expanding downward velocity.
- Current Position: XRP is actively trading well under the broken support, hovering near the 1.169-1.170 zone. The old support level at 1.20 has now structurally flipped into an immediate overhead resistance level.
Oversold RSI Signals Extreme Selling Intensity
The Relative Strength Index (RSI), which tracks the speed and change of price movements, further confirms the severity of this latest xrp price drop.
The 14-period RSI on the 4-hour interval has plummeted deep into oversold territory, currently printing at 31.03 with its moving average dropping even lower to 28.98. While an oversold RSI sometimes suggests a temporary relief bounce or stabilization could be on the horizon, it primarily highlights the sheer velocity of the institutional and retail distribution taking place.
Traders should exercise caution, as assets can remain technically oversold for extended periods during aggressive structural breakdowns. The fact that the price is hugging the bottom of its immediate trading range indicates that buyers are currently staying on the sidelines, waiting for a definitive macro bottom to form.
XRP Price Prediction: What's Next for XRP?
With the 1.20 support invalidated, market participants are scrambling to identify where the asset might find its next structural floor.
If the current bearish momentum cannot be arrested, the next major horizontal line of defense sits visibly at 1.15. A failure to hold the 1.15 level could accelerate panic selling, opening the door for an extension of the bear market toward psychological territory closer to the 1.00 mark.
For a bullish invalidation or recovery narrative to take shape, XRP would first need to reclaim the 1.20 level on high volume, flip it back to support, and eventually mount a challenge against the long-term descending yellow trendline. Until then, the path of least resistance remains firmly to the downside.
Crypto Price Today with the current Crash
The ongoing correction is not isolated to Ripple. The broader market showcases a synchronized retreat across major digital assets over the last 24 hours and trailing 7 days.
Below is a snapshot of the live prices and performances of the top market capitalization tokens:
| # | Name & Ticker | Price | 24h % | 7d % | Market Cap |
|---|---|---|---|---|---|
| 1 | Bitcoin ($BTC) | $63,969.86 | -4.17% | -11.91% | $1,281,865,048,826 |
| 2 | Ethereum ($ETH) | $1,771.81 | -4.44% | -10.52% | $213,831,951,334 |
| 3 | Tether ($USDT) | $0.9990 | +0.04% | +0.07% | $187,351,800,267 |
| 4 | BNB ($BNB) | $604.15 | -4.62% | -4.46% | $81,430,530,259 |
| 5 | USD Coin ($USDC) | $0.9999 | -0.01% | -0.01% | $75,968,697,174 |
| 6 | XRP ($XRP) | $1.17 | -4.58% | -9.65% | $72,639,040,656 |
| 7 | Solana ($SOL) | $69.81 | -5.81% | -13.52% | $40,394,064,107 |
| 8 | TRON ($TRX) | $0.3290 | -1.42% | -5.67% | $31,197,986,438 |
| 9 | Hyperliquid ($HYPE) | $67.17 | -7.16% | -18.11% | $17,030,547,488 |
| 10 | Dogecoin ($DOGE) | $0.08913 | -4.48% | -8.95% | $13,772,535,259 |
Decrypt
Pump.fun's GO bounty platform already has hundreds of listings following its pitch to let users “Pay ANYONE to do ANYTHING.”
An Orchard vulnerability that allowed undetectable counterfeiting of ZEC in its shielded pool has reignited debate over privacy coins.
Anthropic says AI now writes most of its code and runs increasingly complex research tasks, leaving people to decide which problems are worth solving.
Rep. Bryan Steil said he'll add language to the House congressional stock ban bill to cover prediction markets like Polymarket and Kalshi.
Demand for peptides fueled by the "looksmaxxing" trend has spawned a $100 million gray market paid for primarily with crypto.
U.Today - IT, AI and Fintech Daily News for You Today
After predicting XRP's historic 700% rally, DonAlt breaks silence on why corporate noise and AI exploits ruined crypto trading.
BlackRock sees fresh capital intake for the first time in thirteen days as Bitcoin finally sees renewed institutional growth despite plunging deeper in trading price.
Dogecoin founder presents a simple but timely question to the crypto community as Bitcoin price drops near $61,000.
Shiba Inu's market performance is hard to overestimate: funds are not flowing in.
The privacy coin Zcash (ZEC) has plummeted 60% following the revelation of a critical vulnerability that could have allowed attackers to mint an infinite supply of counterfeit tokens.
Blockonomi
TLDR:
- NEAR Intents has surpassed $20B in cumulative volume, driven by solver-based cross-chain routing.
- SwapKit generated $26.6M of $34.4M in total fees recorded across the NEAR Intents protocol.
- Wallets including Ledger, Trust Wallet, and Brave are already routing user transactions via NEAR.
- Confidential Intents recorded $22.6M in TVL within two months of launching on the NEAR network.
NEAR Intents has crossed $20 billion in cumulative volume, marking a notable milestone for the protocol’s cross-chain infrastructure.
The platform routes transactions across major networks including Ethereum, Solana, Tron, Base, BNB Chain, and Zcash. A growing list of wallets and swap protocols already directs user flow through NEAR’s settlement layer.
The architecture removes much of the friction traditionally associated with moving assets between blockchains, drawing attention from analysts tracking on-chain activity.
How the Intents Model Simplifies Cross-Chain Transactions
NEAR Intents operates on a solver-based model that replaces the conventional multi-step bridging process. Users sign a single intent rather than selecting a chain, bridge, DEX, gas token, and transaction route manually. Solvers then compete to fill that intent at the best available price and path.
Once a solver identifies the optimal route, NEAR’s verifier settles the state change atomically. If the intent cannot be filled under the stated conditions, the transaction does not execute. This design removes execution risk for end users who only need to specify the desired outcome.
As crypto analyst Karamata noted on X, solvers can access CEX liquidity, DEX liquidity, off-chain inventory, and bridges simultaneously.
@NEARProtocol Intents are kinda insane now that it just crossed $20B cumulative volume. (near:native)
The tech flips the old crypto UX for anyone moving money across chains.
Instead of picking a chain, bridge, DEX, gas token, route, approving transactions, and praying… https://t.co/WjwBZ4K2jT pic.twitter.com/bF5d1tH25c
— Karamata_
(@Karamata2_2) June 4, 2026
That access is not constrained to a single liquidity pool, which gives the system broader reach than traditional DEX routing.
Fee Data Reflects Wide Integration Across the Ecosystem
SwapKit has emerged as the largest contributor to NEAR Intents fee volume, generating $26.6 million of the total $34.4 million recorded so far. Every application built on the SwapKit SDK gains access to NEAR Intents liquidity by default.
That integration has significantly broadened the protocol’s user base without requiring direct adoption from end users.
Other contributors include Zodl/Zashi with approximately $3.6 million in fees, alongside routing from Ledger, ShapeShift, Rango Exchange, Thorwallet, Brave, Cake Wallet, Trust Wallet, Bitget Wallet, OpenOcean, Rubic, Li.Fi, KyberNetwork, and StableFlow.
The breadth of integrations suggests the protocol is already embedded in mainstream crypto workflows. Many users routing swaps through these platforms may be interacting with NEAR infrastructure without knowing it.
Confidential Intents, a newer feature, has also gained early traction. The privacy-focused layer accumulated $22.6 million in total value locked within two months of going live. That pace points to demand for on-chain privacy features as the cross-chain space matures.
Price Structure and Market Sentiment Around NEAR
On the price side, NEAR has pulled back nearly 35% from recent local highs amid broader market weakness. Analyst @speartrades_app pointed out that the chart structure remains relatively intact despite the decline.
A specific support zone, described as a purple region on the chart, has consistently attracted buyers throughout this cycle.
As long as NEAR holds above that support level, the correction can be read as a normal retracement alongside Bitcoin’s broader pullback.
A decisive breakdown below that level, however, could shift market sentiment and trigger a deeper move lower. Traders are watching the zone closely for the next directional cue.
Beyond price, the protocol is moving into its next phase through Confidential Intents. The feature recorded $22.6 million in confidential TVL within just two months of going live.
If cross-chain privacy becomes a standard expectation, NEAR’s infrastructure positions it early in that market.
The post NEAR Intents Hits $20B Volume as Cross-Chain Adoption Rises appeared first on Blockonomi.
Key Takeaways
- The yellow metal is poised for a weekly decline, falling approximately 1.6% over seven days to trade near $4,465 per ounce.
- Since late February, the Strait of Hormuz remains blocked due to military operations between the U.S. and Iran, causing crude prices to surge and stoking inflation worries.
- Market expectations now point to the Federal Reserve maintaining current interest rates until 2026, followed by increases in early 2027.
- A U.S.-negotiated ceasefire proposal between Israel and Lebanon was rebuffed by Hezbollah, reducing prospects for a swift Iran peace agreement.
- Despite its reputation as a crisis hedge, gold has plummeted approximately 12% across the last three-month period.
The precious metal is experiencing downward pressure this week as escalating Middle Eastern hostilities keep crude oil elevated and amplify concerns about persistent inflation. The asset has shed roughly 12% over a three-month span despite ongoing geopolitical turmoil, with an appreciating greenback and climbing rate projections weighing heavily on prices.
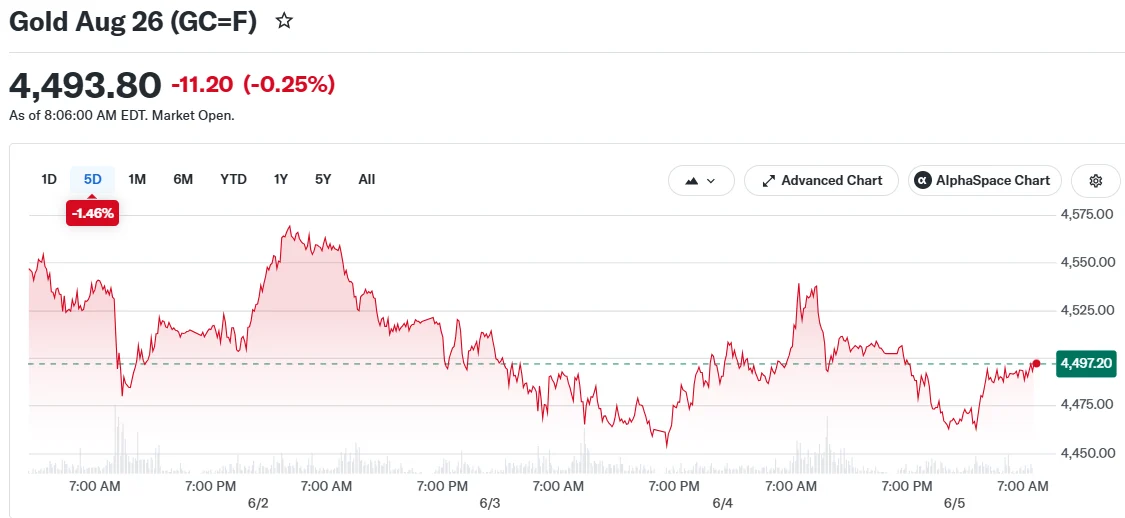
Hormuz Blockade Amplifies Energy Costs and Inflation Pressures
Since the final days of February, the Strait of Hormuz has remained shut following coordinated U.S.-Israeli strikes against Iranian targets. This critical waterway normally carries approximately 20% of global crude oil shipments, and its closure has severely disrupted worldwide supply chains while driving energy costs upward.
Saxo Bank’s research team highlighted that accelerated inventory depletion resulting from the blockade will likely trigger significant fuel price spikes. Their analysis suggests energy markets will remain under pressure for a considerable duration ahead.
These elevated energy costs are now translating into widespread inflation anxiety across global economies. In response, monetary authorities worldwide—particularly the Federal Reserve—are maintaining tighter policy stances for extended timeframes.
CME’s FedWatch Tool currently projects the Fed will leave benchmark rates unchanged throughout the remainder of 2026 before implementing increases during the first quarter of 2027.
This interest rate environment creates headwinds for gold. Since the precious metal generates no yield, elevated interest rates make bonds and other income-producing instruments more appealing to investors by comparison.
Lebanon Ceasefire Collapse Clouds Iran Peace Negotiations
Prospects for diplomatic resolution between Washington and Tehran took a hit following Hezbollah’s rejection of a ceasefire framework for the Israel-Lebanon border conflict.
Naim Kassem, leading Hezbollah, denounced the proposed terms as “absurd, humiliating, and insulting.” He emphasized that complete Israeli military withdrawal from Lebanese territory must precede any cessation of Hezbollah operations.
Tehran has consistently positioned an end to Lebanese hostilities as a prerequisite for advancing its own peace discussions with American negotiators. Hezbollah’s categorical refusal now complicates that diplomatic pathway.
This development emerged as Israeli military operations resulted in at least four casualties inside Lebanon. Lebanese armed forces deployed personnel into southern regions on Thursday, according to official media sources reported by the Associated Press.
Traditional Crisis Hedge Underperforms Amid Conflict
Historically, gold has functioned as a reliable protective asset during periods of geopolitical instability and economic anxiety. However, this particular conflict has defied that pattern.
Spot prices edged down 0.2% on Friday, settling around $4,465 per ounce. Futures contracts declined 0.3% to reach $4,492 per ounce. The weekly performance shows a 1.6% retreat.
Across the previous three-month window, the metal has surrendered approximately 12% of its value. A strengthening U.S. dollar compounds these losses. Since gold trades in dollar-denominated contracts, dollar appreciation raises purchasing costs for international buyers.
The greenback’s strength stems partially from America’s position as a substantial energy producer, which market participants view as providing relative insulation from oil price volatility driven by the Middle East crisis.
Market participants are now focused on Friday’s employment data release, seeking insights into how American labor markets are withstanding economic strain from the ongoing conflict.
The post Why Gold’s Traditional Safe-Haven Appeal Is Failing During the Iran Conflict appeared first on Blockonomi.
Key Takeaways
- Broadcom‘s disappointing revenue outlook sent shares plummeting 13%, eliminating $286 billion in shareholder value
- The benchmark S&P 500 index faces potential end to its impressive nine-week rally as technology shares lead market retreat
- Major semiconductor manufacturers including AMD, Micron, Nvidia, and Taiwan Semiconductor experienced declines during Friday’s premarket session
- Quantum computing firm Quantinuum’s Nasdaq launch disappointed investors, closing nearly flat at just 0.6% above its $60 offering price
- Cryptocurrency weakness pressured digital asset-related equities including Coinbase, Robinhood, and Strategy
The semiconductor industry experienced significant turbulence following [[LINK_START_1]]Broadcom[[LINK_END_1]]’s Wednesday evening announcement of revenue projections that fell short of market expectations. Thursday’s trading session saw the company’s shares crater 13%, obliterating $286 billion in market capitalization within hours.
Broadcom Inc., AVGO
The downturn rapidly contaminated the broader chip industry. Advanced Micro Devices declined 2.2%, while Micron Technology slipped 2.5% lower. Graphics chip giant Nvidia shed 1.1%, and Taiwan Semiconductor Manufacturing Company retreated 1.7% during Friday’s premarket hours.
The benchmark S&P 500 index has exhibited minimal movement since markets opened Monday, registering gains of less than 0.1% for the trading week. Friday morning futures contracts indicated a 0.4% decline, positioning the index to potentially terminate its nine-consecutive-week advance.
Semiconductor equities had served as primary catalysts propelling markets toward unprecedented highs. However, sentiment shifted dramatically following Broadcom’s underwhelming projections, with selling pressure subsequently expanding across additional sectors.
AI-Related Equities Experience Downward Momentum
The weakness extended well beyond traditional chipmakers. Optical components manufacturer Lumentum declined 3.5% in premarket activity.
Server equipment producers Dell Technologies and Super Micro Computer each retreated approximately 2.7%. These enterprises have maintained strong correlations with artificial intelligence infrastructure expenditures, and declined in tandem with semiconductor stocks.
Guidewire Software plummeted 14% following the release of full-year projections that disappointed analysts. Samsara decreased 3% after the enterprise software provider indicated its second-quarter outlook would merely align with, rather than surpass, analyst estimates.
Athletic apparel retailer Lululemon tumbled between 12% and 13% after reducing revenue expectations for both the upcoming quarter and complete fiscal year. Management attributed the revision to tensions with the company’s founder and merchandise that failed to resonate with consumers.
Electric vehicle manufacturer Tesla advanced 0.2% following a JPMorgan analyst upgrade from underweight to neutral.
Quantinuum Public Offering Disappoints Market Watchers
Quantum computing enterprise [[LINK_START_5]]Quantinuum[[LINK_END_5]] commenced trading on the Nasdaq exchange Thursday after completing a much-anticipated initial public offering at $60 per share. Shares temporarily jumped 13% above the IPO price before surrendering virtually all intraday gains.
The stock concluded its inaugural trading session at $60.38, representing merely a 0.6% premium to the offering price. Friday premarket activity showed additional erosion of 2% to 3%.
Digital Asset Weakness Impacts Associated Equities
Bitcoin and alternative cryptocurrencies prolonged their recent deterioration, creating headwinds for companies with cryptocurrency exposure.
Coinbase Global and Robinhood Markets each declined approximately 0.7% in premarket trading. Strategy shed 1.4%.
Friday’s comprehensive market retreat underscores growing investor hesitation following multiple weeks of advances driven predominantly by artificial intelligence and semiconductor-related investments. Broadcom’s revenue warning served as the catalyst, with selling pressure subsequently permeating semiconductors, software platforms, and cryptocurrency-linked securities.
The post Chip Stocks Tumble: AMD, Nvidia, Micron Decline Following Broadcom’s Revenue Warning appeared first on Blockonomi.
TLDR
- Samsara delivered fiscal Q1 2027 earnings per share of $0.17, surpassing analyst expectations of $0.13, while revenue reached $478.8 million versus forecasts of $455.2 million.
- The company’s annual recurring revenue reached the $2 billion milestone, representing a 30% year-over-year increase, while ARR from high-value customers generating over $1 million annually soared 62%.
- Management elevated its full-year fiscal 2027 revenue projection to a range of $2.005–$2.013 billion, exceeding both previous company guidance and Wall Street forecasts.
- Shares declined approximately 3% during premarket hours to $34.18, following the previous session’s close of $35.21.
- RBC Capital increased its price objective to $42 from $41 while reiterating its Outperform rating, though the upgrade failed to prevent the morning selloff.
Samsara (IOT) delivered impressive financial results on Thursday, yet shareholders responded by heading for the exits. The stock retreated to $34.18 during Friday’s premarket session, representing roughly a 3% decline from Thursday’s closing price of $35.21.
Samsara Inc., IOT
The connected operations specialist reported adjusted earnings per share of $0.17 for its first quarter of fiscal 2027, handily exceeding the analyst consensus of $0.13. Top-line performance was equally strong, with revenue hitting $478.8 million — a 31% year-over-year surge that comfortably topped expectations of $455.2 million.
$IOT Q1’27 EARNINGS HIGHLIGHTS
Revenue: $478.8M (Est. $455.2M)
; +31% YoY
FY Guide:
— Wall St Engine (@wallstengine) June 4, 2026
For the first time in company history, annual recurring revenue surpassed the $2 billion threshold, marking a 30% increase from the same period last year. Net new ARR expanded 30% to reach $100.7 million, while the company’s enterprise segment showed particular strength — ARR from customers with annual spending exceeding $1 million skyrocketed 62%, marking the fourth consecutive quarter of acceleration in this critical metric.
Profitability metrics continued their upward trajectory, with adjusted operating margin expanding to 19% compared to 14% in the prior-year period. Management attributed the margin expansion to enhanced operational efficiency across its sales organization, research and development activities, and general administrative functions.
Chief Executive Officer Sanjit Biswas emphasized the company’s achievement of GAAP earnings per share profitability for the third straight quarter. He identified increasing labor shortages among Samsara’s customer base as a significant catalyst driving adoption of the company’s AI-driven automation solutions.
AI Data Center Buildout Is Lifting Demand
Samsara also highlighted the accelerating construction of AI data centers as a positive industry trend. The company noted that substantial infrastructure investments — spanning power generation facilities, cooling systems, and electrical grid enhancements — are channeling capital into the physical industries that comprise its core market, generating sustained demand momentum.
The customer base continued expanding at the high end, with the quarter concluding with 3,363 accounts generating at least $100,000 in ARR and 190 accounts surpassing the $1 million threshold. Management secured 11 new contracts exceeding $1 million in net new annual contract value, representing the company’s second-strongest quarterly performance in this category.
Newer product offerings maintained strong traction, accounting for over 20% of net new annual contract value for the second quarter running.
Guidance Nudged Up, But Not Enough for the Bulls
Looking ahead to the full fiscal 2027 year, Samsara elevated its adjusted EPS forecast to a range of $0.70–$0.72, up from the previous range of $0.65–$0.69 and exceeding the analyst consensus of $0.68. The company also increased its revenue guidance to $2.005–$2.013 billion, compared to its earlier projection of $1.965–$1.975 billion and above Street expectations of $1.971 billion.
For the upcoming second quarter, management projected revenue between $482–$484 million, marginally ahead of Wall Street’s $480 million estimate — a modest beat that failed to generate enthusiasm.
This limited upside cushion appears to be driving the negative market reaction. IOT shares had already climbed approximately 20% following the company’s March earnings report, establishing elevated expectations for continued post-earnings momentum.
RBC Capital adjusted its price target upward to $42 from $41 while maintaining its Outperform rating, a move that reflected optimism tempered with caution.
The stock currently trades significantly below its 52-week peak of $47.47, though it remains well above its 52-week floor of $23.38.
The post Samsara (IOT) Stock Drops Despite Crushing Earnings Estimates and Raising Guidance appeared first on Blockonomi.
Key Takeaways
- Stifel reduced its GWRE price objective to $200 from $225 while maintaining a Buy recommendation
- Third-quarter ARR fell short of both Wall Street consensus and Stifel’s projections despite staying within guidance
- Shares declined approximately 14% during after-hours trading following the earnings release
- GWRE has dropped 28% in the last six months and currently carries a P/E ratio of 71
- RBC Capital lowered its price target to $215 from $250 while retaining its Outperform rating
Guidewire Software (GWRE) delivered third-quarter financial results that surpassed expectations for both earnings and revenue, yet the critical Annual Recurring Revenue (ARR) figure fell below analyst forecasts.
$GWRE (Guidewire) Q3 FY2026 Earnings
Cloud + AI momentum accelerating…
Strongest growth quarter in recent memory with raised full-year guidance
________________________________________
KEY METRICS (Q3 FY2026)
— Emmanuel – Big Tech & AI Investor (@EmmanuelInvest) June 4, 2026
The company reported earnings per share of $0.82, exceeding the consensus estimate of $0.74. Revenue reached $372.5 million, topping projections of $355.99 million. While these metrics appeared solid on the surface, the ARR shortfall relative to both Street consensus and Stifel’s expectations triggered a roughly 14% after-hours selloff.
The shares were already facing headwinds before the quarterly report. GWRE has shed 28% of its value over the trailing six-month period and currently commands a price-to-earnings multiple of 71. Such elevated valuation metrics leave minimal margin for error.
Guidewire Software, Inc., GWRE
Company leadership addressed the ARR disappointment directly, attributing it to deal timing dynamics rather than underlying demand weakness. Executives highlighted a robust sales pipeline, encouraging Q4 momentum, and fully ramped ARR expansion as evidence supporting their confidence in full-year and medium-term projections. Annual ARR guidance remained unchanged.
Stifel recognized investor disappointment but stood firm on its constructive thesis. The firm observed that the absence of a guidance raise creates near-term uncertainty, particularly given the relatively elevated expectations following year-to-date underperformance.
Stifel’s Investment Perspective
Notwithstanding the price target reduction from $225 to $200, Stifel characterized the post-earnings decline as an attractive entry point for investors. The firm highlighted several positive developments: early momentum in newer offerings ProNavigator and PricingCenter, enhanced subscription and support gross margin performance, and the historically stronger seasonal patterns expected in Q4.
Stifel also identified the company’s forthcoming annual conference and analyst day as potential positive catalysts, anticipating upward revisions to medium-term growth projections at those events.
Maintaining such an optimistic stance while shares trade near multi-month lows requires conviction, yet Stifel has preserved its Buy rating.
RBC Capital’s Revised Outlook
RBC Capital pursued a similar course, lowering its Guidewire price objective to $215 from $250. While maintaining its Outperform rating, the firm pointed to the mixed full-year guidance framework, specifically the ARR guidance trailing consensus expectations, as justification for the adjustment.
When two prominent research firms simultaneously reduce price targets following the same earnings report, it signals clear disappointment across the analyst community, even as management holds firm on its outlook.
GWRE settled at $151.17 during Thursday’s regular session, with the after-hours decline reflecting investor reaction to the ARR miss. InvestingPro currently classifies the stock as overvalued compared to its Fair Value assessment, introducing an additional consideration for investors evaluating potential entry points.
The next significant milestones on the corporate calendar include fourth-quarter earnings and the company’s annual analyst day, where management has indicated potential upward revisions to medium-term financial targets.
The post Guidewire (GWRE) Stock Plunges 14% on ARR Miss — Should Investors Buy the Dip? appeared first on Blockonomi.
CryptoPotato
Crypto markets are in shambles again, with bitcoin dipping to $61,000 earlier this morning for the first time in four months. Although some alts managed to withstand the calamity at first, they have joined the ride with even more profound losses.
Ripple’s XRP is no exception. The asset stood above $1.55 just a few weeks ago, but the subsequent rejection drove it south hard. It plunged to just under $1.10 today, which marked its lowest price position since before the US presidential elections in late 2024.
Despite the short-term pain, popular analyst EGRAG CRYPTO outlined a more macro perspective, suggesting that the real story may just be beginning.
What’s Next for XRP?
The analyst noted that the cross-border token has approached a pivotal moment that could define its next major cycle move. By drawing parallels to early 2017, EGRAG highlighted a historical pattern where XRP briefly slumped below key structural support, which they referred to as the “Bifrost Bridge,” before it initiated a powerful expansion move.
That bull phase began with a sharp downside wick, designed to flush out weak hands and reset market positioning, EGRAG added.
“The big question: Will we get another massive liquidity wick… or will price build a solid brick structure above support?” – The analyst asked now.
They predicted that another deep wick could “shake out weak hands, create maximum fear, sweep liquidity fast, and form the final macro reset.” This would be the so-called “wick” scenario, in which a sudden yet aggressive move lower challenges the broader market’s positioning.
The Brick Structure
The alternative in EGRAG’s analysis is the “brick” structure, where Ripple’s native token consolidates above key support levels such as $1.00 and $1.10 and gradually builds a reliable base. This scenario would signal stronger accumulation and market confidence, potentially allowing for an earlier upside continuation without the need for the aforementioned dramatic flush.
Despite the uncertainty, the analyst leans toward the first outcome:
“Personally…I still think the market wants one final emotional move before the real expansion,” they concluded.
The post XRP at a Crossroads: ‘Wick or Brick’ Could Decide the Next Macro Move appeared first on CryptoPotato.
This Friday, we examine Ethereum, Ripple, Cardano, Binance Coin, and Hyperliquid in greater detail.
Ethereum (ETH)
This week was one of the worst of this bear market as most cryptocurrencies fell by double digits. Ethereum was no different, crashing 17%. Unfortunately, the $1,800 support could not hold the bears back and quickly turned into resistance.
At the time of this post, the ETH price is below $1,700 and struggling to find buyers. The most likely candidate for a bounce could be the support at $1,500. The price reversed on that level back in early 2025.
Looking ahead, this bear market is in full swing, with no signs it is about to end. For this reason, prepare mentally for lower lows until a bottom is found. That could see ETH approach $1,000 again.
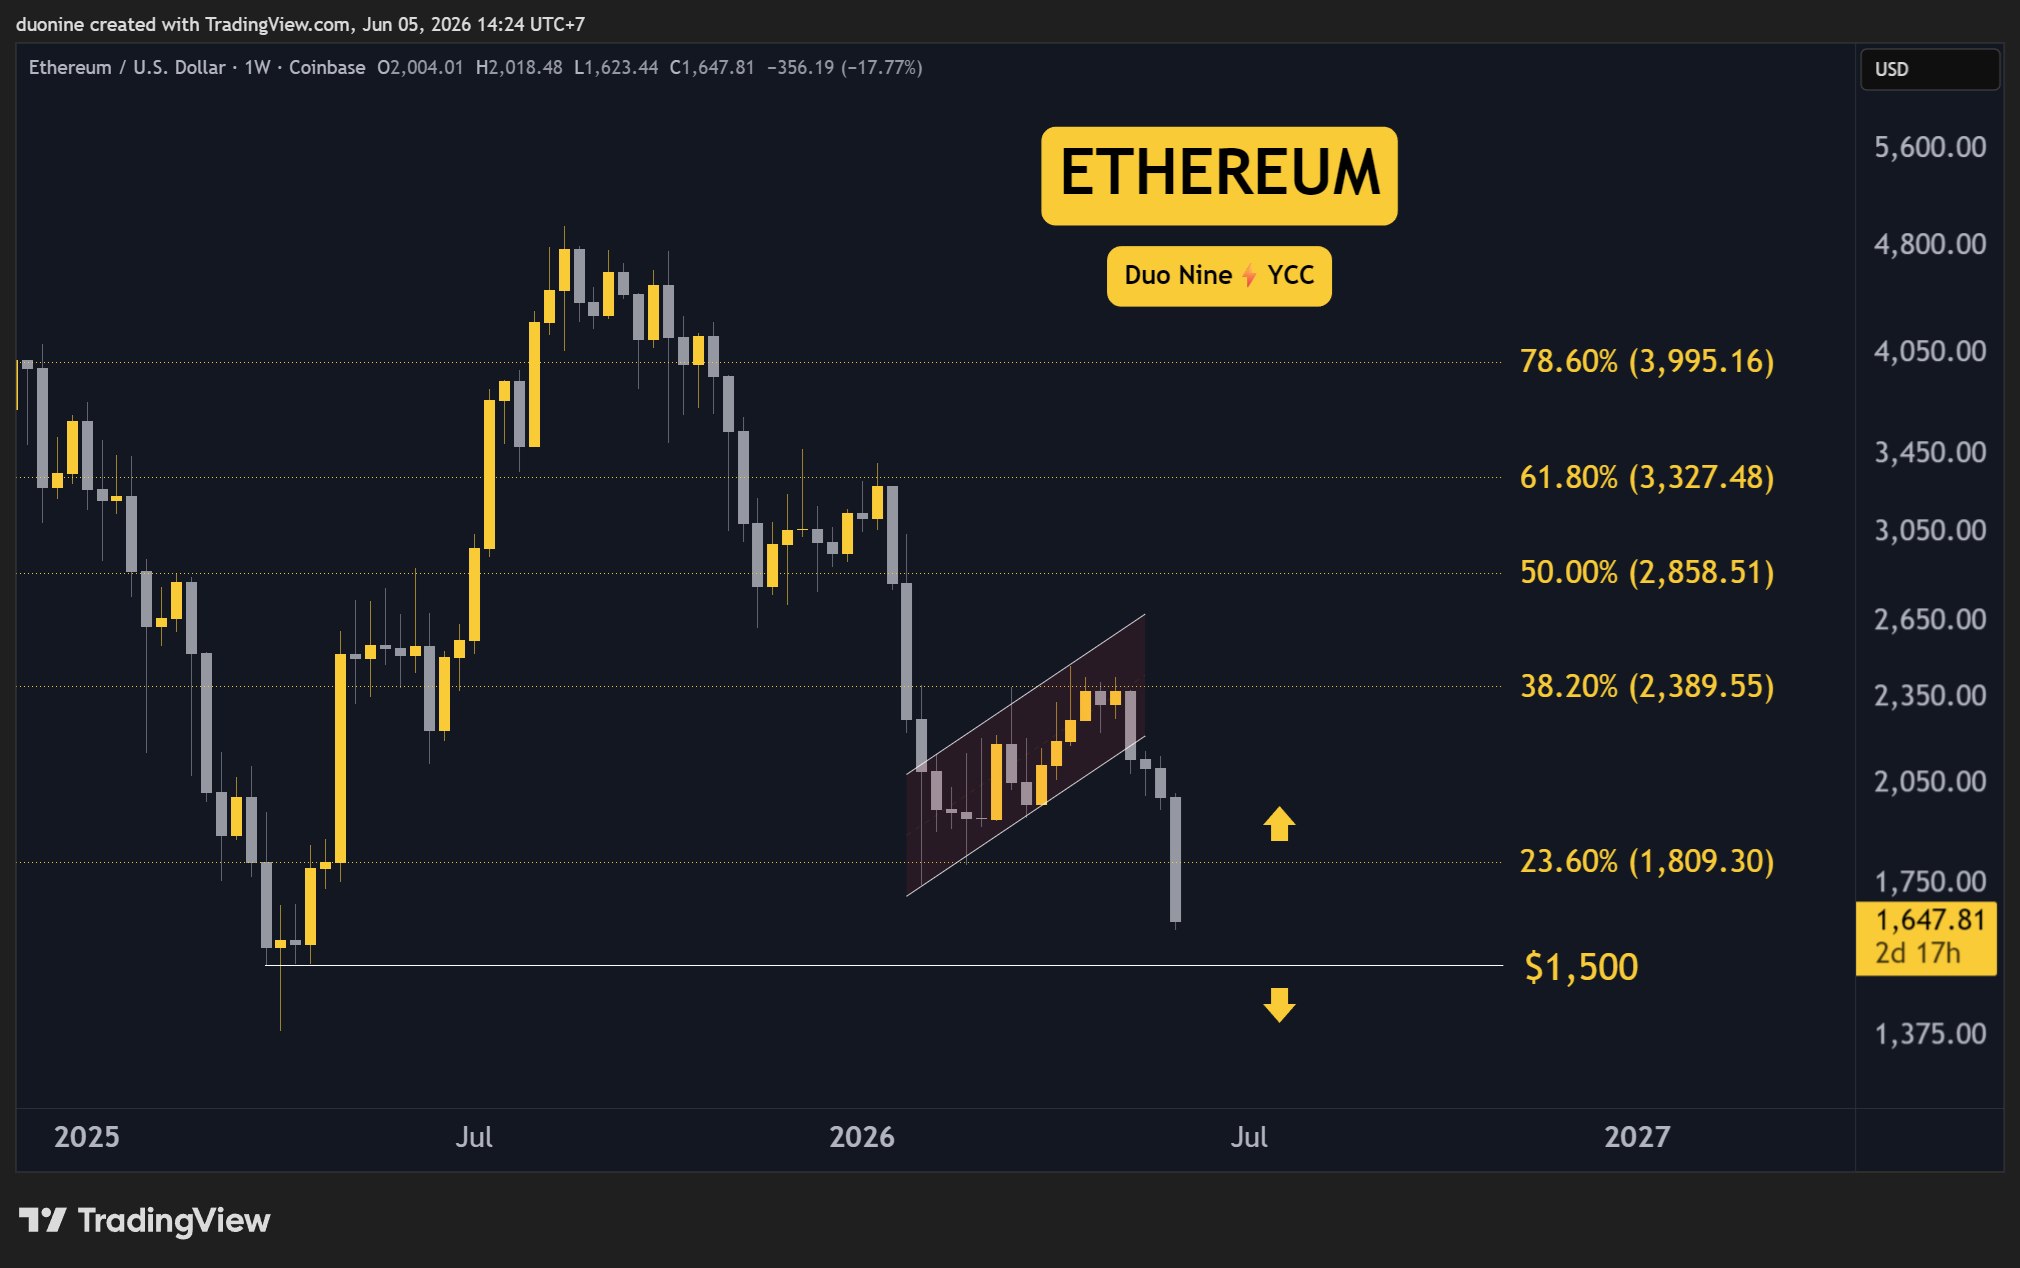
Ripple (XRP)
XRP also crashed 14% this week and made a lower low. This drop was likely since the price fell below the blue pennant. That was an early bearish signal.
Shorters are dominating right now and appear keen to test the $1 support, which is the most likely candidate to stop this downtrend, at least momentarily. Being a key psychological level may attract buyers, but if the market remains bearish, it’s hard to see XRP hold there.
Looking ahead, this lower low suggests the XRP downtrend shows no signs of stopping. Watch the price reaction at $ 1 closely. If that level turns into resistance later, then prepare for $0.80 next.

Cardano (ADA)
After a lot of back-and-forth, the support at $0.24 finally cracked. As soon as this happened, sellers rushed in and sent the price tanking. This is why ADA crashed by a shocking 30% this week, making it the worst period since the October 10th crash.
With $0.24 now as resistance, ADA’s hopes of a recovery are slim. The more likely scenario is a slow grind lower until a final bottom is found. The current support is at $0.15, but it will struggle to hold if this sell pressure persists.
Looking ahead, there is nothing bullish on the Cardano chart. Sentiment is at an all-time low in 2026, and it would take a miracle to see this reverse. Hopefully, $0.15 will provide some relief from this recent crash.

Binance Coin (BNB)
Binance Coin’s price action this past week was a classic bait and switch. After breaking the resistance at $690, the price reversed and dropped over 20% back to the support at $580. Anyone who bought that breakout was trapped.
Because the price returned to the key support, BNB closed the week 7% lower. Moreover, this drop is a bearish signal, indicating weakness and a lack of conviction among buyers.
Looking ahead, it’s quite likely that this cryptocurrency may fall below $580. If so, $500 is next. That’s because the overall market may drag it lower even if bulls have done a great job defending $580 since early 2026.

Hype (HYPE)
HYPE returned to its price from a week ago, erasing all recent gains after setting a new record at almost $76. This drop also allows it to retest the breakout at $60. Now, the biggest question is whether $60 will hold as support.
If not, then expect HYPE to fall back towards $50, where the most important support level is found. As long as that holds, the uptrend that started in January 2026 would remain intact.
Looking ahead, this cryptocurrency already had a fantastic year, and a proper correction appears overdue. This is why a pullback and consolidation would be ideal since going higher here would only make the eventual correction even more aggressive.

The post Crypto Price Analysis Jun-05: ETH, XRP, ADA, BNB, and HYPE appeared first on CryptoPotato.
Ripple’s cross-border token is down 14% for the week, but the company continues to score major wins in global expansion and important partnerships.
Bitcoin (BTC) has also plunged substantially, with numerous popular analysts expecting further declines, while Cardano (ADA) collapsed to its lowest level since 2020.
XRP Price Crash
Several days ago, Ripple teamed up with the Turkish crypto platforms BiLira, Bitexen, and Bitlo to boost adoption and usage of RLUSD. Later on, Mastercard expanded its infrastructure to enable merchants and partners to settle transactions in multiple cryptocurrencies, including the USD-pegged stablecoin.
In addition, Ripple strengthened its presence in the United States by opening an expanded office in Washington, D.C., while the spot XRP ETFs remained predominantly positive.
Despite the favorable news, XRP tumbled by 14% over the past week and currently trades at around $1.13 (per CoinGecko). Its poor condition mirrors the collapse of the broader crypto market, where Bitcoin (BTC) slipped to around $61,000 and altcoins like Zcash (ZEC) and Bitcoin Cash (BCH) nosedived by nearly 30%.
Another worrying factor is the recent whale activity. As CryptoPotato reported, this cohort of investors has sold or redistributed 50 million coins in the span of seven days, further spreading panic that could prompt smaller players to cash out as well.
BTC’s Heavy Bleeding
The primary cryptocurrency has lost over $20,000 in the past month alone and recently dropped to approximately $61,000, its lowest mark since February. As of press time, it trades at around $62,800, representing a 15% decline on a weekly scale.
Unsurprisingly, the downward move has resulted in a wave of bearish predictions. Ali Martinez recently opined that the plunge below $72,000 has put BTC in “a vulnerable position,” with the MVRV Pricing Bands suggesting the next major support lies between $50,000 and $54,000.
For his part, Ted labeled $49,000 “a good bottom zone,” comparing the scenario to the August 2024 low. Of course, the well-known crypto critic Peter Schiff was also vocal, envisioning a $20,000 catastrophe if BTC breaks $50,000.
“It should be a quick fall below $20K, which should be a big enough drop to shake the conviction of long-term HODLers, causing many to finally throw in the towel,” he added.
ADA’s Meltdown
Cardano’s native cryptocurrency is among the most heavily affected coins from the market crash. It fell to $0.15 (the lowest point since the end of 2020) before slightly rebounding to around $0.165.
One of the main factors in ADA’s collapse was Charles Hoskinson’s recent announcement. Cardano’s founder said he’s “taking a break,” while also warning about an upcoming “wave of failures in the ecosystem.”
The only positive recent development related to ADA is Cardano’s partnership with the Brazilian Olympic Committee (COB). However, it wasn’t enough to stop the asset’s free fall.
The post Recent Ripple (XRP) Developments, Bitcoin (BTC) Price Forecasts, and More: Bits Recap June 5 appeared first on CryptoPotato.
[PRESS RELEASE – Singapore, Singapore, June 5th, 2026]
Global cryptocurrency exchange LBank today announced that its registered user base has surpassed 25 million worldwide, marking a major milestone in the exchange’s global expansion journey. The achievement comes nearly one year after LBank became the Regional Sponsor of the Argentine National Team, a partnership that has played a pivotal role in expanding the exchange’s international visibility, strengthening community engagement, and accelerating mainstream awareness of digital assets.
Since joining forces with the reigning FIFA World Cup champions, LBank has sought to build more than a traditional sponsorship relationship. Through a series of global campaigns, fan-focused activations, and localized community initiatives, the collaboration has connected the passion of football with the accessibility of digital finance, helping introduce Web3 to audiences far beyond the traditional crypto ecosystem.
As anticipation builds for the world’s biggest football tournament, LBank will launch its flagship Super League campaign on June 9, featuring a $5,000,000 prize pool and premium rewards including FIFA World Cup 2026 Final Tickets, a 1,000g Gold Ball, and BTC. Building on the momentum of its partnership with AFA, the campaign is designed to bring together football passion, community participation, and digital asset innovation for millions of users worldwide.
Over the past year, this momentum has translated into measurable growth across the LBank ecosystem. Registered users have surpassed 25 million globally, while daily trading volume has exceeded $10.5 billion, reaching new highs amid expanding participation from both retail and professional traders. At the same time, LBank has continued broadening its product offerings, with TradFi products, including tokenized U.S. Stocks, Metals, and other real-world asset markets, generating more than $2.5 billion in daily trading volume and emerging as one of the fastest-growing segments on the exchange.
Beyond business growth, the partnership period has also coincided with a new phase of community and brand development. LBank has expanded its presence among younger digital-native audiences through brand collaborations, social-first engagement initiatives, and innovative product experiences. From partnerships with globally recognized internet personalities such as Nobodysausage to the launch of interactive features like Bullet Comments, LBank has continued exploring new ways to combine finance, culture, and community participation within a single ecosystem.
“World champions are not defined by a single victory, but by their ability to consistently perform at the highest level,” said Eric He, Community Angel Officer and Risk Control Adviser at LBank. “That philosophy strongly resonates with LBank’s journey. Since partnering with AFA, we have expanded our global community beyond 25 million users, and continued pushing the boundaries of product innovation. The partnership has demonstrated that football is more than a sport—it is a universal language that connects people across cultures, just as digital assets are creating a more connected global financial ecosystem.”
As the world looks ahead to the next chapter of international football, LBank remains committed to the same values that define champions on the global stage: ambition, resilience, and continuous progress. With more than 25 million users across 210+ countries and regions, LBank will continue building a more accessible, connected, and innovative future for digital assets worldwide.
About LBank
Founded in 2015, LBank is a leading global cryptocurrency exchange serving over 25 million registered users in 210 countries and regions. With a daily trading volume exceeding $10.5 billion and 10 years of safety with zero security incidents, LBank is dedicated to providing a comprehensive and user-friendly trading experience. Through innovative trading solutions, the platform has enabled users to achieve average returns of over 130% on newly listed assets.
LBank has listed over 300 mainstream coins and more than 50 high-potential gems. Ranked No. 1 in 100x Gems, Highest Gains, and Meme Share, LBank leads the market with the fastest altcoin listings, unmatched liquidity, and industry-first trading guarantees, making it the go-to platform for crypto investors worldwide.
Follow LBank for Updates
Website: https://www.lbank.com/
Twitter: https://twitter.com/LBank_Exchange
Telegram: https://t.me/LBank_en
Instagram: https://www.instagram.com/lbank_exchange
LinkedIn: https://www.linkedin.com/company/lbank
The post LBank Surpasses 25 Million Users Worldwide as AFA Partnership Continues to Drive Global Growth appeared first on CryptoPotato.
Blockchain detective ZachXBT is warning traders to steer clear of Rain Protocol after claiming to have uncovered a pattern of suspicious on-chain activity surrounding the project.
In the latest update, ZachXBT described the prediction market project, which he said has an $8.8 billion market capitalization and ranks among the top 15 crypto assets, as having few users, limited product traction, no notable backers, and a team with little established history in the industry.
Links to Failed Crypto Projects
According to his on-chain investigation, wallets tied to the RAIN team share funding trails with the Data Ownership Protocol (DOP) and TOMI ecosystems via the Gems hot wallet and several centralized exchange deposit addresses, which suggests an overlap between the projects.
As evidence, ZachXBT highlighted two “dust” transactions that were sent to the same address on Oct. 14, 2025. According to his findings, a wallet linked to the RAIN deployer sent a small transfer to the address at 3:31:47 p.m. UTC, while a wallet he associated with the TOMI team multisig and a centralized exchange deposit address sent another dust transaction to that same destination 36 seconds earlier. He also said that the recipient wallet later received funds from another address that had previously been funded by a DOP multisig.
In a separate transaction trail, the investigator said another wallet transferred funds to an address that later used the same centralized exchange deposit address as the DOP deployer.
ZachXBT also claimed RAIN’s market activity shows signs of on-chain price manipulation, and alleged that addresses tied to the deployer used Uniswap V3 liquidity pools while routing spot transfers through the Gems hot wallet. He also took aim at RAIN’s valuation, while highlighting that its decentralized autonomous treasury, Enlivex, a Nasdaq-listed company, announced a $212 million treasury strategy in November 2025 even though, according to him, the project is nowhere near the scale of prediction market platforms like Kalshi or Polymarket.
He cited DefiLlama data showing RAIN has $27.2 million locked on Arbitrum, but said the entire amount is held in its own illiquid token and that the protocol generates only about $1 million in annual fees. TOMI, DOP and Sirin Labs projects are all linked to controversial Israeli entrepreneur Moshe Hogeg, who was arrested in 2021 and later faced police allegations over a $290 million crypto fraud scheme.
Kraken Rating Cut to B-Tier
ZachXBT said he has lowered his rating for crypto exchange Kraken from S-tier to B-tier over “lack of due diligence” before listing what he described as “low-quality, manipulated tokens,” including M, RAIN, RIVER and RAVE. He also criticized Kraken’s public disclosure of its recent security breach, and added that it did not mention compensation for affected users.
By comparison, he noted that exchanges such as Coinbase and Bybit prioritized compensating customers after their own security incidents. ZachXBT also raised his bounty to as much as $100,000 for insiders who can provide documents or chat logs related to alleged centralized exchange market manipulation schemes.
The post ‘Avoid Rain at All Costs’: ZachXBT Raises Red Flags Over $8.8B Prediction Market Project appeared first on CryptoPotato.


