Cryptocurrency Posts
Crypto Briefing
The potential US-Iran deal could stabilize oil markets, ease inflation, and boost risk assets, but uncertainty and regulatory risks remain.
The post Oil markets react positively to potential US-Iran deal, and Bitcoin is catching the tailwind appeared first on Crypto Briefing.
The inclusion of many Barcelona players in Spain's World Cup squad could boost fan engagement, potentially impacting the BAR token's value.
The post Spain includes 8 FC Barcelona players in World Cup squad, and the BAR fan token is watching appeared first on Crypto Briefing.
Haiti's World Cup return highlights potential for increased global visibility and economic opportunities amid crypto's growing sports influence.
The post Haiti’s men’s World Cup return after 52 years collides with crypto’s biggest sports stage yet appeared first on Crypto Briefing.
Rising compute costs in AI challenge traditional business models, urging firms to reassess investment strategies for sustainable returns.
The post Nvidia VP reveals compute costs now surpass employee expenses in AI appeared first on Crypto Briefing.
Trump's tariff threat highlights escalating global tensions over digital taxation, potentially reshaping international trade and tech policies.
The post Trump threatens 100% tariff on French wine over tech tax at G7 appeared first on Crypto Briefing.
Bitcoin Magazine
Bitcoin Magazine

Standard Chartered Calls Crypto Bottom as Bitcoin Price Recovers From $59,000 Low
Standard Chartered’s head of digital asset research, Geoff Kendrick, declared Friday that the crypto market has seen its cycle low, with Bitcoin’s recent dip to approximately $59,000 marking the bottom of the latest downturn — a 53% drawdown from its October all-time high of $126,000.
“Winter is over. Welcome back to crypto spring,” Kendrick wrote in a Friday note, adding, “I think we have now seen the low in crypto asset prices for the cycle.”
Bitcoin had recovered to around $64,000 at the time of Kendrick’s note, representing a roughly 5% gain over the prior week. The bank maintains a $100,000 price target for Bitcoin by year-end — projections it first issued in February.
SpaceX IPO drains crypto liquidity — then frees it
One of the two primary catalysts Kendrick cited is the historic Nasdaq debut of Elon Musk’s SpaceX, which priced its $75 billion IPO at $135 per share under the ticker SPCX on June 12.
Shares opened sharply above their IPO price, gaining roughly 20% on debut day. Kendrick argued that a significant portion of recent Bitcoin ETF outflows — totaling more than $5.72 billion since the second week of May, among the sharpest “since inception” — was driven by investors liquidating crypto positions to secure SpaceX allocations. With the IPO now live, that specific selling pressure may lift, he said.
The overlap between crypto and SpaceX demand was already playing out in real time. On Hyperliquid, perpetual contracts for SpaceX (SPCX) had accumulated over $240 million in open interest and $220 million in 24-hour volume ahead of the debut — ranking it as the eighth-largest asset on the platform.
Iran is a wildcard
The second catalyst involves geopolitics. A potential peace deal between the U.S. and Iran, timed ahead of next week’s G7 summit, could reduce pressure on global oil supplies that have remained tight since Middle East hostilities began.
Lower oil prices would subsequently cool elevated U.S. Treasury yields — which have weighed on risk assets like crypto by making risk-free government debt more attractive.
West Texas Intermediate crude fell roughly 1.5% on Friday to around $85–$86 per barrel. However, the peace deal narrative remained fragile.
President Trump stated Thursday that a breakthrough could come this weekend, only to later post on Truth Social that the deal made public was not what had been agreed, warning Iranian officials to “get their act together” — adding uncertainty to the macro outlook.
Three bitcoin price signals to watch
Kendrick outlined three confirmation signals that would validate his call. First, he is watching for Strategy to announce an additional Bitcoin purchase on Monday, as CEO Michael Saylor’s buying history has served as a reliable demand signal for institutional appetite.
Second, he is expecting U.S. spot Bitcoin ETFs to return to net-positive daily inflows on Friday.
Third, he wants to see continued declines in global oil prices as the Iran diplomatic situation evolves.
If all three materialize, Kendrick’s crypto spring thesis gains its clearest validation yet — suggesting institutional and macro forces are finally aligning to push Bitcoin back toward the bank’s $100,000 year-end target.
This post Standard Chartered Calls Crypto Bottom as Bitcoin Price Recovers From $59,000 Low first appeared on Bitcoin Magazine and is written by Micah Zimmerman.
Bitcoin Magazine

Blockworks Acquires Messari in Deal Highlighting Crypto’s Data Consolidation Race
Blockworks, the New York-based crypto data and investor relations platform, has acquired rival Messari in a deal that underscores the growing consolidation pressure reshaping the digital asset industry — and the steep valuation resets facing once high-flying crypto startups.
The acquisition brings together two of the industry’s largest crypto information businesses. Messari, founded in 2018, built a comprehensive data platform covering more than 40,000 digital assets, along with APIs, market intelligence, research tools, and AI-powered workflows used by funds, exchanges, regulators, and developers.
Blockworks, also founded in 2018, has focused on the issuer side of crypto capital markets, offering standardized disclosures through its Token Transparency Framework and a full-stack investor relations platform for onchain assets.
Blockworks paid more than $10 million for Messari — a steep discount from Messari’s approximately $300 million valuation when it raised a $35 million Series B led by Brevan Howard’s crypto arm in 2022, with Point72 Ventures also among its backers, according to the Wall Street Journal.
The markdown reflects both Messari’s recent difficulties — including the 2024 departure of co-founder and longtime CEO Ryan Selkis and subsequent staff reductions — and broader headwinds gripping the crypto sector.
“This acquisition connects the two sides of the market,” said Jason Yanowitz, co-founder of Blockworks. “Issuers maintain a trusted record of their business, and investors, exchanges, and regulators consume that record through research, APIs, and automated workflows.”
Blockworks raise to consolidate fragmented crypto data market
The deal was funded in part through Blockworks’ recently closed Series A extension, which valued the company at $192 million. That round was co-led by ParaFi and Reciprocal Ventures and included participation from Coinbase Ventures, among others.
Blockworks said it raised capital specifically to consolidate crypto’s fragmented data and information market, drawing comparisons to how Wall Street’s information layer eventually coalesced around dominant platforms like Bloomberg, FactSet, and S&P Global.
Messari CEO Diran Li, who took over following Selkis’s departure and had been repositioning the firm as an “AI-first company,” will join Blockworks as a senior leader under co-founders Yanowitz and Michael Ippolito.
The deal arrives as crypto M&A activity remains elevated despite challenging market conditions. Crypto companies have completed 144 deals totaling $11.8 billion in transaction value so far in 2026 — up roughly 3.5% from the same period last year — according to data from advisory firm Architect Partners.
Still, Eric Risley, founder of Architect Partners, warned that sustained pressure on trading volumes and token prices could force more distressed sales. “We are in the midst of the creation of the haves and the have-nots,” Risley said, per WSJ.
Both Blockworks and Messari executives said the combined platform would prioritize deeper data coverage, stronger APIs, enhanced compliance workflows, and AI-native research tools as digital assets increasingly migrate onchain.
This post Blockworks Acquires Messari in Deal Highlighting Crypto’s Data Consolidation Race first appeared on Bitcoin Magazine and is written by Micah Zimmerman.
Bitcoin Magazine

SpaceX Officially Joins Public Bitcoin Leaderboard as 8th Largest Holder With 18,712 BTC
Elon Musk’s SpaceX launched trading on the Nasdaq today under the ticker SPCX — and it didn’t arrive empty-handed.
The company officially entered the public Bitcoin treasury leaderboard as the 8th largest holder with 18,712 BTC, a position that had been building for years before its historic IPO debut confirmed the full size of the stash.
SpaceX’s S-1 filing with the Securities and Exchange Commission first disclosed the 18,712 BTC position back in May, valued at approximately $1.29 billion at the time of filing.
The total cost basis was reported at $661 million — an average acquisition price of roughly $35,324 per coin — suggesting the company began accumulating Bitcoin in late 2023 or earlier. At today’s prices near $63,000, the position is worth approximately $1.19 billion.
The disclosure somewhat surprised the market. Blockchain analytics firm Arkham Intelligence had previously tracked SpaceX’s holdings as low as 6,095 BTC, and the BitcoinTreasuries.net May 2026 Corporate Adoption Report noted that its pre-IPO private estimate stood at just 8,285 BTC.
JUST IN: Elon Musk's SpaceX officially becomes 8th largest public Bitcoin holder with 18,712 BTC
— Bitcoin Magazine (@BitcoinMagazine) June 12, 2026pic.twitter.com/04n3AyFC3T
The actual confirmed figure — more than double those estimates — made SpaceX’s reveal the second-largest Bitcoin treasury disclosure of May, trailing only Strategy’s 25,404 BTC in monthly purchases and accounting for more than one-third of all public treasury growth before sales.
“We expect SpaceX to rank among the top ten publicly traded Bitcoin treasuries after its anticipated June 12 IPO,” BitcoinTreasuries.net wrote in its May report — a forecast that has now materialized.
The live leaderboard, updated as of June 11, confirms SpaceX at rank #8, slotting in just behind Strive (19,032 BTC at #7) and just ahead of Coinbase Global (16,492 BTC at #9).
SpaceX shares debut higher than initial pricing
The IPO itself is historic, even without the Bitcoin angle.
SpaceX priced its shares at $135 on June 11, raising roughly $75 billion and valuing the company at about $1.75 trillion.
Reports now indicate the stock could debut at $171 per share with other reports saying $155 a share. At that price, SpaceX’s valuation would climb to approximately $2.2 trillion, potentially making Elon Musk the world’s first trillionaire.
The listing, led by Goldman Sachs and Morgan Stanley, ranks as one of the largest stock market debuts in U.S. history, surpassing Saudi Aramco’s $29 billion IPO in 2019.
The timing of SpaceX’s entry into the public crypto arena is notable given broader market headwinds. Bitcoin has shed more than 50% from its all-time high above $126,000, hovering around $64,000 in recent sessions, with spot Bitcoin ETFs bleeding $2.26 billion in outflows over two weeks.
Still, SpaceX’s Bitcoin position appears to be a long-term balance-sheet allocation rather than a trading posture. The S-1 stated: “The Company has ownership of and control over its digital assets, which consist of Bitcoin, and utilizes, and expects to continue to utilize third-party custodians to hold its Bitcoin.”
Analysts at Grayscale noted that SpaceX is poised to become the most valuable public company holding Bitcoin by market capitalization — even as Strategy remains the largest by coin count with over 843,000 BTC.
This post SpaceX Officially Joins Public Bitcoin Leaderboard as 8th Largest Holder With 18,712 BTC first appeared on Bitcoin Magazine and is written by Micah Zimmerman.
Bitcoin Magazine

Sam Bankman-Fried Loses Appeal to Overturn FTX Fraud Conviction
One of Sam Bankman-Fried’s last credible paths to freedom closed Friday as a federal appeals court upheld his fraud conviction and 25-year prison sentence, ruling that the case against him was, in the court’s own words, “conservatively stated, robust.”
A three-judge panel of the Manhattan-based 2nd U.S. Circuit Court of Appeals handed down the 42-page opinion on June 12, rejecting every argument Sam Bankman-Fried’s legal team advanced to undo the November 2023 conviction that cemented one of the largest financial collapses in crypto history, according to Reuters.
At the heart of the appeal was a claim that the U.S. District Judge Lewis Kaplan had stripped Sam Bankman-Fried of a fair defense by barring evidence that FTX held enough assets to cover customer withdrawals.
Defense attorney Alexandra Shapiro told the appellate panel in November 2025 that “Mr. Bankman-Fried’s trial was fundamentally unfair because the jury only got to hear one side of the story.”
Prosecutors countered that Kaplan’s ruling was correct: fraud charges hinge on misappropriation, not on the possibility that assets could have covered liabilities under different circumstances. The appellate panel agreed, finding the trial court’s evidence rulings sound and the government’s case against Sam Bankman-Fried overwhelming.
How FTX Fell
The exchange, once valued at $32 billion, collapsed in November 2022 once it was exposed that the balance sheet of Alameda Research — Bankman-Fried’s affiliated hedge fund — was built on FTX’s own exchange token rather than independent assets. The disclosure triggered a customer run that ripped open an $8 billion hole in FTX’s accounts.
Three of Bankman-Fried’s former deputies — Alameda CEO Caroline Ellison, FTX co-founder Gary Wang, and engineering head Nishad Singh — each pleaded guilty and testified against him. Ellison, the trial’s star witness, told jurors Bankman-Fried gave her the instruction to divert customer deposits to Alameda to repay loans from crypto lenders. “Sam directed me to commit these crimes,” she said from the stand.
The court ordered an $11 billion forfeiture and three years of supervised release following Bankman-Fried’s March 2024 sentencing. Ellison received two years and was released in January 2026 after serving 14 months.
The appeals court ruling lands just weeks after Bankman-Fried also filed a formal clemency petition with the DOJ’s Office of the Pardon Attorney, requesting a presidential pardon from Donald Trump. The application is listed as a “pardon after completion of sentence” — not a commutation — and Trump has said publicly he will not grant it.
Judge Kaplan denied a separate Rule 33 new trial motion in April 2026, calling Bankman-Fried’s claim that witnesses had been threatened by the government “wildly conspiratorial and entirely contradicted by the record.” Bankman-Fried withdrew an earlier version of that motion on April 22 without prejudice.
With the 2nd Circuit now closed, his legal options narrow to a habeas petition — a route with a lower success rate than direct appeals — or a Supreme Court petition.
What’s next for Sam Bankman-Fried
Sam Bankman-Fried remains at a low-security federal prison near Santa Barbara, California, and is not eligible for release until 2044.
In a prison interview with Fox Business this month, he maintained his position: “I didn’t steal user funds.” He pointed to the FTX bankruptcy estate’s recovery of crypto assets, which have allowed the estate to pay creditors more than 100 cents on the dollar — a figure he frames as proof of FTX’s underlying solvency, though courts at every level have rejected that framing.
The Friday ruling closes the chapter on what federal prosecutors called a “fraud of epic proportions” — a case that shook institutional confidence in crypto markets, triggered congressional hearings, and forced exchanges across the industry to overhaul proof-of-reserves practices.
Back in January, President Donald Trump said he would not pardon former FTX CEO Sam Bankman-Fried, rejecting clemency for the convicted crypto executive.

This post Sam Bankman-Fried Loses Appeal to Overturn FTX Fraud Conviction first appeared on Bitcoin Magazine and is written by Micah Zimmerman.
Bitcoin Magazine
Strategy Stock MSTR Offers Bitcoin Exposure At 18% Discount
I’ve been vocal about accumulating Bitcoin aggressively at current levels. Now I’m starting to look seriously at Strategy too. The same kind of confluence that flagged Bitcoin as a sizeable accumulation opportunity is appearing on MSTR, and in some cases, the readings are even more extreme.
This week at a glance:
- The RSI has only been lower on a handful of occasions since Strategy adopted a Bitcoin standard.
- The Mayer Multiple for MSTR has just reached the lower percentiles.
- The BTC vs MSTR ratio is close to entering a zone that has historically preceded sustained MSTR outperformance.
- At the previous Bitcoin all-time high with a 1x net asset value premium, the fair value of MSTR shares would be over $300.
Discount
Strategy currently holds approximately 845,000 BTC with an Average Cost Basis in the mid-$70,000s. That means, at current Bitcoin prices, they’re sitting at a pretty massive loss on their holdings.

Figure 1: Strategy’s Average BTC Cost Basis and other key metrics.
View Live Charts
This has coincided with the NAV dropping even deeper beneath 1.00x; with MSTR’s market cap currently sitting approximately 18% below the USD value of its Bitcoin holdings. In other words, buying MSTR at current prices is the equivalent of buying $1 of Bitcoin for $0.82.
Support
The 200-week moving average is usually pretty notable support for assets, especially those that typically trend to the upside. Strategy’s share price is currently sitting right on this level, the same level that has previously marked significant accumulation zones.

Figure 2: Strategy’s share price tests the 200-week moving average.
A sustained hold and reclaim of this level, combined with Bitcoin showing any upward momentum, historically sets up the conditions for meaningful MSTR recovery. The level is being tested. Whether it holds will be one of the key signals to watch over the coming weeks.
RSI
Since Strategy adopted a Bitcoin standard, the RSI for MSTR has only been lower on a handful of prior occasions, both during previous Bitcoin bear market cycle lows, when the share price was in the low teens. The current reading isn’t quite at those depths, but it’s approaching them, and the direction of travel is continuing downward.

Figure 3: MSTR’s RSI drops beneath 25. Historically, such levels have preceded price appreciation.
The Mayer Multiple, simply the ratio between MSTR’s closing price and its 200-day moving average, recently registered a reading where 99.2% of all prior data points were higher. That’s a historically extreme level of underperformance relative to its own moving average, and it’s occurred at broadly the same time as the RSI signal. Giving two independent momentum indicators, both flashing readings only seen at the most significant cycle lows in MSTR’s history.
MSTR Or BTC?
The ratio between Bitcoin’s price and MSTR’s share price is one of the cleaner ways to gauge whether exposure should be in Bitcoin directly or rotated toward the higher-beta proxy. When the ratio is in the green upper zone, MSTR has historically been positioned to outperform. When it’s in the red lower zone, Bitcoin tends to lead.

Figure 4: The BTCUSD/MSTR ratio is close to the green zone, a level that has previously preceded sustained MSTR outperformance.
The ratio is currently close to entering that green zone again. Previous instances of this were followed by extended periods of significant MSTR outperformance relative to Bitcoin. The ratio is also making lower highs on the long-term trend, indicating the general trajectory is shifting toward MSTR becoming increasingly favorable relative to direct Bitcoin exposure.
Fair Value
At the previous all-time high of around $126,000 and with no additional accumulation priced in, a 1x net asset value premium on MSTR would imply a share price of over $300. That’s roughly a 2.5x from current levels just to reach fair value at Bitcoin’s last peak.

Figure 5: MSTR price targets modeled across varying BTC holdings and NAV premium scenarios.
If MSTR continues accumulating toward the 900,000 BTC range and the NAV premium moves modestly higher toward 1.25x or 1.5x, well below the 3x+ levels seen in the previous cycle, the numbers become pretty enticing! Crucially, the MSTR dilution that drove bitcoin accumulation is increasingly being funded through STRC rather than common share issuance, reducing that particular headwind.
Where Are We?
I’ve been accumulating bitcoin aggressively. I’m now also looking to add more MSTR. The combination of extreme momentum readings, the 200-week moving average support, an implied discount to the underlying Bitcoin holdings, and the BTC vs MSTR ratio close to entering historically favorable territory makes this feel like a no-brainer for a short-term play to increase my own BTC stack.
That said, MSTR is a high-beta Bitcoin play. If Bitcoin continues to struggle, MSTR will struggle more. I’m not treating this as a replacement for Bitcoin exposure, but as an additional asymmetric position at a point where the data suggests the risk-reward is historically favorable.
For more data, charts, and insights into bitcoin price trends, visit BitcoinMagazinePro.com.
Subscribe to Bitcoin Magazine Pro on YouTube for more expert insights!

Disclaimer: This article is for informational purposes only and should not be considered financial advice. Always do your own research before making any investment decisions.
This post Strategy Stock MSTR Offers Bitcoin Exposure At 18% Discount first appeared on Bitcoin Magazine and is written by Matt Crosby.
CryptoSlate
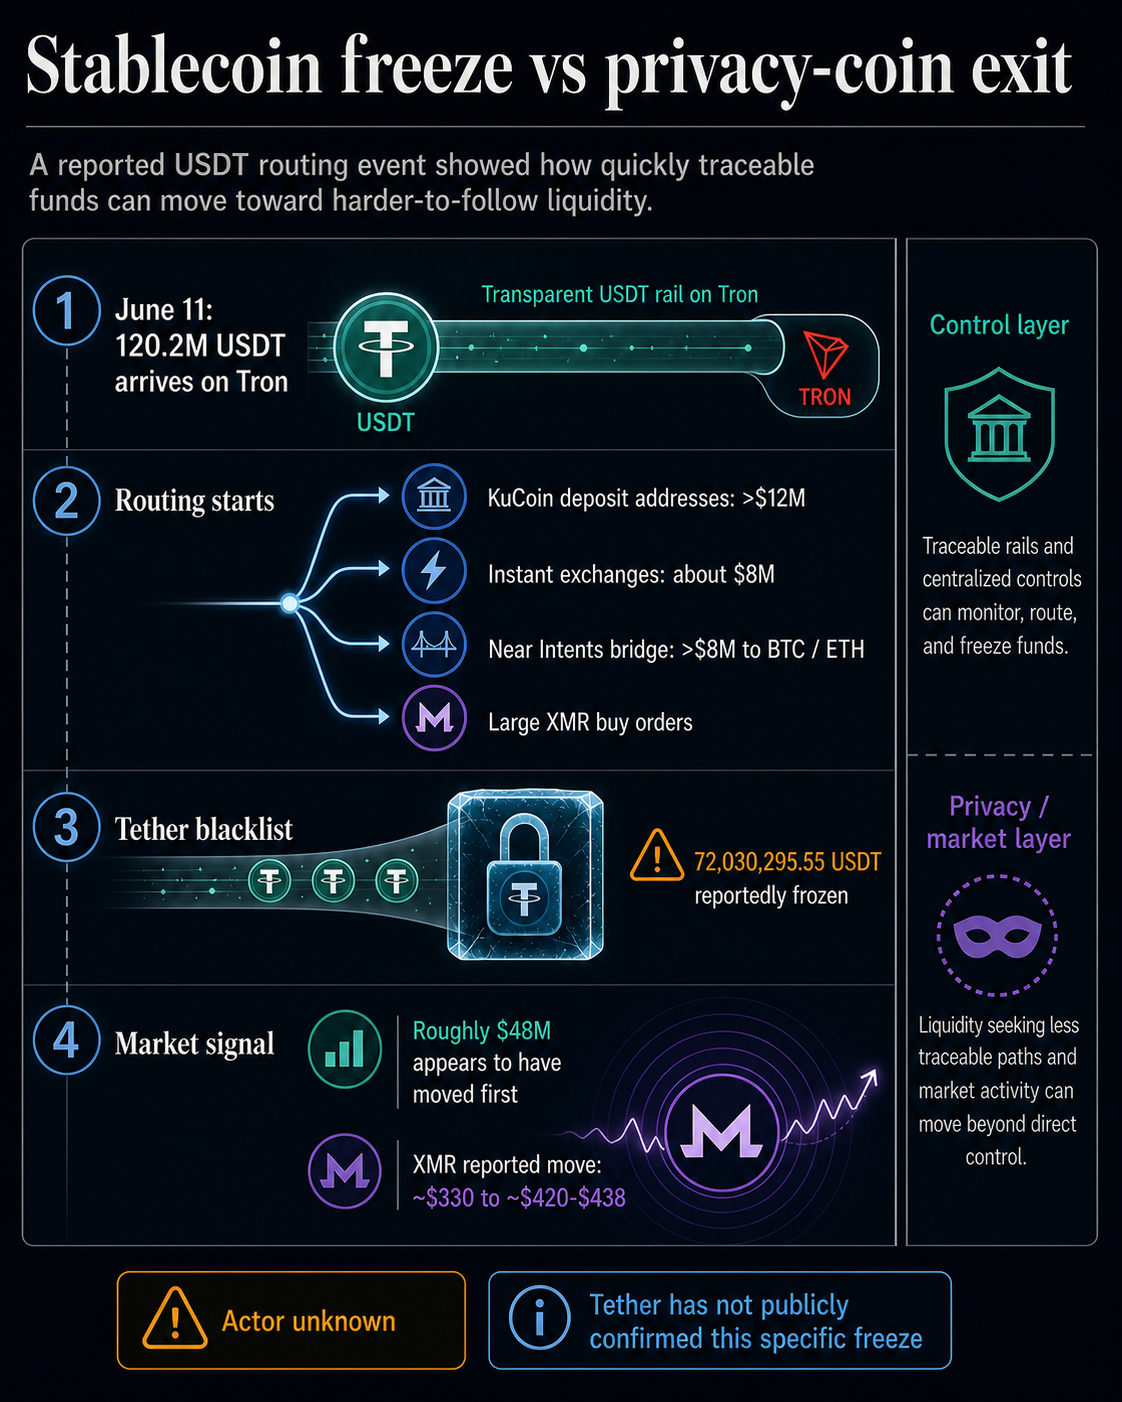
A Tron address reportedly received 120.2 million USDT last week and began routing funds before Tether reportedly froze about $72 million in USDT after the flow was flagged as suspected laundering, with no specific hack publicly tied to the wallet.
The freeze appears to have frozen funds that were still held in USDT. It did not answer the larger operational question raised by the flow: how much time stablecoin issuers have before traceable tokens move into liquidity where public tracing becomes harder.
That question became visible through Monero. Reports attributed to on-chain investigator ZachXBT said the same entity created large XMR orders while also sending funds toward KuCoin deposit addresses, instant exchanges, and cross-chain routes.
The buying was large enough to push XMR from roughly $330 to a reported range of $420-$438.
The visibility came from buy pressure that moved the price rather than from follow-on Monero transaction data. A privacy coin designed to hide transaction details became the place where the attempted routing was easiest to spot.
How the route became visible
The public trail begins with the Tron address reported by ZachXBT and mirrored by a USDT ban-list monitor.
The posts said the address received 120.2 million USDT on Tron. They also said it sent more than $12 million to KuCoin deposit addresses, moved about $8 million to instant exchanges, bridged more than $8 million from Tron to Bitcoin and Ethereum through Near Intents, and created Monero orders that pushed XMR higher.
The same monitoring page later listed a related Tron address as blacklisted, with 72,030,295.55 USDT frozen. Separate reports described the same core sequence: a large USDT balance arrived on Tron, funds were split across routes, Monero buying lifted XMR, and Tether froze roughly $72 million that had not yet moved.
The reports do not identify the wallet's owner. The original source of the 120.2 million USDT is also unresolved. That means the flow should be treated as a suspected laundering pattern, not as a confirmed attribution to a known hacker, sanctions actor, or exploit.
| Reported point | Reported detail | Key caveat |
|---|---|---|
| USDT received | 120.2 million USDT reached a Tron address on June 11. | The actor and original source of funds remain unknown. |
| USDT frozen | About 72 million USDT was reportedly frozen after a related address was blacklisted. | Tether has not publicly confirmed this specific freeze. |
| Funds moved first | Roughly $48 million appears to have moved before the freeze, based on the reported received and frozen amounts. | The exact split across XMR, exchange deposits, swaps, and bridge routes is still unclear. |
| XMR impact | Reports place the XMR move from about $330 to between $420 and $438. | The peak differs by source and should not be treated as a single settled print. |
That order of operations is the key technical detail. Address-level freeze power applies only after an issuer or monitoring system identifies a token balance that can still be blocked.
In the reported flow, several routes were already in motion before the blacklist entry appeared: centralized-exchange deposit addresses, instant-exchange paths, bridge movement, and XMR orders.
Each route creates a different recovery problem. Exchange deposits can trigger a compliance request, bridge paths require cross-chain tracing, and XMR orders can leave investigators with market impact rather than full transaction visibility.
What Tether could still stop
USDT is a dollar stablecoin issued by a centralized company across multiple blockchains, including Tron. A stablecoin issuer can blacklist specific token addresses and prevent tokens at those addresses from being transferred.
USDT's market profile identifies issuer controls as a central risk and shows how deeply the token is embedded in crypto plumbing.
USDT is used for trading pairs, dollar settlement, exchange liquidity, DeFi liquidity, payments, remittances, and on-chain transfers. Its usefulness comes from broad distribution and deep liquidity, while its control risk comes from reliance on an issuer that can freeze tokens in some circumstances.
In an April statement about a separate $344 million freeze, Tether said it can restrict assets when wallets are tied to sanctions evasion, criminal networks, or other illicit activity. The company also said it works with more than 340 law enforcement agencies across 65 countries.
That gives the compliance tool its force, and also defines its limit. A blacklist can prevent USDT from being sent to a known address.
It cannot directly pull back value that has already been swapped into another asset, sent to a venue, bridged through another route, or pushed into a privacy system where public transaction details are obscured.
In this case, the freeze appears to have caught the portion still within the controllable USDT layer. The roughly $48 million reported to have moved first is the harder part of the story.
The next stage depends on venue cooperation, off-chain investigation, and whatever traceability remains after the conversion route.
Monero plays a different role from a standard volatile asset in this story. It is one of crypto's best-known privacy coins, and its design changes what investigators can see after a conversion.
The Monero project says the network prioritizes privacy and uses technologies such as RingCT, stealth addresses, and ring signatures. XMR's market profile describes it as a privacy-focused asset whose design obscures sender, recipient, and amount data on-chain.
That does not make all Monero activity illicit. Privacy coins are also used by people who do not want balances, counterparties, or spending patterns exposed on public ledgers.
The point in this case is more specific: if suspect funds move quickly enough from transparent stablecoin rails into XMR, public tracing becomes much harder, while the conversion itself can still leave a market footprint.
That footprint was large relative to visible liquidity. CryptoSlate's Monero market data showed about $319 million in 24-hour XMR volume on June 12.
If roughly $48 million moved before the freeze, that amount would equal about 15% of that daily volume. The comparison is not a precise execution map because the $48 million was reportedly split across several routes, and CryptoSlate's volume figure was based on live market data.
The pattern also fits a broader crime trend without proving this wallet's origin. TRM Labs' 2026 crypto crime report described rising support for Monero-only darknet markets and, in separate sections, faster cash-out and fragmentation behavior among illicit actors.
CryptoSlate has also tracked renewed pressure on privacy coins, driven by Zcash's challenge to Monero.


The next signal is speed
Tether's reported freeze did two things at once. It likely stopped a large amount of USDT from moving further, and it showed how little time an issuer may have before a laundering route leaves the part of the stack the issuer can control.
Stablecoin freezes work best while value is still in a token that can be blacklisted. Once funds are split across exchanges, instant swap services, bridges, and privacy coins, the response shifts from direct token control to investigation, exchange cooperation, and market surveillance.
Recent coverage of stablecoin freezes following the Drift and Rhea incidents framed the same tension from a user-protection angle: emergency intervention can stop the theft of funds, but it also concentrates power in the hands of issuers, who can decide when and how to block digital dollars.

The Monero routing adds a second layer. Even when an issuer can act quickly, privacy liquidity can make the next hop difficult to follow.
The next signals are practical. Tether could confirm the specific freeze or explain the basis for blacklisting. Exchanges and swap services could identify downstream deposits. ZachXBT or other investigators could update the trail.
XMR liquidity could show whether the conversion pressure has been absorbed.
Stablecoin blacklist power stopped what remained in USDT. The price impact in XMR showed what may already have left that control layer.
The post Did Tether just freeze $72M in USDT with no link to a hack in Monero money laundering sting? appeared first on CryptoSlate.
Bitcoin climbed back above $65,000 earlier today, reversing weeks of intense selling pressure after a sudden diplomatic breakthrough between the United States and Iran lifted a major geopolitical cloud over global financial markets.
Data from CryptoSlate shows that the flagship digital asset rose more than 3% to reach as high as $65,940, but has since retraced slightly to $65,668 as of press time. Ethereum, the second-largest cryptocurrency by market capitalization, also advanced to $1,724 as of press time.
The market turnaround followed a weekend announcement from President Donald Trump stating that a peace agreement to end the three-month-old conflict in the Middle East had been finalized.
The agreement includes the immediate removal of the US naval blockade and the reopening of the Strait of Hormuz, a critical maritime chokepoint through which roughly 20% of the world’s crude oil supply transits.
The framework for the peace deal, mediated by Pakistan, is scheduled to be formalized at an official signing ceremony in Switzerland on June 19.
Confirming the resolution, Shehbaz Sharif, Pakistan's Prime Minister, said:
“Following intensive talks, we are pleased to announce that the Peace Deal between the United States of America and Islamic Republic of Iran has been REACHED. Both sides have declared the immediate and permanent termination of military operations on all fronts, including in Lebanon.”
Following the confirmation, the announcement quickly moved across asset classes. Oil prices fell, equity futures rose, and crypto markets recovered as traders unwound part of the war premium that had built up since the conflict began in late February.
Data from oilprice.com showed that West Texas Intermediate crude dropped nearly 5% to hover around $80 per barrel, while Brent crude slipped below $84. Both benchmarks had surged above $110 earlier in the conflict as traders priced in the risk of a prolonged disruption to energy flows.
The decline in crude prices helped ease concerns that another energy shock would feed into inflation and force central banks to keep policy tighter for longer. That shift gave risk assets, including Bitcoin, room to rebound.
Still, the recovery remains fragile. The Iran deal removed an immediate macro stressor, but it also pushed the market’s focus back to the Federal Reserve, where newly appointed Chair Kevin Warsh faces his first policy meeting this week.

Selling pressure begins to ease
Bitcoin’s rebound was not driven by macro relief alone, as on-chain and fund-flow data suggest that some of the forced selling that weighed on the market earlier this month has started to cool.
Data from SoSoValue shows US spot Bitcoin ETFs recorded $316 million in outflows last week, marking a notable slowdown after more than $5 billion had exited the funds over the previous four weeks.
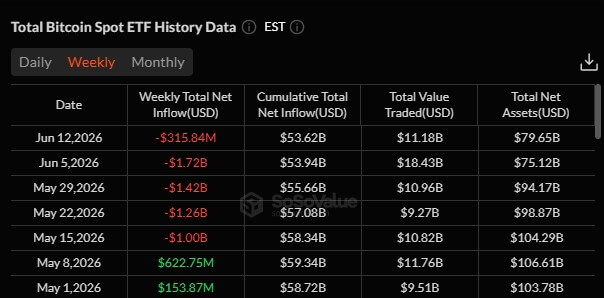
That easing became clearer last Friday, when the funds posted $85 million in net inflows, their strongest single-day positive flows in more than three weeks.
The reversal suggests that Wall Street’s aggressive unwind of long Bitcoin exposure may have reached a point of temporary exhaustion.
CryptoQuant data points to a similar shift among large holders. The firm said whale selling pressure slowed as major wallets appeared to absorb supply near the recent lows.
Its exchange whale ratio rose to 62.3% during the drawdown, indicating that large holders accounted for a larger share of exchange activity as Bitcoin approached the bottom of its recent range.
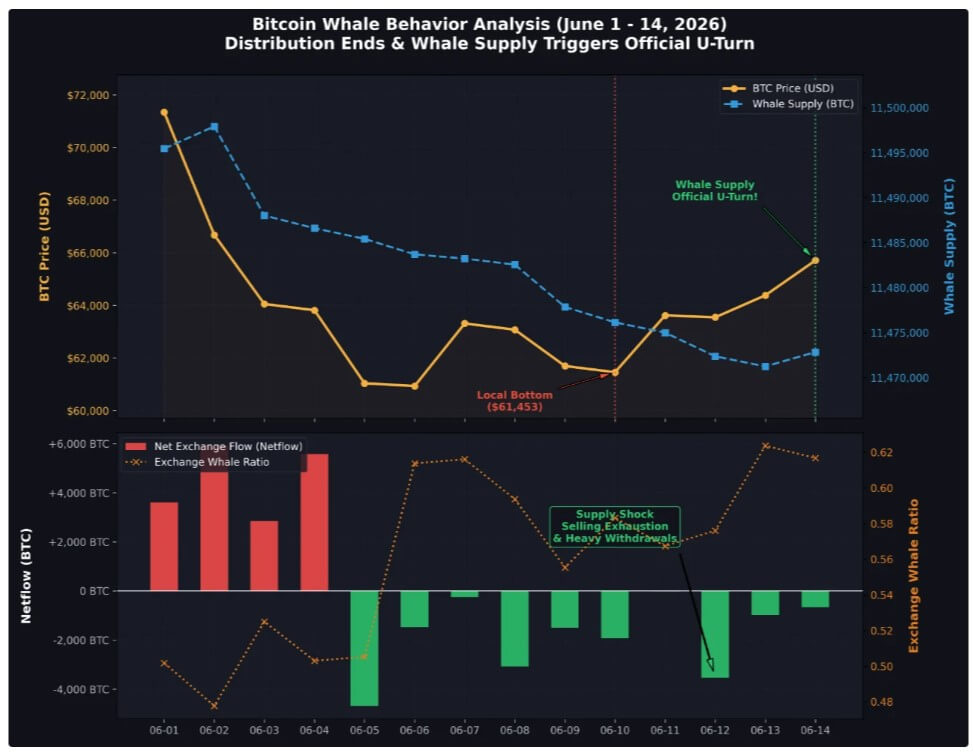
The shift was followed by a wave of withdrawals from trading venues. More than 11,400 BTC, worth roughly $750 million at current prices, were moved from exchanges into cold storage, according to CryptoQuant. By June 14, the total supply held by wallets containing at least 100 BTC had reversed a 12-day decline.
Those signals suggest Bitcoin has moved away from the most aggressive phase of forced selling and into a more balanced structure.
That matters because the recent decline was intensified by weak liquidity, ETF outflows, and derivatives positioning. When those pressures begin to ease and macro conditions improve, relief rallies can move quickly.
Bitcoin must turn relief into demand
For Bitcoin, the next few sessions will show whether today's move marks the start of a broader recovery or another short-lived stabilization rally.
The derivatives market could help determine that outcome.
Crypto research firm 10X Research said Bitcoin’s earlier break below $70,000 triggered forced selling from options dealers who were short gamma around that level. As prices fell, dealers had to sell more of the underlying asset to hedge their exposure, adding pressure to the decline.
That positioning has now shifted lower. According to the firm, the largest negative-gamma strike on the board, worth about $1.8 billion, is now close to Bitcoin’s current spot price.
The setup could cut both ways. If Bitcoin fails to hold current levels, dealer hedging could add renewed pressure.
However, if the market breaks higher, the same mechanics that worsened the selloff could force dealers to buy into the move, strengthening the rebound.
The signal is especially important because implied volatility across major crypto assets has fallen below realized volatility. In effect, options markets are pricing in less movement than Bitcoin has recently delivered.
That leaves the market vulnerable to a sharp repricing if this week’s macro events surprise traders.
The $65,000 level is now the immediate line to watch. If Bitcoin can hold above that area and push toward $68,000 to $70,000 on stronger spot demand and improving ETF flows, the market would have a stronger case for a durable rebound.
However, a move back below $62,000 would weaken that setup and put the $60,000 region back in focus.
The post Bitcoin jumps as Trump’s Iran deal reopens Hormuz – but will Warsh’s first Fed meeting kill the rally? appeared first on CryptoSlate.
The agency that spent the better part of a decade defining crypto policy through enforcement has published a five-year plan describing blockchain as a technology with “the potential to revolutionize America's financial infrastructure.”
The SEC's draft Strategic Plan for fiscal years 2026 through 2030 dedicates a standalone objective to digital assets and blockchain technology, placing the category alongside investor protection, capital formation, and agency modernization.
In the plan, the agency laid out its plan to build a regulatory foundation for the sector through a “rational, coherent, and principled approach.”
Two days later, Jamie Selway, director of the SEC's Division of Trading and Markets, told the Piper Sandler Global Exchange & Fintech Conference in New York that his division is developing a framework for listing and trading tokenized securities. SEC and CFTC staff are working jointly to resolve conflicting rulebooks on swap reporting, portfolio margining, and product definitions.
The plan and the remarks suggest that one of the SEC's most important policy shifts may arrive before any new rule does, as the agency is changing the narrative by which institutions evaluate the technology.
According to Jennie Levin, chief legal and operating officer at the Algorand Foundation and a former federal prosecutor, that shift directly affects how banks, asset managers, and public companies allocate capital.
SEC's language as regulatory architecture
Institutional adoption of blockchain has never been constrained by the technology itself. The bigger obstacles have always been legal uncertainty and reputational risk, and both depend on how regulators define what they're regulating.
When the SEC discussed digital assets almost exclusively through enforcement actions, compliance teams treated any blockchain initiative as exposure to a speculative asset class with unresolved legal status. The new framing, despite being abstract, changes the practical question those teams are asked to answer.
“For institutions, stripping the word ‘crypto' out of the conversation and replacing it with ‘market modernization' fundamentally changes the risk calculus,” Levin said. “Compliance teams that were previously sitting on the sidelines are no longer being asked to underwrite a speculative asset class. Instead, they are being asked to evaluate a more efficient, secure way to run the financial infrastructure they already operate every day.”
Levin describes the SEC's stance as “an invitation to build within a known legal architecture rather than wait for enforcement to define the boundaries,” and that invitation carries weight because markets tend to respond more strongly to certainty than to deregulation.
Even a roadmap with no binding force can influence capital allocation years before any formal rules are adopted, because internal risk committees factor regulatory direction into project approvals long before any rule takes effect, and a documented agency commitment gives those committees something concrete to work with.
The plan's substance supports the rhetorical shift. The SEC's document identifies tokenized offerings and on-chain financial infrastructure as areas where the agency intends to support compliant capital formation, and it states that custody, trading, and staking services should be able to operate under appropriate oversight without duplicative or conflicting requirements.
That language extends a sequence of actions stretching back through the year, including the contemplated innovation exemption for tokenized stocks, the April staff statement that gave self-custody trading interfaces a five-year runway to obtain broker licenses, and the approvals that let Nasdaq in March and the NYSE in April begin trading tokenized versions of select equities alongside traditional shares.
Each of these steps has moved blockchain further from the periphery of securities policy and deeper into the agency's core agenda, a contest over who controls tokenized equities that Wall Street incumbents are watching as closely as crypto firms are.
Programmable compliance and the harmonization catalyst
Selway's principle of “innovation without arbitrage” addresses the most persistent skepticism about tokenized markets, which holds that blockchain's efficiency gains depend on escaping the obligations that traditional venues impose.
However, Levin outright rejects that premise:
“The assumption that blockchain's efficiency depends on regulatory arbitrage has always been a distraction,” she told CryptoSlate. “The real inefficiencies in traditional markets are fragmented settlement infrastructure and the reconciliation layers built on top of it, and intermediaries that exist to manufacture trust rather than add value. A public ledger does not need legal shortcuts to outperform that system.”
She believes applying traditional standards to on-chain markets just relocates compliance from a manual process at the end of a transaction to automated checks at execution. Transfer restrictions, allow lists, and freeze-and-clawback controls can be enforced at the protocol level, making the guardrails that currently require entire teams to administer become properties of the asset itself. The efficiency argument and the investor-protection argument no longer pull in opposite directions once compliance is embedded in the instrument's design.
Selway paired his invitation with a warning, cautioning that venue shopping and leverage pushed to unsophisticated retail investors would undermine the effort. Levin agrees, saying that the networks positioned to win in a “harmonized environment” are those that treated compliance as a requirement from the start.
The harmonization they're both referring to may prove to be the larger catalyst, because jurisdictional ambiguity has imposed costs that show up well before any product reaches the market.
For years, uncertainty over whether a given asset falls under SEC or CFTC jurisdiction has stalled institutional projects long after the technology was ready.
“The single greatest friction point has been the structural paralysis created by agency fragmentation,” Levin said. “Roadmaps end up sitting in legal review indefinitely, and capital defaults offshore out of self-preservation.”
A unified token taxonomy, she argues, changes that from day one, because predictable classification lets risk committees decide with confidence, and the first market impact we'd see would be faster internal decisions rather than lower compliance costs.
Statutory backing remains the missing piece, and its timeline is tightening. The CLARITY Act, which passed the House 294-134 in July 2025 and cleared the Senate Banking Committee 15-9 in May, was placed on the Senate Legislative Calendar at the start of June. It'll still need 60 votes on the floor before the August recess, and Galaxy Digital recently cut its odds of 2026 passage to 60% from 75% due to scheduling pressure alone, while Polymarket prices the outcome in the mid-50s%.
As Levin puts it, “an interpretation is a bridge, not the destination,” and the bill is what would lock a unified taxonomy into statute.
If anything mentioned in the SEC's strategy actually becomes operational policy, it will most likely show up in a handful of milestones: formal proposals governing tokenized securities, measurable progress on SEC-CFTC harmonization, a CLARITY Act floor vote, institutional launches of tokenized products on public rails, and further guidance on custody and settlement.
If those arrive, the main beneficiaries will definitely be the infrastructure providers enabling compliant capital markets rather than speculative tokens.
The bigger change, though, has already happened. An agency that once asked whether blockchain belonged in the financial system at all is now drafting plans for how the technology should modernize that system while preserving the investor protections beneath it.
The future of tokenization, based on this evidence, depends far less on deregulation than on institutional confidence that innovation can operate inside a stable and predictable legal framework. And that kind of confidence is what a five-year roadmap was designed to produce.
The post How the SEC’s five-year plan could accelerate tokenized capital markets appeared first on CryptoSlate.
One month after THYP launched on Nasdaq, the three US-traded spot HYPE ETFs have pulled in $161 million in net inflows.
June 5 was the only session to register an outflow, a $2.9 million redemption from BHYP, and every other trading day has closed in the green.
The clean flow record partly reflects access mechanics, as Hyperliquid restricts US users from its platform, leaving brokerage-listed ETFs as the only way American investors can hold HYPE without navigating a non-custodial wallet.
The more durable driver is the asset itself, a derivatives venue with auditable usage metrics, a fee-to-buyback tokenomics loop, and a platform already processing hundreds of billions in monthly volume.
The business behind the token
DefiLlama shows $240.5 billion in 30-day perp volume, $72.4 billion over seven days, and $9.4 billion over 24 hours, with cumulative perp volume standing at $4.663 trillion.
The open interest is currently $8.6 billion, with annualized fees exceeding $1 billion and annualized revenue near $886 million.
| Metric | Latest figure | Why it matters |
|---|---|---|
| 30-day perp volume | $240.5B | Core activity driver behind fees |
| 7-day perp volume | $72.4B | Shows recent momentum |
| 24-hour perp volume | $9.4B | Fresh liquidity snapshot |
| Cumulative perp volume | $4.663T | Establishes Hyperliquid as a scaled venue |
| Open interest | $8.6B | Measures live trader positioning |
| Annualized fees | >$1B | Shows exchange-like fee generation |
| Annualized revenue | ~$886M | Supports the exchange-equity comparison |
| Fee routing | 99% to Assistance Fund buybacks | Connects usage to HYPE demand |
CoinGlass reported nearly $493 billion in derivatives volume for the first quarter, and DefiLlama's cumulative figure has moved to roughly $443 billion. 21Shares cited $4.22 trillion at the time of THYP's mid-May launch.
DefiLlama's fee methodology states that 99% of Hyperliquid perps fees go to the Assistance Fund for buying HYPE tokens, excluding builder fees. Bitwise, the issuer behind BHYP, frames this as “virtually all” of its trading revenue being recycled into open-market buybacks.
That structure lets ETF issuers pitch HYPE the way an equity analyst would pitch an exchange stock, focusing on how higher volume produces higher fees, higher fees fund more buybacks, and buybacks tighten the float.
BHYP's own page reports $93.53 million in AUM, 1.587 million HYPE held as of June 10, a 2.25% gross staking reward rate, a 1.18% net staking reward rate, and 70% of assets currently staked.
Bitwise CIO Matt Hougan told CNBC the market is “1% penetrated its potential,” adding that most investors still do not know what Hyperliquid is.
Presto Research head of research Peter Chung observed that early data showed institutions piling into HYPE ETFs faster than they did into Bitcoin ETFs on a market-cap-adjusted basis.
HYPE itself hit an all-time high of $75.48 on June 2, is up roughly 160% year-to-date, and trades around $61 as of this writing, giving the protocol a fully diluted valuation approaching $69 billion.
Why this ETF story differs from the others
Solana ETFs are pitched on network activity and developer adoption, while XRP ETFs are pitched on payment utility and legal clarity.
HYPE ETFs offer an underlying asset that is a fractional stake in an exchange cash-flow engine with visible volume, open interest, fees, revenue, and a buyback mechanism tied directly to trading activity.
| ETF asset type | Usual institutional pitch | Main metric investors watch | What makes HYPE different |
|---|---|---|---|
| Bitcoin ETF | Digital gold / macro hedge | Flows, liquidity, correlation, supply | Store-of-value exposure |
| Solana ETF | High-throughput L1 ecosystem | Developer activity, apps, staking, fees | Network-growth exposure |
| XRP ETF | Payments / legal clarity | Settlement utility, liquidity, regulatory status | Payments narrative |
| HYPE ETF | Onchain derivatives exchange | Perp volume, OI, fees, revenue, buybacks | Exchange-business exposure |
HIP-3, Hyperliquid's permissionless framework for launching perpetual futures on any asset with a price feed, has pulled crypto's share of total volume down from roughly 90% to around 65%.
On some days, five of the top ten assets by volume are now traditional markets: the S&P 500 via a licensed contract with S&P Dow Jones Indices, silver, Nasdaq-100, WTI, and Brent crude.
HIP-3 open interest reached $1.7 billion in mid-May, up more than 150% from February. Trade.xyz, the largest HIP-3 deployer and a product of Hyperliquid's own tokenization arm Hyperunit, accounts for $1.58 billion of that total and has processed over $100 billion in volume since October 2025.
That revenue diversification directly strengthens the bull case for an exchange capturing oil, equity index, and silver volume, as it can sustain its fee run rate.
How exchange-equity logic holds or fails
The bull case holds if Hyperliquid's 30-day perp volume stays above $200 billion, keeping annualized revenue near the current $885 million run rate or climbing toward $1.2 billion as 21Shares projects in its upside scenario.
ETF inflows become a durable third demand channel alongside organic staking and protocol buybacks, HIP-3 open interest pushes past $3 billion, and HYPE trades more like a high-growth exchange asset than a high-beta DeFi token.
The bear case opens with monthly volume collapsing below $150 billion, pulling annualized revenue into the $350-$450 million range that 21Shares models in its downside scenario, implying a token price in the $15-$19 zone.
Token unlocks could outpace buyback demand at lower revenue run rates. ETF outflows would then amplify downward price moves, given HYPE's concentrated float.
The only sustained outflow session on record so far produced no observable price damage, but that ratio would look very different at ten times the scale.
| Scenario | Key trigger | Revenue implication | Token implication | What to watch |
|---|---|---|---|---|
| Bull case | 30-day perp volume stays above $200B and HIP-3 OI pushes above $3B | Revenue holds near $885M or rises toward $1.2B | HYPE trades more like a growth exchange asset | ETF inflows, buybacks, HIP-3 volume |
| Base case | Volume remains high but stops accelerating | Revenue remains below upside targets but above bear case | HYPE consolidates after YTD gains | 30-day volume, staking rate, AUM growth |
| Bear case | Monthly volume falls below $150B | Revenue drops toward $350M–$450M | HYPE risks repricing toward the $15–$19 downside model | ETF outflows, unlock pressure, lower volatility |
| Shock case | Regulatory action hits commodity perps or tokenized markets | Revenue base becomes impaired | ETF demand weakens quickly | Enforcement headlines, market delistings, validator risk |
What the risks look like from inside the prospectus
Bitwise's BHYP documentation classifies the fund as outside the 1940 Act, noting that staking introduces slashing risk, reward-loss risk, and redemption-timing risk. 21Shares flags centralization and validator attack vector risks alongside regulatory uncertainty.
Both issuers frame HYPE as a speculative exposure to an early-stage venue, distinct from a regulated exchange.
The platform competes with centralized venues that have far deeper liquidity and compliance infrastructure, and depends on the continued willingness of builders to deploy HIP-3 markets at scale.
Hyperliquid became a 24/7 macro trading venue partly because the US-Iran conflict last summer sent traders scrambling for oil access on weekends, when traditional futures exchanges were closed.
That growth episode put the platform directly in front of commodity regulators who have historically been aggressive about jurisdiction.
An enforcement headline targeting commodity perps or tokenized equities on the platform would hit the revenue base that the ETF pitch depends on.
The next test is whether ETF inflows hold as HYPE's year-to-date outperformance matures and early buyers consider taking profit.
Bitwise has committed 10% of BHYP management fees to purchase and stake HYPE on its own balance sheet, adding a structural demand floor tied to AUM.
Whether that, combined with the protocol's buyback engine, is enough to absorb future unlock-driven selling depends entirely on whether the volume numbers that underpin the thesis keep printing.
The post HYPE ETFs quietly pulled $161M in one month as Wall Street buys crypto’s on-chain exchange bet appeared first on CryptoSlate.
Everyone knows about the ETFs, but almost nobody knows about the dozens of obscure institutional products being built around Bitcoin while the funds soak up all the attention, from a $40 million insurance reserve in Barbados to an S&P-rated bond deal sold to Wall Street investors by Jefferies.
The ETFs answered only one question, which was how ordinary investors and institutions could own Bitcoin inside a regulated wrapper. The products in this article answer a different, and arguably bigger one: what can you actually do with Bitcoin once you own it?
The answer is: the same things finance has always done with US Treasuries and gold. You can pledge it to borrow money, post it as margin for trades, hold it as the reserve behind an insurance policy, or build a corporate balance sheet on top of it.
Assets that can do all of that at once are sometimes called financial primitives, which is a fancy way of saying building blocks: things so widely accepted and easy to value that the rest of the financial system stacks loans, bonds, and derivatives on top of them. Treasuries earned that status because everyone agrees on what they're worth and how to seize them if a deal goes wrong.
Bitcoin is now being tested for the same job, and the early results explain why some of the biggest players in this market really, truly don't care if the price goes up or down.
Insurance reserves, consumer credit, and the very first rated Bitcoin bond
In March 2025, Tabit Insurance, a Barbados-licensed carrier founded by former executives of the Bittrex exchange, capitalized a $40 million property and casualty insurance facility funded entirely in Bitcoin.
Essentially, people who hold Bitcoin hand it over to back real insurance policies that cover storm damage and lawsuits against company directors, and in exchange, earn a dollar yield that runs near 10%. The policies and premiums stay in US dollars, so customers never touch crypto, while Bitcoin sits in reserve as the money that pays claims if things go wrong.
Tabit holds a Class 2 license from the Barbados Financial Services Commission and is set up as a segregated cell company, meaning each investor pool is legally walled off from the others, so one cell's losses can't drain another's capital.
Regulators and auditors can also check reserves on the blockchain in real time, providing more transparency than traditional insurers offer in their quarterly filings. CEO Stephen Stonberg said that the entire global reinsurance industry runs on roughly $800 billion of capital, while Bitcoin is an asset class worth trillions, so even a sliver of that wealth flowing into underwriting would be felt across the industry.
While insurance reserves are certainly a pretty unexpected use case for Bitcoin, lending is where the money starts to get serious. A Bitcoin-backed loan works the way it sounds: you pledge your coins to a lender, you receive dollars, and you get the coins back when you repay.
Holders do this because selling would trigger a taxable gain and end their exposure to future price increases, while borrowing against the coins gives them cash without giving up either.
Volumes across platforms reached roughly $2 billion in 2025, and Toronto-based Ledn alone reports more than $9.5 billion in originations since 2018, with JPMorgan and other major banks now rolling out similar offerings to their own clients.
In February 2026, that lending business crossed into the mainstream bond market. Ledn closed a $188 million securitization, which means it bundled 5,441 of its loans into a pool and sold bonds whose interest payments come from the borrowers' repayments.
The bonds were sliced into two layers: $160 million of senior notes that get paid first, which S&P Global rated BBB-, an investment-grade stamp and the first ever given to a security backed by digital assets, and $28 million of riskier junior notes rated B- that absorb the first losses in exchange for a higher yield.
The numbers underneath were pretty conservative by crypto standards. The 2,914 US borrowers in the pool owed $199.1 million but had posted roughly 4,079 BTC worth $356.9 million, which works out to a loan-to-value ratio of 55.8%, meaning they pledged almost $2 of Bitcoin for every $1 they borrowed.
They paid a weighted-average interest rate of 11.8% on loans that come due in a single lump sum within a year. Investors demanded about 3.35 percentage points of extra yield over comparable conventional bonds to hold BTC as collateral, and even at that price, the deal was more than twice oversubscribed.
Ledn CEO Adam Reeds said the structure created a “direct pipeline between Bitcoin holders seeking liquidity and the world's deepest pools of institutional capital,” while Bitwise's European research head Andre Dragosch said the deal was evidence that traditional finance now treats Bitcoin as legitimate, even pristine, collateral.
The structure was stress-tested almost immediately, revealing both the strength and the fragility of the entire model. Bitcoin fell roughly 27% from mid-January into February 2026, which pushed loan-to-value ratios up across the pool and triggered margin calls, the automated demands that borrowers either add collateral or watch the lender sell it.
Ledn ended up liquidating about a quarter of the loans originally slated for the deal. The sale still closed, partly because those automatic liquidations did exactly what they were designed to do, and Ledn had never taken a loss when selling collateral for a breach.
The consequence to keep in mind runs the other way: when many lenders run the same triggers on the same volatile asset, a sharp price drop forces them all to sell at once, and that selling pushes the price down further, triggering more selling. The system passed its first real test, and it also revealed where it would break under enough pressure.
Collateral networks, carry trades, and corporate balance sheets
Underneath these products, the basic machinery of the market is being rebuilt to look more like the markets for currencies and bonds, where the company holding your assets, the platform where you trade, and the system that settles the trade are three separate things.
Anchorage Digital, which operates the only federally chartered crypto bank in the US, launched its Atlas settlement network in April 2024 so institutions could settle trades directly with each other without parking money in escrow or pre-funding accounts at an exchange.
By March 2026, Atlas had connected nearly 600 participants, four times as many as a year earlier, had processed tens of billions of dollars in settlements, and had expanded into managing collateral, meaning the bank now monitors loan positions, issues margin calls, and handles liquidations on behalf of lenders.
Cantor Fitzgerald picked Anchorage and Copper.co to play that role for its global Bitcoin financing business in March 2025, and Copper's ClearLoop system lets trading companies keep their coins locked at the custodian while still trading on multiple exchanges, so a repeat of the FTX collapse couldn't take client assets down with it.
All of this allows posting Bitcoin as margin to become as routine and as safe as posting Treasuries, which is the precondition for everything else mentioned we've mentioned in this article to scale.
Plenty of the institutional money flowing through that machinery has no opinion on Bitcoin at all. The basis trade, one of the most popular institutional strategies since the ETFs launched, exploits the fact that Bitcoin futures usually trade slightly above the spot price: a fund buys spot Bitcoin or ETF shares, simultaneously sells futures contracts at the higher price, and pockets the gap no matter what the price does next, since the gain on one leg offsets the loss on the other.
After the ETFs gave funds an easy way to hold the spot side, hedge funds built record short positions in CME futures, and open interest there climbed from roughly 30,000 contracts in early 2024 to a peak near 45,000 that November.
The trade grew large enough that its unwinding now moves the market on its own, with CME open interest falling below $10 billion in April 2026 as those paired positions closed and the mechanical selling weighed on prices regardless of anyone's mood.
CME keeps building for this crowd, adding 24/7 trading in May 2026 and launching Bitcoin Volatility Index futures in June, which let institutions bet on or hedge against how wildly the price swings rather than where it goes.
Corporate treasuries have pushed the idea furthest of all. Strategy held 843,738 BTC as of late May 2026. The company issued $6.7 billion in convertible notes, which are bonds that can turn into shares if the stock rises, plus $15.5 billion in preferred stock across five different instruments, securities that pay fixed dividends and sit between debt and common shares in the pecking order, to finance their insane BTC purchases.
It raised $25.3 billion in 2025 alone, making it the largest US equity issuer that year, accounting for roughly 8% of all issuance, and it markets the preferred securities as “Digital Credit,” an entire fixed-income product line whose dividends are ultimately serviced by a Bitcoin balance sheet.
Shareholders effectively get leveraged Bitcoin exposure through a stock; dividend investors get double-digit yields backed by the coins, and imitators from Tokyo-listed Metaplanet to Semler Scientific have copied Michael Saylor's risky playbook.
Private banks run a parallel assembly line for wealthy clients, packaging structured notes that cap the downside of Bitcoin exposure in exchange for giving up some upside, allowing conservative portfolios to hold an asset that would otherwise be too volatile for them.
| If you want to… | The product that does it |
|---|---|
| Earn a dollar yield on idle coins | Bitcoin-funded insurance reserves (Tabit) |
| Borrow dollars without selling BTC | BTC-backed loans (Ledn, JPMorgan) |
| Buy Bitcoin-linked yield without touching BTC | Rated securitizations (Ledn Issuer Trust 2026-1) |
| Post collateral without exchange risk | Prime financing and custody networks (Cantor, Anchorage, Copper) |
| Capture spreads regardless of price | Basis trades (CME futures) |
| Raise capital against a BTC balance sheet | Convertible notes and preferred stock (Strategy) |
| Hold BTC with a capped downside | Structured notes (private banks) |
| Settle trades like FX, around the clock | Settlement networks (Anchorage Atlas) |
Which brings the paradox that opened this piece full circle.
The ETFs answered how institutions could own Bitcoin, and the products described here answer what owning it is for. An asset that simultaneously capitalizes Caribbean reinsurers, backs investment-grade bonds, margins CME derivatives, and services preferred dividends has moved well past speculative adoption into the working machinery of finance.
Historians of this market may eventually treat the ETF as the visible first layer of institutionalization, while the durable change occurred in the financing and settlement systems, where Bitcoin came to do the job Treasuries and gold have done for generations: serving as the collateral everything else gets built on.
The risks are real, as February's liquidation cascade demonstrated, and they'll grow with the leverage. The direction, though, looks settled, and Bitcoin's most consequential institutional role may never show up in a fund flow chart, because it's becoming part of the machine itself.
The post From reinsurance to structured credit: The financial products you didn’t know Bitcoin was powering appeared first on CryptoSlate.
CryptoTicker.io
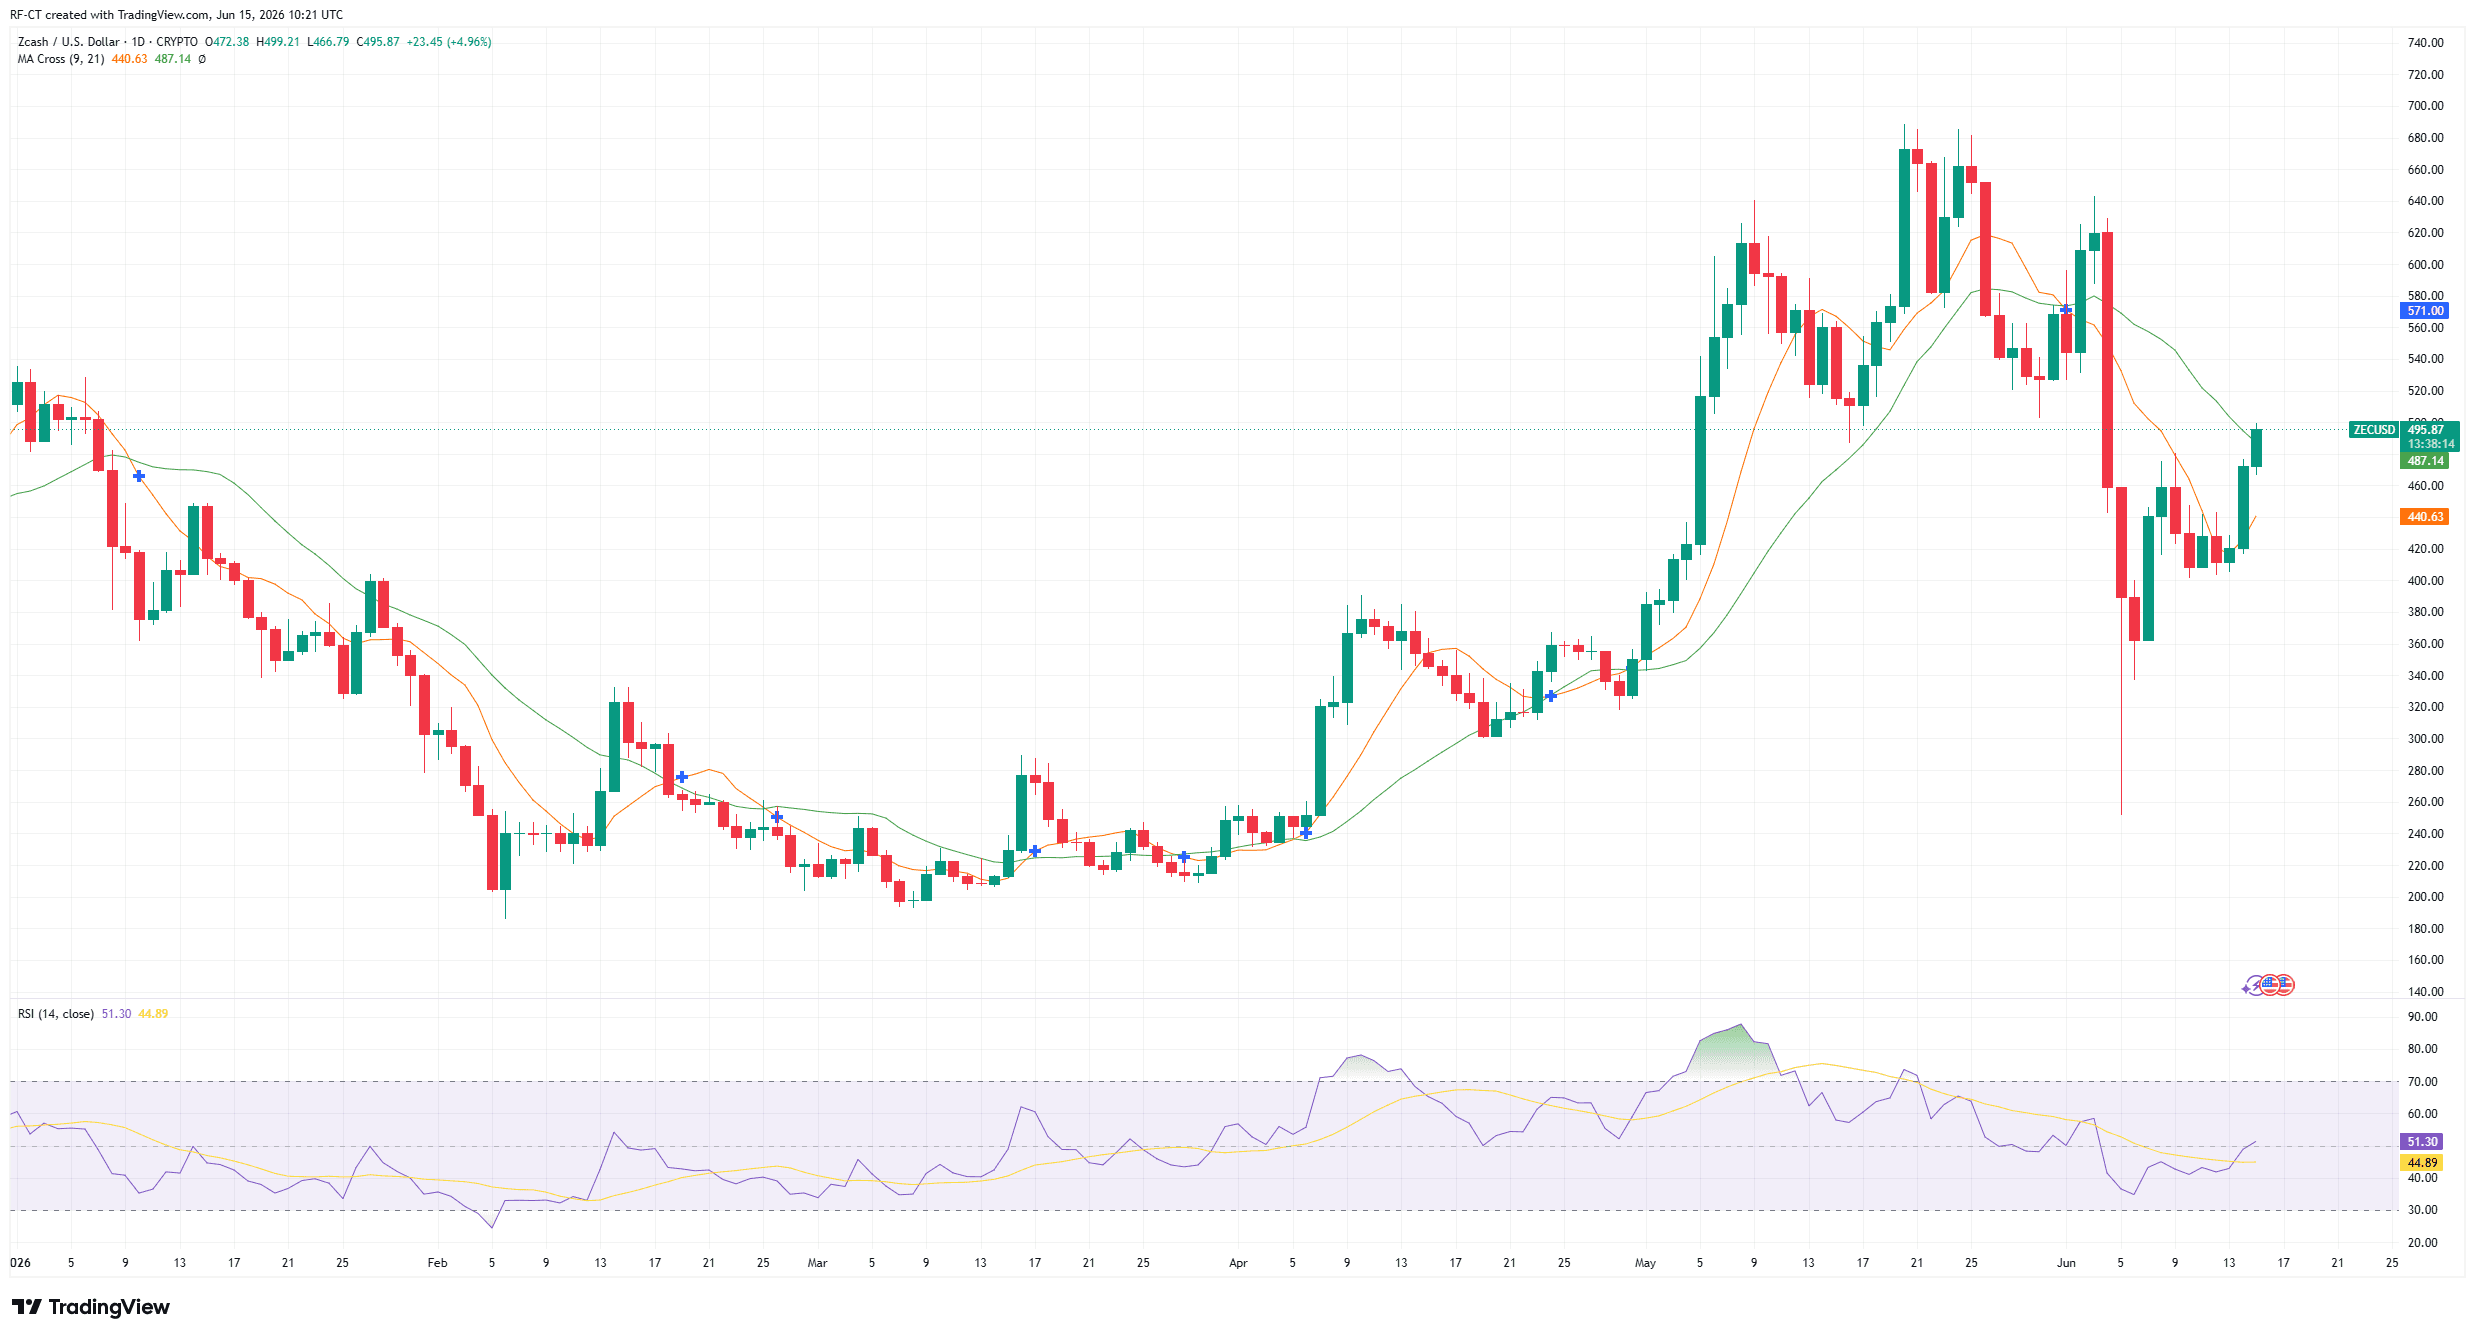
Zcash is suddenly back in the spotlight after becoming one of the strongest performers among the top cryptocurrencies. While Bitcoin and Ethereum are recovering from the recent market sell-off, ZEC is outperforming most major coins with a sharp daily rally.
According to the latest crypto market data, Zcash is trading around $494, up more than 15% in the last 24 hours. Its market cap has climbed above $8 billion, placing it ahead of several major altcoins and making it one of the biggest winners in the current market rebound.
Zcash Leads the Crypto Market Recovery
The broader crypto market is showing signs of recovery after a difficult sell-off, with Bitcoin back above $65,000 and Ethereum moving above $1,700. However, Zcash is standing out with a much stronger move than most large-cap cryptocurrencies.
While BTC is up around 1.5% and ETH is up around 2.3%, ZEC has gained more than 15% in the same period. This makes Zcash one of the strongest performers among the top 20 cryptos, outperforming XRP, Solana, Cardano, Chainlink, Monero, and Bitcoin Cash.
This strong move is especially important because Zcash was recently under pressure with the rest of the market. The sharp rebound suggests that buyers may be returning aggressively to privacy-focused coins, especially as traders look for altcoins with stronger upside momentum.
Why Is ZEC Pumping Today?
The ZEC rally appears to be driven by a mix of market recovery, renewed interest in privacy coins, and strong technical momentum.
Privacy coins have been gaining more attention as the crypto market shifts back toward narratives beyond Bitcoin and Ethereum. Zcash remains one of the most recognized privacy-focused cryptocurrencies, and its position in the top 20 gives it higher visibility when market sentiment improves.
Another reason behind the rally is the technical setup. After the recent correction, ZEC may have entered an oversold or undervalued zone, attracting traders looking for a rebound. Once the price started moving higher, momentum buyers likely joined the move, pushing ZEC above other major altcoins in daily performance.
The strong 24-hour volume also supports the move. Zcash recorded more than $750 million in daily trading volume, showing that the rally is not only based on low liquidity but backed by stronger market activity.
ZEC Price Prediction: Can Zcash Continue Higher?
The key question now is whether ZEC can hold this breakout or whether the current move is only a short-term relief rally.
If Zcash manages to stay above the $480–$500 area, the bullish momentum could continue. A clean hold above this zone would suggest that buyers are defending the recovery and could open the door for another move toward the next resistance levels.
The next upside targets for ZEC could be around $550, followed by $600 if buying pressure continues. A move above $600 would be a strong signal that Zcash is not only recovering from the recent crash but possibly entering a larger bullish continuation phase.
However, traders should also watch for rejection near the current levels. After a 15% daily surge, short-term profit-taking is possible. If ZEC fails to hold above the $480 area, the price could pull back toward $450 or lower before attempting another move higher.
Is Zcash a Buy After the 15% Rally?
Zcash is showing strong momentum, but buying after a sharp daily rally always carries risk. The better setup may depend on whether ZEC can confirm support above the $480–$500 range.
For short-term traders, the most important signal is whether ZEC continues to outperform the broader market. If Bitcoin remains stable above $65,000 and Ethereum holds above $1,700, altcoins like ZEC could continue to benefit from renewed risk appetite.
For longer-term investors, the privacy coin narrative remains the main factor. If market interest in privacy-focused cryptocurrencies continues to grow, Zcash could remain one of the main beneficiaries because of its strong brand, large market cap, and long history in the crypto market.
Conclusion: ZEC Becomes One of the Strongest Crypto Gainers
Zcash has become one of the biggest winners in the latest crypto market rebound, surging more than 15% in 24 hours and pushing its market cap above $8 billion. The move comes as Bitcoin and Ethereum recover, but ZEC is clearly outperforming most major cryptocurrencies.
The next major test is whether Zcash can hold the $480–$500 area. If buyers defend this zone, ZEC could aim for $550 and possibly $600 next. But if the rally loses strength, a short-term pullback could happen before the next attempt higher.
For now, Zcash is one of the most important coins to watch as privacy coins lead the latest altcoin recovery.
To be precise about a fast-moving story: a deal has not been signed yet, and the Strait of Hormuz is not confirmed open. What happened is that President Trump announced a signing is imminent. Trump said on Saturday that a deal with Iran to end the war "is scheduled to get signed tomorrow" and that "immediately after it is signed, the Hormuz Strait is OPEN TO ALL."
Iran, however, has signaled caution on the timing. Iranian Foreign Ministry spokesman Esmaeil Baqaei said on June 13 that signing was unlikely that Sunday, that the agreement could still be signed in the coming days, but warned against predicting a timeline due to what he called "the hesitancy of the other side." As of now, mediation continues: Qatari negotiators traveled to Tehran in a bid to finalize the deal, even as Trump said it was scheduled for June 14 and Hormuz would reopen "to all" immediately afterward, despite conflicting signals from Tehran. In short: imminent and heavily negotiated, but not yet done.
What's Reportedly in the US-Iran Deal
The terms being reported are significant, both geopolitically and for markets. According to a senior Iranian official cited by Reuters, the draft stipulates that Iran would immediately open the Strait of Hormuz while the US lifts its naval blockade of Iranian ports, releases $25 billion of Iran's frozen assets, imposes no new sanctions until a final deal, and waives oil sanctions on Tehran. In return, Iran would agree not to produce or purchase nuclear weapons, enrich no new uranium until a final deal, and dilute its highly enriched uranium stockpile domestically.
On the waterway itself, the mechanics matter for oil. Per sources cited by NBC News, the memorandum would reopen the Strait of Hormuz immediately without tolls and restore prewar shipping within roughly 30 days, alongside lifting the US blockade of Iran's ports, with a 60-day extension of the current ceasefire.
Why This Matters for Crypto
Here's the connection that makes this a crypto story, not just a geopolitics one. The Iran conflict has been a direct source of the "risk-off" pressure weighing on $Bitcoin and the broader crypto market. In recent sessions, crypto's weakness was explicitly tied to the conflict: global equities fell and oil rose as US forces struck Iran and the prior ceasefire collapsed, dragging risk assets — including crypto — lower.
The Strait of Hormuz is the key transmission channel. For roughly three months, the Strait of Hormuz — which normally carries one-fifth of the world's oil — has been closed to most shipping traffic, drawing down global oil inventories at a rapid pace. That closure pushed oil prices up, which feeds inflation, which keeps central banks hawkish — and a hawkish, high-inflation backdrop is exactly what has been suppressing Bitcoin. A credible deal that reopens Hormuz would, in theory, ease oil prices, soften inflation pressure, and remove a major overhang on risk appetite. That's the bullish case crypto traders are watching.
The Catalyst Timing: Why This Week Is Pivotal
The deal headlines collide with the single most important macro event on the crypto calendar this week: the Federal Reserve meeting. Markets have been treating the June 16–17 FOMC as the decisive near-term catalyst for $BTC, with analysts framing the outcome as the difference between a bounce toward the high-$60Ks/low-$70Ks and a break below $60K. An Iran de-escalation landing in the same window could amplify whichever direction the Fed sets — easing geopolitical and oil-price fear right as rate expectations are reset.
The Risks: Why Not to Trade the Headline
A word of caution that the on-and-off history of this conflict fully justifies. Previous "imminent deal" moments have repeatedly failed to materialize, and the current framework still hinges on final sign-off from Tehran. Sources indicate the final sign-off from Iran's Supreme Leader is the last missing piece. The agreement is also fragile to outside events: the latest reporting notes fresh Israeli strikes in Lebanon that could threaten the deal. For crypto traders, that means an announced reopening of Hormuz can move markets fast in either direction — and an unsigned deal can unravel just as quickly.
Is Bitcoin Near a Bottom? The Short Answer
Bitcoin has entered a deep bear-market valuation zone, meaning several on-chain and sentiment metrics now sit at levels that historically appear near major market bottoms. But "bottom valuation zone" is not the same as a confirmed bottom. As of mid-June 2026, the evidence is genuinely two-sided: Bitcoin looks historically cheap by on-chain measures, yet analysts warn that the hardest phase — a slow, grinding sideways market — may still lie ahead. The near-term direction likely hinges on the June 16–17 Federal Reserve meeting.
Here is what the data actually shows, metric by metric.
Where Bitcoin's Price Stands in June 2026
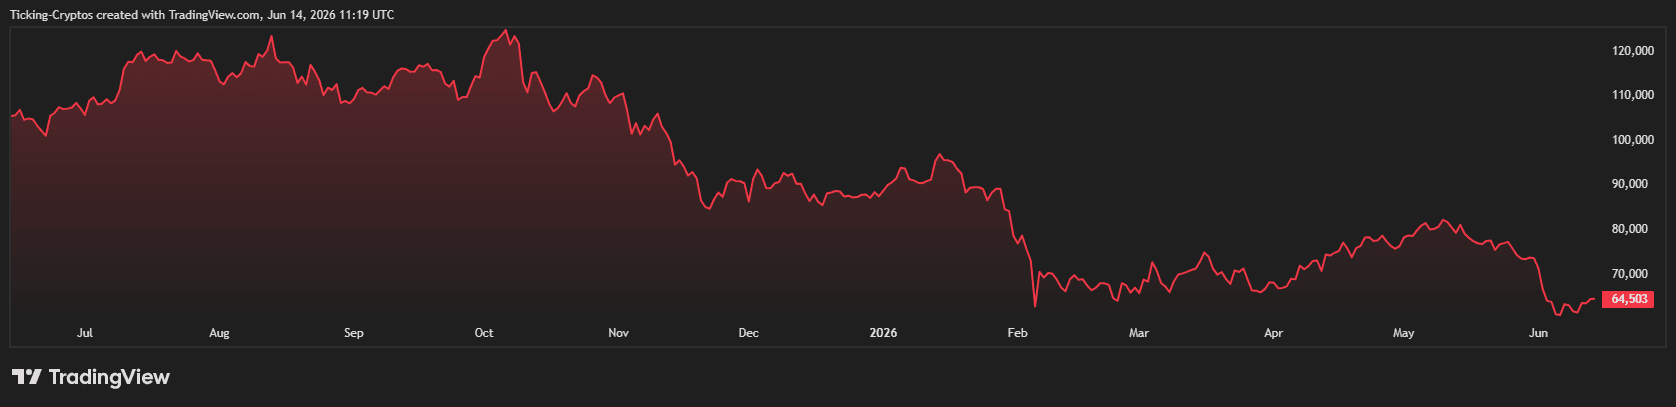
$Bitcoin recently hit its lowest levels in roughly two years. Bitcoin briefly fell below $60,000 for the first time since 2024 before rebounding to around $62,623, up 1.9% on the day but still posting a weekly loss. The price is now resting on a long-term support line that technical analysts treat as a generational floor. Bitcoin is trading near its historically depressed 200-week average, a level typically seen late in bear markets, even after the hottest U.S. inflation reading in three years.
The key support and resistance levels to watch are clear. Immediate support sits at $62,000–63,000, then the $60,000 psychological line, with $55,000–58,000 as the deeper stress zone; resistance is the $70,000–74,000 band, and a weekly close on either side of $60,000 is the near-term tell.
What On-Chain Data Says About a Bitcoin Bottom
The strongest argument that Bitcoin is near a bottom comes from on-chain valuation, specifically the realized price — the average price at which all circulating Bitcoin last moved, which acts as the network's aggregate cost basis. Current on-chain data places Bitcoin's realized price near $54,000 and the average cost basis of long-term holders around $48,000 — levels that have historically served as critical support zones during previous market cycles.
This matters because of what trading below realized price signals. When Bitcoin trades below its realized price, the average holder is underwater, and prolonged trading below that level has been rare and often associated with major bear-market bottoms. Other valuation frameworks agree the discount is steep. Checkonchain places Bitcoin's current valuation in the bottom 10% of its historical range, a zone that has frequently appeared during the weakest phases of market cycles. Some analysts name a specific floor: CryptoQuant flags $53,600 as the structural bottom zone, with the 14-day RSI at 24, deep in oversold territory.
What Sentiment Data Reveals
Market sentiment has washed out to levels that typically accompany capitulation. The Crypto Fear and Greed Index sits at 21, deep in extreme fear, down from 50 last month — readings that usually appear when price-sensitive sellers have already done most of their selling. Historically, fear readings have clustered near local and cyclical lows, because they indicate that the holders most likely to panic-sell have largely already exited.
Why Bitcoin May Not Have Bottomed Yet
Here is the crucial counterpoint, and the reason a "bottom valuation zone" is not a green light. A market bottom is usually a process that unfolds over months, not a single dramatic low. As on-chain analyst Checkonchain explains, bear-market bottoms are a process, not an event: first price-sensitive investors capitulate, then comes the harder phase of months of sideways action that slowly wear down the conviction of those who remain.
In practical terms, Bitcoin can be at a historic valuation discount while the time dimension of the bottom has not yet played out. That is the trap for impatient buyers: being correct on value, yet enduring an extended grind before any durable recovery begins.
The Macro Factors That Could Decide Bitcoin's Next Move
Bitcoin is not falling in isolation, and the broader backdrop is pressuring all risk assets. Global equities fell to a more-than-one-month low as a technology-led selloff deepened and US forces struck multiple targets in Iran, collapsing the ceasefire that had held since April, while Brent crude rose toward $95 a barrel. Regulatory optimism has cooled too. Hopes for US regulatory clarity weakened again, with Polymarket odds of the Clarity Act passing in 2026 dropping from 62% to 48% in a week.
The single biggest near-term catalyst is the Federal Reserve. All eyes turn to the FOMC on June 16–17, with Wirex's head of trading saying Fed Chair Warsh's tone will be decisive in determining whether Bitcoin bounces toward $68–72K or breaks below $60K entirely.
So, Is Bitcoin Near a Bottom? The Bottom Line
By valuation, Bitcoin is in a zone that has historically rewarded patient buyers: realized price near $54,000, long-term holder cost basis around $48,000, sentiment at single-digit extreme fear, and price pinned to its 200-week average. By timing, the same analysts flagging that discount caution that bottoms are slow processes, and a months-long sideways grind is a more likely path than a clean V-shaped recovery. The honest answer is that Bitcoin is near a bottom valuation, but whether the price bottom is in depends heavily on macro conditions — with the June 16–17 Fed meeting and a weekly close around $60,000 as the immediate signals to watch.
The crypto market is showing a steady, broadly green session today, with the major assets posting modest daily gains and stronger weekly performance. The CoinMarketCap 20 Index (CMC20), which tracks the top 20 cryptocurrencies, sits at $129.08, up 0.96% on the day and 3.48% over the week — though still down 30.39% year-to-date, a reminder that the broader market remains well below where it started 2026.
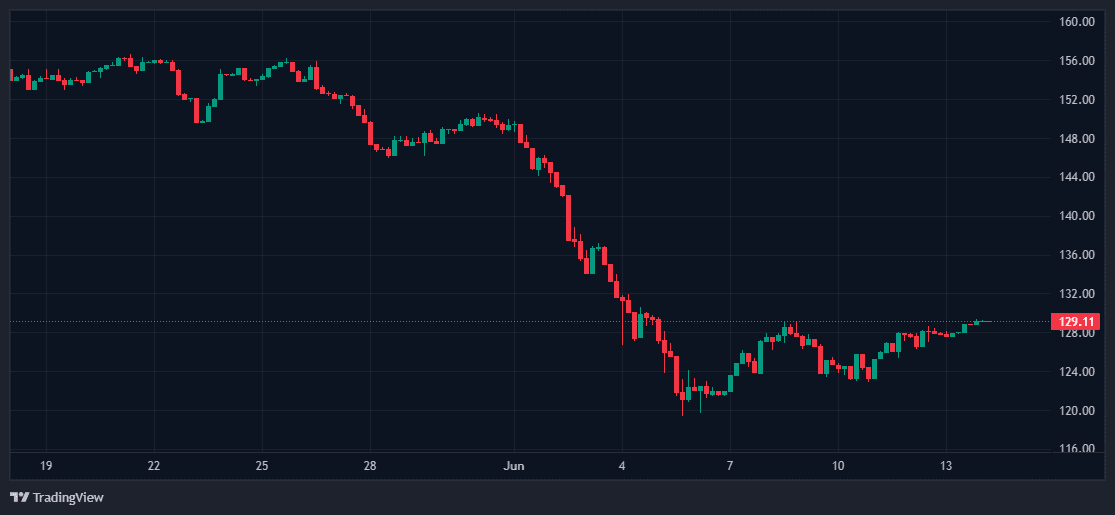
Here's where the major coins stand right now.
Bitcoin ($BTC) Price Today
Bitcoin is trading at $64,278.22, up a slight 0.79% over the past 24 hours and 3.35% on the week. As the market's anchor, BTC's quiet daily move masks a more meaningful weekly recovery, but the year-to-date figure tells the harder story: Bitcoin is down 26.55% in 2026 so far. With a market cap of roughly $1.29 trillion, it remains by far the largest cryptocurrency and the reference point for the entire market's direction.
Ethereum ($ETH) Price Today
Ethereum is changing hands at $1,673.77, essentially flat on the day at +0.10% but up a solid 3.94% over the week. Notably, ETH is the standout on the year-to-date column among the majors, up 43.59% — a sharp contrast to Bitcoin's negative YTD and a sign that Ethereum has outperformed the market leader across 2026. Its market cap stands at around $202 billion, keeping it firmly in the number-two spot.
BNB ($BNB) Price Today
BNB is trading at $609.80, up 1.17% on the day — one of the stronger 24-hour moves among the top assets — and 3.56% on the week. Like most of the majors outside Ethereum, its year-to-date figure is negative at -29.36%. With a market cap near $82 billion, BNB holds its position as one of the largest exchange-linked tokens in the market.
XRP ($XRP) Price Today
XRP is priced at $1.14, up 0.25% on the day and 0.98% over the week — the most muted weekly gain among the majors. Its year-to-date performance sits at -37.85%, among the weaker YTD figures in the top ten. XRP's market cap is approximately $71 billion, placing it just behind BNB among the largest non-stablecoin assets.
Solana ($SOL) Price Today
Solana is the clear weekly leader among the majors, trading at $68.08 with a 1.36% daily gain and a strong 4.97% rise over the past seven days — the best weekly performance of any major coin in this snapshot. It also leads on the year, up 45.30% YTD, narrowly edging out Ethereum for the strongest year-to-date showing among the top assets. Solana's market cap stands at around $39 billion.
Other Movers: TRON and Hyperliquid
Beyond the top five non-stablecoin assets, TRON ($TRX) trades at $0.3160, up 0.25% on the day but down 3.60% on the week, while standing out with a positive year-to-date of +11.20%. Hyperliquid ($HYPE) rounds out the list with a market cap of roughly $5.2 billion, reflecting the continued growth of newer DeFi-native tokens in the current cycle.
SIREN is a textbook 2026 cautionary tale: an AI-branded meme coin on BNB Chain with no shipped product, a supply almost entirely controlled by one entity, and a price chart that looks like a heart attack. It rocketed thousands of percent, collapsed in late March, staged another rally, and is now collapsing again — each leg down lining up neatly with the dominant holder selling into retail enthusiasm. If you want a single sentence: when one wallet cluster owns most of the float, the "market" is really just that holder's decision to sell.
What is Siren Crypto?
SIREN markets itself as an AI play. It's a BNB Chain token built around a dual-personality AI agent concept — the "Golden" and "Crimson" Sirens — with a planned AI-powered DEX and trading agent. The pitch leaned on the two hottest narratives in crypto at once: AI and meme-coin virality.
The problem is the gap between story and substance. The AI products were announced but never shipped; the DEX and AI trading agent remained "coming soon," while a single entity controlled the vast majority of supply. According to on-chain investigators, the project's origins were already shaky: Bubblemaps said SIREN launched in February 2025 as the "first on-chain AI agent analyst on BNB" but was "largely abandoned" soon after. In other words, the token caught fire long after the actual project had gone quiet.
The People Behind It — and the DWF Labs Allegation
This is where it gets murky, and worth stating carefully: the controlling entity has never been officially identified. What exists is on-chain analysis and an allegation from a prominent investigator.
Bubblemaps flagged on March 22 that a single cluster of more than 200 wallets held almost 50% of SIREN's circulating supply — worth roughly $1.5 billion at peak — warning "this only ends one way" hours before the crash began. The cluster's behavior fit a coordinated operation: the wallets accumulated tokens in 2025, then dispersed them across 47 addresses. As for who's behind it, ZachXBT linked the wallets to DWF Labs, noting connections to several obscure DWF-affiliated tokens including LADYS, RACA and TOMO — though the cluster's owner has not been officially confirmed. Treat that as a credible investigator's allegation, not an established fact.
The Website Tells You Everything
For a project whose entire pitch rests on shipping an AI-powered DEX and trading agent, the most damning detail might be the simplest one. As of writing, SIREN's official domain (sirenai.me) doesn't host a working website at all — it serves only a default, auto-generated server placeholder page, displayed in Chinese, reading "Congratulations, site created successfully! This is the default index.html, auto-generated by the system." It's the kind of page a hosting panel produces when a domain is pointed at a server but no actual site has ever been built on it. No product, no app, no roadmap — just an unconfigured default page. For a token marketed on cutting-edge AI infrastructure, a homepage that was never even set up is about as direct a tell as it gets.

How SIREN Coin Pumped to its All-Time High
The run-up was spectacular and, in hindsight, mechanically fragile. SIREN staged a roughly 6,800% pump before its collapse, soaring from $0.026 to an all-time high around $3.83. (Trackers differ slightly on the exact peak — CoinGecko data puts the ATH at $3.61 on March 22, 2026, versus the $3.83 intraday figure some outlets cite.) At the top, SIREN's market cap reached roughly $2.18 billion.
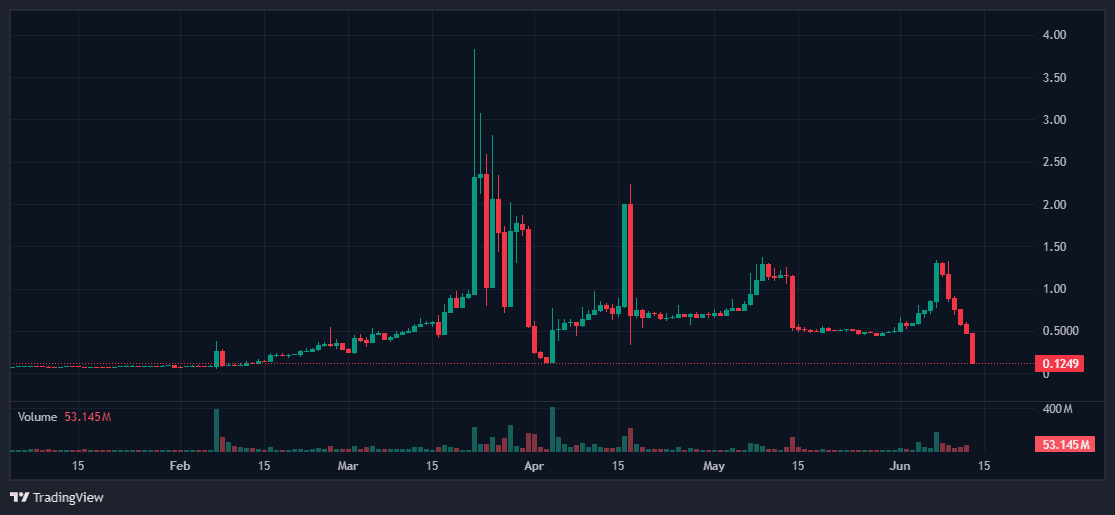
Crucially, the rally happened on thin conviction. The surge occurred during a period of low volume — a sign of weak underlying demand — which is exactly the setup that lets a concentrated holder move price violently in both directions.
The First Crash: Late March
The unwind was as fast as the climb. The very behavior that drove the pump reversed into distribution: during the March 20–23 explosion above $3, exchange netflow swung violently positive with inflows near $1 million — the signature of large holders depositing coins onto exchanges specifically to sell into peak liquidity.
Then it cratered. SIREN plunged 65.5% in a single day to around $1.04 on March 24, just 48 hours after its ATH, erasing about $1.43 billion in market cap and dropping the valuation from ~$2.18 billion to ~$754 million. Within about two weeks it had lost most of its value: by early April it traded near $0.26, down roughly 84% over seven days. The economics for the whale remained obscene either way: with an average buy price around $0.045, the controlling entity still sat on roughly 5.8x unrealized profit even after the crash.
The Second Crash: Mid-June
SIREN didn't die quietly. It bounced, drew in leveraged traders again, and is now in a fresh collapse — the one prompting this story. SIREN fell more than 70% in a single day to around $0.14, one of the sharpest unwinds in the current market, leaving it down roughly 96% from its year-to-date high. The leverage flush was textbook: open interest had climbed from about $25 million in late May to a peak of $98.7 million on June 8 — the same day the price topped — then collapsed back toward $33 million as long liquidations added fuel to the decline.
The latest readings show the bleeding continuing. SIREN dropped to around $0.196, an 88% weekly decline, with market cap down near $141 million and the token ranked around #207. Across the move, its market cap has fallen from $1.7 billion to roughly $102 million — a 96% drop from its year-to-date high.
Why This Keeps Happening
Every leg of this story rhymes because the structure never changed. Based on the on-chain footprint, the move looks like concentrated holder distribution rather than a reaction to any project-specific news — SIREN remains an asset whose price closely reflects the decisions of the few wallets that hold most of it, rather than a broad market.
That's the real lesson, and it's blunt: when most of the supply sits in one wallet cluster, you're not investing in a project — you're providing exit liquidity for a whale. An AI narrative with no shipped product gave the story a reason to spread; the concentrated supply gave one entity the power to cash that story out. The pump and the dumps are two sides of the same coin.
What Happened to Siren Crypto?
$SIREN pumped thousands of percent on an AI meme narrative, peaked above $3.6, and has now crashed ~90%+ twice — each time as its dominant holder distributed into retail demand. With one entity reportedly still controlling the overwhelming majority of supply at an average cost near $0.045, the asset's future direction depends less on any product roadmap than on whether that holder decides to keep selling. For everyone else, it's a clean illustration of why supply concentration is one of the first things to check before touching a low-float token.
Decrypt
The Philippines' central bank has tightened crypto oversight with new rules governing how exchanges assess and monitor digital assets.
A crypto relief rally has “partially arrived” as Trump announces a deal with Iran, but prediction market traders remain unconvinced.
The startup that beat Midjourney at a penny per image is back with a 4K model that plans pictures like code—and refuses far less than its rivals
Tokenized Pokémon card sales have skyrocketed over the past year, fueled by a wave of speculation and so-called gacha machines.
Anthropic pushed back against what it described as an overreach, saying the vulnerability cited is already widespread across the industry.
U.Today - IT, AI and Fintech Daily News for You Today
Bitcoin has bounced back above the crucial $65,000 level as whales complete a major selling phase and have resumed accumulation.
XRP Ledger's early design, dating back 15 years spotlighted by ex Ripple developer.
XRP's recovery could be next in line, despite the price is still trading below the 50 EMA.
Legendary trader Peter Brandt debunks Bitcoin's recent move to $66,000 as a "rookie mistake" bull flag.
The cryptocurrency market welcomes a big week ahead, as investors get ready for an increased volatility.
Blockonomi
TLDR
- Tesla shares gained 1.5% to reach $412.42 on Monday following President Trump’s announcement of a U.S.-Iran memorandum of understanding that lifted overall market sentiment.
- International crude oil prices plummeted 5% to approximately $83 per barrel after the diplomatic agreement, which features a ceasefire, sanctions relief for Iran, and the Strait of Hormuz reopening.
- Tesla’s latest quarterly report exceeded EPS projections at $0.41 versus the anticipated $0.39, while revenue reached $22.39 billion, falling short of the $22.96 billion expectation.
- Market attention centers on Tesla’s artificial intelligence, autonomous taxi services, and humanoid robotics initiatives instead of electric vehicle sales, which plunged 23% year over year during April.
- Wall Street analysts maintain a collective “Hold” stance on TSLA shares with a mean price target of $404.37; forecasts predict EPS reaching approximately $7 by 2029.
Tesla (TSLA) shares started the trading week with upward momentum, advancing 1.5% to $412.42 Monday morning as financial markets digested developments regarding a diplomatic breakthrough between the United States and Iran.
Tesla, Inc., TSLA
President Trump revealed a memorandum of understanding designed to conclude the three-month conflict. The diplomatic framework encompasses a ceasefire agreement, relaxation of international sanctions targeting Iran, termination of the U.S. naval blockade, and reopening the Strait of Hormuz shipping lane. Negotiations regarding Iran’s nuclear activities will proceed during a 60-day period.
S&P 500 futures advanced 1.4% while Dow Jones Industrial Average futures climbed 1% in response to the diplomatic announcement.
Oil prices experienced significant declines following the peace deal. International benchmark crude tumbled 5% to approximately $83 per barrel, retreating from April peaks exceeding $115 per barrel.
Decreasing oil costs traditionally diminish electric vehicles’ competitive advantage against conventional gasoline-powered automobiles. However, the Iran situation failed to substantially influence American EV purchasing behavior—fresh EV sales actually contracted 23% year over year throughout April. The primary industry obstacle remains the elimination of the $7,500 federal tax incentive for purchases last September.
The pre-owned EV market demonstrated resilience with 17% year-over-year growth, though Tesla derives minimal revenue from secondary sales.
Wall Street Prioritizes AI Over Automotive Sales
Investment analysts currently place minimal emphasis on electric vehicle sales metrics. The bullish Tesla investment thesis centers on autonomous driving technology, humanoid robotics development, and artificial intelligence capabilities—and this strategic narrative maintains investor confidence.
Tesla initiated its autonomous taxi operations approximately one year ago in Austin, Texas. The program has subsequently launched in four metropolitan areas.
Regarding robotics development, Tesla recently suspended Model S and Model X production at its Fremont, California, manufacturing plant to redirect capacity toward large-scale humanoid robot manufacturing. The company similarly paused Model Y production to prioritize this strategic pivot.
Tesla’s most recent quarterly financial performance surpassed earnings per share projections. The automaker reported $0.41 per share compared to the $0.39 analyst forecast. Revenue totaled $22.39 billion, representing 15.8% year-over-year growth, but marginally underperformed the $22.96 billion consensus estimate.
Wall Street Ratings and Institutional Movements
Tesla hasn’t achieved annual EPS expansion since 2022. Financial analysts project $1.19 EPS for the current fiscal year and anticipate the stock surpassing its 2022 peak of roughly $4 per share by 2029—with projections approaching $7.
The consensus Wall Street rating on TSLA remains at “Hold” with a mean price objective of $404.37. Among 44 analysts tracking the stock, 22 recommend Buy, 17 suggest Hold, and 5 advise Sell.
Executive Share Transactions
Board member Kathleen Wilson-Thompson divested 26,409 shares on April 30 at an average transaction price of $378.11. Chief Financial Officer Vaibhav Taneja sold 3,000 shares on May 13 at $450.00, with the transaction linked to tax obligations on vested equity compensation.
Company executives offloaded a total of 57,824 shares worth approximately $21.6 million throughout the previous 90-day period.
TSLA began Monday trading at $406.43, with a 52-week trading range spanning $288.77 to $498.83 and a market capitalization of roughly $1.53 trillion.
The post Tesla (TSLA) Stock Gains 1.5% on U.S.-Iran Peace Deal, Not EV Demand appeared first on Blockonomi.
Key Highlights
- Elon Musk declared on X that SpaceX could achieve $1 trillion in annual revenue by 2030, expressing confidence it will happen by 2031 at the latest
- The aerospace company began trading publicly on Nasdaq just days before Musk’s statement, achieving a market capitalization exceeding $2 trillion
- SpaceX recorded $18.67 billion in revenue for 2025 while reporting a substantial net loss of $4.94 billion
- Major investment banks forecast significantly lower figures: Goldman Sachs estimates $474 billion and Morgan Stanley projects $330 billion for 2030
- Musk’s public statements could potentially breach SEC regulations requiring a 40-day quiet period following an initial public offering
Elon Musk took to social media this past Sunday to declare that SpaceX has the potential to generate $1 trillion in annual revenue within the next five years. The bold prediction came via a post on X, appearing merely 48 hours after the space exploration company commenced public trading on the Nasdaq exchange.
“I think SpaceX might be able to reach approximately $1 trillion in revenue by 2030,” Musk stated in his initial post. Shortly thereafter, he doubled down on his optimism: “I would be surprised if revenue is not greater than $1 trillion in 2031.”
SpaceX made its public market debut on Friday, immediately commanding a valuation surpassing $2 trillion. This massive market capitalization positions it as the sixth-largest publicly traded company in the United States. The listing simultaneously elevated Musk to become the planet’s first individual to achieve trillionaire status.
Financial Reality Presents Contrasting Picture
While the IPO generated significant excitement, a closer examination of SpaceX’s financial performance reveals challenges. The company generated $18.67 billion in revenue during 2025, representing growth from the previous year’s $14.02 billion.
However, profitability proved elusive. SpaceX registered a net loss of $4.94 billion in 2025, a dramatic reversal from the $791 million profit recorded in the preceding year.
The revenue figures appear modest when compared to other companies with similar market valuations. Technology behemoths such as Broadcom and Amazon maintain comparable market capitalizations while producing substantially higher revenue streams.
Financial analysts from leading investment banks have published far more conservative projections than Musk’s trillion-dollar target. Goldman Sachs anticipates SpaceX will reach $474 billion in revenue by 2030. Morgan Stanley’s forecast sits even lower at $330 billion. Both estimates represent less than half of Musk’s predicted figure.
SpaceX shares climbed 6% to $171 during Monday’s premarket session, building upon the positive momentum established during Friday’s trading debut.
Space Exploration Technologies Corp., SPCX
Major Contracts and Regulatory Concerns
SpaceX has secured two significant agreements in recent weeks that should contribute to revenue growth in the immediate term. The company finalized a deal with Google last week to deliver cloud infrastructure services valued at $920 million monthly across a 32-month period. One month prior, SpaceX arranged an agreement with Anthropic to lease computational resources at its Colossus facility for $1.2 billion per month spanning three years.
Musk’s public revenue predictions could potentially trigger regulatory complications. Securities and Exchange Commission regulations typically impose a 40-day quiet period following an initial public offering. During this restricted timeframe, company executives and insiders must refrain from making public statements that extend beyond information contained in the official prospectus.
While the term “trillion” appears 59 times throughout SpaceX’s prospectus documentation, Musk’s precise revenue projection does not appear within those pages.
The SEC’s potential response remains uncertain. Just last month, Musk resolved a different SEC enforcement action concerning the timing of his Twitter share acquisitions. That settlement required a $1.5 million penalty payment, though Musk admitted no wrongdoing.
Investors will encounter a critical moment on June 30, when early-stage investors gain permission to divest up to 20% of their holdings following the release of second-quarter financial results. Additional selling opportunities will become available in phases throughout the subsequent six months. Musk faces a one-year lock-up restriction on his personal shares.
The post Musk Claims SpaceX Revenue Will Soar to $1 Trillion by 2030 appeared first on Blockonomi.
Key Highlights
-
GPUS shares surge on advancing Michigan Campus AI infrastructure discussions.
-
Company plans 20 MW AI-focused power deployment in 2025.
-
Stock recovers following announcement of prospective long-term colocation agreement.
-
Facility transition from cryptocurrency mining to AI compute services underway.
-
Management projects potential $2.5B revenue opportunity over two decades.
Shares of Hyperscale Data, Inc. (GPUS) experienced a significant rebound during pre-market hours following the company’s announcement of heightened client engagement regarding its Michigan data center facility. The stock climbed 29.43% to reach $0.2001, recovering from the prior day’s close of $0.1546, which represented an 8.03% decline. This upward movement came after the firm disclosed updated information concerning potential AI infrastructure partnerships and forthcoming power capacity enhancements.
yperscale Data, Inc., GPUS
Stock Gains Following Michigan Facility Announcement
Hyperscale Data announced that potential clients have demonstrated increasing interest in scalable infrastructure offerings at its Michigan facility. According to the company, the location is equipped to accommodate high-density GPU computing environments along with associated information technology infrastructure. This disclosure redirected market focus toward the firm’s artificial intelligence data center initiatives.
Management disclosed that negotiations with a specific prospective client have progressed to an advanced phase. The company anticipates that Alliance Cloud Services, functioning as an indirect wholly owned subsidiary, will finalize a master services agreement. This contract would encompass colocation and associated data center capabilities designed for AI compute installations.
Furthermore, the organization indicated these services may gradually supersede Bitcoin mining activities at the Michigan facility throughout the upcoming months. Consequently, Hyperscale Data would redirect available power resources toward more profitable data center operations. This transition would represent a fundamental transformation in the site’s operational focus.
Company Sets 20 MW Deployment Goal for 2025
According to Hyperscale Data, the initial 10 megawatts could achieve operational status within a 90-day timeframe following agreement finalization. The organization projects that an additional 10 megawatts could be deployed 90 days following the first phase completion. As such, ACS could deliver approximately 20 megawatts of critical power infrastructure before year-end.
The firm noted that contracts of this nature typically span up to 20 years when renewal provisions are included. Management estimates that 20 megawatts of capacity could yield in excess of $1 billion in total revenue throughout that duration. Hyperscale Data emphasized that the agreement with the prospective client remains pending.
Additionally, ACS plans to bring approximately 32 supplementary megawatts of critical power online by 2028. The company anticipates the same potential client may utilize this expanded capacity. Should this materialize, the incremental infrastructure could produce roughly $1.5 billion in revenue over a 20-year period.
Long-Term Vision Anchored by Campus Buildout Strategy
Hyperscale Data indicated that a combined 52 megawatts of critical power infrastructure could yield approximately $2.5 billion throughout a 20-year contract term. The company further stated the Michigan facility may accommodate staged expansion initiatives over time. Nevertheless, any development remains contingent upon securing financing, obtaining regulatory approvals, completing infrastructure assessments, conducting engineering studies, and finalizing utility partnerships.
Leadership expressed confidence that the Michigan Campus could ultimately accommodate upward of 300 megawatts in total power capacity. Within this framework, the current 20-megawatt opportunity under discussion would consume fewer than 7% of projected capacity. A 52-megawatt deployment would constitute no more than 17% of the facility’s theoretical maximum.
Chief Executive Officer Will Horne stated the organization maintains strong confidence in its growth trajectory. He noted that Hyperscale Data anticipates providing substantial updates to shareholders throughout the coming days and weeks. The company emphasized that client interest validates both the strategic importance of the Michigan Campus and robust demand for domestic AI infrastructure solutions.
The post Hyperscale Data (GPUS) Stock Surges on Michigan AI Data Center Partnership Prospects appeared first on Blockonomi.
Key Takeaways
- Micron shares surged 7.5% during Monday’s premarket session, breaking through the $1,000 threshold following news of a U.S.-Iran peace agreement that improved investor sentiment.
- After closing at $981.61 on Friday, the stock traded near $1,056 levels.
- The company’s quarterly report is scheduled for June 24, with analysts forecasting EPS around $20.10, representing a year-over-year increase exceeding 900%.
- Several Wall Street firms increased their price objectives, including TD Cowen’s $1,500 target and Aletheia Capital’s $1,600 projection.
- The broader memory semiconductor sector participated in the rally — Seagate advanced 5.6%, Western Digital gained 5.6%, and SK Hynix rose 6.42%.
Shares of Micron Technology (MU) experienced a significant 7.5% premarket advance on Monday, breaking above the psychologically important $1,000 level following President Donald Trump’s announcement of a peace framework with Iran. Trading around $1,056, the stock extended its gains from Friday’s $981.61 close.
Micron Technology, Inc., MU
The diplomatic breakthrough helped alleviate months of heightened geopolitical uncertainty and contributed to declining crude oil prices. This development boosted investor appetite for growth-focused equities, with Nasdaq futures advancing 2.07% and S&P 500 futures climbing 1.25%.
Micron recently established an all-time peak of $1,079 on June 3. The stock now faces resistance around $1,089.50 — positioned near its 52-week high of $1,089.29 — which represents a critical technical threshold for market participants.
The memory chip industry rallied alongside Micron. Seagate posted a 5.6% gain, Western Digital increased 5.6%, SanDisk advanced 5.25%, Samsung Electronics in South Korea rose 4.5%, and SK Hynix jumped 6.42%.
From a chart perspective, Micron maintains a position significantly above its critical moving averages — trading 18.1% higher than the 20-day average, 55.7% above the 50-day, and 176.4% beyond the 200-day. This bullish technical formation has remained intact since a golden cross pattern emerged in June 2025.
However, momentum signals suggest some deceleration. The MACD indicator currently trades beneath its signal line with a negative histogram reading, indicating diminished upward momentum relative to the rally’s earlier stages.
Upcoming Quarterly Report
Investor attention is increasingly focused on Micron’s upcoming quarterly earnings announcement scheduled for June 24. Wall Street analysts anticipate EPS in the range of $19.61 to $20.10, a dramatic improvement from the $1.91 reported in the comparable year-ago period. Revenue projections fall between $34.28 billion and $34.85 billion, substantially higher than the prior-year figure of $9.30 billion.
This represents an approximately 900% expansion in earnings estimates — a remarkable figure that has prompted numerous analysts to revise their outlook upward.
TD Cowen analyst Krish Sankar elevated his price objective from $660 to $1,500, pointing to robust artificial intelligence and data center demand expected to sustain elevated DRAM pricing through 2027. RBC Capital Markets increased its target from $525 to $1,200. Aletheia Capital established the most aggressive projection, raising its price target to $1,600 from $650.
Wolfe Research reaffirmed its Outperform rating with a $1,250 target on June 11. Wells Fargo maintained its Overweight stance while lifting its objective to $1,220 on June 8. Goldman Sachs continued with a Neutral rating and $900 price target.
Fund Holdings
Micron represents a significant component across multiple semiconductor-focused exchange-traded funds. The stock accounts for a 7.63% allocation in the iShares Semiconductor ETF (SOXX), 7.54% in the First Trust Nasdaq Semiconductor ETF (FTXL), and 7.08% in the Invesco AI and Next Gen Software ETF (IGPT). SOXX advanced 4.12% during Monday’s premarket session.
Micron’s Benzinga Edge metrics support the optimistic thesis — posting a Momentum score of 99.56 and a Quality score of 97.8. The company’s Value score of 10.77 indicates a premium valuation relative to industry comparables.
The Wall Street consensus maintains a Buy rating on MU, though the average analyst price target of $927.29 currently sits below Monday morning’s trading levels.
The post Micron (MU) Stock Soars Past $1,000 Following U.S.-Iran Peace Agreement appeared first on Blockonomi.
Key Highlights
- Diplomatic breakthrough between Washington and Tehran triggered sharp crude oil decline, with prices dropping from over $110 per barrel to approximately $80.
- Bullion rallied 2.8%, climbing to $4,338 per ounce—the highest level recorded since early June.
- The agreement includes provisions to reopen the Strait of Hormuz, blocked since conflict erupted in late February.
- The U.S. dollar retreated to 10-day lows, enhancing gold’s appeal for international buyers.
- Market expectations for a Federal Reserve rate increase by year-end fell from 69% to 49% as inflation concerns eased.
Precious metals experienced a significant rally Monday following reports that Washington and Tehran reached a preliminary diplomatic agreement, triggering a substantial retreat in crude oil prices and diminishing expectations for additional monetary tightening.
Crude Markets React to Strait Reopening News
Spot bullion advanced 2.8% to reach $4,338.14 per ounce, with futures contracts matching those gains at $4,359.09. The upward momentum followed confirmation that U.S. and Iranian officials had secured an initial framework to cease hostilities.
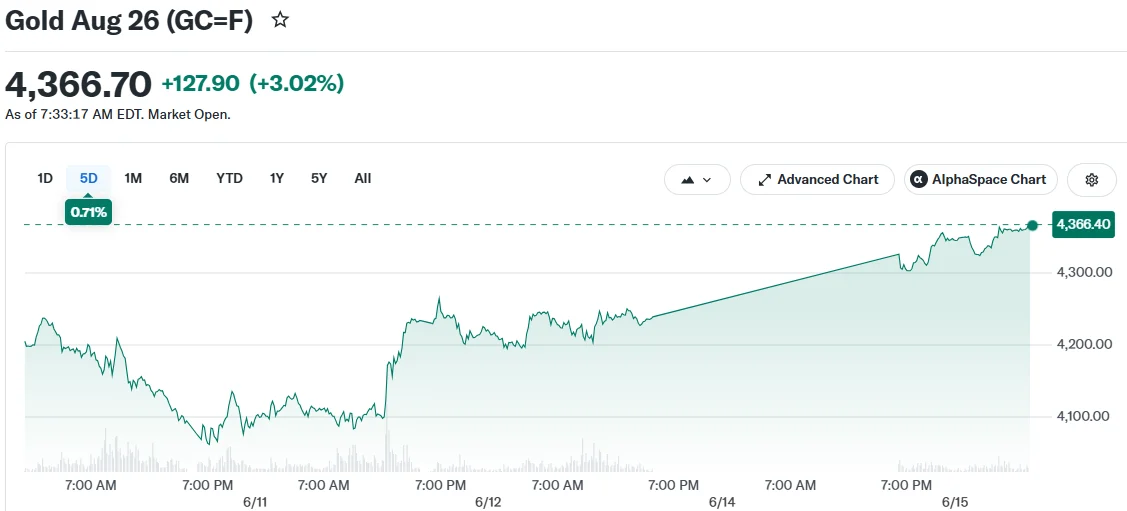
The diplomatic arrangement, facilitated with assistance from Pakistani mediators, awaits formal execution in Switzerland scheduled for Friday. Iranian officials emphasized the pact remains inactive until official signatures are secured.
President Donald Trump validated that the arrangement will restore access through the Strait of Hormuz. This strategic maritime corridor handles approximately 20% of global petroleum shipments and has been inaccessible since hostilities commenced in late February.
Brent crude futures, which surged beyond $110 per barrel during peak tensions, retreated sharply to levels just above $80 following the diplomatic announcement.
Greenback Softens, Amplifying Precious Metal Gains
The yellow metal’s ascent received additional support from weakness in the U.S. currency. The dollar index declined to its lowest reading in ten trading sessions versus major international currencies.
Throughout the military confrontation, the greenback benefited from safe-haven demand. The diplomatic resolution diminished geopolitical uncertainty, encouraging investors toward riskier assets and reversing recent dollar strength.
Currency depreciation typically benefits gold valuations by reducing purchase costs for holders of alternative currencies.
Market strategists at Britannia Global Markets noted the agreement “weakened the dollar and drove crude significantly lower, establishing more favorable macroeconomic conditions for risk assets throughout the commodity sector.”
The petroleum price collapse also reduced concerns that monetary authorities would implement restrictive policies to combat energy-fueled inflation. Gold generally outperforms during periods of accommodative monetary policy, as the non-yielding asset becomes more competitive.
Market participants now assign a 49% probability to a Federal Reserve rate increase by December, representing a substantial decline from the 69% probability calculated one week earlier, per CME FedWatch analytics.
The Federal Reserve is anticipated to maintain its current policy stance following the conclusion of its two-day monetary policy session Wednesday. The gathering represents Chairman Kevin Warsh’s inaugural Federal Open Market Committee deliberation.
Kathleen Brooks, analyst at XTB, observed the diplomatic accord “applies downward pressure on petroleum valuations and consequently alleviates inflation anxieties,” noting the significance given major central bank policy meetings occurring this week.
Neither Washington nor Tehran has disclosed comprehensive agreement terms beyond information shared through Pakistani intermediaries and Trump’s public statements.
The pact awaits formal ratification, with Iranian representatives confirming implementation will be delayed until Friday’s signing ceremony in Switzerland.
The post Gold Rallies Nearly 3% as U.S.-Iran Agreement Dampens Inflation Concerns appeared first on Blockonomi.
CryptoPotato
Two weeks after announcing its first BTC sale in roughly four years, the Michael Saylor-founded business intelligence giant has reaffirmed its support for bitcoin, acquiring another 1,587 units for approximately $100 million.
The average purchase price was just over $63,000, and the company has also increased its USD stash by another $100 million to $1.1 billion. Its total crypto fortune has grown to 846,842 BTC, currently valued at almost $56 billion.
Strategy has acquired 1,587 BTC for $100 million to increase our $BTC Reserve to ₿846,842. We have also increased our USD Reserve by $100 million to $1.1 billion. $MSTR $STRC https://t.co/27PYXJN7GD
— Michael Saylor (@saylor) June 15, 2026
Recall that Strategy sold off 32 BTC a couple of weeks ago, which, despite what some critics claimed, wasn’t a capitulation event. Instead, it was necessary to support preferred stock distributions, including cash dividends across the firm’s stock series.
Aside from FUD that was among the reasons behind bitcoin’s price collapse to a 19-month low beneath $60,000, Strategy’s decision raised some eyebrows within the community and prompted Jim Cramer to say that the firm and its co-founder had “killed” the cryptocurrency.
Saylor was quick to respond, refuting the FUD and indicating that he never said the company would not sell any BTC when it becomes necessary. However, he remains a firm believer that individual investors should refrain from dumping their bitcoin.
Moreover, Strategy resumed its accumulation spree last week, buying 1,550 BTC for just over $100 million.
Prominent crypto figures, such as Samson Mow and Lyn Alden, defended BTC, arguing that if a single entity that likes it so much to buy it cannot kill it with one decision to sell a tiny portion of its holdings.
The post Strategy Buys Another 1,587 BTC as Bitcoin Sale FUD Fades Away appeared first on CryptoPotato.
The United States of America and Iran shook hands on a peace deal, which is about to be officially signed on June 19. The financial and crypto markets reacted positively to the news, with Bitcoin (BTC) spiking to a multi-week high of just over $66,000.
The big question now is whether the leading digital asset can sustain its upward momentum or is gearing up for another pullback.
The Bears Remain in Charge?
BTC’s rebound has drawn significant attention, with multiple analysts speculating on the asset’s next potential move. X user Jelle described the pump as a “big victory” for the bulls, predicting that holding above the $63,000-$64,000 range is “looking rather good for relief.”
Ali Martinez noted that the price has finally broken through the $64,360 resistance level and expects a possible ascent to $67,630 “if momentum holds.”
Nonetheless, many others believe the peace news has triggered only a temporary revival, arguing that the cycle’s floor has yet to be formed. X user symbiote sees the creation of a final bottom at around $50,000, labeling that zone as a buying opportunity.
Niels believes the asset’s valuation could rise to $70,000-$72,000 in the short term, but the 4-year cycle suggests the real pain for the bulls could occur by Q3 this year. “Once BTC makes another lower high, it’ll reverse towards $55K for the cycle bottom,” they added.
Some key factors, including the recent whale behavior, reinforce the bearish outlook. As CryptoPotato reported, large investors have reduced their total holdings by over 70,000 BTC in the past month, signaling weakening confidence in the asset and perhaps preparing for a renewed correction. Moreover, their actions could influence sentiment and lead some smaller players to exit the ecosystem.
Waiting for These Events
Another popular analyst who touched upon BTC’s latest price movement and gave an interesting prediction for the near future is Ted. The X user outlined the general optimism in the space following the US-Iran peace deal and forecast that staying above $65,000 could lead to a move toward $70,000. As of the moment, though, he doesn’t see “enough real strength to confirm that scenario.”
Ted claimed that BTC’s price will depend heavily on major economic events this week, including the Federal Reserve’s interest rate decision and the possibility of further rate hikes by the Bank of Japan.
The FOMC meeting on June 17 will be the debut of Chair Kevin Warsh, and the expectations are that the benchmark will remain unchanged in the 3.5%-3.75% range. However, investors will closely monitor his speech for any hawkish or dovish signals that might hint at how the central bank plans to guide policy in the months ahead, potentially leading to heightened volatility across the entire crypto market.
The post Top Bitcoin (BTC) Price Predictions After the US-Iran Peace Rally appeared first on CryptoPotato.
Over the weekend, the SIREN token collapsed from around $1.30 to $0.05 after its controller sold roughly 94% of the supply, according to reports by analysts from Spot On Chain and Lookonchain.
The sell-off reignited concerns that a single entity had too much control over the BNB Chain-based token, a risk that had been flagged by several blockchain investigators earlier in the year.
Whale Unloads Hundreds of Millions of Tokens
According to data shared by Spot On Chain’s Hupzy account, the SIREN controller dumped approximately 670 million tokens over a 48-hour period, a number that was equal to about 92% of the circulating supply, with the wallet reportedly collecting $64.8 million in USDT during the liquidation.
The data also showed that some $25.7 million, still in USDT, was later transferred to several centralized exchanges, while just over $39 million stayed on-chain, with Hupzy describing the activity as a “textbook pump-and-dump.” They added that the remaining holdings were split across hundreds of addresses after the sales, a pattern they said could make tracking future movements much more difficult.
Lookonchain reported similar figures and noted that the whale had kept on selling after receiving $28 million in one day. Furthermore, the analytics account said it had observed around 200 million SIREN tokens moving to exchange-linked wallets, including addresses associated with Binance, Gate, and KuCoin.
The market reaction came quickly soon after, with CoinGecko data showing SIREN trading near $0.05, down about 59% in the last 24 hours and nearly 96% over the past seven days. It now carries a market cap of just over $38 million, way below the multi-billion-dollar valuation it briefly touched during a rally in March that saw it hit an all-time high of $3.61.
The price collapse also saw the token’s trading volume plummet by more than 48% per CoinGecko, while data from CoinGlass showed over $625 million in futures volume over the past day, with liquidations reaching $3.4 million, over $2.7 million of that being longs.
A Series of Ups and Downs
Soon after the $3.61 ATH mentioned above, SIREN was hit by its first major collapse, tanking by nearly 70%, with on-chain investigator ZachXBT and the Bubblemaps analytics platform warning that a single cluster controlled almost half of its supply, a cluster that ZachXBT later linked to wallets connected to DWF Labs.
The meme token played a similar trick on holders just days after, first jumping by more than 100% on March 26, when it went from $1.02 to $2.08 per CoinGecko data, and then plummeting over 60% to about $0.79 on March 28. As if that wasn’t enough, it teased the market again on March 30, skyrocketing to just under $1.80, but before holders could count their profits, it recorded its worst dip yet, going all the way down to $0.13 in early April, with some X users accusing Binance of manipulating the asset.
There was another spike to just under $2 in the days that followed, and that jump too vanished as suddenly as it had appeared, with SIREN dropping by 65% to about $0.70. Most recently, on June 8, the token, now ranked #583 by market cap, pumped almost 190% when it went from the $0.45 level to $1.30, from where it has since dumped to $0.05.
The post SIREN Crashes 96% as Whale Dumps 94% of Supply appeared first on CryptoPotato.
After a relatively quiet weekend, bitcoin’s price rose on Sunday evening to $66,000 for the first time in almost two weeks, following US President Donald Trump’s announcement that the deal with Iran is essentially complete.
The total crypto market cap has added over $50 billion daily, going past $2.330 trillion on CG, as many alts have produced impressive gains.
BTC Touched $66K
Bitcoin crashed and burned at the start of June, dropping from $73,000 to a multi-month low of $59,100 before it finally found some support and began its gradual recovery. The following week was somewhat more positive, as BTC jumped toward $64,000 on several occasions but was stopped at each attempt to break through.
The subsequent rejections, driven mostly by macro factors like new attacks in the Middle East, resulted in price dips to $61,000. Nevertheless, that support level held, and BTC rebounded toward the upper boundary of its sideways channel.
The past weekend was quite sluggish, even though Trump promised on Saturday that the US and Iran would announce a permanent deal on Sunday, but there were more attacks from Israel against Lebanon on that day. On Sunday evening, though, came the long-anticipated announcement, with Trump stating on Truth Social that the deal was essentially complete.
BTC reacted with an immediate price pump, going to $66,000 earlier this morning for the first time since June 3. It has lost a few hundred dollars since then, but it’s still 2% up on the day. Its market cap has surged to $1.315 trillion, while its dominance over the alts remains above 56.5% on CG.
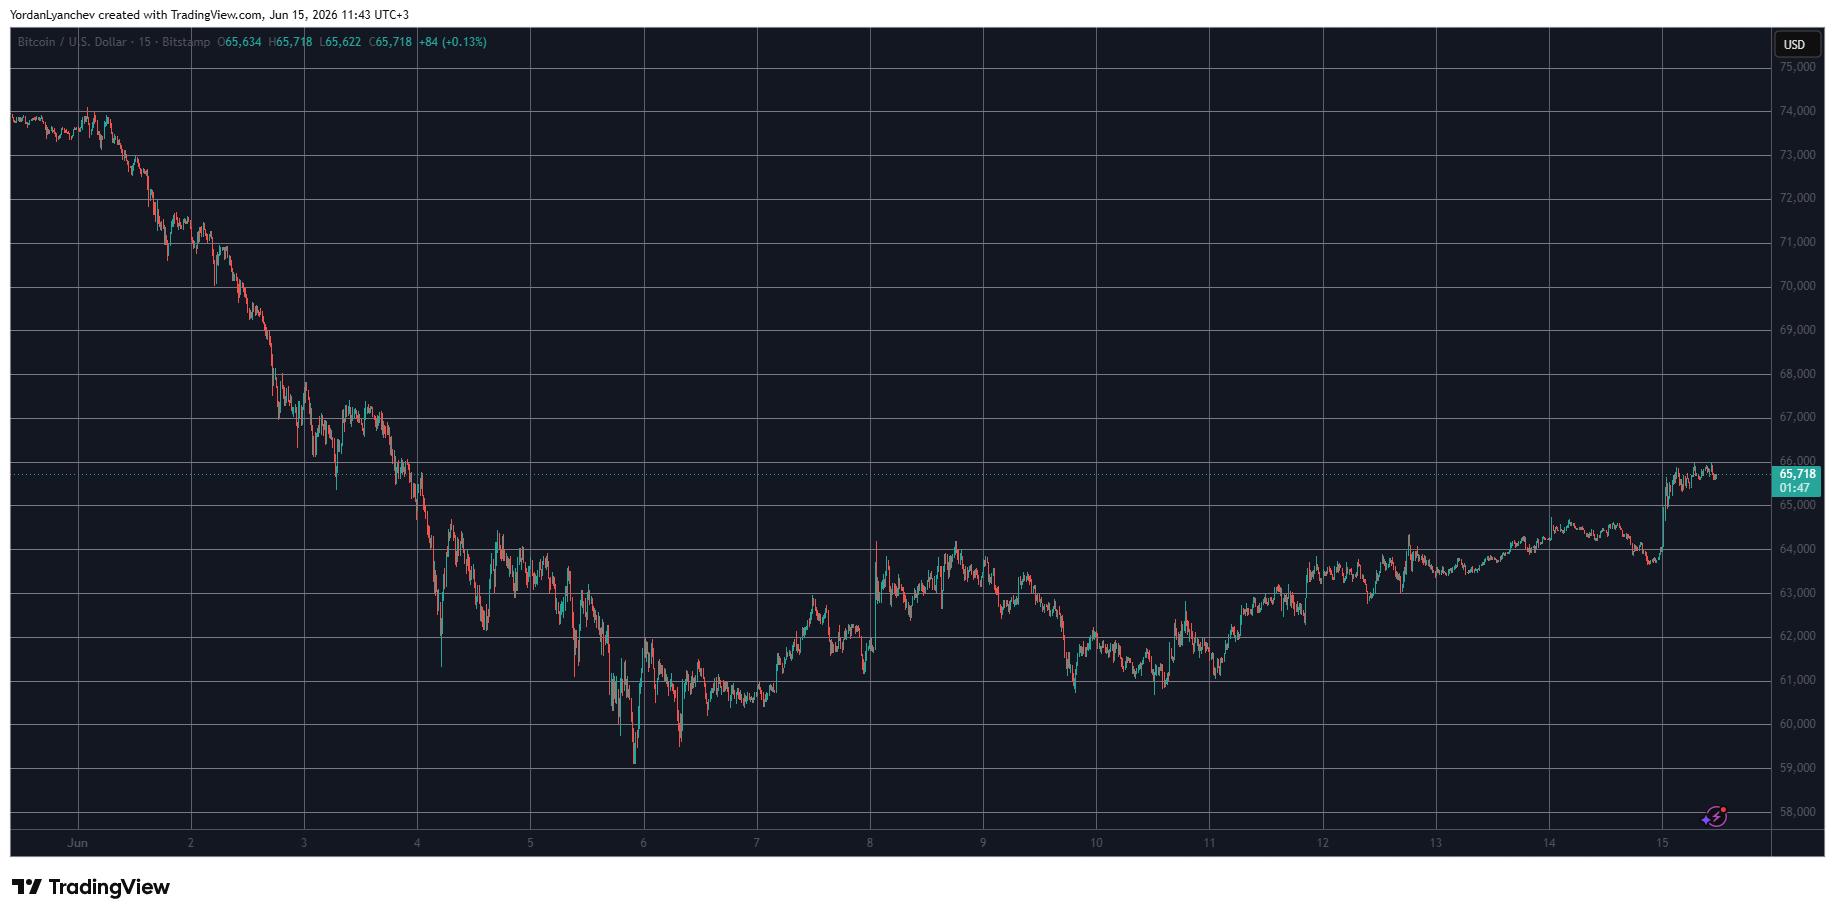
Alts Rebound
Most larger-cap alts are well in the green today. Ethereum has reclaimed the $1,700 level after a 2.5% increase. BNB is close to $620, while XRP has exceeded $1.18. SOL is well above $70, while ADA has pumped by 6%.
HYPE is up by almost 10%, and ZEC has risen the most from the top 100 alts. The privacy coin has gained 16% and trades close to $500. WLD follows suit, as a 15% increase has driven it to $0.59. NEAR and JUP complete the double-digit price gainers club.
The cumulative market cap of all crypto assets is up by just over $50 billion daily to $2.330 trillion as of now on CG.
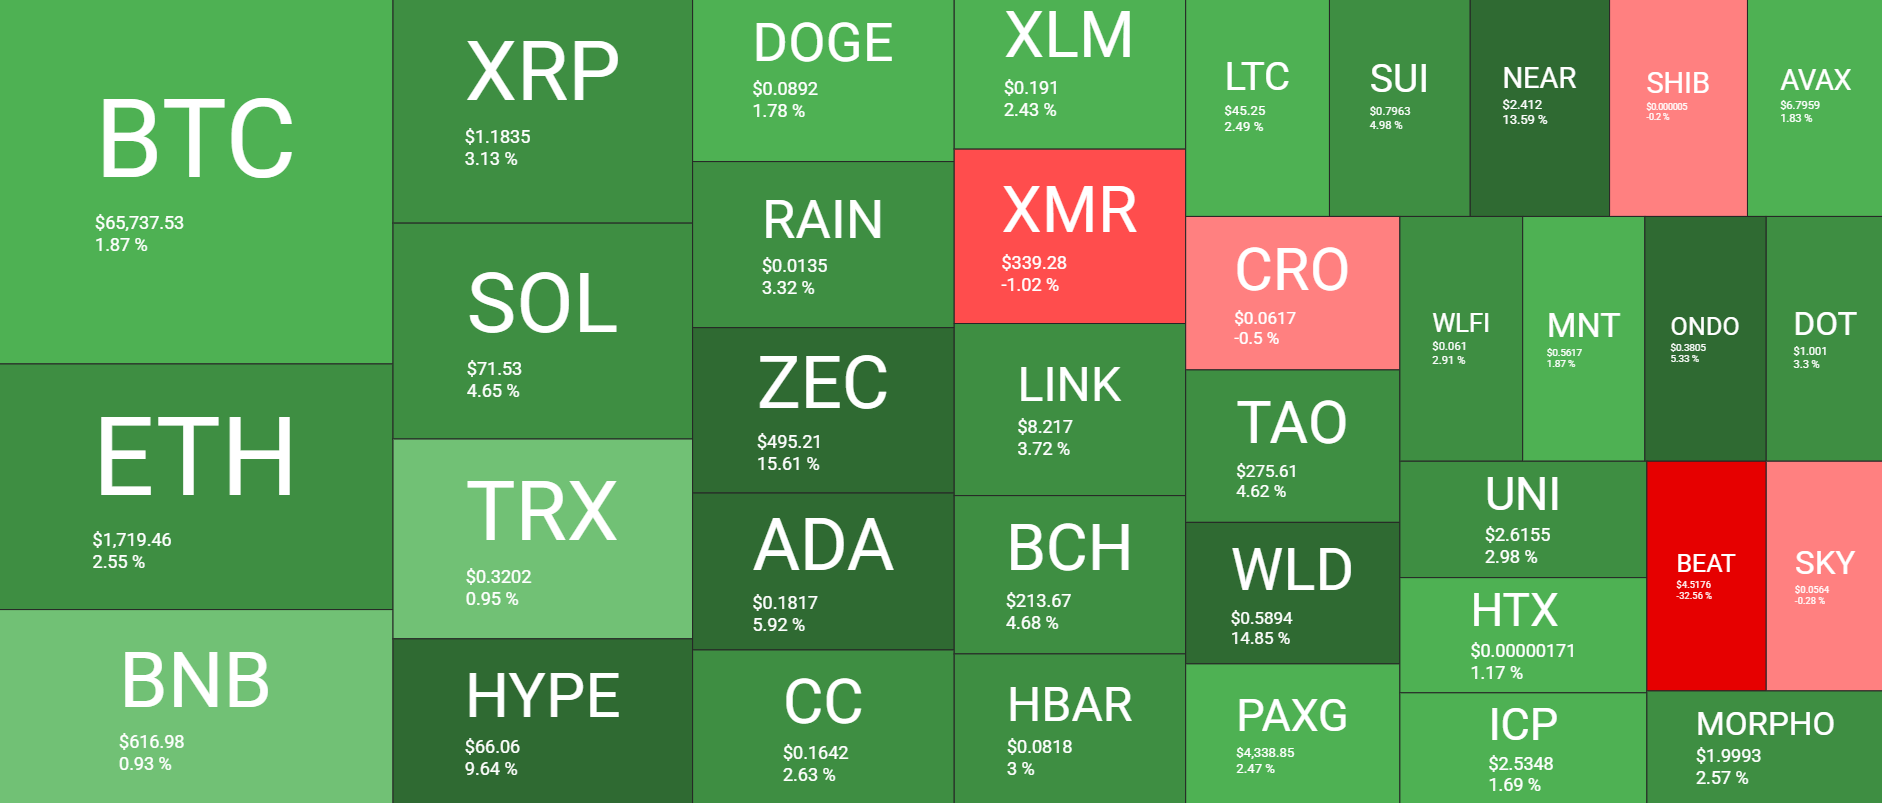
The post HYPE, ZEC Explode After Peace Deal Announcement, BTC Taps 12-Day High: Market Watch appeared first on CryptoPotato.
The cryptocurrency market has turned green since the major Sunday evening announcement by US President Donald Trump, but some assets have marked more substantial gains than others.
Ripple’s cross-border token is among those, gaining over 3% in value on a daily scale, which is more than ETH’s 2.5% increase and BTC’s 1.9% jump.
Why Up, XRP?
Obviously, the more apparent reason behind XRP’s revival today is the deal announcement made by Trump yesterday. As reported, the POTUS also authorized the toll-free opening of the Strait of Hormuz and the removal of the United States Naval blockade.
The actual deal is expected to be signed by the end of the week, as reports from Pakistan and India have concurred with Trump’s statement. Peace news is always welcomed in the risk-on cryptocurrency markets, especially for larger-cap altcoins.
However, there could be more beneath the surface for XRP’s particular gains. For starters, the exchange-traded funds tracking its performance continue to defy the overall ETF trend. They attracted over $10 million in the past business week, in stark contrast to the $15 million in net outflows from the ETH ETFs and the over $300 million taken out of the Bitcoin counterparts.
Separately, a report from CryptoQuant revealed a somewhat surprising shift in trend. South Korea’s largest crypto exchange, Upbit, became the trading platform with the highest concentration of XRP deposit-wallet activity. The analysts at CQ determined that “XRP’s rebound is being driven by a divided flow structure.”
What’s Next?
Popular analyst Ali Martinez noted recently that the TD Sequential had flashed a buy signal for XRP after the asset’s recovery to over $1.10 commenced. In a follow-up post, he added that a breakout from the asset’s current symmetrical triangle could result in another 14% move.
Fellow analyst CW outlined the next two significant resistance lines if the token’s rally continues. The first is the sell wall at $1.25, followed by $1.40, where there’s a significant cluster of short positions.
CRYPTOWZRD warned that XRP had closed indecisively despite the late Sunday rally. According to their analysis, XRP needs to decisively reclaim the $1.18 level before it can offer further upside. It’s worth noting that the cross-border token is currently testing that level.
XRP Daily Technical Outlook:$XRP closed indecisively and its intraday chart is trading within a range. Above $1.1800 will offer a long, but a rejection at this resistance will offer a short. Moving below $1.1000 will offer further decline
pic.twitter.com/HkGXX2tpj6
— CRYPTOWZRD (@cryptoWZRD_) June 15, 2026
The post Why Is The Ripple (XRP) Price Up Today, and What’s Next? (June 15) appeared first on CryptoPotato.