Cryptocurrency Posts
Crypto Briefing
Zcash's lobbying efforts in Washington could significantly influence privacy-focused digital asset regulations and developer protections.
The post Zcash advocacy group registers its first lobbyist in Washington appeared first on Crypto Briefing.
Broadcom's AI-driven growth highlights the sector's potential, but reliance on major buyers poses risks if AI spending slows.
The post Broadcom reports 86% revenue growth amid AI boom as Intel shows signs of recovery appeared first on Crypto Briefing.
The delay in passing crypto tax legislation prolongs uncertainty, hindering industry growth and complicating routine digital asset transactions.
The post Punchbowl News survey shows Hill aides doubt crypto tax bill passes this year appeared first on Crypto Briefing.
Europe's regulatory clarity and innovative financial products could shift the global Bitcoin market dynamics, challenging US dominance.
The post Bitcoin rallies as European demand outpaces US interest appeared first on Crypto Briefing.
Reflection AI's model could diversify AI options, challenging Chinese dominance and impacting enterprise AI strategies and investor expectations.
The post Reflection AI to release open-weight model aimed at DeepSeek and Qwen appeared first on Crypto Briefing.
Bitcoin Magazine
Bitcoin Magazine

IMF Praises El Salvador — But Still Tries To Scale Back Its Bitcoin Project
The International Monetary Fund has praised El Salvador for improving its economy — but scolded it at the same time for its ongoing Bitcoin experiment.
In a statement Friday, the IMF said that it had approved a $139 million disbursement to the Central American nation while also trying to “reduce the state’s involvement in Bitcoin-related activities.”
El Salvador in 2021 made Bitcoin legal tender, much to the ire of the IMF and other major institutions. The Latin American country was at the time negotiating a development loan with the agency.
“El Salvador’s economy continues to perform strongly”
— Nayib Bukele (@nayibbukele) October 1, 2026https://t.co/Rvaerha9QA
The IMF in September said that El Salvador wasn’t buying bitcoin; the country’s Bitcoin Office has repeatedly said that it does buy the cryptocurrency.
“Economic activity has exceeded expectations, supported by sustained improvements in security and investor confidence, as macroeconomic imbalances continue to be addressed,” the IMF said.
It continued: “However, certain performance criteria were not met, including on the Bitcoin accumulation front, for which waivers were granted based on strong corrective measures and renewed commitments.”
The IMF further said that the Salvadoran state’s involvement in Bitcoin-related activities is being unwound and that “no further bitcoin accumulation is envisaged beyond the documented donations.”
Salvadoran president Nayib Bukele in 2022 said the country would buy one bitcoin per day but it was never clear where the money was coming from — or if he was actually buying at all.
The IMF said in September that El Salvador was — at least for some time —not using public funds to accumulate bitcoin but rather had received bitcoin from private donations.
El Salvador and the IMF entered a $1.4 billion loan agreement at the end of December but the fund asked for the country to scale back certain aspects of its Bitcoin strategy.
The Salvadoran state gifted its citizens bitcoin in 2021 and debuted a wallet with the hope of getting more citizens using the cryptocurrency in the dollarized country.
President Bukele in 2024 admitted that Salvadorans weren’t using the cryptocurrency to buy things as expected, but always boasted that the government was still stacking sats.
This post IMF Praises El Salvador — But Still Tries To Scale Back Its Bitcoin Project first appeared on Bitcoin Magazine and is written by Mathew Di Salvo.
Bitcoin Magazine
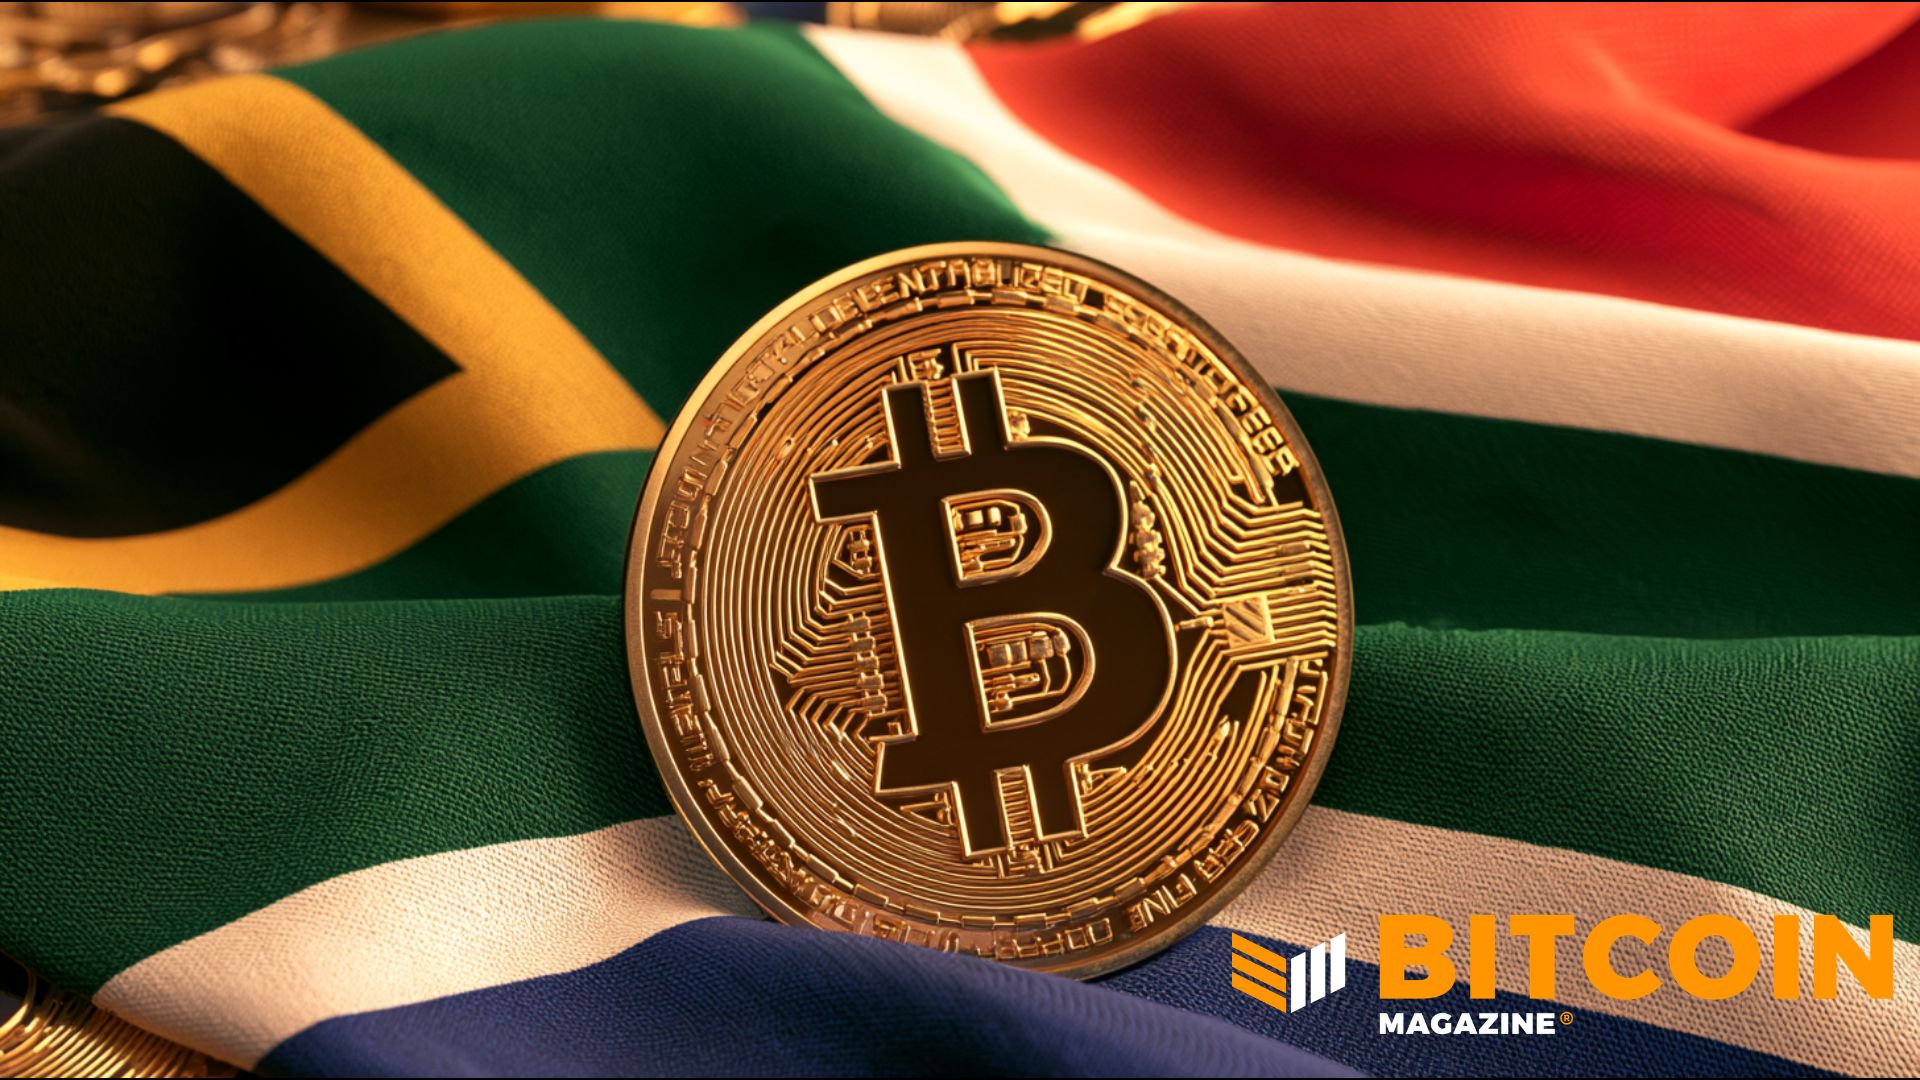
South Africa’s Absa Becomes First Bank on the Continent to Custody Bitcoin: Report
South African bank Absa has become the first African lender to custody bitcoin, according to reports.
As reported first by Bloomberg on Friday, the Johannesburg-based lender will serve institutional clients, mostly by custodying bitcoin — but other digital assets will also be a part of the service.
Banks worldwide are integrating or offering bitcoin-related products and services. A number of U.S. and European banks have started offering crypto-related services by custodying assets for institutions.
JUST IN:
— Bitcoin Magazine (@BitcoinMagazine) October 2, 2026Absa has become the first African bank to offer Bitcoin custody
pic.twitter.com/JaDza3S7Ez
Rob Downes, head of digital assets at Absa’s corporate and investment banking unit, was quoted saying that while bitcoin was the biggest asset the bank would custody, others would follow.
Absa did not immediately respond to questions from Bitcoin Magazine.
The African continent has a large crypto-native base, with data firms frequently highlighting the high adoption — particularly in countries where currencies have been significantly debased.
In Chainalysis’s 2025 report, South Africa’s $36.0 billion in on-chain value made it second in Sub-Saharan Africa. Nigeria alone received $92.1 billion, nearly three times the total of second-place South Africa.
On the global index, South Africa ranked 30th for crypto adoption.
The character of its market is different from Nigeria‘s: it’s more institutional, with regulatory clarity resulting in hundreds of licenses being issued to VASPs and attracting professional investors and traditional finance.
BNY Mellon in 2022 became the first major U.S. bank to offer digital asset custody services. And this month, German multinational Deutsche Bank said it would debut a bitcoin custody service for European corporate and institutional clients later in 2026.
This post South Africa’s Absa Becomes First Bank on the Continent to Custody Bitcoin: Report first appeared on Bitcoin Magazine and is written by Mathew Di Salvo.
Bitcoin Magazine
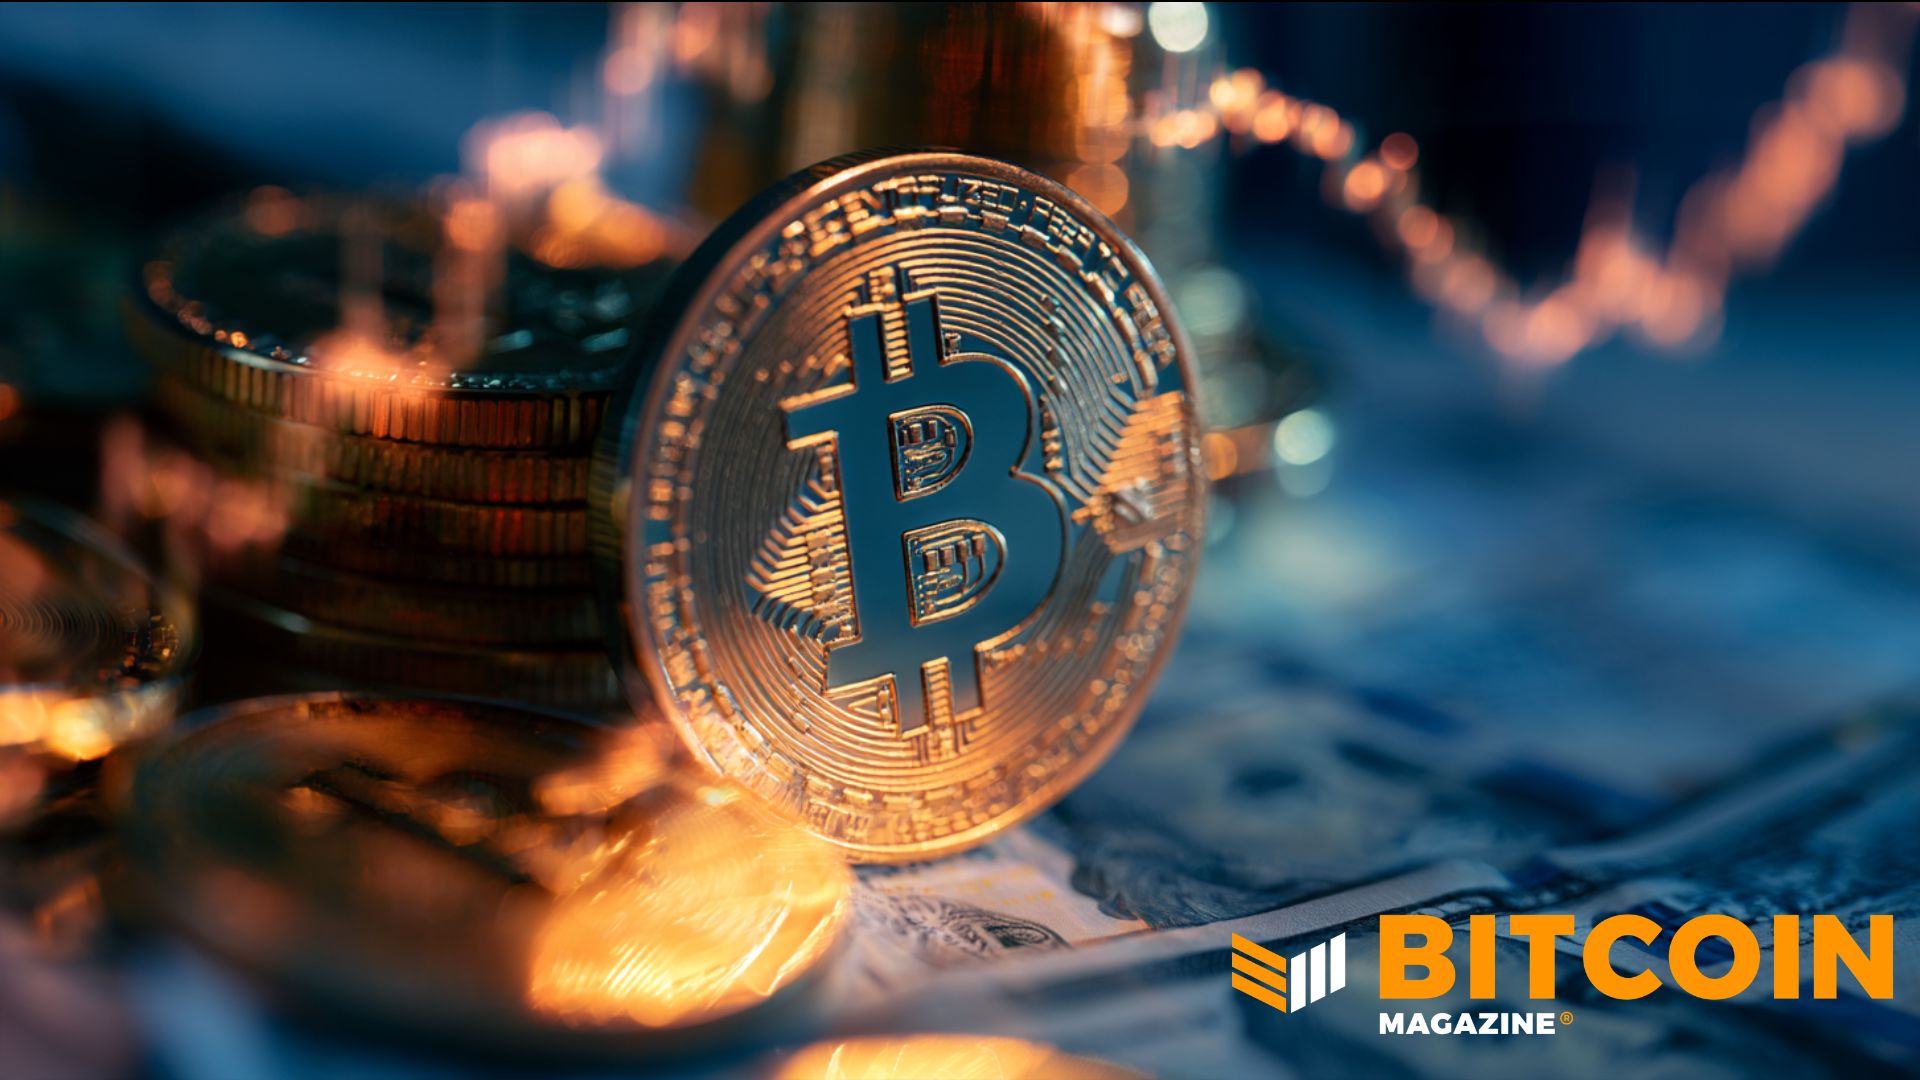
Bitcoin Price Surges Above $87,000 on Softer-Than-Expected Jobs Data
The price of bitcoin surged above $87,000 on Friday morning in New York, buoyed by constant exchange-traded fund flows and a jobs report showing that unemployment in the U.S. had ticked up.
Bitcoin’s price recently stood at $85,990 after a 2% jump over a 24-hour period. Over the past week, it has also risen by more than 2%.
Nonfarm payrolls increased 29,000 last month after a downward revision to the prior two months, Bureau of Labor Statistics data showed Friday.
JUST IN: Bitcoin jumps to $87,000 as U.S. Unemployment Rate comes in at 4.2%, higher than expectations
— Bitcoin Magazine (@BitcoinMagazine) October 2, 2026pic.twitter.com/jqtU8Q9zsd
Weaker-than-expected jobs data can give a lift to riskier assets like bitcoin and stocks, whose prices tend to swing more sharply.
A softer labor market typically means less consumer spending, which eases pressure on prices. That could make the Federal Reserve less inclined to keep raising interest rates to fight inflation.
Many economists and politicians have said the U.S. is in the midst of an affordability crisis, and the topic is a hot one ahead of the November midterm elections.
The Federal Reserve’s new chair, Kevin Warsh, has said that prices in the world’s biggest economy are too high and that the central bank is fully focused on making life more affordable again.
Bitcoin investors shrugged off the central bank’s interest rate hike in September, climbing on the news.
The largest cryptocurrency started rallying in August on news that the U.S. Treasury Department said it would more than double the size of its government debt repurchases. The coin had its best run in three years and third best August ever.
The coin’s price has benefited from the so-called debasement trade: when investors buy certain assets to hedge against currency being devalued. The dollar slid in value in August.
It continued to have a good September, rising nearly 6% over a 30-day period.
October has historically delivered good returns for bitcoin investors, with traders dubbing the phenomenon “Uptober.”
This post Bitcoin Price Surges Above $87,000 on Softer-Than-Expected Jobs Data first appeared on Bitcoin Magazine and is written by Mathew Di Salvo.
Bitcoin Magazine

Impacts of Daily Dividends on Digital Credit
In May 2026, Strive rebranded itself as “The Daily Dividend Company,” then moved SATA to daily cash dividends beginning June 16. Strategy has now pushed the same idea into its own digital credit engine. On September 24, its board proposed moving STRC, STRF, STRK and STRD to daily dividends, subject to shareholder approval at an October 28 special meeting. The proposal keeps the annual dividend economics unchanged and changes the cadence of cash payments.
STRC spent much of the summer below its $100 stated amount even as Strategy raised its dividend rate to 12% and deployed more than $1 billion buying back STRC. The move to daily dividends by Strategy could be seen as the latest attempt to make the security more attractive and help it trade near par.
Now that the overton window has fully shifted in favor of digital credit paying daily dividends, we should take a look at the actual impacts of daily dividends.
Daily Dividends Fit Onchain Finance
Digital credit is increasingly becoming an input for other financial products—so called “digital money” or “digital yield” products. Strategy estimated in mid-May that more than $440 million of STRC exposure had moved into DeFi through stablecoins, tokenized securities, yield products and other structures.
However, there is a cash flow mismatch. Crypto products commonly accrue and distribute yield at high frequency. A security that pays monthly or twice monthly forces the product sitting on top of it to bridge the period between economic accrual and actual cash receipt.
Daily dividends compress that gap to one day. The protocol, fund or issuer receives cash from the underlying asset at almost the same cadence that users expect to receive yield. That simplifies liquidity management and reduces the cash needed between dividend dates. This is much more impactful to a financial product funding daily distributions or redemptions than to a long term investor focused on total return. The crypto-heavy setting of the “Layer 3” products on top of digital credit raises the attractiveness of daily dividends.
Daily Dividends Are Primarily a Retail Feature
For investors focused strictly on total return, dividend payment frequency makes little difference in underlying economic value. The asset’s price accrues between distribution dates and adjusts post-payment, meaning annual, quarterly, monthly, and daily payouts produce comparable long-term results.
The true advantage of daily dividends lies in product psychology and user experience. Cash arriving every day provides immediate visibility and an engaging feedback loop. Investors can spend, withdraw, or automatically reinvest the payout while leaving their principal position intact, turning an abstract yield metric into tangible recurring cash flow.
This dynamic mirrors the strategy of Realty Income, which built a massive retail follower base by branding itself as “The Monthly Dividend Company.” As a member of the S&P 500 Dividend Aristocrats Index, Realty Income has paid and raised dividends for 31 consecutive years.
Daily dividends on digital credit extends this product concept even further: SATA pairs frequent daily payouts with a target price near $100 and a double-digit yield.
While institutional investors prioritize yield spreads, liquidity, tax structure, and balance sheet coverage, daily payments offer their strongest appeal to retail buyers. If the overarching objective is to raise capital to purchase Bitcoin, optimizing security design for retail investor preferences is the most effective approach.
Options Get Cleaner Too
Daily dividends also change options mechanics. STRC currently pays $0.50 twice monthly. SATA pays roughly five cents each business day. Larger dividend events create larger discrete adjustments in the underlying price, which affects option pricing and early exercise decisions. Daily payments spread the same annual cash flow across much smaller adjustments.
The total value of dividends over an option’s life is a key economic input. The more interesting effect comes from the price stability created by daily dividends. If daily dividends, variable rates and active par management keep SATA and STRC trading in narrower ranges, realized volatility should fall. Implied volatility can follow as the market gains confidence in that behavior.
The Biggest Test
The real test is whether daily dividends increase demand enough to eventually lower the required yield.
If investors consistently support SATA near the top of its target range, Strive can theoretically reduce the dividend rate while attempting to keep SATA near par. Success would show that a Bitcoin company can issue permanent preferred capital, manage it around a stable price, and adjust its yield with market demand. The benefit of the variable rate preferreds was, from inception, the eventual opportunity to lower the rate and reduce the cost of capital without upsetting price stability. In comparison, fixed rate credit locks in fixed rate forever.
Conclusion
Strategy adopting daily dividends would move the feature from a SATA differentiator toward a digital credit category standard. The annual economics barely change but the retail appeal and crypto composability become meaningful improvements.
This post Impacts of Daily Dividends on Digital Credit first appeared on Bitcoin Magazine and is written by Allard Peng.
Bitcoin Magazine
Frank Holmes: They Will Print $100 Trillion – Why to Buy Bitcoin & Gold
Bitcoin miners already have the power, the land, and the substations that AI needs. Frank Holmes, executive chairman of HIVE Digital Technologies, explains why he calls Bitcoin mining a “tier one” data center, how GPUs that once mined Ethereum led HIVE into AI, and why he thinks the next wave of AI factories will be built on mining infrastructure from Paraguay to Canada.
Chapters:
0:00 Frank Holmes on HIVE: From Gold Investor to Bitcoin Miner to AI Compute
2:12 How ETFs Changed Bitcoin: From the Fear Trade to the Love Trade
4:20 The Binance $19 Billion Liquidation and the $350 Trillion Money Supply
5:45 Gamers, Younger Quants, and Why Bitcoin Will Keep Gaining Adoption
7:29 Covid’s $40 Trillion of Money Printing and the Global MMT Risk
9:24 China, Russia, and Why Bitcoin Is a Tier One Data Center
11:33 China’s Bitcoin Mining, $1.4 Trillion of Lending, and Central Banks Buying Gold
13:44 Paraguay’s Central Bank and Bitcoin Mining as an Export
14:57 Compute as a Commodity: Canada’s AI Push and Bitcoin Miners’ Power Advantage
20:34 Where to Find Frank Holmes’s Weekly Investor Alert Newsletter
DISCLAIMER: The views and opinions expressed in this show are those of the participants and do not necessarily reflect the official policy or position of BTC Inc., Bitcoin Magazine, or any affiliated entities. This content is provided for informational and educational purposes only and should not be construed as investment, legal, tax, or accounting advice. Nothing contained in this show constitutes a solicitation, recommendation, endorsement, or offer to buy or sell any securities or financial instruments. Viewers should consult their own advisors before making financial or business decisions.
This post Frank Holmes: They Will Print $100 Trillion – Why to Buy Bitcoin & Gold first appeared on Bitcoin Magazine and is written by Patrick Green.
CryptoSlate
Coin Metrics has rebuilt Ethereum's historical Standard Flow Metrics, raising a timing problem for tests that treat exchange outflows as a trading signal.
The crypto data provider's Oct. 1 notice says it recomputed Ethereum Standard Flow Metrics from the network's first block using its most up-to-date information as part of its Ethereum Point-in-Time release. The affected scope is all ETH Flow Metrics at daily and hourly frequencies, with corrected history available for backfilling.
That creates a practical distinction for investment research. A chart downloaded today can describe past flows using knowledge acquired later. A backtest, which replays a trading rule through historical data, needs the information available when each decision would have occurred. Those are different information sets, even when their observations carry the same dates.
The notice supplies no revision amounts or ETH strategy comparison. The immediate consequence is a need to identify data vintage, meaning the version of the data used in the test; any effect on returns still requires measurement.
Why the same historical date can tell a different story
Coin Metrics' flow methodology makes the distinction concrete. Standard metrics use all addresses currently known to belong to an exchange or other tracked entity, with each address's history starting at its first nonzero balance. Past values can be restated when additional entity addresses are identified.
Its Point-in-Time, or PIT, series instead uses addresses known to belong to the entity during the historical interval. An address contributes from its discovery date, and later discoveries do not rewrite earlier PIT intervals. The provider documents daily and hourly PIT counterparts to Standard exchange-flow metrics.
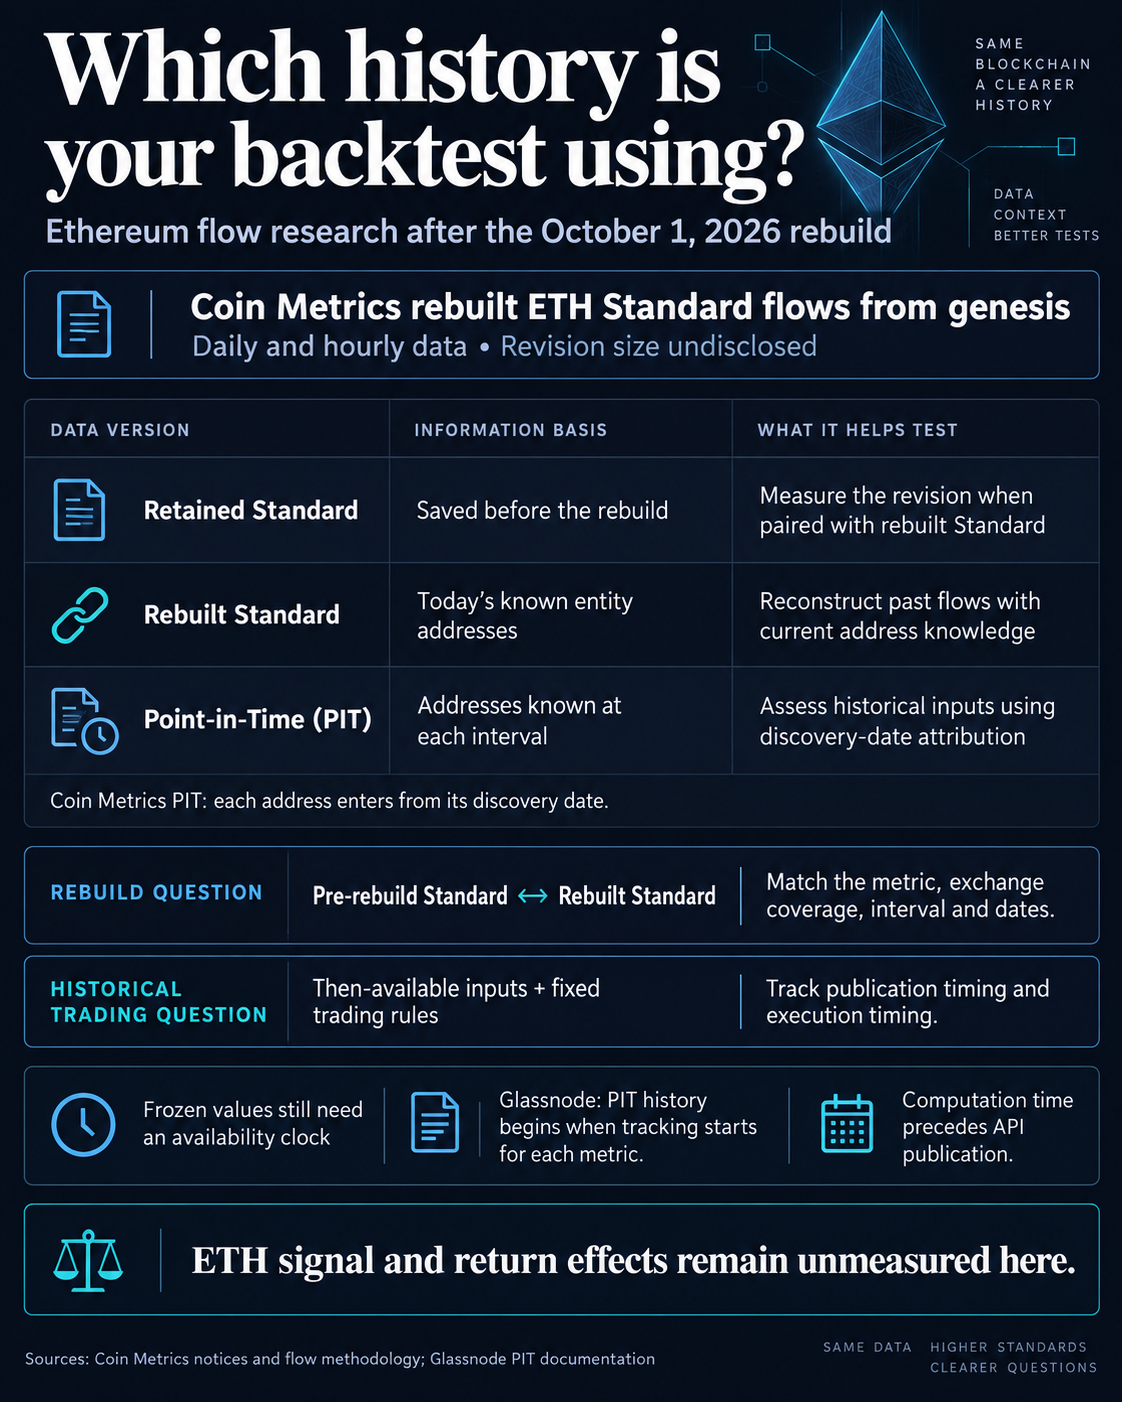
The underlying issue is attribution. A transfer can be assigned to an exchange retrospectively once the provider identifies the wallet. That fuller reconstruction may be useful for analyzing past supply movements with today's address coverage. Establishing what a trader could have recognized requires the address information and values available at that earlier moment.
Coin Metrics had outlined the recomputation on Sept. 28 to maintain that distinction, expecting ETH completion on Sept. 30. Its completion notice was posted Oct. 1 at 17:04 UTC; notice timing alone does not date every affected value's availability.
Two comparisons must also stay separate. Standard versus PIT tests different address-knowledge rules. Retained Standard history from before and after the rebuild is the comparison needed to measure this particular revision. PIT is a distinct attribution method. A copy of pre-rebuild Standard values preserves a particular version of the Standard product.
CryptoQuant's ETH Exchange Flows documentation explicitly warns that the endpoint does not support PIT accuracy. It says historical values may change as exchange wallets are discovered, added and validated through periodic clustering updates.
CryptoQuant schedules automatic updates for Tuesday at 00:00 UTC each week and says values can change slightly, especially recent observations. Each provider's revisions require their own measurements and update records.
For an analyst, retaining an old query date is therefore insufficient if the historical values are fetched again from a mutable endpoint. The dates of the observations may remain the same while the information used to construct them changes.
The interpretation of an outflow also needs restraint. A withdrawal measures movement relative to attributed exchange wallets. A claim about buying or profitable trading requires additional evidence.
Glassnode's BTC illustration isolates data-vintage risk
Glassnode supplied an illustration of the problem in a March 13, 2026, hypothetical backtest. It used Binance's BTC exchange balance to enter the market when a five-day moving average fell below a 14-day average and exit when the shorter average rose above the longer one.
The test covered Jan. 1, 2024, through March 9, 2026, starting with $1,000 and charging 0.1% per trade. Glassnode said it repeated the test using PIT balances while keeping the signal logic, parameters, dates and fees unchanged. The provider reported worse performance with PIT data than with revised balances.
The useful comparison is that the rule stayed fixed while the data variant changed. A historical balance pattern reconstructed with later knowledge can trigger different decisions from a pattern built from contemporaneous knowledge.
Glassnode supplied this BTC balance result, and the test remains unreplicated in this analysis. Its relevance to ETH is the measurement approach: hold the rule fixed and compare the data vintages. ETH signal and return effects require their own experiment.
The availability clock adds a further constraint. Glassnode's PIT documentation adds two limits to the shorthand promise of replaying the past.
First, PIT history exists only from the date tracking began for each metric. Before July 2025, coverage was limited to BTC, ETH and selected tokens and metrics; tracking expanded across all platform metrics from July 2025. A metric added then does not acquire earlier PIT observations merely because regular historical data exists.
Second, the timestamp attached to an observation is not necessarily when a trader could retrieve it. Glassnode says it has recorded relevant computed_at timestamps since September 2024, omitting the field when unavailable, and that API publication follows computation with a delay.
An unchanged historical value addresses later revision. Replaying a trading decision also requires placing the input after its actual publication. A test that acts before the input could be accessed still uses information from the future.
For Coin Metrics' ETH series, that means documenting each metric's first tracking date and historical customer availability. Glassnode's coverage dates and publication disclosures apply to its own products.
The evidence needed to measure an ETH trading effect
Measuring this rebuild requires paired observations from the same provider and metric, with matching exchange coverage, intervals and dates. For the revision question, that means retained pre-rebuild Standard values alongside the post-rebuild Standard history. For the trading question, it also means an information set demonstrably available at each decision time.
The rule must remain fixed across the comparison: the same entry and exit conditions, parameters and evaluation window. Availability cutoffs and execution timing belong in the test, alongside trading costs. Otherwise, changing the strategy while changing the data would leave the source of any performance difference unclear.
The comparison should then distinguish changed input values from changed signals, changed trades and changed returns. A revision can matter to the dataset without changing a particular rule's decisions.
The decisive follow-up is a paired ETH dataset and a fixed-rule replay that separates data changes from trading changes. Revised history can describe supply with today's address knowledge. A claim that outflows offered a usable trading edge requires reproducible inputs, publication timing and trading decisions.
The post Ethereum’s past outflow charts can change when more exchange wallets are identified appeared first on CryptoSlate.
Bitcoin's recovery above $85,000 faces a demand test after a sharp fall in bets on another Federal Reserve rate hike. A new post-payroll study places the strongest burst of forced buying before Friday's jobs report, while Bitcoin retreated after the release.
Bitcoin was $85,276 around press time, up 0.83% over 24 hours. The Sunday price remained below the $86,000 area reached before payrolls.
For holders tracking Bitcoin's recovery, the gap raises a practical question: who will sustain the recovery after the initial short squeeze? Thursday's ETF inflows provided a buying signal, but incomplete Friday figures leave the industry's response to payrolls unresolved heading into Monday's US session.
The squeeze came before payrolls
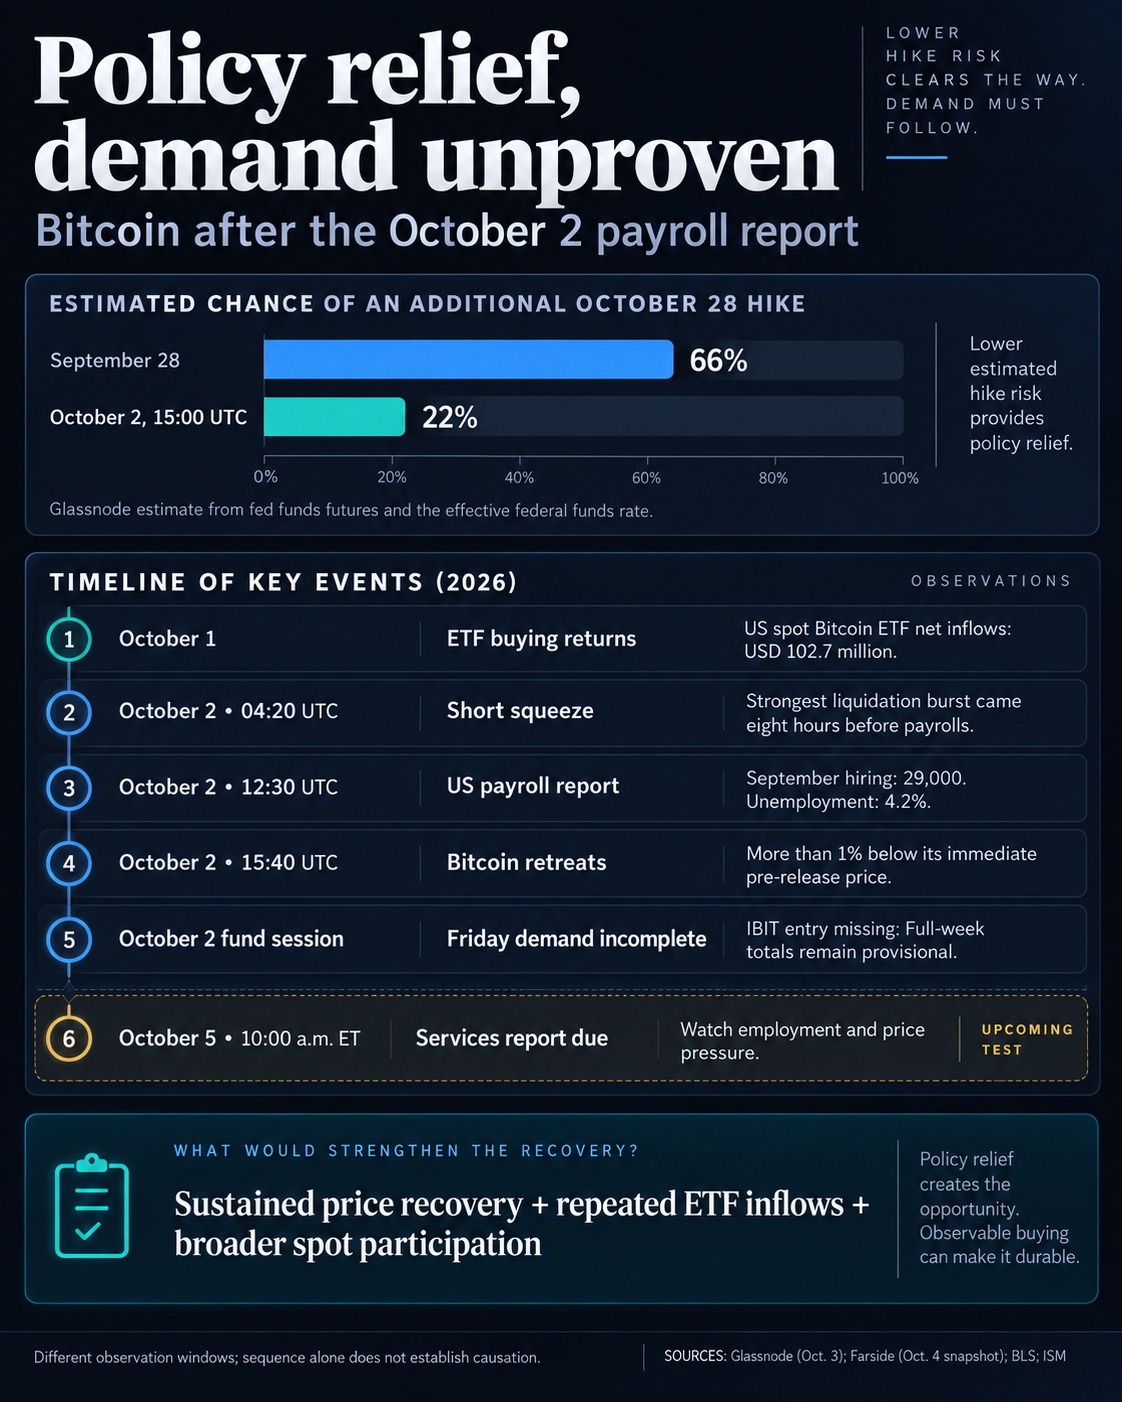
Glassnode's Oct. 3 post-payroll study estimated the probability of an additional quarter-point hike at the Oct. 28 meeting fell from 66% on Sept. 28 to 22% by 15:00 UTC on Oct. 2. The estimate comes from Glassnode's calculations using fed funds futures and the effective federal funds rate.
The timing of the strongest forced buying is revealing. Glassnode measured $50 million of short liquidations in ten minutes at 04:20 UTC on Oct. 2, eight hours before the jobs release. By 15:40 UTC, Bitcoin was more than 1% below its immediate pre-release level.
Short sellers can add buying pressure when rising prices force them to close their positions. Once those positions are closed, maintaining the higher price requires other buyers to absorb continuing offers. Friday's sequence supports caution about extrapolating the overnight advance into lasting investor commitment.
Open interest, the value of outstanding futures positions, rose $2.1 billion in the 24 hours before payrolls, according to Glassnode. Positions also grew about 2.5% when measured in coins. Open interest then fell $1.5 billion after continuing to rise for roughly an hour following the release.
The dollar change tracks outstanding exposure and is affected by valuation; investment capital lost is a different measure. The study's sequence links expanding positions to the advance and their subsequent retreat to falling prices, while leaving the cause of the reversal unresolved.
The fund market supplies a separate piece of evidence. US spot Bitcoin ETFs recorded net inflows of $102 million on Oct. 1, according to Farside Investors' flow table.
That positive session followed Wednesday's redemptions, showing that fund buying had returned before payrolls. It gives the recovery more substance than a short-covering explanation alone. Thursday's flow, however, describes a session before the report, leaving Friday's response to be measured separately.
Repeated inflows would extend Thursday's evidence across more sessions and show whether investors keep committing money after the release. Renewed redemptions would instead put that positive day in the context of a recovery struggling for sustained fund support.
Participation also matters beyond fund subscriptions. In its Sept. 30 market study, Glassnode put combined spot-exchange and US spot-ETF trading volume at about $6.4 billion a day, near the bottom of its range since the ETFs launched. That pre-payroll assessment provides a dated baseline for judging whether activity broadens.
Trading volume measures transactions, including repeated trades. A rise would indicate greater activity, while fund flows provide a separate measure of subscriptions and redemptions. Read together with price, these observations can help distinguish broader participation from an advance dominated by the closing of futures positions.
Monday tests the path from policy relief to buying
The latest observed Fed decision was a rate increase. Its Sept. 16 announcement raised the target range by a quarter percentage point to 3.75%-4%. Falling October hike odds leave that increase in place; a cut would require a separate policy decision.
The September employment report, released on Oct. 2, recorded 29,000 payroll gains and 4.2% unemployment. The Bureau of Labor Statistics described both as little changed. Slower hiring can give policymakers reason for patience, making the report relevant to the next decision even while September's increase remains the policy baseline.
Longer-term rates present another hurdle. Glassnode's Friday intraday study showed short-term yields falling while long-term yields rose, with the ten-year near 5.2%. That divergence matters because a reduced prospect of further Fed hikes can coexist with elevated longer-term borrowing costs.
For Bitcoin, the benefit depends on how investors respond. A more favorable outlook for the next policy meeting may encourage additional exposure. Whether that becomes sustained buying must be observed in the market, alongside the financing conditions investors still face.
The Institute for Supply Management's September services report is scheduled for Monday, Oct. 5 at 10:00 a.m. ET. Its previous August survey combined a headline PMI of 55.4 with employment at 47.8 and a prices index of 72.6: expanding activity, contracting employment and broad input-cost pressure.
That combination makes the next report's details relevant alongside its headline. Softer employment accompanied by easing price pressure could reinforce the argument for policy patience. Persistent price pressure or stronger activity could complicate it. The services release therefore supplies a fresh check on the rate outlook that emerged from payrolls.
The next US ETF sessions will show whether fund investors keep buying as the market absorbs that outlook. Their timing matters: flows reported after the release can extend the evidence beyond the Thursday inflow already recorded, while a completed Friday row would clarify the initial response.
Bitcoin stood above $85,000 in Sunday's snapshot but below its pre-payroll $86,000 area. Sustaining a recovery toward that level with repeated fund inflows and stronger spot participation would weaken the demand concern. Another rejection without those supporting signals would strengthen it. Those combined observations would give holders firmer evidence of follow-through than a lower hike-probability estimate alone.
The post Bitcoin’s $85,000 recovery awaits proof that ETF investors kept buying after payrolls appeared first on CryptoSlate.
Bitcoin Core has added a safeguard against signing transactions that may not bind funds to the payment destination a user approved.
The change, merged into Bitcoin Core’s master development branch on Sept. 25, targets a narrow flaw in partially signed Bitcoin transactions, or PSBTs, that could produce a valid signature without protecting the intended output.
Bitcoin Optech highlighted the update on Oct. 2. The issue does not expose a user’s private key, but creates a different risk: a signature can remain valid even when the transaction’s recipient is changed under specific conditions.
The weakness involves SIGHASH_SINGLEwhich is a signing mode designed to commit an input to the output in the corresponding position. If the transaction contains no output at that position, the protection breaks down differently depending on the type of Bitcoin being spent.
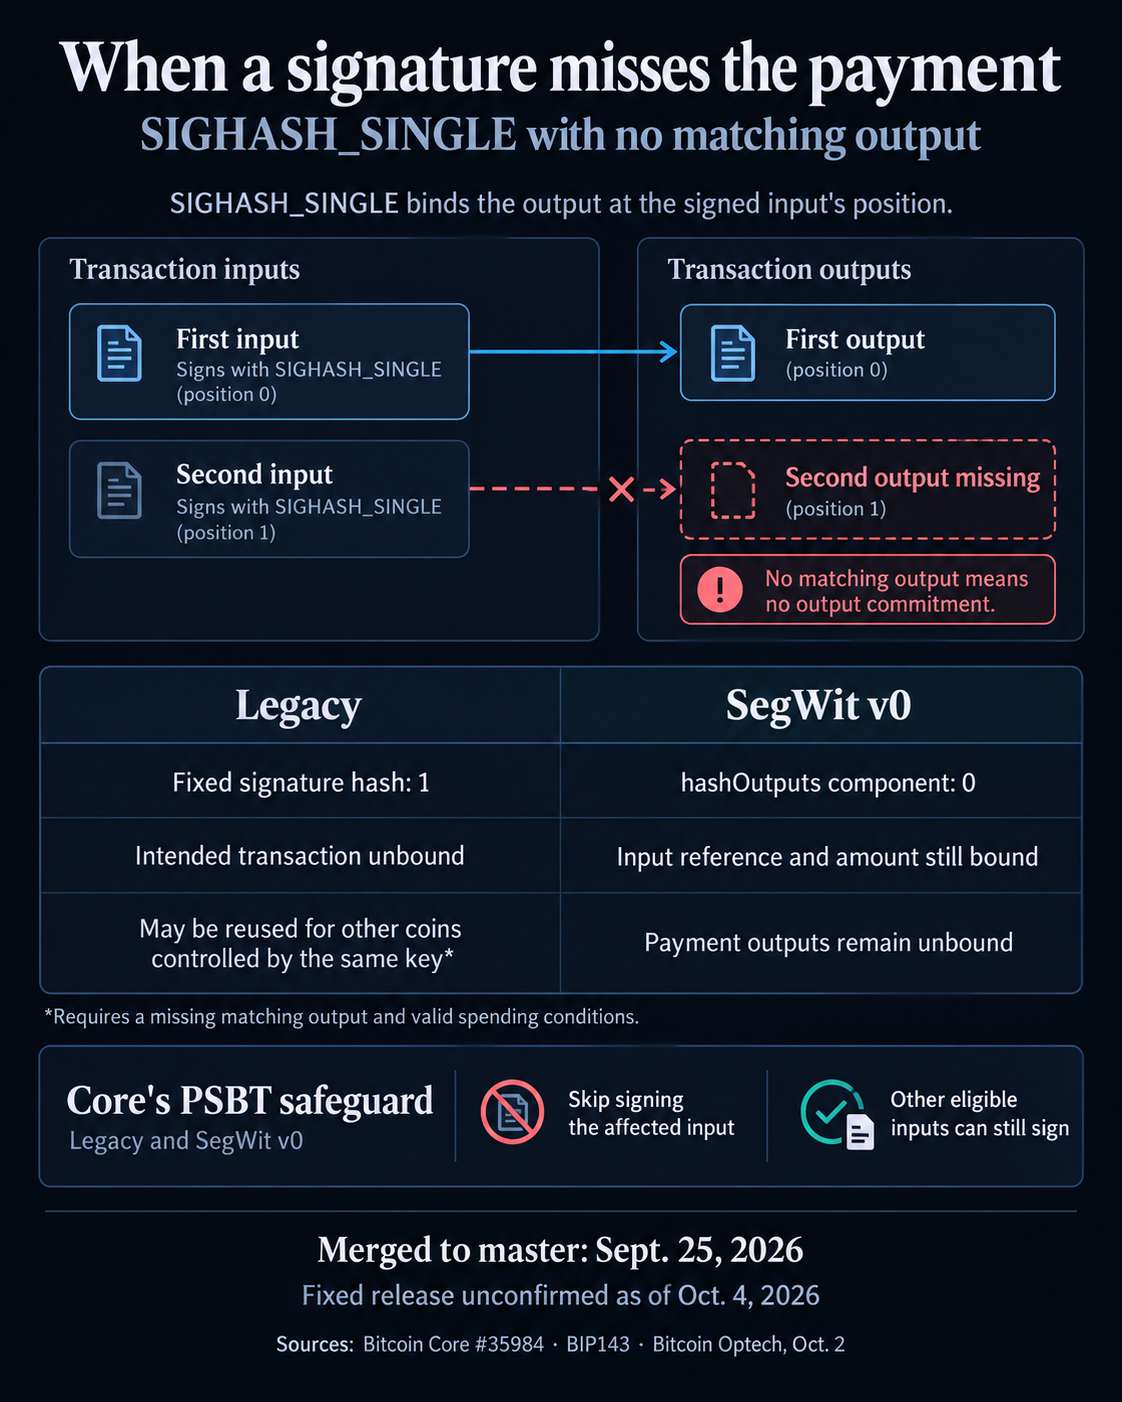
For legacy inputs, the missing-output case can produce a signature over a fixed hash value. Bitcoin Core developers said that signature may then be reusable against other unspent outputs controlled by the same key when the same structural conditions are present.
SegWit v0 transactions retain stronger protections because the signature still commits to the specific coin being spent and its amount. The destination output, however, can remain unbound.
That creates an authorization problem for wallets and signing devices: software could present one payment to the user while producing a signature that does not cryptographically guarantee that the approved recipient remains unchanged.
Bitcoin Core blocks the risky signing request
Bitcoin Core already rejected the edge case through its raw-transaction signing interface. Its PSBT path, including walletprocesspsbtcould still sign it.
The new code moves the check into Bitcoin Core’s shared signature-creation logic, preventing affected legacy and SegWit v0 inputs from being signed while allowing other valid inputs in the same PSBT to proceed.
PSBTs are commonly used to coordinate transactions between software wallets, hardware devices and offline signers. They allow transaction builders to pass information to a separate signer without giving that system control of the private keys.
The fix therefore reinforces a boundary that wallet developers must enforce independently of key security: a valid cryptographic signature must commit to the transaction details the user actually authorized.
Bitcoin Improvement Proposal 174, which defines PSBTs, already tells signers to reject unacceptable signing modes and recommends SIGHASH_ALL when no alternative is specified. The Bitcoin Core change explicitly prevents this missing-output configuration from reaching the signing stage.
Users do not yet have a confirmed production release containing the safeguard. The Sept. 25 change was merged into Bitcoin Core’s development branch, while the project’s published release listings had not identified a fixed version or confirmed backport as of Oct. 4.
That leaves wallet providers and hardware-signing integrations with the more immediate decision: review their own handling of SIGHASH_SINGLE requests rather than waiting for a Bitcoin Core release to enforce the same protection downstream.
The post Bitcoin Core’s new fix closes gap that could redirect funds without stealing keys appeared first on CryptoSlate.
US government debt is one of the easiest assets in the world to borrow against, which lets financial companies get cash without giving up their investments for good.
Washington is rewriting the rules for that borrowing, and the result will reach crypto through the companies that keep Treasury securities behind their dollar tokens.
The SEC wants more Treasury transactions to pass through a central clearinghouse, an institution that becomes the buyer to each seller and the seller to each buyer.
If one trading company fails, the other side can look to the clearinghouse to complete the covered trade, under its rules, instead of trying to recover everything from the failed company itself.
Providing that kind of protection takes a lot of money, so the new system will also affect what companies pay to trade and borrow. Stablecoin issuers depend on those services when they need to convert reserve assets into dollars for customers, so the cost and availability of Treasury trading affect how well their tokens work.
The SEC's deadlines are Dec. 31 for eligible outright purchases and sales of Treasuries, followed by June 30, 2027, for eligible repurchase agreements, known as repos. Commissioner Mark Uyeda said on Sept. 22 that the agency didn't currently intend to extend them.
These requirements cover specified trades involving clearing members, rather than every purchase of a Treasury by anyone who owns one.
Owning the Treasury bond is only half the transaction
Suppose an investment fund owns Treasury securities but needs dollars today, before the government is due to repay it. The fund could sell some of those securities, or it could use a repo: sell them now with an agreement to buy them back on a set date, often the next day, for a slightly higher price.
Economically speaking, the fund has borrowed cash, with the Treasuries protecting the lender and the price difference paying for the loan. The borrower gets money it can spend while keeping a road back to its securities, and the lender earns a return on cash it wasn't using.
Dealers, usually banks or securities firms, connect much of this business. The New York Fed's explanation of the repo market follows cash from lenders such as money-market funds through dealers to borrowers such as hedge funds.
Dealers can borrow in one part of the market and lend in another, earning money for arranging and financing the transactions.
The scale is enormous: activity used to calculate the Secured Overnight Financing Rate, or SOFR, went from about $1 trillion in early 2022 to roughly $3 trillion, according to the Fed research.
SOFR measures the cost of overnight borrowing against Treasuries, and those volumes cover the transactions feeding that benchmark, rather than the whole repo market.
But even with that much money moving around, an individual customer can struggle to borrow on good terms. Dealers have limits on how much business they can carry, partly because their trades use capital and count toward regulatory constraints.
Plenty of available cash elsewhere in the market doesn't help much if the firm connecting you to it has reached its limit.
Central clearing can reduce some of that burden through netting, which means recognizing offsetting amounts. In a simplified example, a dealer owes $100 and is due to receive $95 on the same settlement date.
If both obligations qualify for netting through the same clearinghouse, the cash payment can be reduced to $5.
Real Treasury trades also involve securities deliveries, and the legal agreements determine which obligations can be combined. But the basic benefit is straightforward: companies can need less money to complete offsetting trades, and qualifying netting can also reduce the balance-sheet resources those trades consume.
That could let a dealer serve more customers with the resources it already has. Whether customers get cheaper borrowing depends on how much the dealer saves and how much of that saving it passes on, after accounting for clearing costs.
Someone still has to bring the collateral
The clearinghouse can promise to complete trades because it collects financial resources and has procedures for dealing with a member that can't pay. International standards for clearinghouses require them to manage the exposures they take on and hold resources they can use during stress.
One part of that protection is margin, meaning cash or eligible securities posted against a position. If a company defaults and its trades cost money to close, that collateral helps cover the bill.
Until then, the company must keep it available, even if it would prefer to put the money to work elsewhere.
This is where a safer transaction can become a more demanding one for its participants. Being able to afford a trade over its full life doesn't mean a company has the right collateral ready when it's due, especially when several obligations need funding at once.
Many customers also need another company to get them into the system. The Fixed Income Clearing Corporation, or FICC, operates a Sponsored Service in which an approved sponsoring member handles operational duties and guarantees specified obligations for its customers.
That sponsor takes on work and risk, which can affect the terms it offers.
FICC's Collateral-in-Lieu service for eligible cash lenders uses protections involving the Treasury collateral in the transaction so those lenders don't have to post initial margin under that model. The arrangement shows why being required to use a clearinghouse doesn't automatically mean every participant must find the same amount of extra cash.
Customers still need to compare the full price of access, including the fee they pay a provider and the cost of keeping collateral available.
Savings from netting can make one part of the transaction cheaper while the new service adds expenses elsewhere, so the final bill depends on the arrangement the customer can obtain.
DTCC's July survey of FICC members gives us plenty of good reasons to watch that choice of providers. While 79% of responding netting members already had the necessary account setups, only about a third expected to offer Treasury cash clearing to their clients.
Those numbers just describe the survey respondents, and they don't prove customers will be shut out. But they do show why a dealer being ready to comply isn't the same as that dealer being willing to take on your business.
If customers have few providers to choose from, providers have less reason to compete away the savings that clearing can produce.
Digital dollars inherit the operating hours
Issuers of dollar-linked stablecoins can keep part of their backing in short-term Treasuries because those securities earn income and have a large resale market. But when an eligible customer redeems tokens, the issuer owes dollars, so it needs cash on hand or a reliable way to obtain it from its reserves.
That's a different arrangement from a bank putting an existing deposit on a blockchain. Tokenized deposits and the money behind bank lending explain how those products preserve the customer's claim on the bank.
With a Treasury-backed stablecoin, the issuer's reserve management and banking relationships determine whether it can meet the redemption terms it offers.
The connection to clearing runs through those relationships, whether the issuer trades directly or uses a fund manager and other intermediaries.
If its providers can sell or finance Treasuries more efficiently, managing redemptions could become easier or cheaper. If access becomes more expensive, the issuer may face higher reserve-management costs, although that doesn't automatically mean customers pay a new fee.
Nor does central clearing make the reserve market operate around the clock. You can send a token on Sunday while the issuer's banks and securities providers work on different hours, and sending that token to another person is different from asking the issuer to pay dollars into a bank account.
The issuer has to plan for that gap through its cash holdings and the redemption terms it promises.
Keeping more cash readily available can help meet withdrawals, but it may earn less than other permitted reserve investments. Relying more heavily on selling or financing securities can preserve flexibility elsewhere, but it makes dependable access to those services more important.
Each issuer has to choose an arrangement it can actually operate when customers want their money back.
The overhaul could improve that access by making dealers' resources go further and giving trading partners a common process when a firm fails. It could also leave some customers dependent on a small number of providers, especially if opening a replacement account takes time.
Both outcomes can exist in the same market, with larger customers getting better terms than smaller ones.
That makes the price of access and the ability to switch providers worth watching as the deadlines approach.
Treasury-backed tokens depend on people who can turn securities into a payment, and the benefit of Washington's new rules will reach their holders only if that job becomes more dependable at a cost the issuer can support.
The post New Treasury rules could change how stablecoin issuers get your dollars back appeared first on CryptoSlate.
India’s crypto users send substantial value to centralized exchanges, but domestic platforms receive just 0.7% of exchange value in Chainalysis’s new regional report. Its Brazil chapter puts Brazil-based exchanges at 12.5% of inflows.
The contrast separates two business questions that adoption figures can blur: how much activity is associated with a country, and how much its domestic platforms capture. India’s transaction withholding can reduce the cash available for another trade. Its role in venue choice remains an operator explanation, rather than a measured cause of the split.
The findings appeared in Chainalysis’s CSAO chapter on Sept. 30 and Latin America chapter on Sept. 23. Their main annual reporting window runs from July 2025 through June 2026, while the share observations’ precise dates remain unspecified in the chapters’ prose. The new publications describe earlier activity, ending before October.
Chainalysis attributes $88.4 billion in centralized-exchange inflows to India-based users during that annual period, making India the largest such market in Central and Southeast Asia and Oceania. That activity can reach platforms based abroad.
The Indian chapter reports that domestic platforms’ share of exchange value received fell from around 7% to 0.7%, with a sharp decline in mid-2022. Brazil’s chapter describes a different trajectory: Brazil-based exchanges previously received 1.5% of inflows and now receive 12.5%.
Those percentages describe received value in Chainalysis’s exchange analysis. Executed trades, revenue and customer numbers measure other parts of a platform’s business. One deposit can fund subsequent trading, so the amount entering an exchange and the activity inside it answer different questions.
Whether the platform sample stayed unchanged also remains unspecified. The reported divergence supports a descriptive comparison; a synchronized annual market-share comparison would require matching dates and samples.
Brazil’s broader crypto economy recorded $252.5 billion in activity in the year ending June 30, despite contracting 1.6%. That total combines several kinds of activity and has a different scope from exchange inflows. An annual domestic-exchange dollar estimate for either country would require a share and inflow total with matching windows, samples and denominators.
Chainalysis’s general 2026 methodology assigns pooled service activity to user countries using website traffic. For that allocation, it adjusts traffic shares for income differences using the square root of GDP per capita. The chapters leave the detailed calculation of the domestic exchange shares unspecified.
The country assignment follows estimated users. This allows activity at an exchange based abroad to contribute to India’s measured market, while domestic platforms receive a small reported slice.
Chainalysis acknowledges that removing VPN and bot traffic is imperfect. The figures are estimates of geographically attributed activity, with that uncertainty built into the comparison.
Withholding changes the cash available for another trade
India’s current section 393 sets 1% withholding on consideration for a virtual digital asset transfer paid to a resident, subject to applicable exemptions. The responsible payer deducts at the earlier of credit or payment.
The base matters: consideration is the amount paid for the transfer. Withholding is calculated against that amount, so a deduction can reduce available proceeds even when the transaction produces little gain.
Consider a ₹100,000 cash sale with consideration paid to a resident seller subject to the standard 1% deduction. Before fees or other adjustments, the seller receives ₹99,000, with ₹1,000 withheld toward tax. That ₹1,000 cannot immediately fund another purchase.
Another liable sale can generate another deduction, adding to the amount already withheld. The final tax calculation determines how those deductions are credited, while each applicable deduction reduces the proceeds immediately available.
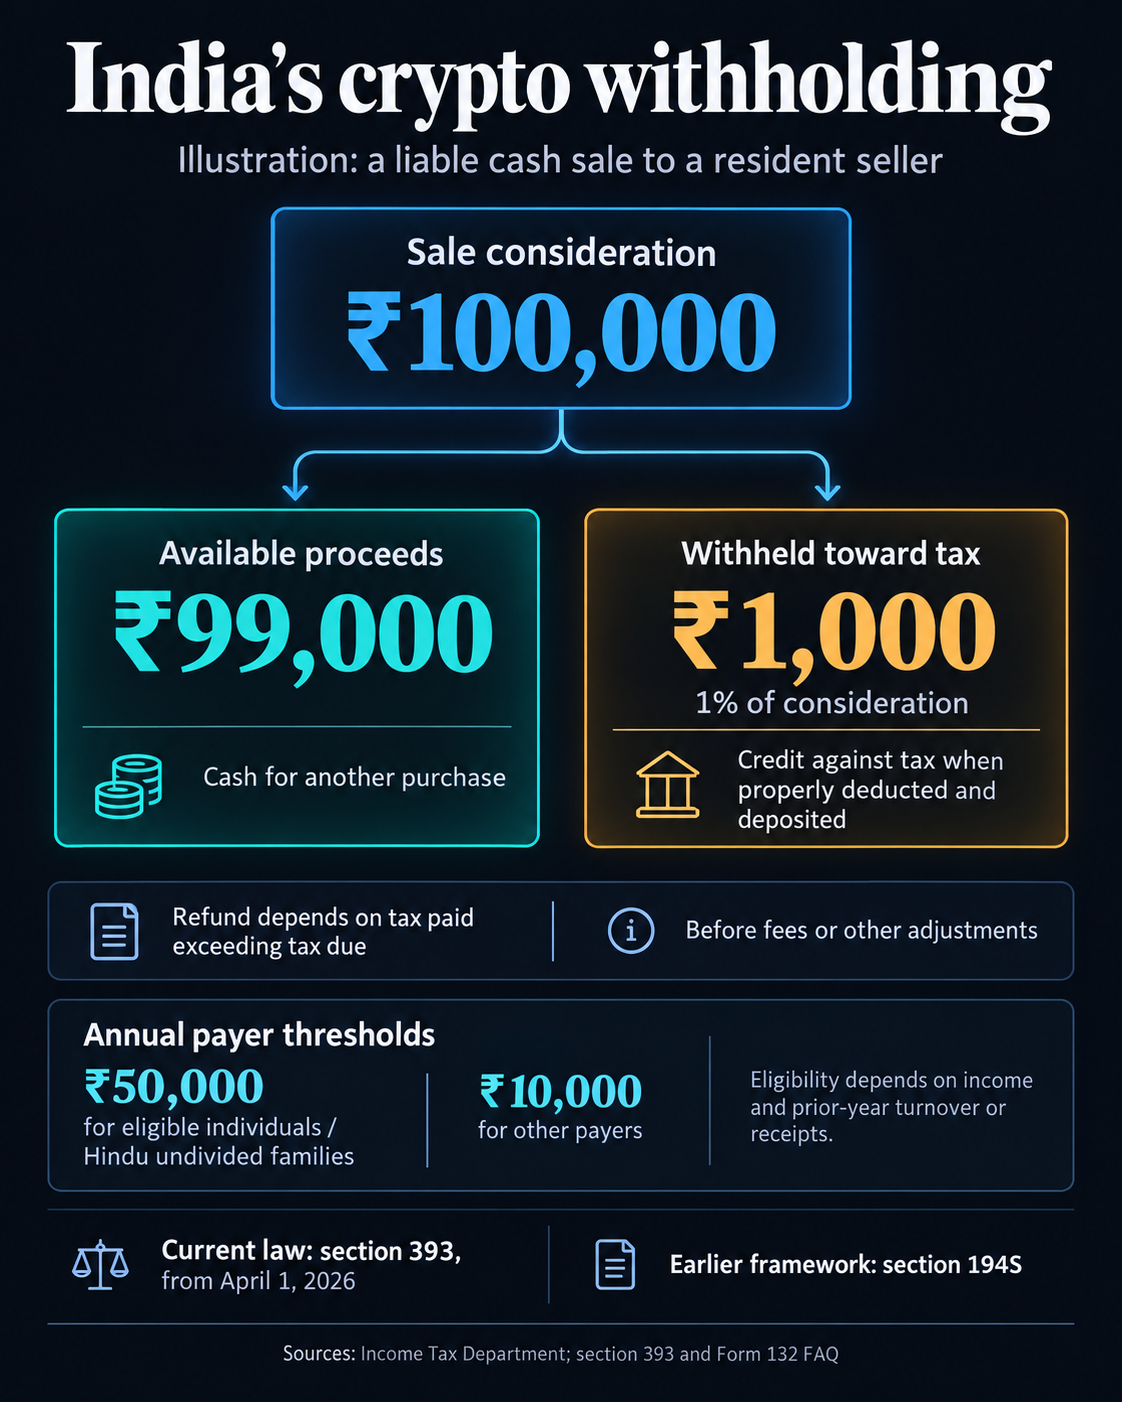
The current Act’s exemptions depend on the payer and tax-year aggregate consideration. The limit is ₹50,000 for eligible individuals or Hindu undivided families, including those without business or professional income. Eligibility also covers the stated prior-year business turnover ceiling of ₹1 crore or professional receipts ceiling of ₹50 lakh. Other payers have a ₹10,000 limit.
The limits apply to the tax-year aggregate. Their relevance depends on the payer’s circumstances, so checking eligibility comes before applying the general rate.
Who handles the deduction also matters. The statutory obligation belongs to the responsible payer. The department’s historical section 194S guidance separately explains buyer responsibilities in direct transactions and exchange responsibilities in relevant exchange settlements.
The department’s VDA tax-certificate FAQ explains that the deductee can claim TDS credit when filing a return. The Act allows a refund where tax paid exceeds tax due, with a return claim required.
For traders and platforms, tax credit and trading cash therefore work on different timelines. A deduction can offset tax while reducing immediately available proceeds. The transition guidance explains how credits follow the relevant tax period; it supplies no fixed refund waiting time.
CoinSwitch co-founder Ashish Singhal told Chainalysis that tax friction helps explain offshore use, adding that foreign venues may not make the deduction. That is an operator’s account of the competitive pressure facing compliant exchanges.
How much withholding contributed to the reported share decline remains unmeasured. Foreign platforms may comply with Indian obligations, and a platform’s location alone supplies no blanket exemption. Singhal’s explanation identifies a plausible competitive pressure while leaving its contribution to the measured outcome open.
Payment access extends across local and international venues
Fiat access offers another possible part of the explanation. Mercado Bitcoin describes a Pix route for buying cryptocurrency from a customer’s bank app. That connects a familiar payment service with crypto access.
An INR buying explainer from CoinSwitch describes deposits through UPI and net banking on platforms operating in India. The generic explainer shows how local currency access can work in India; availability depends on the platform and supported method.
International competition can use local rails as well. Binance’s BRL deposit guide describes Pix and TED transfers. These examples show local payment routes appearing in both domestic and international offerings.
Chainalysis presents regulatory clarity, investment and stronger local offerings as possible explanations for Brazil’s growing domestic share. Its industry interviewees also describe corporate stablecoin use for liquidity and cross-border transfers. Such demand could give platforms opportunities beyond investment trading. Its effect on domestic venue choice remains a hypothesis: the product pages document offerings, while the interviews describe industry experience.
India’s large attributed exchange market can coexist with a small domestic-platform foothold. Brazil’s reported domestic gain shows a different pattern. For operators, the destination of exchange inflows remains a distinct question from the size of national participation.
The post India’s local crypto exchanges get just 0.7% of inflows, Chainalysis reports appeared first on CryptoSlate.
CryptoTicker.io
The Ethereum price stands at $2,702 on Sunday evening, or 2,399.90 euros, up 0.7 percent over 24 hours. The next target to the upside is no estimate. It is a level taken from Ether's own chart: $2,775, the high of 22 September, and therefore only 2.7 percent away. The question this weekend is not whether ETH clears those $73. What decides matters is who will be able to sell at all over the next three weeks, and who will not.
Because 812,887 ETH are sitting in the staking exit queue, a good $2.2 billion. Anyone joining that queue today gets their money back in roughly 22 days. This is a hard liquidity question for every European investor who holds ETH in staking and wants to remain able to act before the Glamsterdam upgrade on 4 November.
Ethereum price at $2,702: 2.7 percent below the September high, 21.6 percent above the 200-day line
Let us place the price first, so the levels later do not come out of thin air. The following values are taken from CoinGecko's daily price series over the past 365 days, as of 4 October.
- Current price: $2,702, or 2,399.90 euros
- 200-day line: $2,117.74, with the price 27.6 percent above it
- 50-day line: $2,500.34, with the price 8.1 percent above it
- High of the past 30 days: $2,775.17 on 22 September
- Low of the past 30 days: $2,397.50 on 16 September
- January 2026 high: $3,351.82 on 15 January, still 24.0 percent away
- Low for the year: $1,566.01 on 26 June
Two of those numbers carry the picture. First, ETH has closed above its 200-day line for 47 trading days in a row. That line is the average price of the past 200 days and serves as a rough divide between an upward and a downward phase. Second, the price has spent two weeks in a narrow band between $2,397 and $2,775, a corridor of some 16 percent. Together they describe a market that is neither breaking out nor breaking down.
812,887 ETH in the exit queue: $2.2 billion waiting for the way out
Staking your ETH means depositing it with a validator and helping to secure the network. There is a yield for that, but the coins are not freely available. The way back runs through a waiting queue, because the protocol releases only a limited number of validators per unit of time. That queue has become the number of the weekend.
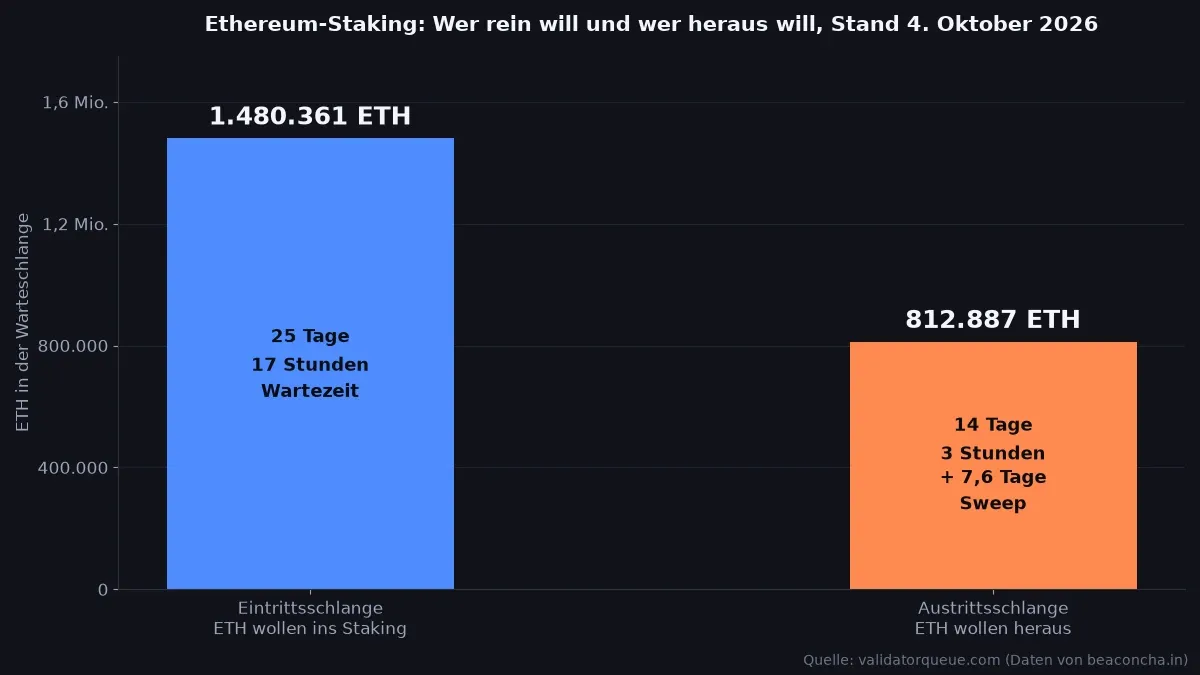
According to validatorqueue.com, which sources its data from beaconcha.in, 812,887 ETH are queued to exit. At a price of $2,702 that is $2.2 billion, or roughly 1.95 billion euros. Measured against the 43.5 million ETH staked in total, it amounts to 1.87 percent. The estimated waiting time until exit is 14 days and 3 hours.
A sweep delay of 7.6 days: 14 days of waiting become about 22
Here lies the point most overviews leave out. Those 14 days and 3 hours are only the first half of the journey. After leaving the validator set, the balance still has to be transferred to the registered withdrawal address, and this so-called sweep works through the addresses in order. That currently adds 7.6 days.
In total, then, 21.7 days pass between the decision and the available balance. Start your exit on 4 October and your ETH lands on the withdrawal address on 25 October. Three weeks is a long time in a market that has moved 16 percent in two weeks. If you want to steer your position size through a possible dip in the price, staked ETH simply does not let you do it at short notice. That is the real cost of the 2.63 percent yield, rather than the yield itself.
In practice: split your holdings between the part that is to stay staked and the part that has to remain tradable. You will find an overview of the providers and their respective exit routes in our comparison of staking platforms, because the protocol deadline is only the floor. Centralised providers add processing times of their own, while decentralised liquid staking tokens can be sold on the market, though often at a discount to the ETH price itself.
The entry queue is larger: 1,480,361 ETH want to go the other way
An exit queue worth $2.2 billion sounds like flight. The counter-figure appears in the same overview and turns out to be considerably bigger: 1,480,361 ETH are waiting to be admitted into staking, with a waiting time of 25 days and 17 hours. That is 1.8 times the exit queue and corresponds to around $4.0 billion.
On balance, 667,474 ETH more want in than out. For the price question that is the more important figure. Every ETH that enters the entry queue is unavailable to the market as sellable supply for at least 25 days. In total, 35.61 percent of all ETH is staked, spread across 870,025 active validators. Read only the exit number and derive selling pressure from it, and you have read half the table.
Glamsterdam on 4 November: the Hoodi fork of 5 October is the last testnet stage
The date on which the queues and the price meet is in the developers' calendar. Glamsterdam is Ethereum's next major upgrade after Fusaka, and according to the overview at EIPs Insight the target date for mainnet is 4 November 2026. One stage comes before it: on 5 October, that is Monday, the Hoodi testnet forks. The Sepolia testnet went through the fork on 21 September.
In substance, Glamsterdam brings two changes worth knowing about, even if you do not run a validator yourself. EIP-7732 writes the separation of block proposal and block building firmly into the protocol, known as enshrined proposer-builder separation. EIP-7928 introduces access lists at block level, allowing a client to know in advance which data a block touches. Both aim to make it possible to raise the gas limit without overwhelming the requirements placed on a single node.
What a testnet fork actually means for you
A testnet fork is a dress rehearsal on a copy of the network without real value. For you as a holder, nothing changes on Monday: your ETH stays where it is, there is no swap, no new address and no action you would have to take. The date only becomes relevant if you run a validator yourself or sit with a provider that fails to update its clients in time. Either way, that is a question for your service provider.

The calendar arithmetic: start on 14 October and you are liquid by the upgrade
A date can be derived from those two numbers, and that date is the real value of this exercise. The upgrade targets 4 November. The way out of staking currently takes 21.7 days. So if you want free use of your ETH on upgrade day, you have to trigger the exit by 14 October at the latest. After that the time runs out.
One caveat belongs here in all honesty: the waiting times are not fixed values. How they develop depends on how many validators want out at the same time, and they can double or halve within days. The 14th of October is therefore not a guaranteed cut-off but the arithmetic based on today's queue. If you want to be safe, build in a buffer of a week and check the figure again before you start.
And there is the counter-question: do you actually need liquidity on 4 November? An upgrade is not an event that forces a sale. Fusaka went over mainnet without incident in December 2025. If you hold for the long term and want to collect the yield, you have no reason to leave staking because of a date. The arithmetic above applies to anyone with a concrete intention to sell.
The levels above: $2,775 from September, then $3,351 from January
Back to the price. The first level to the upside is the September high at $2,775.17. It is the point where the market turned two weeks ago, and it sits 2.7 percent above the current reading. As long as ETH stays below it, the price moves inside the band that has held since mid-September.
Only above it does the view open on the round $3,000 mark, which last held in early February of this year. The next demonstrable target after that is the January high at $3,351.82 from 15 January, currently 24.0 percent away. This is explicitly not a forecast; these are places where trading actually took place in the past.
The levels below: $2,500 as the 50-day line, $2,397 as the September low
To the downside, the first catch line is $2,500.34, the average of the past 50 days, 7.5 percent below the current price. Below that follows the September low at $2,397.50, some 11.3 percent lower. The 200-day line at $2,117.74 is far away at a distance of 21.6 percent and would be the level at which the run of 47 days above that line would end.
For practical purposes: if you work with a stop level, the round number 2,500 has the drawback that almost everyone else can see it too. The average happens to sit just beside it at 2,500.34. Choose a distance of a few percent below and you avoid the densest zone. And if you work with leverage, hold the 16 percent range of the past two weeks against your liquidation distance: at five times leverage, liquidation sits roughly 20 percent away, which is already within what the market has covered in 14 days.
2.63 percent staking yield: what 870,025 validators pay out over a year
The yield for which one accepts those 22 days of waiting currently stands at 2.63 percent a year. On a single ETH that works out at around $71 a year, and on a stake of 10,000 euros at roughly 263 euros, in each case before tax and before the provider's fee. The rate falls as more ETH is staked, because the protocol's payout is spread across more validators. The entry queue of 1.48 million ETH therefore tends to push this value down further.
The fee decides the net yield. Centralised providers usually keep between 10 and 25 percent of the proceeds, which turns 2.63 percent gross into somewhere between 1.97 and 2.37 percent net depending on the provider. A difference of 0.4 percentage points on 10,000 euros comes to 40 euros a year, and that is more than most people expect when they compare.
Holding period and the tax office: what the German BMF letter of 6 March 2025 sets out for staked ETH
For German private investors, the disposal period under section 23 paragraph 1 sentence 1 number 2 of the Income Tax Act applies to the sale of crypto assets. Once a year has passed since acquisition, a gain on the sale is tax free; before that it counts as a private disposal transaction and is taxed at the personal rate.
The clarification that matters for stakers is in the BMF letter of 6 March 2025: staking and lending do not extend that period. The 2021 draft had provided for an extension to ten years where crypto assets are used as a source of income. That rule never came into force. Hold your ETH for longer than a year and you do not lose the tax exemption on the gain simply because you staked it in the meantime.
The staking rewards themselves are to be looked at separately. These rewards count as other income in the year they accrue, and a holding period of their own begins for them on the day they arrive. Receive rewards in October and sell them in December and you have a taxable event there, even if the ETH originally staked is long outside the period. For documenting these two pots, our overview of tax tools and portfolio trackers is worth a look, because otherwise the inflow dates have to be pulled out of the statements by hand. This account does not replace tax advice; for your individual case, the word of your tax office or your adviser applies.
Holding and buying ETH under MiCA: what to check before your next step
Since the European crypto regulation MiCA has applied in full, providers in Europe need authorisation to offer custody and trading. For you as a buyer, three points are verifiable before you pay money into an exchange or hand ETH over to staking.
- The authorisation: does the provider appear in a public register with a MiCA licence or a licence under banking law, and which country does it cover? That information belongs in the legal notice, not just in the advertising.
- The custody arrangement: is your ETH held separately from the provider's own assets, and do you get proof of it? With a liquid staking token you do not hold ETH itself but a claim on it, and that claim can trade below the ETH price on the market.
- The costs across the whole route: purchase, custody, staking fee and withdrawal. The spread on the purchase is the item fewest people recalculate, because it is not shown as a fee. A side-by-side look at the terms belongs before the purchase rather than after it.
Ethereum price: the key points for your decision
- Measure your staked share against your liquidity needs. An exit currently takes 21.7 days. If you want free use of your ETH on 4 November, 14 October is the last possible starting date by that arithmetic. The deadlines of the individual providers are in the staking comparison.
- Set your levels on the measured points, not on round numbers. Upwards that means $2,775.17, downwards $2,500.34 and $2,397.50. If you are buying or adding, the terms are in the exchange comparison.
- Separate holdings and rewards in your tax file. The one-year period applies to the holding and is not extended by staking; every reward runs a period of its own from the moment it arrives. Tools for this are in the overview of tax software.
(As of October 4, 2026. This article is not investment advice. Prices and fee structures change; check the terms with the provider before you buy.)
Ether began October 2026 without direction and costs around $2,690 on Sunday morning, October 4 (according to CoinGecko), almost exactly what it cost at the start of the month. For the Ethereum price prediction the question is whether October lives up to its reputation. We evaluated the monthly candles from Binance since 2018, and for Ether the result comes out more mixed than it does for Bitcoin.
Ethereum’s October record since 2018
Five of eight Octobers ended higher for Ether. The standout was 2021 at plus 42.9 percent, followed by 2022 at plus 18.4 percent, 2023 at plus 8.6 percent, 2020 at plus 7.4 percent and 2019 at plus 0.7 percent. The years that ended lower were 2018 at minus 14.7 percent, 2024 at minus 3.2 percent and 2025 at minus 7.2 percent (monthly Binance candles against USDT, October 1 to 31).
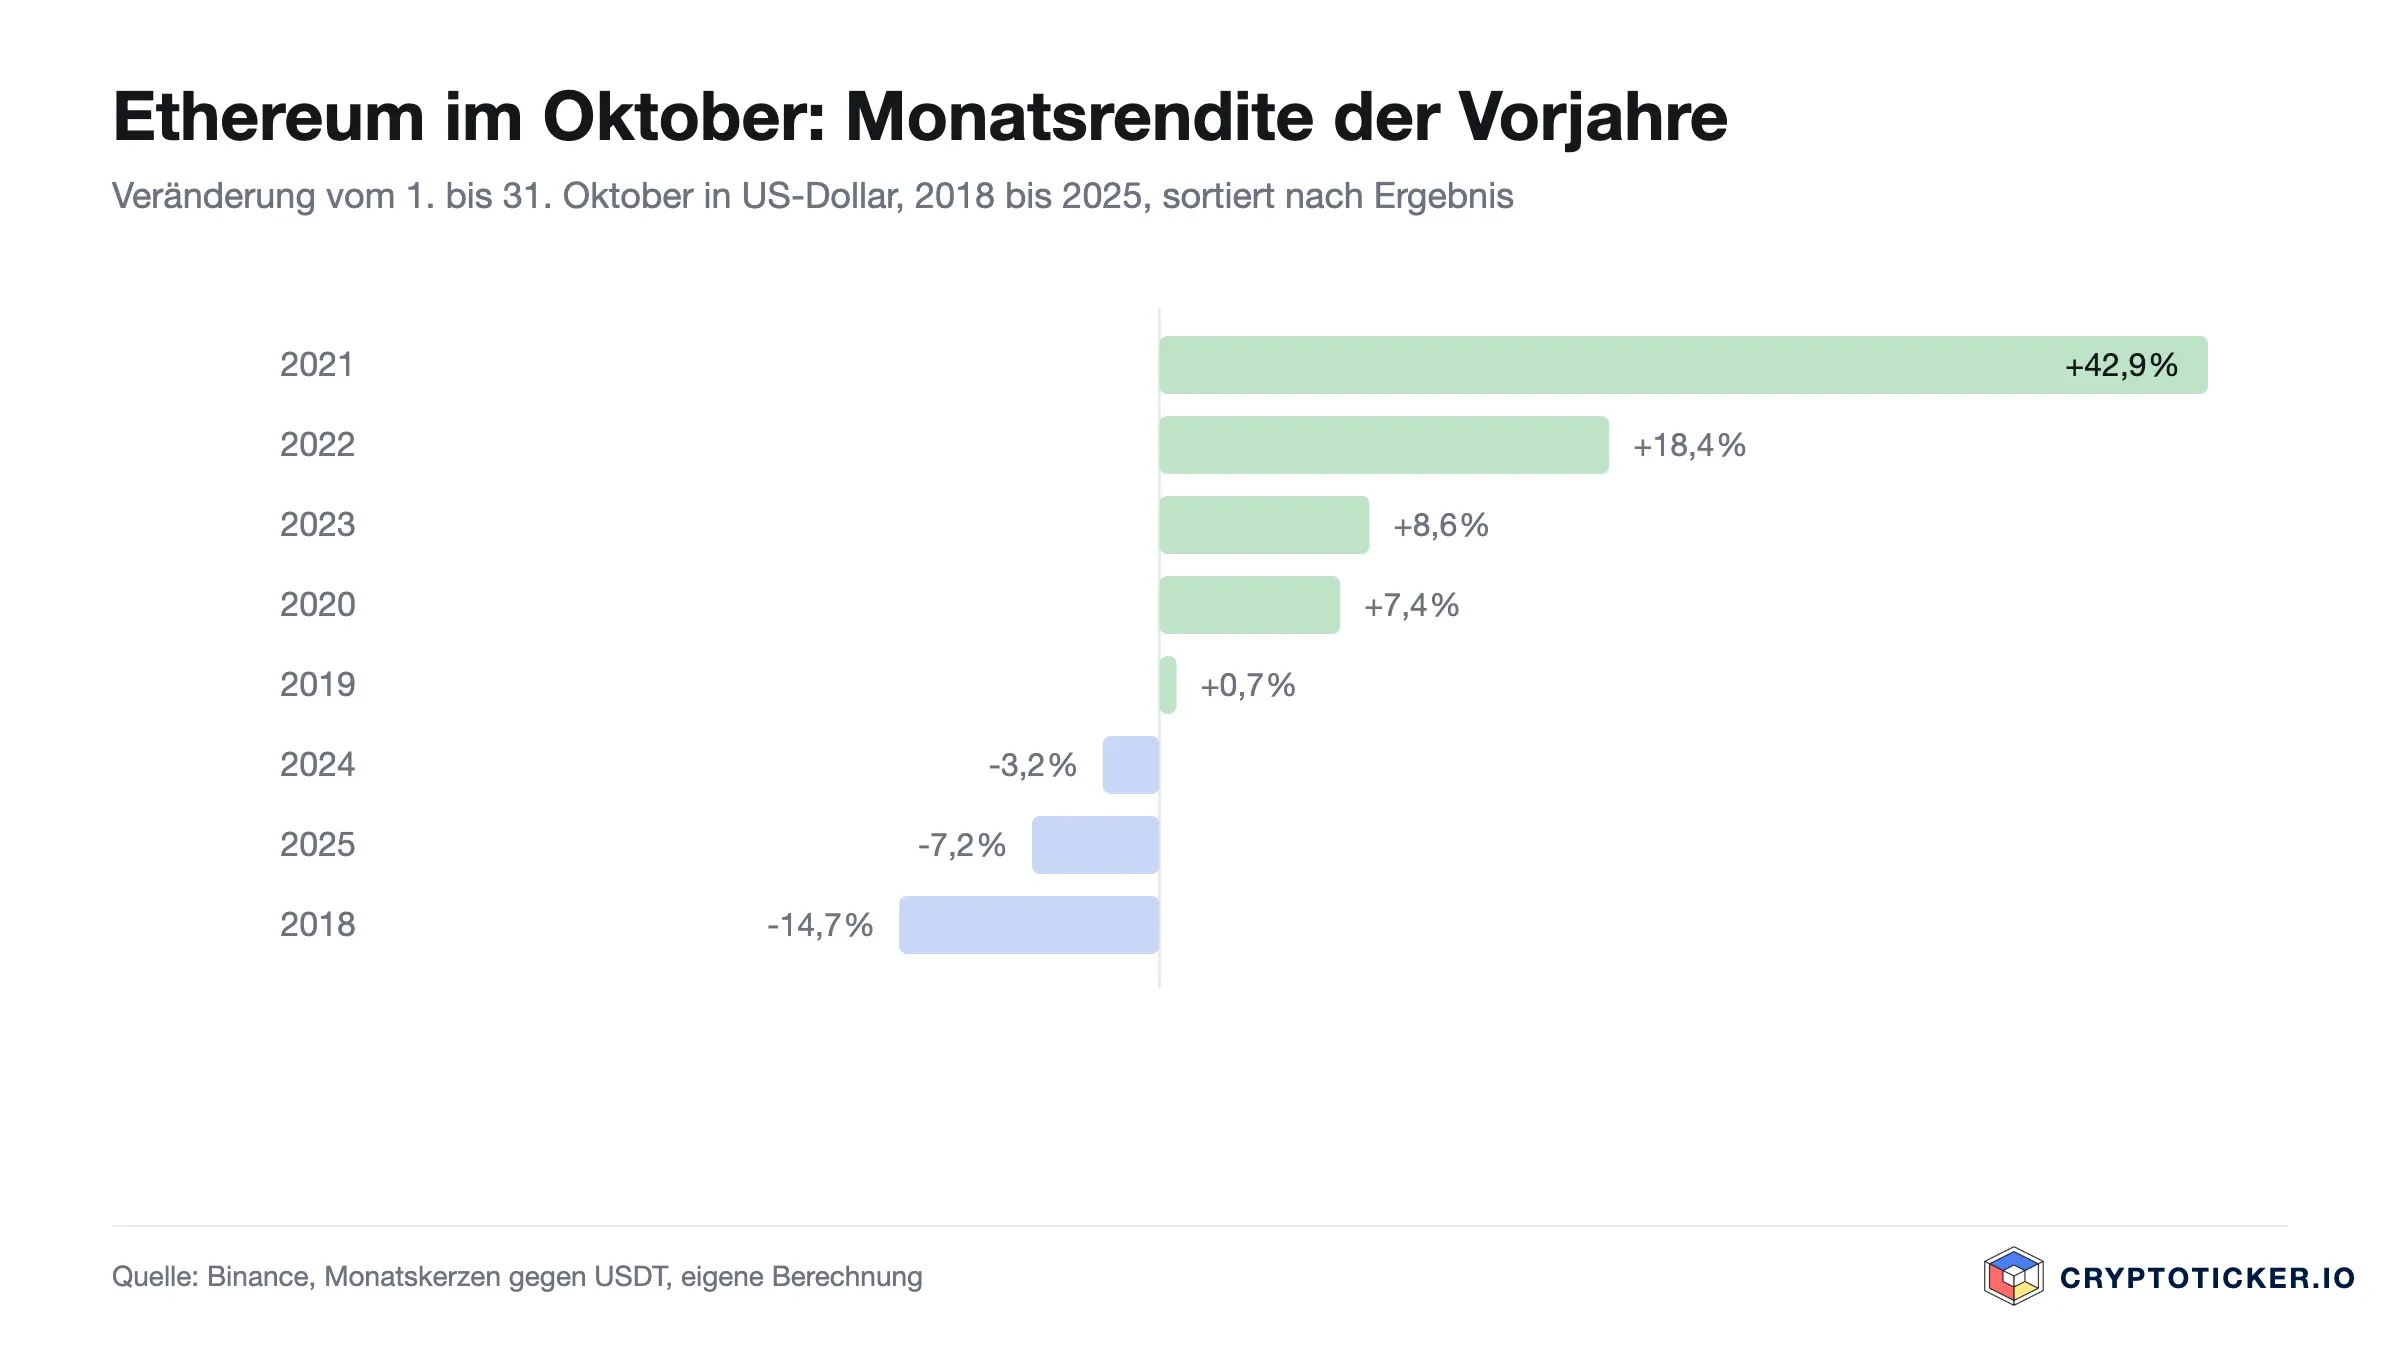
The order stands out: the two most recent Octobers both ended lower. Bitcoin, by contrast, has closed six of eight Octobers higher since 2018, as our October record for Bitcoin shows. The month owes its reputation above all to Bitcoin.

What is coming up for Ether in October 2026
On October 6 the Sepolia testnet moves to the next network version. Nothing changes for Ether on the main network that day, and according to the Ethereum Foundation a date for the main network has not yet been set, as we explained in our article on the Sepolia fork. A smooth test run is still the precondition for that main-network date moving closer.
Fund flows argue against a tailwind: the US spot ETFs on Ether lost money on three consecutive trading days at the end of September and on October 1, while the Bitcoin funds gained again. The figures are in our analysis of the ETF outflows.

Ethereum price prediction: the levels for October
Ether sits above its 50-day average (around $2,465) and its 200-day average (around $2,315), both calculated from CoinMarketCap daily closes. It is around 46 percent short of the record high of $4,946 set on August 24, 2025 (CoinGecko).
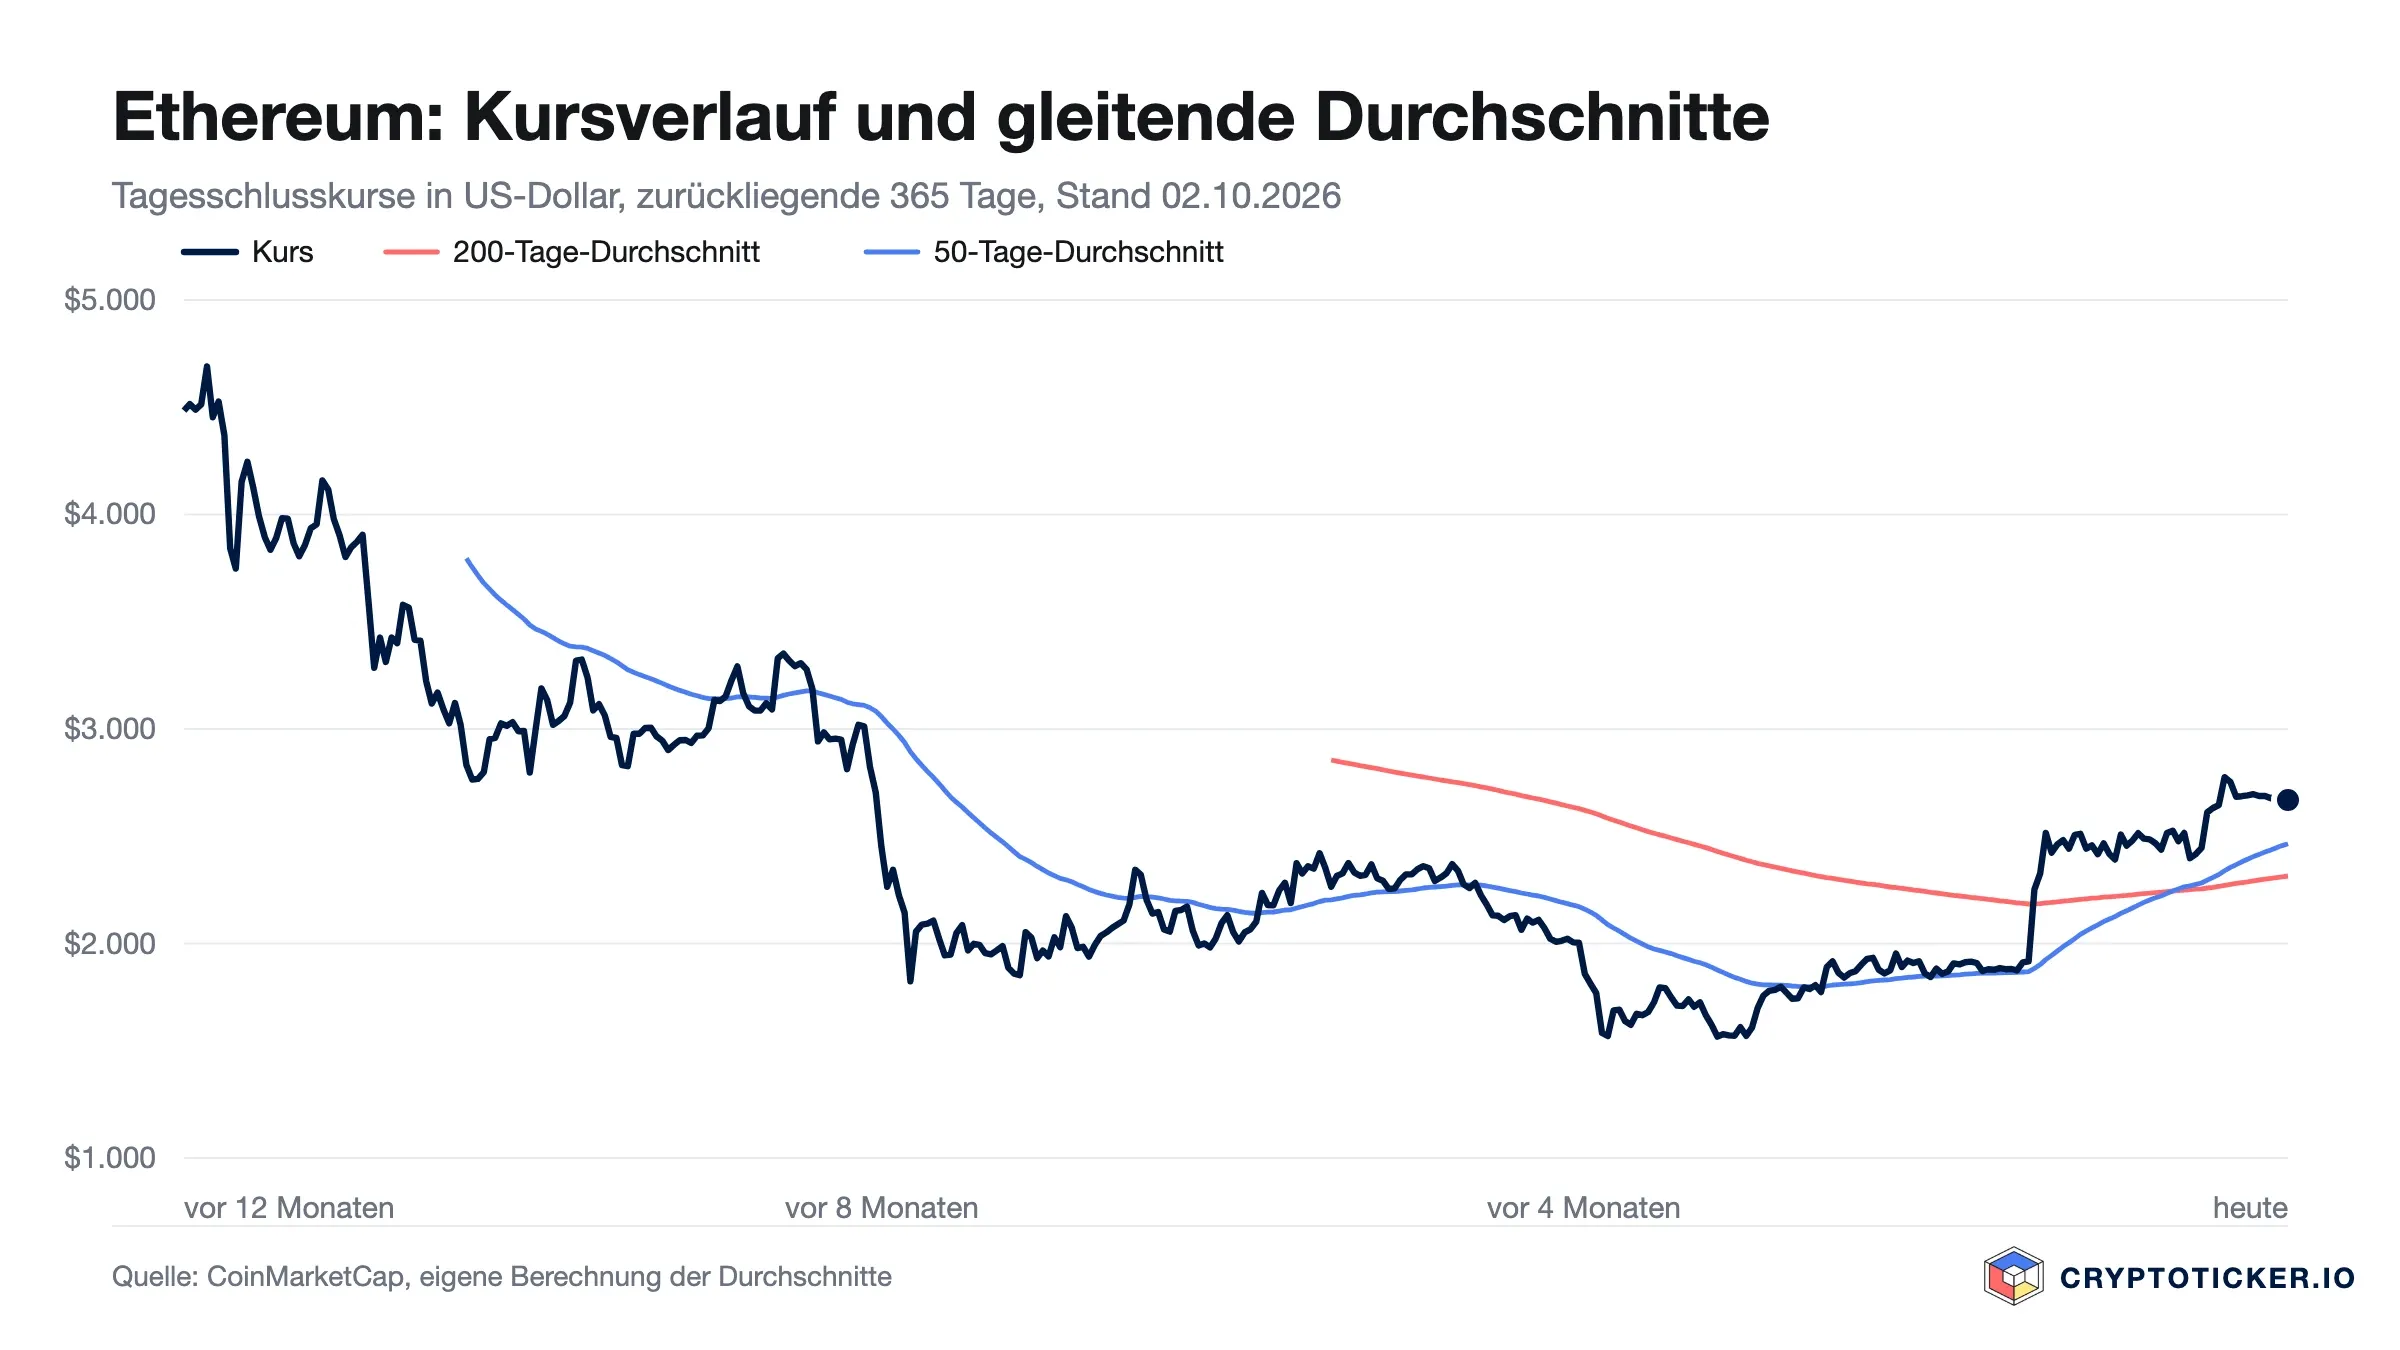
Since September 21 every daily close has fallen between $2,669 and $2,775. The upper level is therefore the first hurdle on the way up, and the lower support sits at $2,645, the close of September 20. October opened on Binance at $2,686, in the middle of that range.
Ethereum: your next three steps
First, do not read the October record as a promise. Five good Octobers stand against three poor ones, and the two most recent were poor. Second, watch the range between $2,645 and $2,775, as a daily close outside it is the next signal. Third, anyone holding Ether for the long term can stake the coins and earn a running return; providers and exit waiting times are set out in our comparison of staking providers.
Gains on Ether held for less than a year are taxable on sale in Germany once the annual allowance of €1,000 is exceeded. Crypto-assets fluctuate heavily and a total loss is possible. This article evaluates past price data; it is not a forecast and not a recommendation to buy or sell Ether.
If you hold Shiba Inu, there is no reason to act in haste today. The most important news of this weekend is still one worth working through once: on Friday, October 2, 2026, the Ethereum chain Blast announced that it is shutting down operations. The reasoning applies to every second layer in the Ethereum orbit, because the arithmetic is the same. On the same day, a developer at Shiba Inu answered the question of who actually settles the bill for Shibarium in two words. Taken together, the two events add up to a concrete task for you, and it has nothing to do with the chart. It has to do with which chain your tokens actually sit on.
The short answer first: your SHIB holdings are very probably not on Shibarium at all, but on Ethereum or with an exchange. In that case nothing changes for you today. Anyone who sent tokens across the Shibarium bridge over the past months in order to swap or play there has an open position on a chain whose funding currently rests publicly on one individual. That position is the one to look at today.
What happened on October 2: Blast winds down, a developer pays for Shibarium
In 2024 Blast was one of the largest second layers in the Ethereum orbit. According to Friday's statement, assets held on the chain have fallen 98 percent from a peak of around $2.2 billion in June 2024. The team writes that the economics of running the chain no longer make sense, that running costs exceed revenue, and that it sees no credible path to a sustainable operation. Users can still withdraw their funds through the familiar interface until October 26, 2026. After that the bridge contract on Ethereum remains the only route, which works technically but demands considerably more work of your own. The details are at CoinDesk, October 2.
A second layer, or layer 2, is a blockchain of its own that draws its security from a main chain such as Ethereum and writes transactions back there in batches. The appeal lies in the fees: on the second layer a transfer costs fractions of a cent. The catch lies in operations, because servers, data storage and publishing the data on Ethereum cost real money every day, whether or not anyone uses the chain.
That same Friday a user on X put the equivalent question to the Shiba Inu camp: who actually pays for the maintenance and further development of Shibarium? The developer Kaal Dhairya replied with the words “Yours truly”. The industry outlet U.Today reported the exchange on October 3. Dhairya named neither sums nor a plan for how the funding is meant to hold up over the long run. The statement is not an announcement of a shutdown and should not be read as one. It is a disclosure of how narrow this chain's funding base is at the moment.
Shibarium by the numbers: 1,804 transactions and 0.0154 percent network load on October 4
Rather than speculate, it is possible to measure the situation. The public statistics endpoint of the Shibarium explorer shibariumscan.io delivers the state of the chain in real time. A query this Sunday at 16:50 UTC produced the following picture: 1,804 transactions that day, a network load of 0.0154 percent, a gas price of 2.78 gwei and an average block time of around 5.0 seconds. Since launch the chain counts 612,982,618 transactions in total, 10,572,570 blocks and 263,237,202 addresses.
The most interesting figure follows from two of the others. For that day the explorer reports gas consumption of 159,774,955 units. Multiplied by the displayed gas price of 2.78 gwei, that works out to 0.4442 BONE in fees. BONE was quoted at $0.056634 at the same moment, according to CoinGecko. Total fees earned by Shibarium up to the afternoon therefore amount to roughly 2.5 US cents. That is a derived figure, not a line in a set of accounts, since it allows neither for rebates nor for distribution to validators. As an order of magnitude it still says everything: a chain that generates fees worth the price of a postage stamp in a day does not fund its own operation.
That makes the developer's answer easy to follow. There is simply no revenue side out of which servers, data publication and maintenance could be paid. Blast failed on exactly this calculation, only with larger numbers on both sides.
The arithmetic of a second layer: power, servers and data publication cost money every day
A second layer has three large cost blocks. The first is running the nodes that accept transactions and build blocks. The second is publishing the data on Ethereum, because without that data nobody could independently verify the state of the chain. The third is development itself, meaning people who fix bugs and maintain contracts. Only the first block can be kept small when usage is low. The second continues as long as the chain produces blocks.
For you as a holder one point is decisive, and it is often confused. The risk of a thinly funded second layer is as a rule not a total loss of your tokens. The value sits in the bridge contract on Ethereum. The risk is access: if the interface is switched off, the operator becomes unreachable or the nodes stand still, you need technical knowledge and patience to get at your funds. That is precisely why Blast is setting a deadline of October 26 and pointing to the contract route after that.

Your SHIB sits on Ethereum, not on Shibarium: the difference in practice
The most common error this week is the belief that SHIB is a Shibarium token. That is wrong. The Shiba Inu contract sits on Ethereum, at the address 0x95ad61b0a150d79219dcf64e1e6cc01f0b64c4ce. Anyone holding SHIB at an exchange or in a wallet on Ethereum is technically untouched by the funding question around Shibarium. Shibarium is an additional chain belonging to the same project, one that tokens can be bridged to, and BONE is the fee currency there.
The check is therefore quickly done. Open your wallet and look at which network is selected when a SHIB or BONE balance is displayed. If it says Ethereum Mainnet, the balance sits on the main chain. If it says Shibarium, you hold a bridged balance. At an exchange the same applies in substance: there the balance sits in the provider's internal ledger, and the network only becomes relevant at withdrawal. A glance at the withdrawal dialogue shows you which networks the provider offers at all.
The Shibarium bridge according to the official documentation: 30 minutes and one hour
If you have found a bridged balance, it pays to look at the figures the project itself quotes. The bridge documentation lists two routes. Via the so-called PoS bridge, a withdrawal from Shibarium to Ethereum takes around 30 minutes according to the project, and via the Plasma bridge around one hour. Technically the tokens are burned on Shibarium and released again on Ethereum. The same source describes the Plasma variant as more rigid and less flexible.
These times are project figures, not a guarantee. For your planning they still mean something solid: a withdrawal is a matter of hours, not weeks. So you do not have to move everything tonight. You should know that you can, and you should keep the necessary fees ready on Ethereum, because the release on the main chain costs ETH. Without ETH in the account the final step cannot be carried out, and that is where most withdrawals come to grief.
What a withdrawal costs in fees
Reckon roughly with two transactions on Ethereum, a release and a completion. When the network is quiet the cost runs to single-digit euros, and considerably higher when it is busy. Compare that amount honestly with the value of your bridged balance. Where the sums involved are a few euros, it can be more economical to leave the position where it is and write off the loss rather than pay fees of a similar size. Nobody can make that judgement for you, as it depends entirely on your own figures.
Crypto custody in Germany: exchange, software wallet or hardware wallet in daily use
The second question raised by this occasion is custody. Anyone with tokens sitting on a third-party chain or with a provider depends on that party continuing to exist. Anyone holding their own keys carries the responsibility for them. Both have a price, and there is no variant that suits everybody.
A software wallet on your phone is convenient and usable for small amounts; the common programs differ above all in how they secure the recovery words. From amounts whose loss would hurt, the key belongs on a device that has never been connected to the internet; which models manage that and what they cost is set out in the hardware wallet comparison. Anyone who trades regularly and does not want to manage keys stays with a provider and should at least set up two-factor authentication and a withdrawal address list.
One note that gets lost in every migration: write the recovery words down on paper or metal and never in a photo album or a notes app. The words are the key itself. Storing them digitally reduces the security of the wallet to the security of your phone.

Buying under MiCA: the obligations a crypto exchange in Germany has carried since 2026
For the purchase route, Germany has had a clear framework since the European regulation on markets in crypto-assets took full effect. Providers that arrange or hold crypto-assets for retail clients need authorisation and are subject to supervision. For you that means checking before a purchase whether the provider is authorised in the EU and which authority supervises it. The obligations behind that range from capital requirements through the segregation of client assets to the duty to handle complaints in an orderly way. A selection of authorised venues with their respective fees is set out in the crypto exchange comparison.
In practice, with a secondary asset such as SHIB this means one thing above all: not every authorised provider lists every token, and at small venues the spread between buying and selling price is often dearer than the stated fee. Compare the amount you actually receive rather than the percentage in the price list.
Holding period and transfers: what moving between your own wallets triggers for tax
A withdrawal from a second layer regularly raises the question of whether the tax office is reading along. The baseline in Germany has been the same for years: gains from the sale of crypto-assets held as private assets remain tax free if more than one year lies between acquisition and disposal. A transfer between two wallets that both belong to you is not a sale and therefore does not trigger a disposal. The holding period continues to run.
Care is needed where a transfer technically runs through a swap, for instance when a token is converted into another form while bridging. A taxable event can then arise. So document every step with date, amount and transaction hash. That costs five minutes and spares you a reconstruction from memory if it ever comes to that. This paragraph is not binding advice; with larger sums the case belongs with a tax adviser.
The figures for the record: SHIB, BONE and the distance to the record high
For context, the values standing at CoinGecko at 16:43 UTC on Sunday afternoon. SHIB was quoted at $0.00000572, the equivalent of €0.00000508, on a market capitalisation of around $3.37 billion and in 35th place in the overall market. Supply in circulation stands at 589,238,857,696,030 tokens. The distance to the record high of October 27, 2021, then $0.00008616, comes to 93.35 percent. BONE stood at $0.056634.
These figures are a snapshot of one Sunday and change by the hour. For the question in this article they are still useful, because they fix the order of magnitude: the fee stream of a chain with 1,804 transactions a day bears no relation to the market capitalisation of the associated token. Anyone who wants to judge the future of Shibarium should look at usage rather than at valuation.
What other second layers take from the end of Blast
Blast is not the first case, but so far the largest, in which a second layer ceases operations for economic reasons. For the market that is a normalisation. In 2023 and 2024 dozens of such chains came into being, often carried by incentive programmes that drew users in for a short while. When those programmes expire, what remains is the usage a project really has. With Blast that turned out in the end to be too little.
For Shibarium it means neither reassurance nor alarm. The chain is running, produces blocks on a five-second cadence and is used by its own ecosystem, if on a very small scale. The open question is funding, and the developer's answer of October 2 has made it public rather than answered it. A project whose infrastructure hangs on a private individual carries a concentration risk. That is a sober observation and not an accusation.
Shibarium and your tokens: what to take away
- Establish the network. Open your wallet and read off which network your SHIB or BONE balance sits on. Ethereum Mainnet means no action is needed. If it says Shibarium, go on to step two. If everything is with a provider, look in the withdrawal dialogue to see which networks are offered; which wallet programs display the network cleanly is set out in the software wallet comparison.
- Prepare the way back without rushing it. Put ETH aside for the fees on Ethereum and weigh the cost against the value of your bridged balance. According to the project, the route back takes 30 minutes via the PoS bridge and around one hour via the Plasma bridge. Where to top up ETH at the lowest fees is shown by the crypto exchange comparison. Then decide whether the withdrawal is worth it.
- Set custody up cleanly. Decide which part of your holdings stays with a provider and which part moves onto a device of your own. The devices and their prices are listed in the hardware wallet comparison. Write the recovery words down in analogue form and keep them separate from the device.
(As of October 4, 2026. This article is not investment advice. Prices and fee structures change; check the terms with the provider before you buy.)
On Monday, October 5, 2026, a network forks at Monero. What it affects is not the main network where your XMR sits: a separate test network forks, one the developers call a stressnet. Anyone holding Monero therefore has nothing to do on that day: no wallet action, no withdrawal from an exchange, no swapping. The changeover this test is working towards is nonetheless the most far-reaching alteration to Monero's privacy in years, and it still has no date for the main network.
That separation is the whole core of the story. There is a hard, documented date, and it concerns a test environment. And there is a rebuild with an open date that decides how anonymous Monero will be in a few years and how exchanges in the EU will deal with it. This article sorts the two apart and tells you which of them concerns your coins.
What forks on October 5: the beta stressnet, not the Monero mainnet
The developer team behind the changeover released version v0.19.0.0-beta.3.0 on Friday, September 25, 2026, the so-called FCMP++ and Carrot beta stressnet v3.0. According to the developers, this package forks away from its previous test network on October 5, 2026 at block height 3102800.
A stressnet is a deliberately loaded test network. It exists to bombard a protocol with more transactions, more data and more participants than everyday use would produce, and to see where it breaks. The coins in it have no value, the blockchain in it is not Monero's, and a fork there changes nothing about the main network.
The distinction matters because news headlines about this date often say only "Monero hard fork on October 5". To a holder that sounds like a network changeover with pressure to act, of the kind Monero used to have roughly every six months. This time it is a test run in which volunteer node operators take part.
Monero price at around 550 dollars: weekly high 563.50, weekly low 525
The Monero price stands at around $550 at midday on Sunday. Over the week barely anything has moved: the gain across seven days is about 0.4 percent, according to data from CoinPaprika. Within that week there was room enough. XMR marked the weekly high on October 3 at $563.50 and the weekly low on September 28 at $525, measured on Kraken's daily candles. A good 7 percent lies between those two points.
By market capitalisation Monero is thereby the fourteenth-largest cryptocurrency. From its own record, which XMR reached in January 2026, the price is around 31 percent away. That is remarkably little for a coin the large regulated trading venues in Europe have not listed for years.
The fork date itself has not shown up in the price, and that is consistent: a test network yields no returns and changes no supply. Anyone who looked for a reaction to the announcement this week finds none.
FCMP++ explained: from 16 decoys to the whole blockchain
FCMP++ stands for Full-Chain Membership Proofs. It is a cryptographic procedure with which a sender proves that the amount being spent comes from a particular set of earlier incoming payments, without revealing which one exactly.
Today Monero works with ring signatures. When you send XMR, your wallet mixes the incoming payment actually used with fifteen others from the blockchain. An observer sees sixteen possible origins and cannot say which of them is the real one. That size of sixteen has been the standard for years and is at the same time the known weak point: anyone collecting enough additional knowledge can rule out candidates and narrow the circle.
FCMP++ replaces that small ring with a proof against the entire chain history. Instead of one of sixteen, an output is in future meant to be one among more than 150 million, that is, among practically all the payment outputs Monero has ever created. The additional knowledge with which investigators shrink rings today thereby loses its point of attack, because there is nothing left to shrink.
Carrot: what the addressing protocol changes for existing Monero addresses
Carrot is the second building block of the package and concerns how Monero addresses are constructed. It is a new addressing protocol which, according to the developers, brings additional properties in security, privacy and usability while remaining backward compatible with existing addresses.
Backward compatible here means: an address you have deposited somewhere today, say with a service that pays out XMR to you, is meant to keep working after the changeover. For holders that is the reassuring news at this point, because exchanging receiving addresses across several services is one of the most error-prone operations there is.

Stressnet v3.0 in detail: hot-cold wallets, Transaction Relay v2 and RandomX v2
Version v3.0 brings, according to the release notes, three notable additions into the test. First, support for hot-cold wallet set-ups, in which a wallet without access to the spend keys prepares transactions and a separate device never connected to the network signs them. That is the procedure hardware wallets also work with, and its availability helps decide whether devices will follow the changeover later.
Second, larger improvements to the Transaction Relay v2 protocol, that is, to the way transactions are passed on between nodes. Third, support for RandomX v2, the reworked mining algorithm. Added to that are fixes from the previous stressnet version and the current state of Monero's main branch.
That hot-cold support is entering the test precisely now is the practically most relevant detail of the whole package. It is the point at which it is decided whether you will still be able to keep your coins on a separate device after a later mainnet changeover, or whether you will have to wait for new firmware.
Why the official roadmap names no mainnet date
On the project roadmap at getmonero.org FCMP++ appears under "Full-Chain Membership Proofs" in the section of upcoming work, together with the Seraphis codebase and Jamtis. There is no date there, no version number either, and Carrot is not listed at all.
That is not an omission but the way the project works. Monero has no company, no board and no venture capitalist's treasury in the background that could enforce a delivery date. Changeovers arise in open developer meetings and are released when audits and tests are finished. The stressnet fork on October 5 is a step in that procedure, not the announcement of a launch.
For you that means: a mainnet activation of FCMP++ may come in months, it may also slip beyond a year. Anyone wanting to draw consequences from the technology now is drawing them from an intention, not from a timetable. Figures attached to a date nobody has named are, at this point, invention.
The delisting wave: how MiCA and the anti-money-laundering regulation pushed Monero out of EU order books
While work goes on at the protocol, the trading venue for Monero in Europe has shrunk over the years. Binance took XMR off its European offering in February 2024, Bitpanda in the same year, Bitvavo in 2025. Kraken ended support for Monero in the European Economic Area and, after the deadline passed, converted remaining balances that had not been withdrawn into Bitcoin.
The counts across all trading venues diverge depending on the cut-off date. Industry counts name around 73 exchanges that have delisted or restricted Monero, against roughly 51 in 2023; which month exactly is meant varies between sources. The direction is unambiguous, the exact figure you should not read as a fixed value.
The reason lies in three sets of rules that work together. The provisions for crypto service providers under MiCA require an authorised exchange to be able to trace the origin and destination of funds. The EU anti-money-laundering regulation AMLR tightens that further for anonymity-enhancing assets. And the FATF travel rule requires sender and recipient data to be supplied with transfers. A coin whose protocol necessarily conceals origin and amount cannot be reconciled with those duties.
Worth noting is the separation between trading and ownership. Owning and using Monero is legal in Germany; there is no ban. What is regulated are the service providers, not the holders. That is exactly why the wave hits the buying route and not the holding in your own wallet.
Buying Monero in Germany: which routes remain after the delistings
For a purchase out of Germany the situation is uncomfortable. The large MiCA-authorised providers through which trading usually happens here do not list XMR. Anyone looking for Monero ends up at trading venues outside EU authorisation, at decentralised exchanges, or at atomic swaps, where Bitcoin is bought first and then swapped.
As remaining centralised trading venues with XMR pairs, industry overviews name KuCoin, MEXC, Gate.io, the small TradeOgre and Kraken outside the EEA. Each of those routes brings its own drawbacks: no MiCA authorisation for the German market, no access to a German complaints body, and, in the event of insolvency or a hack, a legal position you can hardly assess beforehand. If you want to compare how regulated providers in Germany work, a look at our comparison of crypto exchanges helps, even though you will not find XMR there.
The sober sentence on this is: with Monero today the buying route is the part carrying the greatest risk, not the technology. The protocol works and is being extended. The question of which third party you get the coin through and how well you are protected there is the harder one.

Liquidity and spread: what a shrunken market means for your execution
When order books fall away, the same trading spreads across fewer venues. Daily turnover at Kraken was in the range of four to nine thousand XMR per day this week. That is tradeable, but it is not a depth in which a large order disappears without trace.
In practice that means two things. First, the difference between the buy and the sell price is felt faster with Monero than with Bitcoin or Ether, especially at weekends and in the quiet hours. Second, a single larger sale moves the price more. The 7 percent gap between the weekly low and the weekly high arose without any news at all; that is an indication of how thin the book is in stretches.
Anyone buying through a market order pays that difference immediately. A limit order you set yourself takes the surprise away, and with it the certainty that it will be filled.
Custody and wallet version: what to check now
From the stressnet fork no task follows for your mainnet balance. From the direction in which the rebuild is running, one does. Monero regularly requires up-to-date wallet software at network changeovers, and FCMP++ reaches deeper into the transaction structure than the changeovers of past years.
It therefore makes sense to know now what you are holding custody with. Are you running a wallet that still receives updates? Does your balance sit on a hardware device whose manufacturer still maintains Monero? Do you have a working backup of your recovery phrase, kept separately from the device? Those three points decide whether a future changeover is an update for you or a problem. Which devices support Monero and how they differ in handling and price is set out in our hardware wallet comparison.
The second point concerns coins sitting with a third party. Holding Monero on an exchange that one day delists XMR is the pattern that has produced the same deadlines again and again over past years: trading halt, then withdrawal deadline, then forced conversion into Bitcoin. Anyone moving early into their own custody decides the timing themselves.
Leverage and liquidation: 20 percent of distance at fivefold leverage
Part of the fork is a point that has nothing to do with Monero in particular. Around dated protocol events, volatility rises with many coins, even when the event has, as here, no economic substance at all. Anyone holding XMR with leverage will not be liquidated by the event itself, but may well be by the movement that expectations around it produce.
With a coin that has a thin book this effect is larger. A position at fivefold leverage sits, at a price of around $550, arithmetically some 20 percent away from its liquidation, and 20 percent is historically no great distance with Monero. This week's range alone already covered a third of it.
Tax and holding period: what applies to swapping XMR in Germany
For holders liable to tax in Germany, the one-year period applies to crypto assets as a private disposal: anyone holding longer than a year disposes tax-free under the law as it stands, and below that taxation applies above a threshold. Important for Monero in particular: a swap is a disposal. If you swap XMR into Bitcoin through an atomic swap, or an exchange itself converts your remaining balance into Bitcoin after a deadline, that triggers the same event as a sale.
With anonymity-enhancing assets that is the awkward spot, because the burden of proof lies with you, and a protocol that conceals amounts produces no convenient history for the tax office. Anyone holding XMR should document acquisition dates and acquisition costs themselves rather than rely on being able to reconstruct them later. Tools that keep such records can be found in our overview of crypto tax software. Worth noting is that tax law for crypto assets is currently being worked on; what applies today need not still apply next year.
Levels above and below: 563.50 dollars and the 525 zone
The two ends of this week serve as points of observation. Above sits the weekly high at $563.50, reached on October 3; beyond it begins the area in which the price last traded at the end of September. Below, the weekly low at $525 marks the point at which buyers stepped in on September 28, and beneath that the round level at $500.
These are observations, not targets and not a recommendation. Those two levels say nothing about where the price is heading; they only record where trading actually took place over the past days. In a market of this depth, each of those levels can be run through in a single day.
Monero and FCMP++: What to take away
- October 5 is none of your business as a holder. A test network forks, and your mainnet balance stays untouched. For the main network there is no announced date, and FCMP++ has so far entered the project's roadmap only as a plan without a date.
- Put your custody in order while no deadline is pressing. Maintained wallet software, a device whose manufacturer still supports Monero, and a separately stored backup are the work that should be done before a changeover. The hardware wallet comparison shows which devices come into question for it.
- Treat the buying route as your greatest risk, not the technology. XMR is not to be had at the providers authorised in Germany, and every detour costs protection. Anyone wanting to check how regulated trading works will find the criteria in the exchange comparison.
(As of October 4, 2026. This article is not investment advice. Prices and fee structures change; check the terms with the provider before you buy.)
For any Dogecoin price prediction the ETF channel is the most quoted and the least load-bearing figure there is. The Grayscale Dogecoin Trust, by far the largest of these funds, last held $14.11 million in net assets against $16.34 million in cumulative net inflows. The market capitalisation of Dogecoin stood at $14.63 billion on Sunday afternoon. The largest fund therefore holds 0.097 percent of the coin it tracks.
From that follows an uncomfortable insight for anyone reading inflow reports as a buy signal: a number that sits below one thousandth of the market can barely move the price arithmetically. This article works through the ratio, puts the wind-down of the Bitwise fund in context, and shows which figures actually turn the result for investors in Germany.
Dogecoin price prediction in brief: the ETF channel carries one thousandth of market capitalisation
DOGE traded at $0.09368 and €0.0831 in the early afternoon of Sunday, October 4, 2026. That is 0.63 percent more than the previous day, 4.6 percent less than a week ago and 10.0 percent more than thirty days ago. The figures come from the CoinGecko market data query for the same hour.
The term ETF channel in this article means the sum of all exchange-traded products that back Dogecoin physically and publish their inflows and outflows daily. In the United States there are currently three providers. Their combined weight can be read off a single calculation.
Dogecoin's market capitalisation is $14.63 billion on 156.18 billion coins in circulation. The largest fund holds $14.11 million. The ratio is 0.097 percent. For comparison, and this comparison is the core of the prediction: on Friday, October 3 alone, Dogecoin worth $854 million changed hands according to market data. The entire fund holding equals 1.7 percent of a single trading day.
Dogecoin ETF holdings: 14.11 million dollars sit with a single provider
The inflows of the past week show the same picture from another direction. According to data from the analysis house SoSoValue, which 24/7 Wall St. evaluated on October 4, 2026, the funds on Dogecoin, Litecoin and Hedera took in less than $10 million combined in the week from September 28 to October 2. Three coins, five trading days, under $10 million.
The daily movements within that week explain why no trend comes of it. On September 29 the Dogecoin funds received $879,000 in inflows. A day later investors withdrew $551,430. On October 1 and 2 the statistics reported no movements worth naming. An inflow of which two thirds leave again the following day is not a demand signal but noise in a very small pot.
The monthly picture looks friendlier but stays small. September 2026 brought the Dogecoin funds $3.71 million in net inflows, the highest monthly figure since January 2026. By far the greater part of it went to the Grayscale trust, while the products from 21Shares recorded outflows of $593,000 over the same period.
A glance at another asset class makes the order of magnitude tangible. The funds on Chainlink collected $8.3 million in the same week and manage around $230 million. The Litecoin products come to roughly $14.7 million, those on Hedera to around $80 million. Dogecoin sits, despite its fame, at the lower end of that row.

One week of inflows, one trading day of turnover: 854 million dollars change hands
Put the two numbers side by side. The weekly inflow of all three coin families came to less than $10 million. The trading turnover in Dogecoin alone stood at $854 million on October 3 and at a daily average of $381 million on October 4. The complete weekly inflow of three asset classes therefore equals roughly 1.2 percent of what is turned over in DOGE alone on a single day.
Prices arise where supply meets demand, and for Dogecoin that is the spot market at the trading venues. Anyone wanting to know where the price comes from looks at order book depth and trading volume, not at a fund statistic whose daily amounts run in six figures. The analysis by 24/7 Wall St. puts the same result in one sentence: small altcoin funds have no meaningful influence on prices because their inflows are too low and too erratic.
That does not mean the products are meaningless. The funds give institutional investors a regulated route of access, and over the years they build a custody structure that did not exist before. For a price prediction over the coming weeks, however, they are too small as a driver, and every prediction built on them rests on very thin foundations.
The BWOW wind-down plan fixes October 14 and October 22
One concrete deadline stands in the October calendar. Bitwise Investment Advisers resolved on September 10, 2026 to liquidate the Bitwise Dogecoin ETF, which is listed under the ticker BWOW on NYSE Arca. The last trading day is Wednesday, October 14, 2026. Until the close of that day shareholders can sell their units on the exchange.
After that a fixed sequence runs. On October 14 the Dogecoin held is converted into cash. Before trading opens on October 15 the issue of new units ends. On Thursday, October 22, the remaining shareholders receive the net asset value of their units as of October 21 as a cash payment.
The size of the fund explains the step. BWOW started in November 2025 with around $3 million in trading volume and came, over its entire life, to net outflows of $1.23 million. Most recently the fund managed $801,400. Bitwise justifies the closure by saying the product range is continuously adapted to demand. We broke down the details of this wind-down in a separate article on cryptoticker.io on October 2, 2026.
For the prediction the process is less dramatic than the headline sounds. A fund with $801,400 converting its holding into cash sells Dogecoin worth less than one thousandth of daily turnover. The wind-down day is a date in the calendar, not a supply shock.
14.4 million new DOGE a day: the supply side of the Dogecoin price prediction
Anyone dismissing the demand side as too small has to count the supply side in honestly. Dogecoin knows no halving. Since 2015 the protocol has paid out an unchanged 10,000 DOGE per block, and a block arises on average every minute. That gives 14.4 million new coins a day and 5.256 billion a year.
At the current price of $0.09368 the daily issuance equals a value of around $1.35 million. In September some 432 million DOGE worth a good $40 million came to market by that route. Against it stood $3.71 million in fund inflows. In the best month of the year the ETF channel therefore absorbed barely 9 percent of the newly created supply.
The percentage expansion of supply falls from year to year because the denominator grows. At 156.18 billion coins in circulation the annual rate currently stands at 3.37 percent. Five years ago it was noticeably higher; in five years it will be below 3 percent. That is the slow, calculable part of the Dogecoin price prediction, and it works more reliably than any inflow report.
Dogecoin price in euros: 0.0831 euros and 86.2 percent below the 2021 record
For you as an investor in Germany the dollar price is only half the calculation. In euros DOGE traded at €0.0831 on Sunday afternoon. The all-time high of May 7, 2021 was €0.601466, so the current price is 86.2 percent below it. In dollars the distance to the record of $0.731578 is 87.2 percent.
The difference of one percentage point comes from the exchange rate and is a good example of why you should calculate your position in the currency in which you pay tax on it. Anyone noting entry prices in dollars and filing a tax return in euros builds in a source of error that reappears at every disposal.
Over the month DOGE is up 10.0 percent, over the week down 4.6 percent. The coin has thus lately run weaker than the broad market, while the fund inflows had their best month since January over the same period. That divergence too argues against the ETF channel as an explanation for how the price is formed.

The ETF channel as a price signal: where its explanatory power ends
An inflow figure works as a signal when it is large enough to tie up supply and steady enough to form a trend. Neither is the case with Dogecoin. A daily figure of $879,000 equals, at the current price, around 9.4 million DOGE and therefore two thirds of what the protocol newly creates on the same day.
There is a threshold at which that would change. For the funds to absorb the daily new supply in full, they would have to collect around $1.35 million a day on a lasting basis, that is roughly $40 million a month. The best month of the year brought $3.71 million. A factor of eleven is missing up to that threshold.
That factor is the actual yardstick you can keep an eye on. If monthly net inflows rise above $40 million and hold that level for several months, the channel becomes a figure that belongs in a prediction. As long as it sits a double-digit multiple below it, it is a footnote.
A one-year holding period and the 1,000 euro threshold for DOGE gains
The lever with the greatest effect on your result lies not in the market but in tax law. Gains from the sale of crypto assets count in Germany among private disposals under section 23 of the Income Tax Act. If more than twelve months lie between acquisition and sale, the gain stays tax-free.
Below that period a threshold of 1,000 euros per calendar year applies, raised with effect from the 2024 assessment period. Threshold means this: if the sum of all private disposal gains in a year reaches 1,000 euros or more, the entire amount is taxable and not only the excess part. At a gain of 999 euros you pay nothing; at 1,001 euros you pay tax on 1,001 euros at your personal rate.
From that follows a concrete check you can carry out today. Look into your transaction history and note the acquisition date for every DOGE position. Positions bought before October 4, 2025 are tax-free on a sale today. Positions from the current year fall under the threshold, and whether you dispose of them before or after the turn of the year decides in which year the gain counts. A portfolio tracker with a tax report for the German market takes the allocation under the FIFO method off your hands.
Buying route under MiCA: spot market, ETP or direct custody
The American spot ETFs whose inflows this article revolves around are in practice not accessible to you as a retail investor in Germany. Those funds lack the key information document required by the PRIIP regulation, which European brokers demand for distribution to retail clients. So you read their flow figures as a market indicator but as a rule do not buy them.
In practice two routes remain. The first runs through a trading platform authorised under the European regulation on markets in crypto-assets, which has applied in full since the end of 2024. Our overview of regulated trading venues for the German market shows which providers hold a permission and how their fee models are built. The second route runs through an exchange-traded product in a European wrapper that you buy in an ordinary securities account.
With the European wrapper it is worth looking at the ongoing fee. We worked through this cost side on October 3, 2026 in a separate analysis of the ETP fee and the holding period on cryptoticker.io. For placing these products in a securities account in general, our overview of crypto ETFs and ETPs in Germany applies, which also keeps the tax treatment of the different wrappers apart.
Anyone buying directly and holding custody themselves loses the convenience of the securities account and gains control over the keys. For amounts you want to hold over years, a hardware solution is the safer route, because the private key never leaves the device.
Levels above and below: 0.0878 dollars on the moving average, 0.10 dollars as the ceiling
Two price areas structure the coming weeks. Below sits the 200-day average at $0.0878, around 6 percent under the current price. A moving average is the mean of the closing prices of the last 200 days in each case and serves as a rough dividing line between a medium-term uptrend and downtrend.
Above stands the round level of $0.10. That threshold is psychologically charged and was, over the past weeks, repeatedly the point at which the price turned. Between the two lines lies a range of a good 13 percent, within which DOGE has been moving for weeks.
A prediction that leaves this range needs a trigger outside the ETF channel, because its order of magnitude demonstrably does not suffice for that. Candidates are a move in the overall market, a protocol event, or an inflow of institutional size that bridges at least the factor of eleven named above.
Dogecoin price prediction: How to proceed now
- Put inflow reports in context instead of taking them at face value. Set every headline about fund inflows against the daily turnover of lately $381 million to $854 million. Anything under $40 million a month is a marginal figure for how the price is formed. Where to get reliable market data in euros for that is shown by the overview of regulated trading venues.
- Sort your acquisition dates before the turn of the year. Check which positions have already passed the twelve-month period under section 23 EStG and which gains of the current year together push against the 1,000 euro threshold. A tax tool with FIFO allocation works that out for the German assessment period.
- Match custody to the holding duration. What you want to hold beyond the one-year period does not belong permanently in a trading account. Which devices keep the private key offline and what they cost is in the hardware wallet comparison.
(As of October 4, 2026. This article is not investment advice. Prices and fee structures change; check the terms with the provider before you buy.)
Decrypt
President Trump named a new "Super Intelligence Force" to coordinate federal AI policy, with Director of National Intelligence Jay Clayton at the helm. As SEC chair, Clayton launched crypto lawsuits including the agency's case against Ripple.
The Independent Community Bankers of America argues the OCC's national trust charters give crypto firms a "side door into the banking system" without the safeguards that bind traditional banks.
Spot Bitcoin ETFs took in $134.4 million over the first two trading days of October, rebounding from a Sept. 30 outflow as a weak jobs report cooled Fed rate-hike bets.
Near Intents said the roughly $3.8 million drained in an exploit on Thursday was returned in full, a day after the team said it had identified the attacker and gave them 48 hours to return the funds.
The firm says the Sept. 24 breach pushed North Korea's 2026 crypto haul past $1 billion, and detailed how it used in-house AI to trace the stolen funds across four blockchains in a race against the attackers.
U.Today - IT, AI and Fintech Daily News for You Today
Shiba Inu (SHIB) has expanded to Solana through Wormhole Labs-powered Sunrise.
XRP traps price in a tight 4-hour triangle under $1.53 resistance as largest holders pause all market activity.
Dogecoin bulls have one key level to clear as compression builds.
Ethereum creator Vitalik Buterin tests three-layer privacy model for frontier AI.
As MSTR trades at a 14% premium, Michael Saylor hints at a massive new Bitcoin maneuver for Strategy.
Blockonomi
TLDR:
- Horsley says busy investors are the final barrier to crypto adoption after exchanges and custody.
- Horsley says Bitcoin needs steady gains, not a sharp dip or a run to $150,000 by October’s end.
- Horsley sees no clients or partners waiting on Clarity as institutions keep moving into crypto.
- Bitwise’s NEAR ETF has drawn over $50 million in net inflows since its late September launch.
Hunter Horsley, CEO of Bitwise, said investors being too busy is now the biggest barrier to crypto adoption. He made the remarks in an interview on Sunday with Wolf Of The All Street.
According to Horsley, regulation and access no longer rank among the industry’s main concerns. He also said institutions are not waiting on Clarity before entering the sector. Separately, Bitwise’s NEAR ETF has drawn over $50 million in net inflows.
Busy Investors and Advisor Demand
Hunter Horsley said crypto has met the “final boss of reasons” people avoid acting. He said the reason is simple: “They’re just busy.” Crypto spent ten years clearing other hurdles, he added.
The most common pushback Bitwise hears now comes from advisors. Many say their clients are not asking about crypto. Some advisors at large firms still do not know they can access Bitcoin. Their firms approved Bitwise products more than a year ago.
Horsley called that situation “almost hard to fathom.” The earlier obstacles, he said, included no exchanges, no qualified custodians, and fears of a government shutdown. Investor attention now ranks ahead of regulation and access.
Some advisors once set clients up with spot Bitcoin or Solana through crypto custodians. They now want to swap into ETF shares, Hunter Horsley said. He said those swaps are due in the third quarter. “Peace of mind, simplicity is the order of the day,” he said.
Price Range Matters for Adoption
Hunter Horsley said Bitcoin’s price needs to rise steadily rather than dip sharply or surge. Rising prices help Bitwise’s sales, but only up to a point. A balanced market, he added, is more conducive to adoption.
A falling market, he explained, leads many investors to wait and see whether prices drop further. A sudden run to $150,000 by the end of October would also cause a pause. Investors would worry that the market had overheated.
Horsley described the ideal as “positive price performance, not too slow, not too fast, and not too high too quickly.” He said the crypto sector is close to that point at present.
Bitcoin traded near $85,200 on Sunday, up 0.5% over 24 hours. On Stocktwits, retail sentiment around Bitcoin remained in the “bearish” zone. Chatter fell to “low” from “normal” levels over the past day.
Regulation, Clarity, and the NEAR ETF
Horsley shared remarks on the Clarity legislation. “I don’t see any clients or partners waiting for Clarity,” he said. He said the most regulated institutions are moving forward regardless of the outcome.
Clarity “could be an asset if written well,” Horsley said. Some use cases, he added, would be challenged without that clarity. Hunter Horsley also said the space is not lawless or ruleless, citing the GENIUS Act as “extremely powerful.”
Horsley said there is “no stopping this train.” He also said the SEC’s proposed custody framework does not greatly change how advisors add crypto.
It would open the door to stablecoin holdings, on-chain vaults, and tokenized assets, with use cases expected next year.
Bitwise launched the Bitwise NEAR ETF (NRR) on the New York Stock Exchange in late September. Hunter Horsley said the fund sits “squarely” at the intersection of AI and crypto.
He said index products have lagged single-asset funds so far. “The story is just getting started on the index front,” he said. NEAR’s price rose over 3% in the last 24 hours.
The post Bitwise CEO Hunter Horsley Says Busy Investors Are Crypto’s ‘Final Boss’ appeared first on Blockonomi.
TLDR:
- U.S. ETF inflows reached a record $1.93T through Sept. 29, up $580B, or 43%, from the same 2025 period.
- Q3 delivered a record $771B in U.S.-listed ETF inflows, lifting the monthly pace to roughly $214B in 2026.
- Equity ETFs drew more than $1T in 2026, while fixed-income ETFs attracted over $469B through September.
- Spot Bitcoin ETFs added $2.65B in September, while spot Ether ETFs drew about $832M during the month.
U.S.-listed exchange-traded funds are drawing capital at a record pace, with net inflows reaching about $1.93 trillion through September 29. Bloomberg data compiled by Citadel Securities showed the total running $580 billion, or 43%, above the comparable 2025 period.
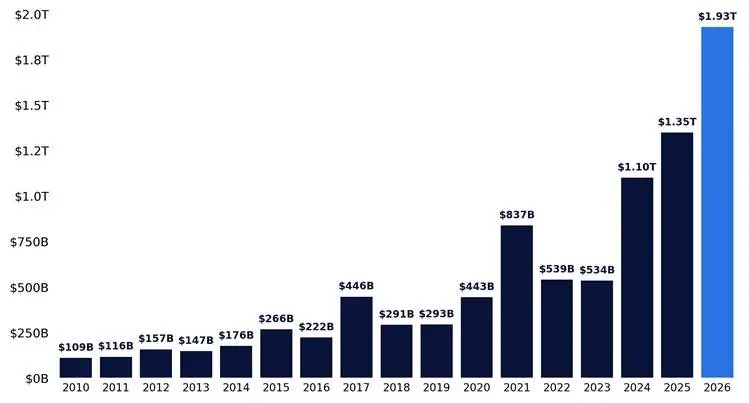
Source: Citadel Securities
The third quarter delivered the strongest contribution, attracting $771 billion and setting a new quarterly inflow record. The pace equates to roughly $214 billion monthly, putting annual flows on track to exceed $2.5 trillion if maintained.
The surge reflects broad demand rather than strength in a single investment category. Equity and fixed-income products have both absorbed substantial capital, reinforcing ETFs as a dominant vehicle for allocating money across markets. That breadth makes the record notable across both risk and income markets.
U.S. ETF Demand Spreads Across Equities and Bonds
State Street Investment Management separately estimated more than $1.54 trillion of U.S.-listed ETF inflows through September. That total already exceeded its $1.52 trillion full-year record from 2025.
State Street projected flows near $2.3 trillion by year-end. Its figures showed equity ETFs leading with more than $1 trillion, while fixed-income products attracted over $469 billion. Within equities, funds tracking U.S. stocks received about $655 billion.
Moreover, technology sector ETFs added more than $59 billion, highlighting the scale of allocations reaching market-leading companies. The State Street and Citadel totals differ as their datasets use different coverage or methodologies.
Neither report reconciled the gap, but both recorded historically strong ETF demand. Industry assets expanded alongside those inflows. Investment Company Institute data placed U.S. ETF assets at $16.27 trillion in August, while indexed funds held $22.4 trillion.
Those indexed mutual funds and ETFs represented 54.3% of combined long-term fund assets, showing how index-linked products now account for more than half of that market.
Record ETF Flows Boost Mega-Cap Exposure and Crypto Access
Citadel estimated the 10 largest S&P 500 companies receive about 41 cents from every dollar allocated to the index. Similarly, the Magnificent Seven receive roughly 35 cents. That structure means large index inflows direct substantial capital toward the biggest companies.
Meanwhile, only 25% of S&P 500 constituents traded above 50-day averages in late September. Crypto ETFs also participated in the broader shift toward regulated fund wrappers, although their flows remained much smaller than traditional ETF totals.
U.S. spot Bitcoin ETFs attracted about $2.65 billion in September, while spot Ether ETFs received roughly $832 million, according to SoSoValue data.These figures show investors using ETFs across stocks, bonds, Bitcoin and Ether. However, crypto remained a small share of the record industry-wide inflow total.
The post U.S. ETF Inflows Hit Record $1.93T as Q3 Delivers Historic $771B Surge appeared first on Blockonomi.
TLDR:
- Binance TRX netflow reached +79.8 million TRX on October 1, the largest daily net inflow in 99 days.
- The seven-day net of +75.3 million TRX turns negative at −30.4 million over 14 days without October 1.
- Netflow showed a +0.62 same-day return correlation, but next-day and two-day readings stayed weak at −0.05 and +0.19.
- TRX trades near $0.3357 inside a rectangle, with resistance at $0.35 and support around $0.322.
Binance TRX netflow reached +79.8 million TRX on October 1, marking the largest daily net inflow in 99 days. Inflow totaled 136.9 million TRX, which was 3.1 times the 30-day daily mean of 44.4 million TRX.
TRX closed the day at $0.33, down 0.79%. The spike came one day before the October 2 NFP release. No scheduled macroeconomic event took place on October 1, according to the dataset covering June 27 to October 3.
One Deposit Day Drives Weekly Net Inflow
The seven-day Binance TRX netflow stood at +75.3 million TRX, compared with −25.9 million in the previous seven days. However, October 1 alone exceeded that weekly total.
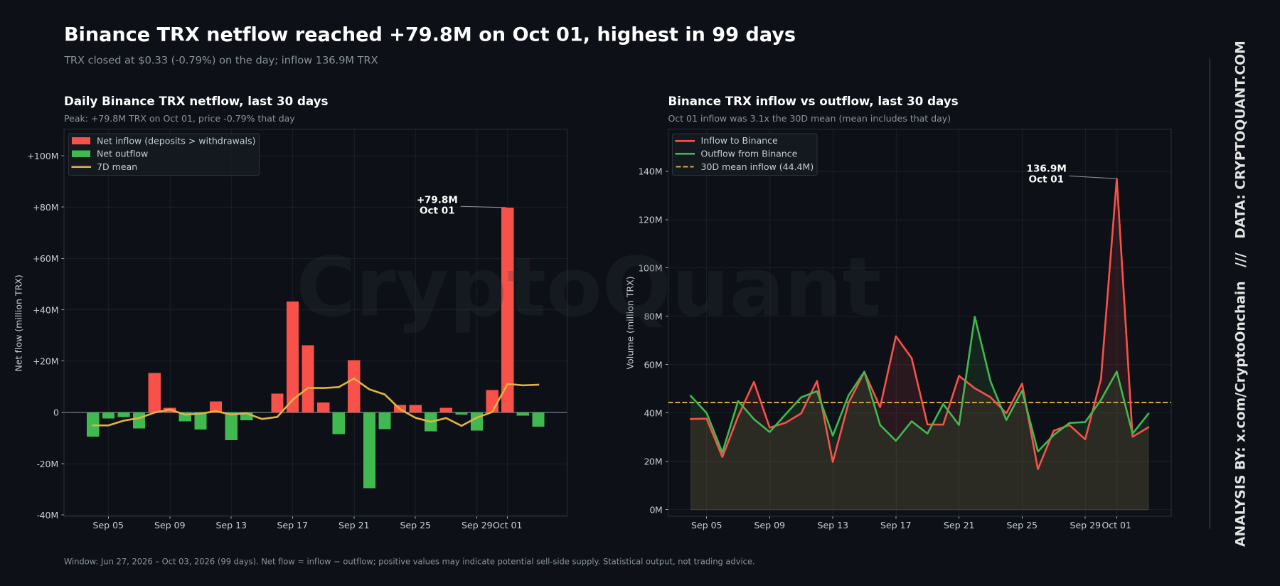
Source: Cryptoquant
The other six days recorded combined net outflows of 4.5 million TRX. Likewise, the 14-day net was +49.4 million TRX, but it turned to −30.4 million without October 1. This pattern shows the spike carried the entire weekly reading.
Cumulative netflow reached 37.7 million on October 1. Afterward, it fell to 35.4 million by October 3. Therefore, one exceptional deposit day explains the weekly Binance TRX netflow, not a sustained inflow trend.
Netflow Shows No Clear Link to Later Returns
Across the 99-day sample, Binance TRX netflow had a rank correlation of +0.62 with same-day returns. Meanwhile, correlations with next-day and two-day-ahead returns were −0.05 and +0.19. Only the same-day reading showed a notable relationship.
These readings suggest no clear predictive relationship with subsequent returns. TRX moved just −0.04% on NFP day, despite the prior deposit spike. The latest inflation data in the dataset showed August CPI at 3.4% YoY. Core CPI stood at 2.4%, while PPI reached 5.4% YoY.
Pre-NFP positioning by a few large depositors is one possible explanation. However, this remains unverified. Further sessions are needed to confirm whether the Binance TRX netflow trend persists or the event was an isolated transfer.
The dataset flagged 17 days as network-unclean, which left network-side metrics blank. All of the last 14 days pass this check. Two of the last 30 days carry whale-outlier flags.
TRX Price Action and Technical Levels
TRX trades at $0.3357, according to market data. The price is up 0.10% over 24 hours and 0.46% over seven days. Meanwhile, 24-hour trading volume stands at $201,739,711. Price action therefore remained near the middle of the reported range.
Separately, analyst Crypto With Gopal posted on X on October 3 about the 4H chart. The analyst described TRX as consolidating inside a rectangle pattern near $0.335. Resistance sits near $0.35, while support is around $0.322.
$TRX is consolidating inside a clear Rectangle pattern on the 4H chart
Price is around $0.335, with strong resistance near $0.35 and support around $0.322. The range has held for weeks, showing a clear battle between buyers and sellers.
A breakout above $0.35 could open… pic.twitter.com/w5cYrexGwR
— Crypto With Gopal (@cryptowithgopal) October 3, 2026


According to the post, the range has held for weeks. A breakout above $0.35 could open an upside target near $0.38. Conversely, a breakdown below $0.322 could shift focus toward $0.29. The post labeled market sentiment as breakout watch.
The post Binance TRX Inflow Surges to 136.9M as Price Holds Near $0.335 appeared first on Blockonomi.
TLDR:
- Bitcoin starts near $85,000 as bond yields, Fed minutes and ISM data shape this week’s crypto outlook.
- September payrolls rose 29,000 versus 90,000 expected, while unemployment increased to 4.2% overall.
- The 10-year Treasury yield recently hit 5.34%, its highest level in roughly 24 years, pressuring risk assets.
- A $39B 10-year Treasury reopening and Fed minutes make Wednesday the week’s key bond-market test for crypto.
Cryptocurrency markets enter a macro-heavy week with Treasury yields again shaping the outlook for Bitcoin and other risk-sensitive assets. The schedule includes services data, a major Treasury auction, Federal Reserve minutes, and consumer inflation expectations.
The Kobeissi Letter highlighted six events across Monday, Wednesday, and Friday, placing the bond market at the center of this week’s trading focus. Basically, higher Treasury yields raise returns on lower-risk assets and can tighten financial conditions, limiting demand for speculative assets.
Bitcoin began the week near $85,000 after reaching about $87,000 following Friday’s weaker employment report. September payrolls rose by 29,000, below the 90,000 expected, while unemployment increased to 4.2%. The weaker labor figures shifted attention toward whether incoming inflation and activity data support another Fed increase. That makes this week’s bond moves especially important for crypto pricing.
Bond-Heavy Week Puts Bitcoin in Focus Before ISM and Fed Minutes
Monday’s first major catalyst arrives at 10:00 a.m. ET with the September ISM Services PMI. The August index stood at 55.4, while the Prices Index reached 72.6. As a result, economists expect the September headline reading near 55.
Attention will also center on prices after September manufacturing prices jumped to 77.9 from 71.1. A strong services reading alongside elevated prices would keep inflation pressures in focus. That combination could lift Treasury yields and the dollar, adding pressure across the crypto market.
Softer activity and weaker price pressures would instead reinforce expectations that the Fed can pause after September’s increase. The employment report already reduced expectations for another immediate rate rise.
$39B Treasury Auction and 5.34% Yield Raise Wednesday Stakes
Wednesday concentrates the week’s largest bond-related events, starting with Treasury’s scheduled 10-year note reopening. Officials had previously outlined a $39 billion October auction size, keeping demand for government debt firmly in focus. Meanwhile, the 10-year Treasury yield recently reached 5.34%, its highest level in about 24 years.
That rise in yields has already affected Bitcoin’s short-term performance. Earlier last week, Bitcoin moved above $85,500 before giving back gains as the 10-year yield remained near 5.3%. Later Wednesday, Fed minutes will offer more detail on how officials viewed the September policy decision. Policymakers unanimously raised rates by 25 basis points to 3.75%-4.00%.
Attention will then shift to Friday, when preliminary October University of Michigan sentiment and inflation expectations are released. September sentiment fell to 48.1, while one-year inflation expectations climbed to 4.6%. At the same time, five-year expectations increased to 3.4%. Together, those figures will provide another measure of whether inflation pressures remain embedded as markets assess the Fed’s next move.
Friday’s readings will therefore close a week dominated by interest rates and Treasury yields. For the crypto market, the key issue remains whether bond yields retreat from recent highs or stay elevated. As a result, macroeconomic data and rate expectations are likely to remain more influential than crypto-specific catalysts during the week.
The post Crypto Markets Brace for Bond-Heavy Week as Fed Minutes and ISM Loom appeared first on Blockonomi.
TLDR:
- Bitcoin’s Sunday moves have often reversed on Monday over the past month, according to Ali Charts.
- A TD Sequential sell signal on Bitcoin’s four-hour chart followed four past corrections each time.
- Ethereum’s last two TD Sequential sell signals were followed by declines of 5.40% and 3.31%.
- Solana’s last three comparable signals preceded corrections of 2.44%, 5.76%, and 5.30%.
Sunday pump Monday dump is back in focus as Bitcoin climbed more than 1% on October 4. Over the past month, the cryptocurrency’s Sunday moves have often reversed at the start of the week.
A TD Sequential sell signal has also appeared on the four-hour charts of Bitcoin, Ethereum, and Solana. In earlier cases, similar signals were followed by corrections. Together, these readings point to a possible pullback when markets open on Monday.
Sunday Pump Monday Dump Pattern Draws Attention
Market analyst Ali Charts raised the topic in a six-part thread on X. The opening post framed the idea as Sunday pump equals Monday dump.
SUNDAY PUMP = MONDAY DUMP
1/6
— Ali Charts (@alicharts) October 4, 2026


In the second post, the analyst said Bitcoin’s Sunday moves have often reversed on Monday over the past month. Sunday rallies were followed by pullbacks. Sunday declines, on the other hand, were followed by rebounds. The same reversal appeared in both directions, according to the analyst.
Bitcoin was up more than 1% on Sunday as of time of publication trading at $85,845. As a result, the analyst said the pattern is back in focus. The first post had recorded 3,604 views at that point. The follow-up posts appeared minutes after the first one.
TD Sequential Flashes Sell Signal on Bitcoin
The third post added a technical warning to the weekly pattern. According to Ali Charts, the TD Sequential indicator has flashed a sell signal on Bitcoin’s four-hour chart. The signal appeared while Bitcoin traded higher on the day.
The analyst noted that each of the last four similar signals was followed by a price correction. Ali Charts did not list the size of those four corrections. Based on that record, the thread pointed to another Monday dump.
Therefore, the sell signal and the Sunday pump Monday dump pattern lead to the same outcome. Both readings suggest a pullback at the start of the week. The next posts extend the signal to other major assets.
Ethereum and Solana Show Matching Signals
The fourth post covered Ethereum. The asset shows the same TD Sequential sell signal on its four-hour chart. Its last two signals were followed by declines of 5.40% and 3.31%, respectively. The two earlier declines serve as the reference points for Ethereum.
Solana was addressed in the fifth post. It has flashed a four-hour TD Sequential sell signal as well. Its last three comparable signals preceded corrections of 2.44%, 5.76%, and 5.30%. The analyst used these readings as a historical reference for the current setup.
The final post combined all the data points. It cited a Sunday pump, a recent run of Monday dumps, and sell signals across BTC, ETH, and SOL.
Ali Charts said these factors point to a possible pullback. The Sunday pump Monday dump setup, therefore, rests on both calendar behavior and chart signals. The thread ended with that post, and no further posts followed.
The post Sunday Pump, Monday Dump: Bitcoin Pattern Returns as TD Sequential Signals Flash on BTC, ETH, SOL appeared first on Blockonomi.
CryptoPotato
Most retail traders on Polymarket lose money. A Galaxy Research study of 2.9 million human-paced accounts found that more than 69% finished below break-even. The group recorded aggregate losses of $338.9 million.
The research used Polymarket’s full on-chain history, covering positions, entry prices, holding periods, as well as payouts. Galaxy excluded 125,429 accounts that averaged more than 50 orders per active trading day, treating them as likely automated. These accounts made up just 4.1% of wallets but accounted for 80.8% of all orders.
Behavior of Polymarket Traders
Among the remaining accounts, the median retail account lost around $3, which indicates that most losses were relatively small, while a smaller group lost thousands. Galaxy also found that losing money was linked to higher churn. About 15.2% of accounts did not trade again within 30 days after a loss, compared with 6.1% after a win.
The study also examined whether traders increased risk after winning or losing. Both groups usually returned with slightly smaller positions, but traders reduced risk less after a win.
Specialization was another major finding. Around 44% of traders focused more than 60% of their activity on one topic. However, specialists were slightly less likely to be profitable than generalists. Only 28% of specialists finished profitably, compared with 30.4% of generalists.
Sports made up the largest specialist group and had the lowest profitability rate. Tech and science specialists performed better, with 41.2% finishing profitably. Galaxy said this could reflect stronger subject knowledge, although the data cannot establish why these traders performed better.
Profitable traders also tended to make larger bets. They also traded more frequently. Holding time, however, did not show a clear link with profitability. Galaxy’s research covered Polymarket’s international platform, not its separate US exchange. It also noted an important limitation: the analysis tracks wallet addresses rather than individual people. A trader using multiple wallets could therefore appear as several accounts.
Legal Woes
The legal problems around prediction markets are starting to pile up as platforms like Polymarket expand into more countries and markets. In the US, cities and states are increasingly arguing that contracts on sports results, player stats, and other uncertain outcomes look a lot like ordinary gambling. Baltimore, for example, sued Polymarket and Kalshi in August, claiming that both platforms were offering sports bets without the licenses required in Maryland.
New York followed in September, suing Polymarket’s US arm over alleged unlicensed gambling and claims that users aged 18 to 20 could trade, despite the state’s 21-year minimum age for mobile sports betting. The legal questions go beyond the US.
South Korean police opened cases against 26 Polymarket users and referred 18 to prosecutors over about $12.7 million in bets. Authorities there are examining whether its trading should be treated as illegal gambling under Korean law.
The post Galaxy Finds 7 in 10 Polymarket Retail Traders Lost Money appeared first on CryptoPotato.
The International Monetary Fund has approved a disbursement worth SDR 101.96 million ($138 million) for El Salvador after granting the government a waiver for its failure to meet a condition related to Bitcoin accumulation.
The IMF Executive Board completed the second and third reviews of El Salvador’s Extended Fund Facility program on October 1.
Limits for Bitcoin Accumulation
The IMF said El Salvador’s economy has performed better than expected, helped by improved security and stronger investor confidence. The country has also made progress in reducing fiscal imbalances. Its reserve and liquidity buffers have strengthened, while fiscal consolidation has broadly stayed on track. However, some program conditions were not met. One of them involved the government’s Bitcoin accumulation. The IMF granted waivers based on “corrective measures and renewed commitments” from the Salvadoran authorities.
Under the latest program commitments, El Salvador is not expected to accumulate more Bitcoin beyond documented donations. The IMF also said the government is working to reduce its role in BTC-related activities, which includes plans to improve transparency around public-sector crypto holdings and strengthen rules governing crypto-asset companies.
“Efforts will continue to reduce the state’s involvement in Bitcoin-related activities, strengthen crypto‑asset regulation and governance, and enhance transparency regarding public-sector crypto‑asset holdings. No further Bitcoin accumulation is envisaged beyond the documented donations.”
Chivo’s Government Role Shrinks
The government’s Chivo digital wallet has also moved toward private control. According to the IMF, majority ownership and control of Chivo have been transferred to a private operator. The remaining public-sector exposure should eventually be unwound.
El Salvador agreed to a 40-month IMF program in February 2025. The program provides total access of about $1.4 billion. The latest disbursement is part of that broader financial arrangement. The IMF said the country still needs to carry out further reforms to strengthen public finances, rebuild external reserves and improve financial-sector resilience. Pension and civil service reforms are also expected to move forward after earlier delays.
The IMF also called for stronger governance and greater transparency while highlighting areas such as public-sector reporting, beneficial ownership disclosures, asset declarations, and anti-money laundering rules. These reforms were crucial for maintaining economic stability.
The post IMF Approves $138M for El Salvador After Bitcoin Accumulation Waiver appeared first on CryptoPotato.
The spot Bitcoin ETFs managed to turn the tables for the year as the net flows finally turned green, but there are some concerning signs.
Meanwhile, the funds tracking the largest altcoin ended the previous week in the red. This became the second such week out of the last three.
BTC ETFs Green, But There’s a Catch
Recall that the spot BTC ETFs had their best five-day trading performance in nearly a year during the last full week of September when they attracted roughly $2.4 billion in net inflows. This helped flip the YTD numbers green, which was difficult to imagine just a few months ago when the funds bled out heavily, with $2.43 billion leaving in May and a whopping net withdrawal of $4.5 billion in June.
September 28 began with another $31.07 million in net inflows, followed by $66.19 million on Tuesday. The tables turned on Wednesday as investors pulled out $148.69 million. This was rather surprising since the PCE data came out on that day and showed that inflation was lower than expected.
Nevertheless, the net inflows returned on Thursday with $102.67 million, according to SoSoValue. FarSide shows that another $31.7 million entered the financial vehicles on Friday, ending the week at around $83 million. This makes the past four weeks quite interesting and different.
$83 million in the past week was not all that impressive, especially when compared to the $2.39 billion a week before. However, that record-setting five-day trading period followed a very modest $6.21 million inflow week. The one before that was even stranger, with $462.73 million leaving the funds.

ETH ETFs in the Red Again
The spot Ethereum ETFs also started the business week on the right foot, but their momentum quickly faded. After the $17.10 million in net inflows on Monday, withdrawals took charge with $2.81 million on Tuesday, $59.58 million on Wednesday, $55.37 million on Thursday, and another $17.3 million on Friday.
Consequently, the week ended with net outflows of approximately $114 million. The concerning part is that this is the second such week out of the last three, in which withdrawals have dominated. The positive side is that the one that was in the green saw notable net inflows of almost $690 million.
Still, the cumulative total net inflows have declined slightly from the recent local peak of $13.94 billion to $13.80 billion.

The post Bitcoin and Ethereum ETF Weekly Flows: The Good, the Bad, and the Concerning appeared first on CryptoPotato.
Bitcoin enters the final quarter of the year after a powerful recovery in the third quarter, but analysts warn against expecting another straight-line rally. Instead, they pointed to some key factors that could impact BTC and the overall market in the following three months.
Some of them include the Federal Reserve, Treasury-market liquidity, ETF flows, geopolitics, and BTC’s ability to clear $87,500, which remains its most significant obstacle on the path forward.
Q3 May Be Hard to Repeat
Although Q3 began with another leg down to under $58,000, which became BTC’s lowest price tag in a year and a half, the subsequent three months were a lot more positive. The cryptocurrency rebounded immediately and broke out in mid-August to over $80,000. Its rise continued and managed to close the quarter with a massive 43% surge.
Iliya Kalchev, Nexo Dispatch Analyst, described the three-month period as both a recovery phase and a breakout milestone. He argued that the most important catalyst arrived from the bond market after the US Treasury increased the size of its long-end bond buyback operations in August.
The asset indeed jumped by 7% on August 19 and rocketed by over 20% in the following several days. Spot Bitcoin ETF flows immediately turned positive and even flipped into the green on a year-to-date basis. Meanwhile, relatively subdued perpetual funding suggested the rally was driven more by spot demand than excessive leverage, Kalchev added.
Nevertheless, the analyst cautioned against assuming Q4 will simply extend Q3’s pace. Although the cryptocurrency has finished Q4 higher in nine of the past 15 years, the median gains are only around 9%, while the much larger average has been distorted by spectacular years such as 2013 and 2017.
Alex Kozenko, CMO at WhiteBIT, issued a similar warning:
“Today, the market structure is different: institutional participation has become more prominent, and flows through regulated investment products have become yet another source of influence on market dynamics. Over the next three months, I would primarily focus on liquidity, institutional activity, and the overall macroeconomic environment.”
Fed and $87.5K
Although the overall market situation changed slightly after the weaker-than-expected US jobs report from Friday, Lacie Zhang, Research Analyst at Bitget Wallet, told CryptoPotato that she still believes the Fed will hike rates again by 25 basis points on October 28. This would put the target range at 4.00%-4.25% after the September increase, which was the first in over three years.
Kalchev also highlighted the Fed as the biggest Q4 variable, although the latest softer core PCE reading, alongside the aforementioned jobs report, reduced some of the immediate pressure for additional tightening. Geopolitical developments, though, could complicate the picture further, especially if energy prices keep feeding inflation.
According to Zhang, $87,500 remains the most crucial obstacle in BTC’s path to a broader recovery. A break above it could increase the likelihood of a short squeeze. In contrast, she identified the $82,000-$82,500 support range as the key downside zone, and losing it could accelerate a move below $80,000.
The post What Could Decide Bitcoin’s Q4? The Fed, Bond Yields, and One Crucial Price Level appeared first on CryptoPotato.
Own assets or be left behind — this is what the analysts at the Kobeissi Letter argued, highlighting the major discrepancy between those who do and those who stay on the sidelines.
Bitcoin fits surprisingly well into this distorted economy, but treating it as a cure for the destruction of the middle class would be a bit of an overstatement.
Own Assets or Get Left Behind
There are roughly 134.8 million households in the States, according to the analysts. However, around 1.4 million of them, also known as the wealthiest 1%, control more than $60 trillion in net worth. Since 2020 alone, their wealth has grown by more than $30 trillion. The bottom 50%, or 67.4 million households, collectively hold a fraction of that amount.
The reason isn’t simply that rich households earn larger salaries; the bigger divide is asset ownership, the Kobeissi Letter said. Total US household wealth has exploded from roughly $101 trillion six years ago to $185 trillion today, but that massive increase has been distributed very unevenly.
Americans who already owned stocks, businesses, property, and other appreciating assets benefited disproportionately as their prices rose. Meanwhile, inflation steadily eroded the value of income and cash savings. The analysts separately calculated that the greenback has lost roughly 23% of its purchasing power since 2020.
In other words, someone whose savings or assets increased by 30% over that period has made only a relatively modest actual gain after accounting for the decline in purchasing power. Inflation has also remained well above the Fed’s 2% target for 60 consecutive months.
Food, housing, transportation, and other necessities have become more expensive, while the assets needed to escape that erosion, mostly homes and stocks, can also become harder to afford. The analysts added that borrowing has offered little relief, as mortgage rates recently climbed toward the mid-7% range. At the same time, Treasury yields surged, raising the barrier to homeownership even further.
Consequently, they concluded something simple and obvious: “Own assets or be left behind.”
Does BTC Fit Here?
Bitcoin matters in this macro dynamic, even though it’s not as simple as saying it can somehow save the middle class. BTC addresses one specific part of the argument above quite well: its supply can’t expand in response to government spending, deficits, elections, wars, or monetary policy. There will ultimately be no more than 21 million units, making it fundamentally different from cash, whose purchasing power can and probably will decline as the monetary base expands.
It’s also unusually accessible compared with many traditional wealth-building assets. You don’t need a down payment required for a house or enough capital to purchase an entire BTC. If the fundamental problem is that people who hold appreciating scarce assets are pulling increasingly far ahead of people saving exclusively in depreciating currencies, bitcoin offers another way to get onto the asset-owning side of that divide.
On the contrary, bitcoin remains very volatile, which is not ideal for inexperienced investors. It can lose 50% or more during severe downturns in just months. In general, simply holding it generates no cash flow and offers little help to someone whose income is already consumed by rent, food, healthcare, and debt.
It can’t magically make housing more affordable, raise real wages, reduce healthcare costs, improve taxation, or redistribute existing wealth. As such, it’s safe to say that BTC cannot rebuild the American middle class. However, a scarce asset that virtually anyone can own and has no central authority behind it can provide individuals with one additional way to get exposure in an economy where asset ownership increasingly determines who preserves and grows wealth.
The post America’s Middle Class Is Getting Crushed: Where Does Bitcoin Fit? appeared first on CryptoPotato.