Cryptocurrency Posts
Crypto Briefing
The emergence of open-source Adobe alternatives highlights AI's potential to democratize software development, challenging industry norms.
The post Developer builds free Adobe Creative Cloud alternatives using Claude Opus 5.5 appeared first on Crypto Briefing.
The coalition's actions may shift the conflict dynamics, potentially reducing Houthi advances and impacting regional stability and market perceptions.
The post Saudi-led coalition destroys 82 Houthi military targets in Yemen appeared first on Crypto Briefing.
Coinbase's integration of global derivatives liquidity could significantly enhance US traders' market access, potentially boosting institutional participation and market efficiency.
The post Coinbase connects US traders to global derivatives liquidity appeared first on Crypto Briefing.
Grok Bot's enhanced capabilities streamline data analysis, offering strategic insights for marketers and researchers, but posting limitations remain.
The post Grok Bot gains native X search, analyzing more than 100 posts per prompt appeared first on Crypto Briefing.
Formation's focus on AI, robotics, and defense financing could reshape DeFi's role in traditional sectors, introducing new regulatory and credit risks.
The post Orca and Loopscale merge into Formation, setting sights on AI, robotics and defense financing appeared first on Crypto Briefing.
Bitcoin Magazine
Bitcoin Magazine

CFTC Chair Says New Crypto Rulemaking Will Prevent Another FTX-Style Collapse
Pro-crypto regulator Mike Selig has said that pushing ahead with new rules will stop another collapse like FTX.
Speaking on Fox Business Network’s Varney & Co. show Wednesday, the Commodity Futures Trading Commission Chair said that crypto exchanges will have the chance to register with the regulator in order to safeguard digital asset spot markets.
Once one of the most popular crypto exchanges, FTX quickly and abruptly went bankrupt in 2022 due to mismanagement. Its founder, Sam Bankman-Fried, is now serving 25 years in prison for fraud and other crimes after $8 billion in customer funds was stolen.
The CFTC and other regulators are pushing ahead with rulemaking for the crypto space, despite lawmakers last month blocking the long-awaited Clarity Act.
“Four years ago, we saw the collapse of Sam Bankman-Fried’s FTX, where he stole over $8 billion in customer funds. That can’t happen under our regime,” Selig said.
“Actually, Sam Bankman-Fried’s subsidiary that was CFTC registered, all the funds were safe and secure because they were segregated, and we have some of the most stringent requirements of any federal agency when it comes to markets — we want to bring that to the crypto world,” he added.
Selig added that some exchanges may choose to remain under the state regimes, while others will register federally.
The CFTC is relying on powers it already has to regulate crypto markets. The watchdog this week sought public comment on a framework that would create a new federal registration category, called a “crypto asset market,” for exchanges offering leveraged, margined or financed crypto trades to retail customers.
Exchanges that don’t offer leverage could stay under state licenses. But the agency reads “leverage” broadly, which could bring even fully paid trades under its oversight unless customers take delivery of their crypto.
CFTC Chair Selig, formerly chief counsel at the SEC’s Crypto Task Force, last month said that the regulator was preparing for the transition of markets moving “24-7, on-chain.”
Both the CFTC and Securities and Exchange Commission have taken a more friendly approach to regulating the crypto industry since U.S. President Donald Trump took power.
This post CFTC Chair Says New Crypto Rulemaking Will Prevent Another FTX-Style Collapse first appeared on Bitcoin Magazine and is written by Mathew Di Salvo.
Bitcoin Magazine

US Investors Want to up Their Crypto Holdings: Charles Schwab
Forget stocks — U.S. investors are more interested in upping their bitcoin holdings, according to new research.
Charles Schwab’s 2026 Modern Wealth Survey dropped on Wednesday, and showed that current cryptocurrency investors want to keep adding to their holdings.
The research revealed that a total of six in 10 plan to invest more over the next 12 months — a higher share than among owners of all other investments measured, including ETFs (56%), stocks (52%), bonds (42%), and mutual funds (41%).
“Existing cryptocurrency investors are certainly leaning in, particularly younger investors who are driving much of the interest and momentum in cryptocurrency,” Head of Digital Assets at Charles Schwab, Joe Vietri, said in a statement.
“But to me, the bigger story is that cryptocurrency is increasingly viewed as a complement to traditional investments.”
Charles Schwab is the country’s largest custodian for registered investment advisors, and earlier this year began a phased rollout of Schwab Crypto to retail clients, giving them direct access to bitcoin trading along with educational content and professional support.
Schwab also offers crypto-linked exchange-traded funds, bitcoin futures, and its own Schwab Crypto Thematic Index ETF. CEO Rick Wurster has said Schwab clients hold more than 20% of all crypto exchange-traded products across the industry.
Wednesday’s report added that one in five Americans overall own cryptocurrency today, and another one in five say they don’t own it but are interested in buying it. Among investors, nearly half own cryptocurrency.
It further noted that millennials are the most likely to own cryptocurrency, and are more than four times the rate among Boomers.
The online survey was conducted by Logica Research from August 24 to September 17, 2026, among a national sample of 2,000 Americans ages 21 to 75.
This post US Investors Want to up Their Crypto Holdings: Charles Schwab first appeared on Bitcoin Magazine and is written by Mathew Di Salvo.
Bitcoin Magazine

Jack Dorsey’s Block Gifts One Bitcoin to Lucky ComplexCon Attendee
Jack Dorsey’s Block is pushing so hard for bitcoin adoption, it gifted 1 BTC to a lucky conference attendee at this year’s ComplexCon in Los Angeles.
The fintech giant attended the Complex Networks yearly event at the weekend in a bid to introduce newbies to the leading cryptocurrency through — in its words — “culture, shopping and play.”
Block’s Cash App had a stall at the event with a fishing game dubbed “Lightning Lake”, allowing attendees to win small amounts of bitcoin.
But one fortunate player was lucky enough to scoop up a whole coin — worth $85,000 at the time.
“We wanted bitcoin to feel approachable, tangible and fun,” Maria Pesce, Head of Bitcoin Marketing at Block, told Bitcoin Magazine.
“People could go from never having used bitcoin to paying with it, all in a trip around the lake.”
She added: “At Block, our goal is to make bitcoin everyday money, and ComplexCon gave us a chance to introduce bitcoin to a new audience through culture, shopping, and play.”

Block has long pushed for bitcoin adoption via its companies and products: Cash App allows users to send, receive and buy bitcoin and Square point-of-sale terminals accept the orange coin via the Lightning Network.
NYSE-listed Block this month even debuted an advertising campaign to make the push for people to use the leading cryptocurrency as a medium of exchange.
Dorsey, who in 2021 left Twitter to focus his efforts on payments and Bitcoin adoption in 2021, has repeatedly said he wants the cryptocurrency to be the global currency and “everyday money.”
Block even piqued the interest of celebrities at ComplexCon: Kanye West’s daughter North West and rapper French Montana were spotted by Lightning Lake trying to fish for bitcoin.
This post Jack Dorsey’s Block Gifts One Bitcoin to Lucky ComplexCon Attendee first appeared on Bitcoin Magazine and is written by Mathew Di Salvo.
Bitcoin Magazine
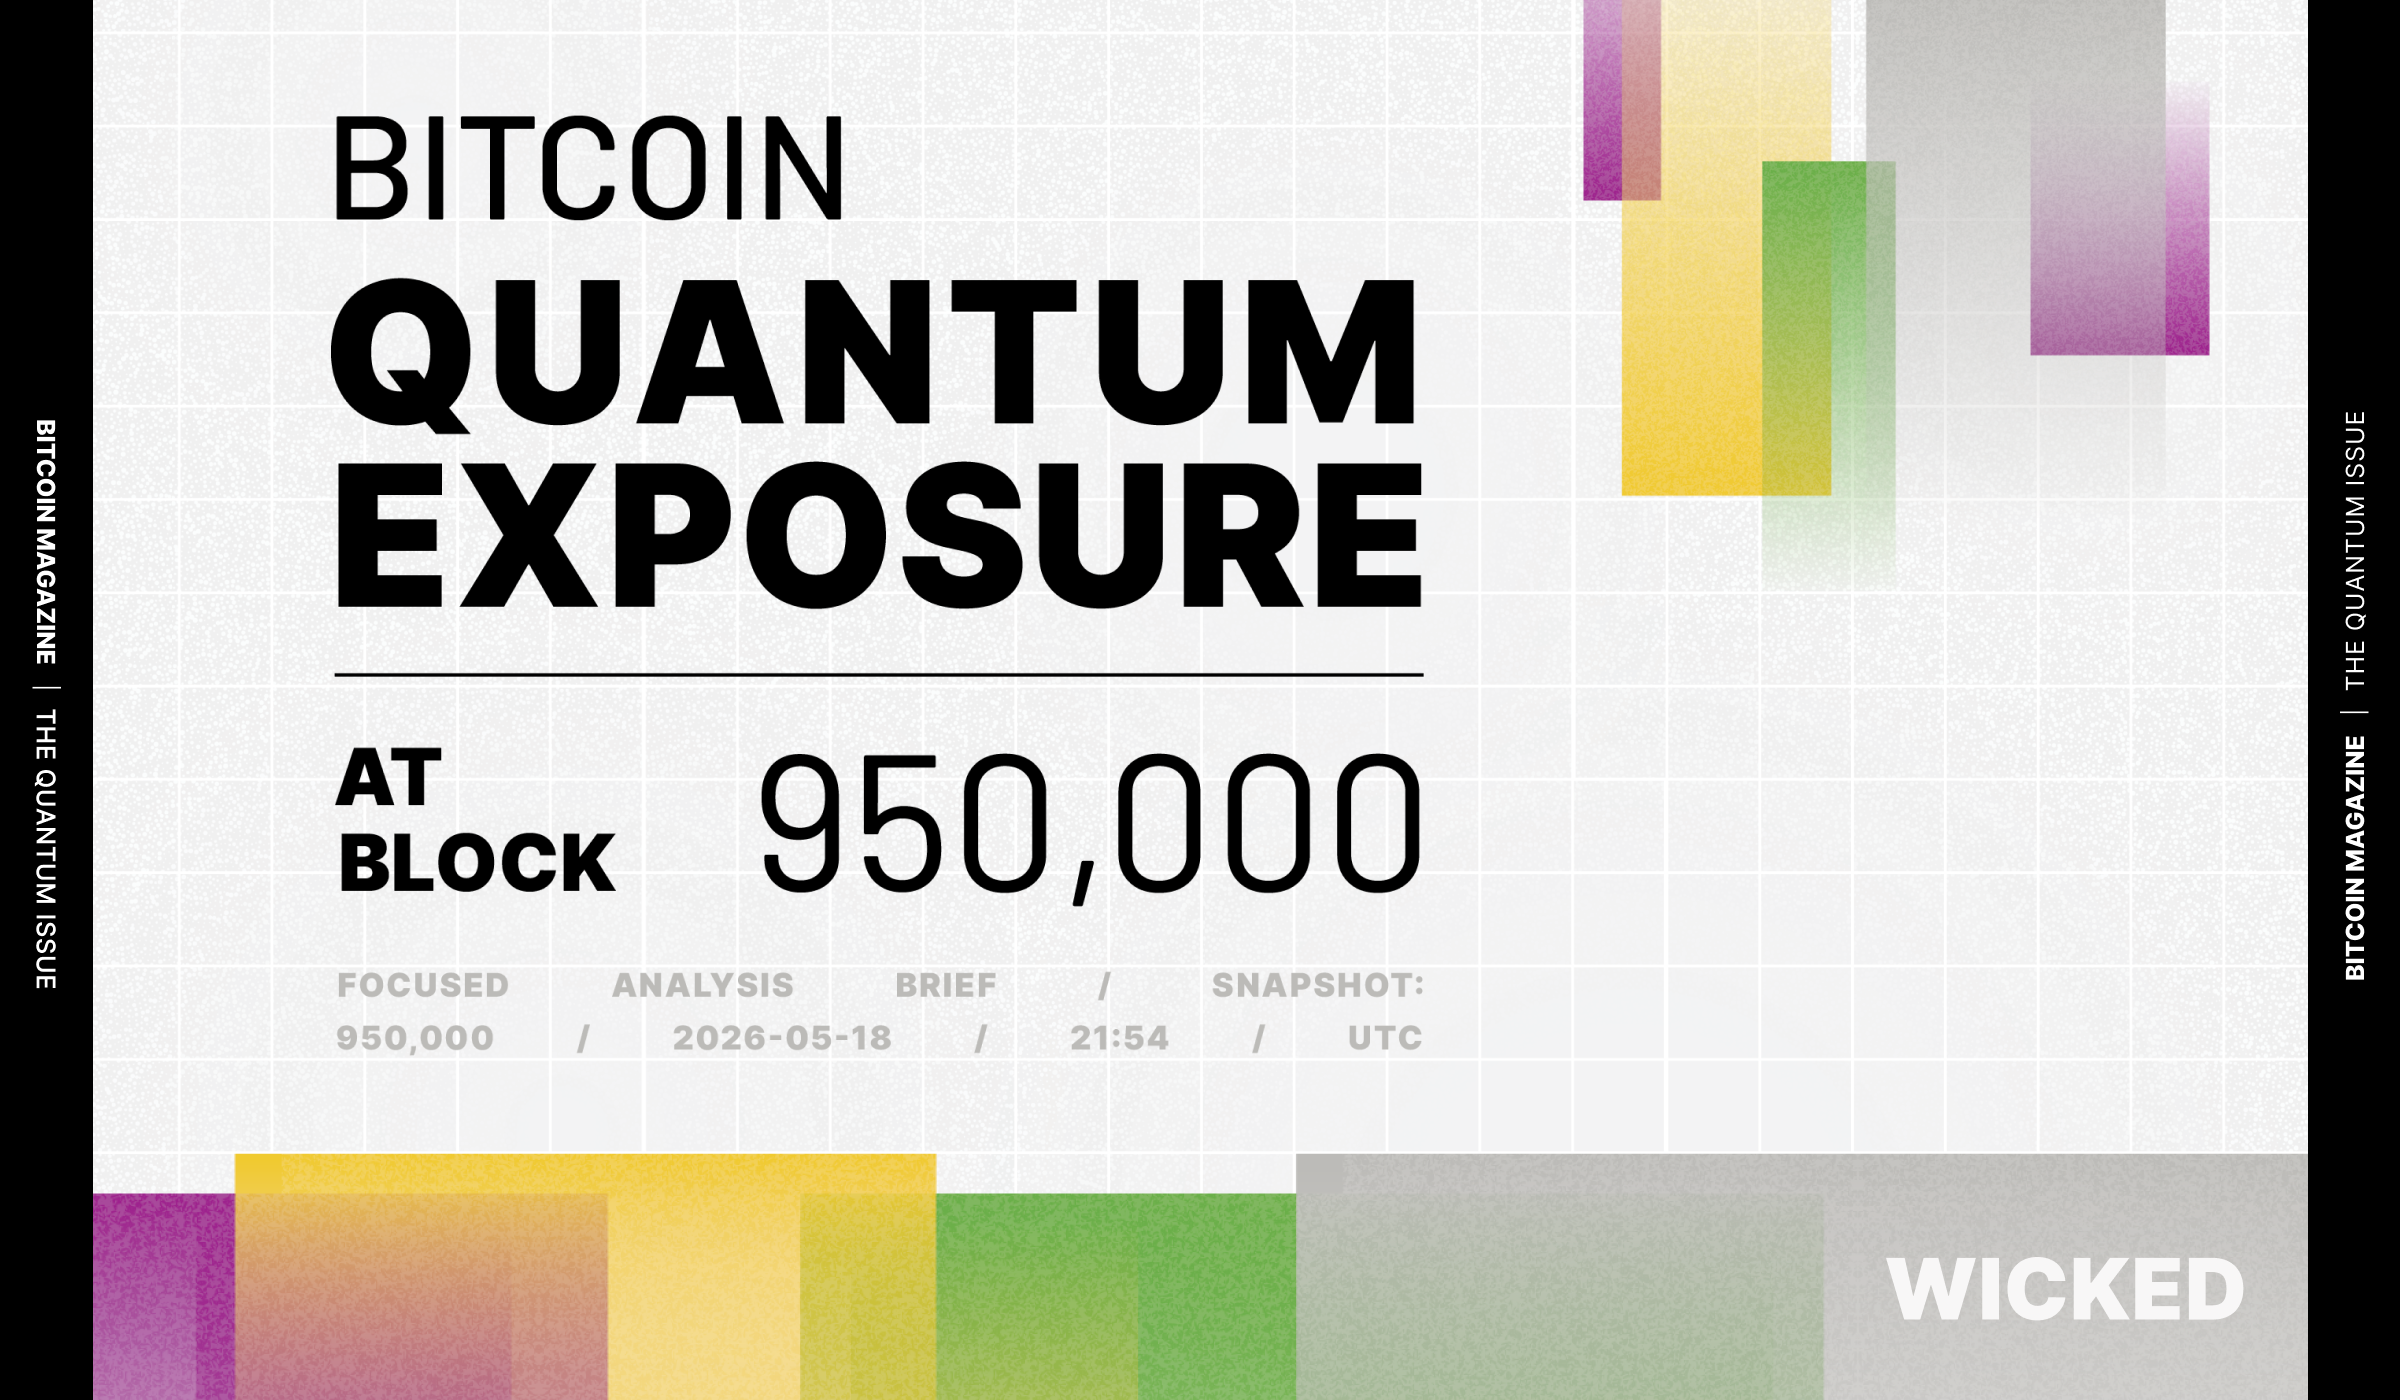
The Quantum Issue: Bitcoin Quantum Exposure at Block 950,000
| At block 950,000, 6.90 million BTC are cryptographically exposed, equal to 34.45% of circulating supply. That headline number should not be read as the amount of bitcoin likely to be lost in a quantum event. Practical risk depends on whether the owner can respond, whether the entity is operationally active, whether the balance is large enough to justify the cost of attacking, and how quickly funds can be migrated. Considering those dimensions, the risk profile is narrower, more concentrated, and more dormant than the raw exposure figure implies. |
| 6.90M BTC Raw exposed supply |
| 34.45% Raw exposed share |
| 3.33M BTC Active >=1 BTC exposure |
| 2.28M BTC Dormant unknown >=1 BTC |
Exposure Decomposition
| View | Exposed BTC | % Supply | % Raw Exposure | Groups | UTXOs | Migration Est. |
| Raw total exposure | 6,900,573 | 34.45% | 100.00% | 16,047,454 | 102,347,011 | ~140.99 days |
| Active, >=1 BTC, 5-year threshold | 3,331,639 | 16.63% | 48.28% | 46,163 | 4,906,508 | ~9.37 days |
| Never-spent + inactive, >=1 BTC | 3,413,767 | 17.04% | 49.47% | 113,627 | 2,669,847 | ~5.29 days |
| Never-spent + inactive, >=1 BTC, known entities removed; Satoshi retained | 2,277,978 | 11.37% | 33.01% | 73,658 | 1,096,018 | ~2.56 days |
| Same filter, >=10 BTC | 2,187,481 | 10.92% | 31.70% | 39,897 | 365,830 | ~23.33 hrs |
| Same filter, >=100 BTC | 351,654 | 1.76% | 5.10% | 675 | 33,573 | ~2.17 hrs |
Migration estimates are useful for relative sizing, not as forecasts of real-world coordination, fee pressure, or user behavior.
Bitcoin Quantum Exposure Analysis Brief – Block 950,000 Page 1
Top-Level Analysis
1. The headline exposure figure overstates practical theft risk.
The raw view shows 6,900,573 BTC exposed, but it intentionally treats exposure as a cryptographic condition: a public key has appeared on-chain. That is the right starting point, but it is not the same as economic loss risk. A live exchange wallet, an institutional multisig, a dormant early address, and an abandoned key can all be cryptographically exposed while having very different abilities to migrate.
2. Active and known-entity exposure is less concerning than raw exposure implies.
The active >=1 BTC filter captures 3,331,639 BTC, or 48.28% of all exposed supply. This is a large amount of bitcoin, but it is concentrated in 46,163 groups rather than millions of unmanaged holders. The largest visible active exposures include operational entities such as exchanges, brokers, custodial multisig operators, stablecoin infrastructure, and mining-related wallets. These entities are among the most likely to monitor quantum developments, coordinate wallet rotations, and migrate before a practical attack window opens.
This does not make the exposure irrelevant. It creates coordination and execution risk. But it is meaningfully different from lost-key risk: active custodial and exchange balances are generally the coins most likely to move first in a credible threat scenario.
3. The core long-term problem is dormant and non-responsive exposure.
When active entities are removed and the view is narrowed to never-spent or inactive balances of at least 1 BTC, exposed supply is 3,413,767 BTC. After removing known operational entities while retaining Satoshi-attributed coins, the remaining exposed supply falls to 2,277,978 BTC across 73,658 groups and 1,096,018 UTXOs.
That 2.28M BTC segment is the cleanest approximation in this dataset of the harder-to-mitigate exposure surface: early holders, inactive self-custody, old address reuse, dormant P2PK outputs, and coins that may be lost or otherwise unable to respond. This is where the practical quantum risk is most persistent.
4. Quantum attack economics make the target set smaller still.
A capable quantum adversary would still face operating costs, limited throughput, opportunity costs, transaction fees, and operational risk. The rational target set is therefore unlikely to be every exposed key. It is more likely to start with the highest-value exposed balances.
Applying balance thresholds shows how quickly the practical attack surface compresses. With known entities removed and only dormant or never-spent balances included, the >=10 BTC view still contains 2,187,481 BTC but only 39,897 groups and 365,830 UTXOs. At >=100 BTC, the target set drops to 351,654 BTC across just 675 groups and 33,573 UTXOs.
Bitcoin Quantum Exposure Analysis Brief – Block 950,000 Page 2
Script-Type and Threshold Observations
Filtered to only show never-spent + inactive balances, known operational entities removed, Satoshi coins retained unless excluded by the balance threshold.
| Script Type | >=1 BTC | >=10 BTC | >=100 BTC | Observation |
| P2PK | 1,715,778 BTC | 1,715,539 BTC | 10,246 BTC | Dominates dormant exposure at lower thresholds because early P2PK outputs are exposed by construction and mostly inactive. |
| P2PKH | 408,789 BTC | 356,368 BTC | 273,865 BTC | Becomes dominant in the >=100 BTC view after Satoshi-era 50 BTC outputs drop out. |
| P2SH | 43,444 BTC | 34,225 BTC | 21,113 BTC | Falls sharply once known operational entities are removed; remaining dormant script-hash exposure is relatively small. |
| P2WPKH | 8,696 BTC | 5,271 BTC | 2,194 BTC | Low in the non-entity dormant view, consistent with more modern wallet behavior and activity. |
| P2WSH | 2,938 BTC | 2,886 BTC | 2,750 BTC | Very small after known-entity removal; much broader P2WSH exposure is likely institutional and active. |
| P2TR | 98,327 BTC | 73,193 BTC | 41,486 BTC | Always exposed at the key level, but the high-value dormant non-entity subset remains limited. |
Displayed totals may differ by a few BTC from KPI totals due to dashboard rounding at the script-type level.
Important threshold note
The apparent crossover from P2PK dominance at the >=10 BTC threshold to P2PKH dominance at the >=100 BTC threshold should not be interpreted as P2PK risk disappearing. It is primarily a filter artifact: the Satoshi-attributed P2PK outputs in this dataset are 50 BTC per key, so they are included at >=10 BTC and excluded once the pubkey balance threshold exceeds 50 BTC. That exclusion causes the P2PK bucket to collapse from roughly 1.716M BTC to about 10k BTC in the >=100 BTC view.
Bottom Line
| The strongest reading of the block-950,000 snapshot is that Bitcoin has a large cryptographic exposure surface but a much narrower practical exposure surface. Active known entities make up a major share of exposed supply, yet they are also the most likely participants to migrate quickly. The more persistent risk is concentrated in dormant, non-responsive, and possibly lost coins. Once known entities and low-value targets are filtered out, the economically attractive target set becomes very small: 351,654 BTC across 675 groups at the >=100 BTC threshold. Quantum exposure is therefore best understood as a concentrated dormant-coin problem, not a uniform risk across all exposed bitcoin. |
Data source: Bitcoin Quantum Exposure Dashboard snapshot at block 950,000. This analysis assumes the dashboard methodology PDF supplied separately to the editor.

This piece is featured in the latest Print edition of Bitcoin Magazine, The Quantum Issue. We’re sharing it here as an early look at the ideas explored throughout the full issue.
This post The Quantum Issue: Bitcoin Quantum Exposure at Block 950,000 first appeared on Bitcoin Magazine and is written by Wicked.
Bitcoin Magazine
Russia’s Sberbank Given Green Light to Custody Bitcoin
Russia’s largest bank has announced it is the first in the country to have been approved to custody bitcoin.
Sberbank said in an announcement Wednesday that the Bank of Russia gave the company the green light for “digital currency record-keeping” and to facilitate the transfer of such assets. It said that bitcoin and other, smaller cryptocurrencies were given approval.
Russia is fast moving ahead with regulating digital assets in the country. Russian President Vladimir Putin this month signed a law to set in stone the regulation of digital currencies and digital rights in the country.
JUST IN:
— Bitcoin Magazine (@BitcoinMagazine) October 7, 2026Russia's largest bank Sberbank, has received approval to offer digital asset custody services starting with Bitcoin
pic.twitter.com/lbhXspcHtd
“Customers will be able to conduct cryptocurrency transactions via SberBank Online, SberInvestments, and the SberBusiness online banking platform,” the bank said in a statement, adding that no new apps or platforms will be released.
It added: “For users, this means that digital currency transactions are moving into familiar banking interfaces — complete with standard customer identification, transaction monitoring, and reporting.”
Before mass rollout, the bank will provide the service for a limited number of customers, it continued.
Sberbank in July revealed plans to debut a Bitcoin and crypto wallet as well as digital asset custody by December. The Bank of Russia in July published draft regulations for crypto trading, and the State Duma has this year prepared the comprehensive regulation of digital assets.
Despite the rollout, using digital assets as a means of payment or legal tender within Russia is still banned. Using crypto as a form of payment has been prohibited in Russia since 2022.
President Putin has appeared to praise Bitcoin in the past, once saying that the leading cryptocurrency can’t be stopped.
This post Russia’s Sberbank Given Green Light to Custody Bitcoin first appeared on Bitcoin Magazine and is written by Mathew Di Salvo.
CryptoSlate
OpenAI’s latest advances in mathematics have prompted a leading Ethereum researcher to warn that crypto’s core wallet security could face an unexpected AI threat.
On Oct. 7, Ethereum researcher Justin Drake urged the blockchain industry to prepare for what he described as “bunker mode,” including a controlled migration of digital assets into fresh addresses whose public keys have never been exposed.
Drake said large and sophisticated holders should consider moving most of their assets to addresses that have never signed transactions. Once those addresses are used to send funds, he recommended transferring any remaining balance into another fresh address.
His warning followed OpenAI’s Oct. 6 release of a broad collection of new mathematical results produced by an internal frontier model.
The company said it tested the model across thousands of problems, published many of the resulting proofs with computer-checkable Lean formalizations and spent the equivalent of about three hours of ChatGPT Pro reasoning on the average result.
Drake argued that the accelerating pace of AI-driven mathematical discovery should force the crypto industry to reconsider assumptions about how long elliptic-curve cryptography will remain secure.
“In the worst case,” he said, an effective break of the Elliptic Curve Digital Signature Algorithm, or ECDSA, could arrive “in months, not years.”
OpenAI’s announcement does not report a practical attack on ECDSA or RSA. Drake’s months timeline is a worst-case conjecture, not a demonstrated capability.
Drake warns AI could shorten crypto’s security timetable
Bitcoin and Ethereum rely heavily on elliptic-curve cryptography to establish ownership and authorize transactions.
Standard Ethereum externally owned accounts use ECDSA on the secp256k1 curve. Once an account sends a transaction, its public key can be reconstructed from information placed onchain. Someone capable of efficiently deriving the corresponding private key could then take control of the assets.
Standard Ethereum accounts whose public keys remain unexposed have an additional layer of protection: only the address, a hash of the public key, is visible, Ethereum’s documentation says.
The industry has traditionally treated that problem primarily as a future quantum-computing risk.
Ethereum has already established a dedicated post-quantum security effort, with work underway on hash-based signatures, account abstraction and replacements for other cryptographic systems vulnerable to sufficiently powerful quantum computers. Core post-quantum infrastructure is currently targeted for roughly 2029, although the roadmap remains subject to change.
Drake is challenging the assumption that quantum computing will necessarily be the first technology capable of breaking those systems.
He pointed to recent surprises in mathematics and argued that sufficiently capable AI could uncover a classical algorithm that dramatically reduces the difficulty of recovering private keys.
That would change the industry's timetable because it would remove the need to wait for large fault-tolerant quantum computers.
Drake cited the precedent of quantum algorithms occasionally inspiring faster classical approaches and said researchers should remain open to a classical counterpart to Shor’s algorithm, which would threaten both elliptic-curve cryptography and RSA.
Whether such an algorithm exists remains unknown.
Europol separately added urgency to the broader issue, warning that quantum computing could eventually undermine cryptography protecting cryptocurrency wallets and urging the industry to begin preparing before the threat becomes practical. The agency said uncertainty over timing should not delay migration because upgrading systems and coordinating defenses could itself take years.
Crypto holders could start moving before cryptography changes
Drake’s proposed response does not require waiting for new blockchain infrastructure.
Drake proposed moving funds to addresses that keep public keys hidden behind hashes and avoiding unnecessary outgoing transactions. That protection depends on the address type: Bitcoin Taproot outputs expose a public key from the outset. Taproot also uses Schnorr signatures rather than ECDSA, although both rely on the secp256k1 curve.
Drake urged large custodians to lead that transition, specifically naming Binance, Bitbank, Robinhood, Bitfinex and Tether as firms with an opportunity to harden cold-storage practices.
He also recommended more aggressive precautions for critical blockchain infrastructure. Oracles and layer-2 security councils, for example, could rotate ECDSA keys after signing messages or combine existing signatures with hash-based systems such as SPHINCS.
Those measures would amount to an interim defense rather than a permanent solution.
Drake said his preferred long-term approach would rely heavily on hash-based cryptography, which has less algebraic structure for future AI systems to exploit than elliptic curves, lattices or isogenies.
Ethereum is already moving partly in that direction. Its post-quantum roadmap includes hash-based validator signatures and mechanisms designed to let individual accounts eventually adopt different signature schemes without requiring the entire network to migrate at once.
Drake cautioned against a rushed migration, warning that hurried transfers could create more risk than they remove. But he said Ethereum’s existing timelines should now be revisited as AI changes the assumptions underlying them.
Ethereum’s second annual post-quantum research retreat is scheduled for Oct. 9 to Oct. 12, while Drake said he plans to address institutional participants in London next month as he pushes for faster defensive preparations.
The post OpenAI math breakthroughs raise ‘bunker mode’ alarm from Bitcoin researcher Justin Drake appeared first on CryptoSlate.
XRP traded around $1.43 on Oct. 7, down 5.46% over 24 hours. Five tracked US spot XRP ETFs held an estimated $1.7 billion at the previous day's close, according to market data tracker Maketo.
The holdings total is accumulated exposure. The latest net flows were much smaller, and the ETF sector contained withdrawals as well as additions: Franklin and Canary recorded outflows on Oct. 6, even though the five funds collectively received net inflows. The exchange-wallet decline used to support a supply-squeeze story also includes a storage migration that left coins under the same exchange's control.
ETF inflows and wallet withdrawals tell a smaller story
Maketo estimated that its five tracked funds held $1.7 billion, or about 1.13 billion XRP, at the Oct. 6 close. It values the coins at its own daily closing price and estimates some holdings when issuers do not publish a coin count.
Its flow data for the same date showed $3.14 million of aggregate net inflows. The past-week total was roughly $3.9 million, alongside $112 million over the past month. The weekly and monthly figures cover the tracker's trailing periods.
The rounded daily breakdown showed about $11 million entering Bitwise's fund. Franklin recorded roughly $4.1 million leaving, while Canary lost about $3.3 million. Grayscale and 21Shares were flat. Bitwise's additions outweighed withdrawals elsewhere, leaving the sector positive.
Canary's shares-outstanding table shows its share count moving from 23.35 million on Oct. 5 to 23.14 million on Oct. 6, consistent with net redemptions. That identifies a fund where exposure was being reduced, without naming the investors or showing where any underlying XRP changed hands.
There is also a distinction between investors selling ETF shares on an exchange and shares being redeemed from the fund. Individual shares trade in the market, while authorized participants handle creation and redemption units.
The exchange picture is also mixed. An Oct. 7 reading from ledger data tracker XRP Insights, taken at 08:00 UTC, counted 21.98 billion XRP in 699 publicly attributed wallets across 24 exchanges. That includes cold storage and some reserves backing wrapped tokens, so it is broader than readily tradable inventory.
Selling can also occur within an exchange's pooled customer accounts. As an accounting matter, XRP moving from one customer's ownership to another's need not alter the exchange's total on the ledger. That lets sellers trade existing exchange inventory even while coins are being withdrawn.
Comparing the same wallets over seven days, the tracker reported a decline of 26.5 million XRP, or 0.13%. Binance-attributed balances fell by 33 million XRP, while Upbit's rose by 11.5 million.
The monthly figure looked much more dramatic: a 1.63 billion XRP decline. XRP Insights attributed most of that fall to an Uphold storage migration into newer wallets outside its tracked set. Excluding Uphold, the decline was 75 million XRP, or 0.54%.
Even the adjusted measure can include transfers into untracked wallets. A recorded withdrawal may reflect an exchange moving its own storage rather than customers taking coins away.
Ripple's Oct. 1 cycle released 1 billion XRP and re-escrowed 700 million, according to XRP Insights' ledger tracker. The remaining 300 million left escrow; that change in availability does not establish that the coins were sold.
Heavy futures trading leaves price leadership unresolved
At 14:29 UTC on Oct. 7, CoinGlass recorded $3.97 billion of XRP futures turnover over 24 hours against $801.56 million of covered spot turnover. Open interest stood at $3.35 billion. Its XRP price reading was $1.4308, down 5.46% over the same rolling day.
Futures activity was roughly five times the covered spot figure. Gross turnover counts trading activity rather than net bearish exposure, leaving open whether futures sellers led the price move or followed it.
Open interest includes outstanding long and short positions. To distinguish a leveraged unwind from fresh positioning, price, funding and liquidation data need to be considered together. A fall in open interest alone would not establish forced liquidations.
The backdrop also extends beyond XRP. Bitcoin was around $83,100 in CryptoSlate's Oct. 7 snapshot, below its Oct. 6 reference close of $85,557.56.
The dated redemptions identify where ETF exposure was reduced. The dominant XRP sellers remain unidentified. The next useful signals are stronger net ETF additions, exchange movements traced beyond storage migrations, and derivatives data showing how positions changed during the fall.
The post XRP ETFs now hold $1.7 billion but took in just $4M last week appeared first on CryptoSlate.
Ethereum’s slide toward $2,500 has put about $1.35 billion of leveraged long positions at increasing risk of liquidation.
CoinMarketCap data showed roughly $1.35 billion of ETH long exposure sat at liquidation levels below the prevailing price, compared with about $999.78 million of shorts vulnerable above it. The figures represent positions exposed across a range of lower price levels rather than a single liquidation threshold.
The nearest pressure point is already approaching. About $112.83 million of ETH longs on Hyperliquid were positioned to liquidate around $2,511, CoinMarketCap said. When ETH traded at $2,605.65, the distance to that level had narrowed to about 3.6%, compared with a 7.4% cushion a day earlier.
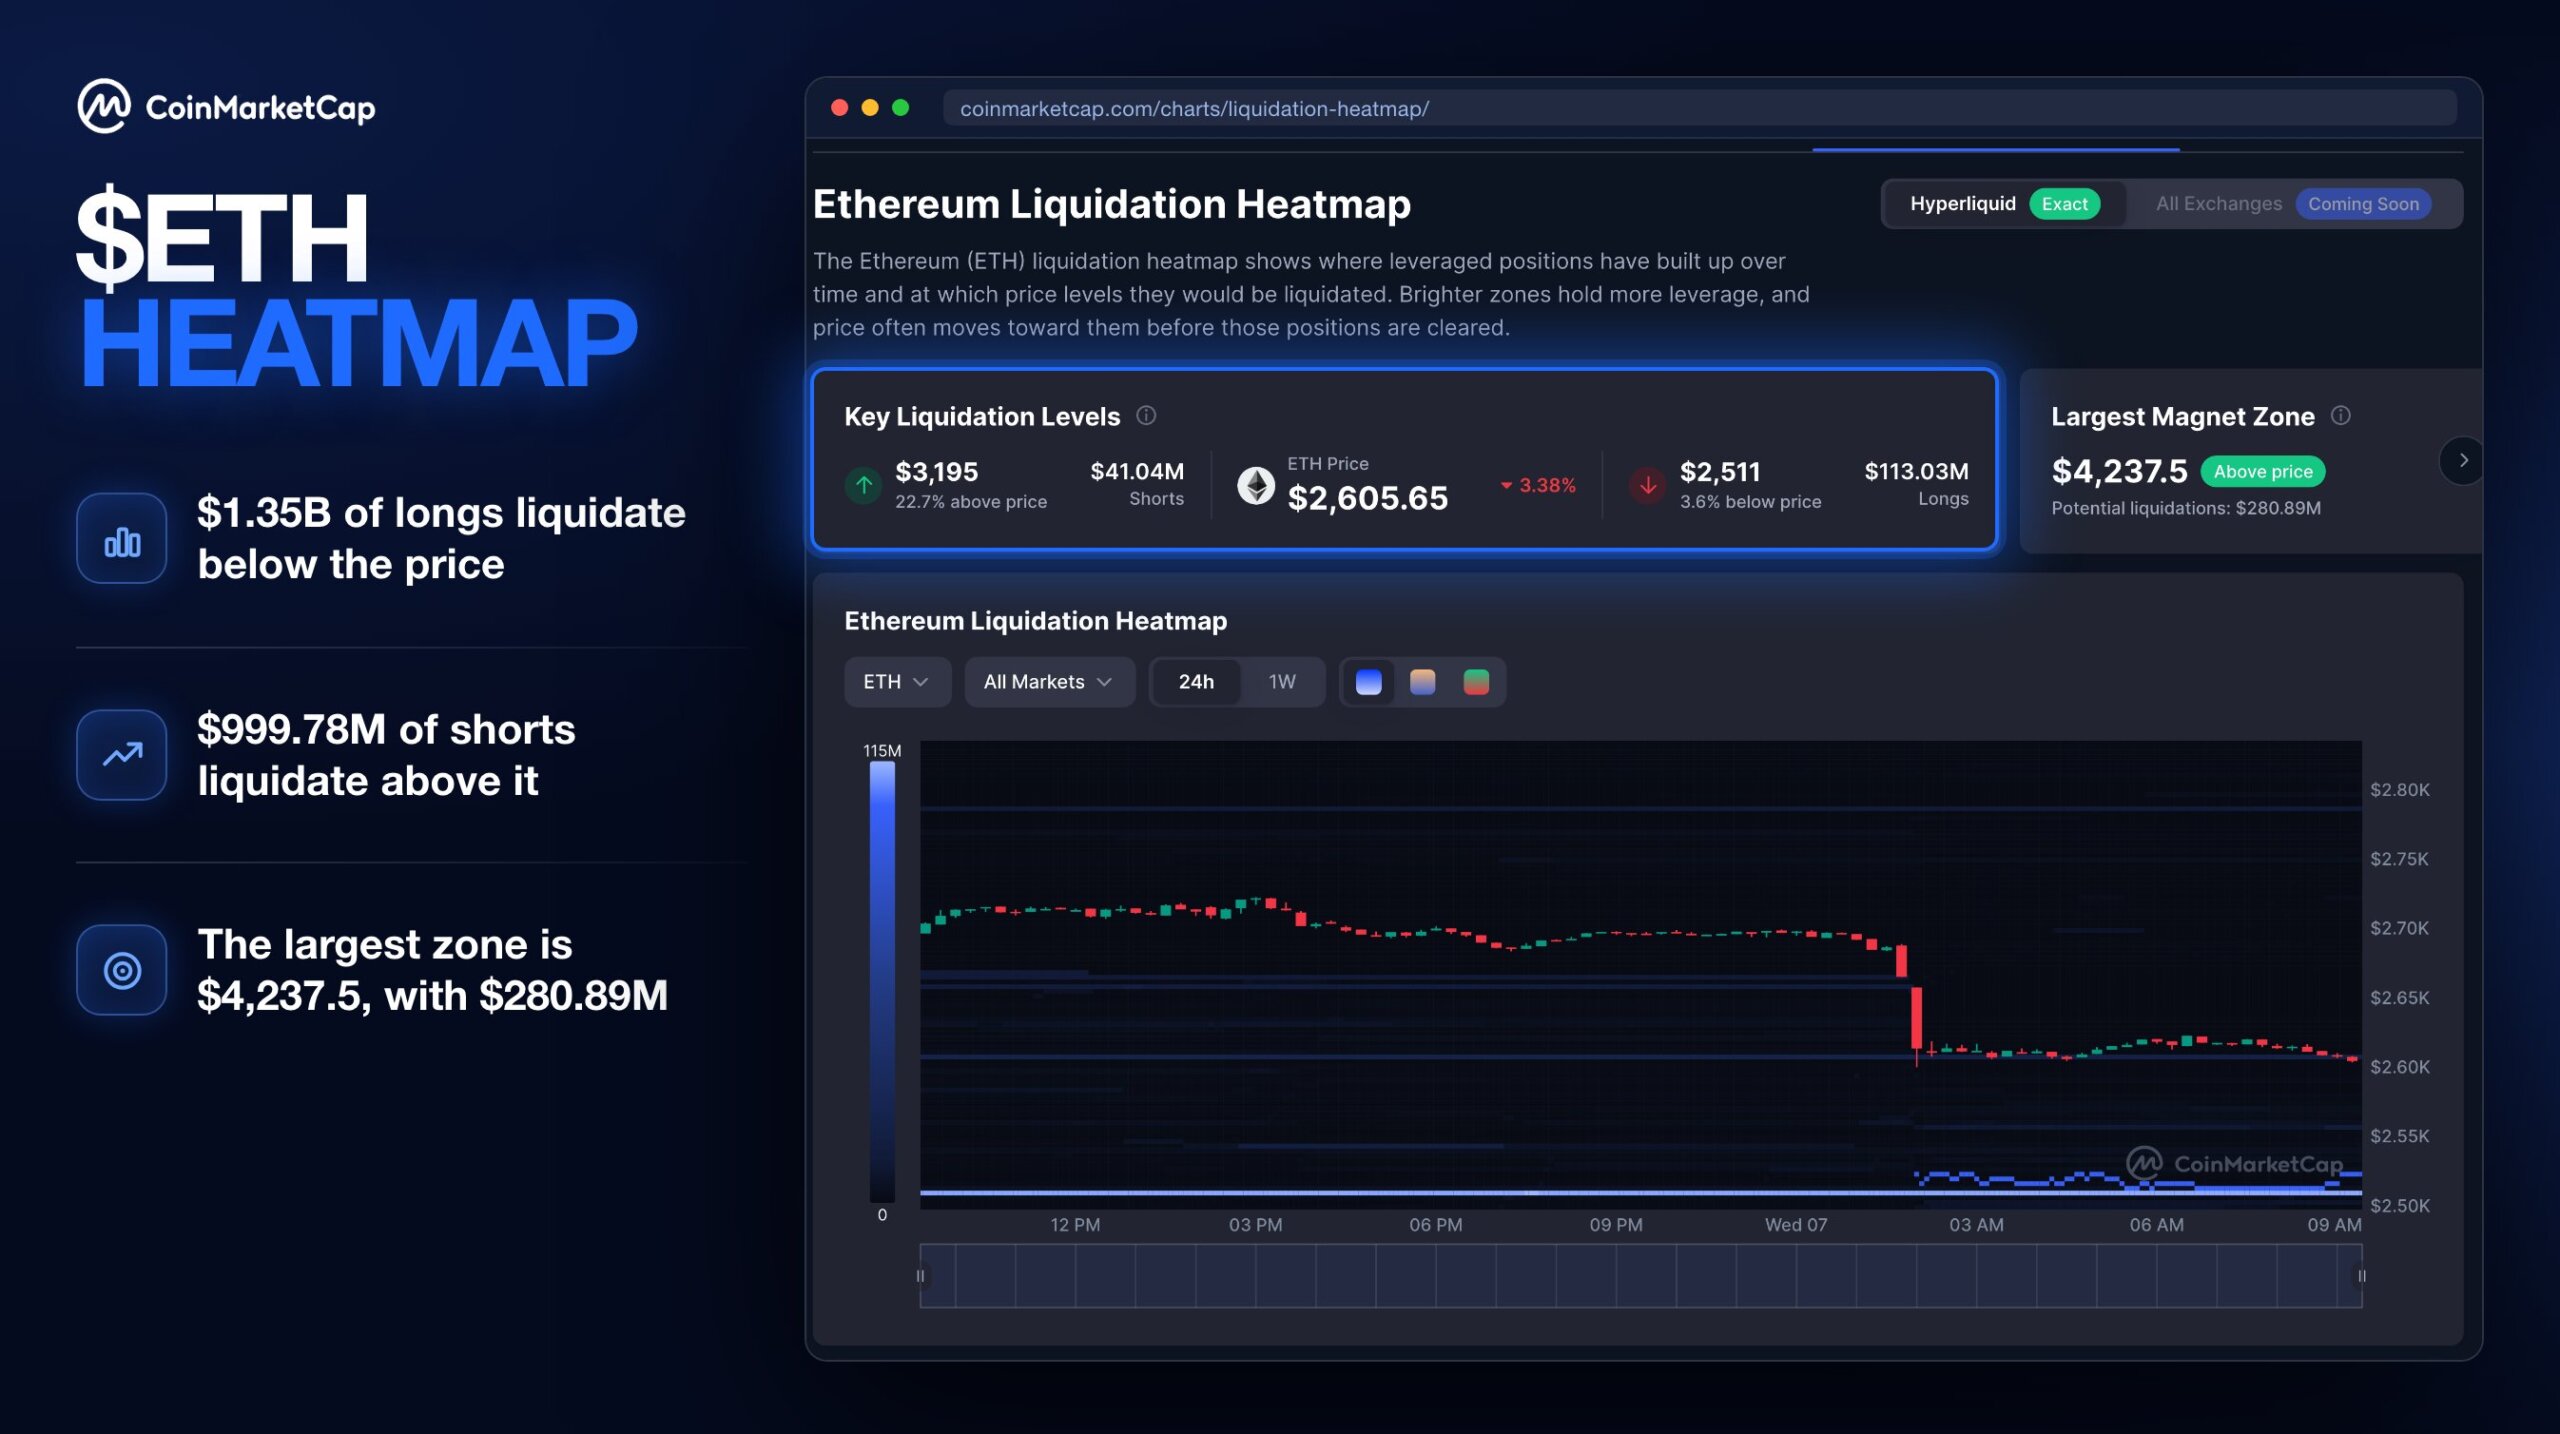
The risk comes after ETH fell 5.9% over the last 24 hours to $$2,570 as of press time, according to CryptoSlate's data, extending a break from the $2,700 area that had contained the token despite several days of institutional selling.
ETH longs take the first hit as $2,500 comes into focus
Available data shows that the latest price break triggered a sharp wave of forced closures before Ethereum has even reached the nearest major liquidation cluster.
CoinGlass data showed $233.36 million of ETH positions were liquidated over the last 24 hours, with long traders accounting for $221.87 million, or about 95% of the total.
Of this, roughly $226.22 million was wiped out over 12 hours, including $216.11 million of long exposure.
Notably, Ethereum also accounted for the largest single liquidation across the broader crypto market, with a $26.64 million ETHUSDC position on Binance forced closed.
The scale of those losses makes the remaining liquidation map more consequential. Liquidation maps do not mean every identified position will automatically be closed. They instead show where leveraged trades become increasingly vulnerable as prices move through successive thresholds.
A continued decline toward $2,500 would therefore test whether the first wave of liquidations has removed enough leverage to stabilize the market or whether another layer of long positions remains vulnerable below it.
However, current market positioning suggests that risk has not disappeared.
CoinGlass showed a 3.32 long-to-short ratio among Binance ETH/USDT accounts, while the comparable ratio on OKX stood at 2.13. Binance’s largest traders were also skewed toward longs, with a 2.34 ratio by accounts and 1.62 when measured by positions.
Those metrics do not measure the dollar value committed to either side, but they show bullish positioning remains widespread even after more than $220 million of long bets were erased.
Funding rates, however, have turned negative.
Data from CoinGlass shows Ethereum’s open-interest-weighted funding rate stood at -0.0041%, while its volume-weighted rate was -0.0034%. Negative funding indicates stronger demand for short exposure, with short sellers paying longs to maintain perpetual futures positions.
That shift raises the prospect of increasingly crowded positioning on both sides if traders continue buying the decline while others add shorts after the breakdown.
ETF withdrawals remove another source of support
Ethereum’s weakening price is also coinciding with a sharp deterioration in demand for US spot Ether ETFs.
The funds recorded about $202 million of net outflows on Oct. 6, their largest single-day withdrawal since Sept. 16. The move extended the current outflow streak to six sessions and brought total withdrawals during the run to roughly $408 million.
The latest withdrawal also marked a significant acceleration. Investors had pulled almost $206 million from the funds across the previous five sessions combined, meaning Oct. 6 alone nearly matched that amount.
Ether had initially absorbed those withdrawals while holding near $2,700, suggesting ETF selling was not immediately translating into weaker prices. That resilience has now broken, with another large outflow arriving as ETH slipped toward $2,500.
Despite the recent retreat, the funds have accumulated $13.55 billion in cumulative net inflows since their launch, according to SoSoValue, leaving the latest withdrawals as a reversal within a much larger pool of institutional capital already committed to Ethereum.
Nonetheless, the outflows put greater focus on whether institutional investors begin treating the lower price as an entry point or continue reducing exposure.
Continued redemptions would remove a source of spot demand at a time when Ethereum is already struggling to regain its previous range. A reversal in flows, however, could signal that investors see the latest decline as an opportunity rather than the start of a deeper pullback.
The post Ethereum falls 6%, leaving $1.35 billion in long bets at risk of liquidation appeared first on CryptoSlate.
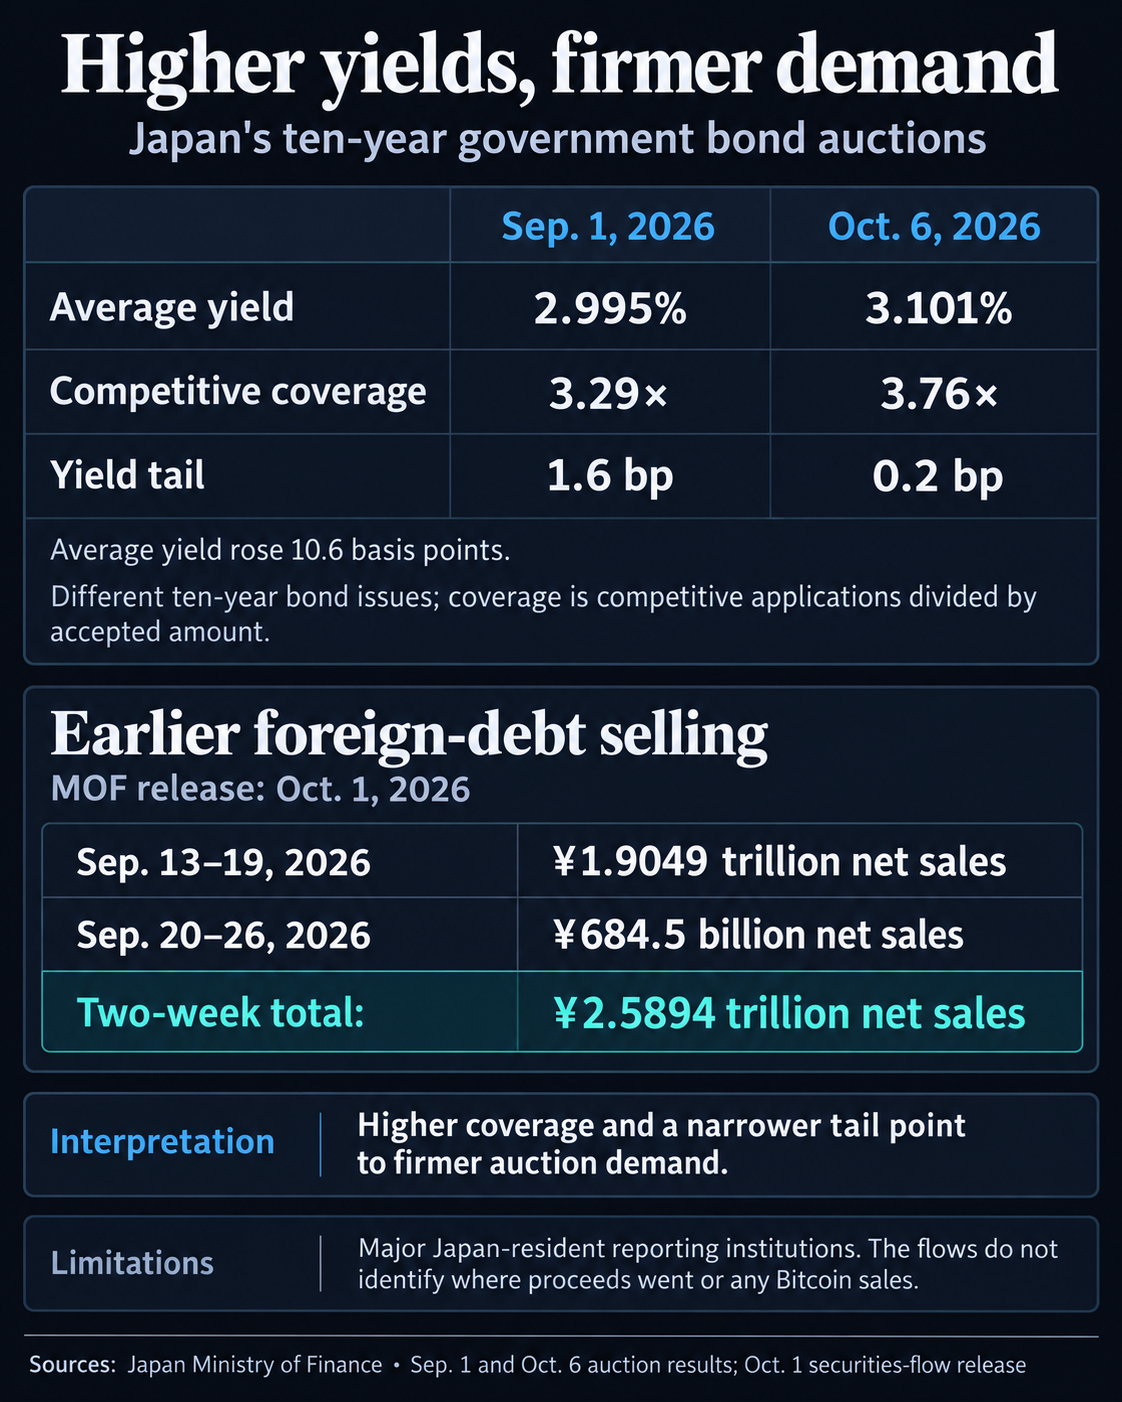
Japan’s October 6, 2026 auction of ten-year government bonds attracted more competitive demand relative to the debt sold, even as its average yield rose to 3.101%. For Bitcoin, higher returns on Japanese debt raise a question about how a sustained shift in bond allocation could affect global financing.
The Ministry of Finance’s result put the average yield up from 2.995% at the September 1 sale, an increase of 10.6 basis points. Competitive auction coverage, the amount sought by participants divided by the amount accepted, rose from about 3.29 times to 3.76 times.
The yield tail narrowed from 1.6 to 0.2 basis points. That gap measures the yield at the lowest accepted price against the average yield. Alongside the higher coverage, the smaller tail points to firmer demand at the higher yield.
The backdrop is two earlier weeks of foreign-debt selling. MOF’s October 1 flow release recorded net long-term debt sales of ¥1.9049 trillion during September 13–19 and ¥684.5 billion during September 20–26. Together, those weekly observations amount to net sales of ¥2.5894 trillion.
The series covers designated major Japan-resident reporting institutions and classifies foreign securities by issuer residence. It does not identify US Treasury sales, currency conversion, reinvestment into Japanese government bonds or Bitcoin transactions.
The potential financing pressure on Bitcoin
If Japanese institutions persistently prefer domestic bonds over overseas debt, reduced foreign bond demand could raise borrowing costs and weigh on capital available for risk-taking.
The authors of a Bank for International Settlements working paper identify global funding conditions and speculative motives as important drivers of cross-border Bitcoin and Ether flows. Their 2017 to mid-2024 sample supports the relevance of funding conditions to crypto flows.
Institutional portfolio allocation also differs from leveraged yen carry trades, which involve positions financed with borrowed yen. A ten-year auction yield does not measure the short-term cost of that borrowing. In their August 2024 analysis, BIS researchers described how deleveraging and margin increases amplified that month’s market turbulence. It illustrates how financing stress can spread across markets, without demonstrating a current unwind.
The next useful evidence is whether foreign-debt selling continues alongside independently observed funding stress. That pattern would be consistent with the proposed Bitcoin financing channel; renewed buying and calm funding would weaken the interpretation.
The post As Japanese institutions sell ¥2.6 trillion in foreign debt, here’s what Bitcoin investors need to watch appeared first on CryptoSlate.
Bitcoin traded below $84,000 on Oct. 7 as US Treasury yields near 5.3% offered investors a competing interest-bearing alternative. Higher yields can raise the return investors expect to justify speculative crypto exposure.
The historical relationship is less straightforward. CryptoSlate's comparison of 2,435 matched daily changes since January 2017 found weak linear relationships between Bitcoin returns, nominal and real Treasury yield changes, and dollar-index returns. The daily relationships also remained weak in the post-ETF trading period.
The US ten-year nominal par yield was 5.27% on Oct. 6, down from 5.31% a day earlier. Bitcoin's market price was about $83,086 at 14:25 UTC on Oct. 7. The Oct. 5 nominal yield was the highest observation in the daily series examined, which begins in January 2017.
Bitcoin nevertheless gained 84.2% from January 10, 2024, the day before US spot Bitcoin ETF trading began, through Oct. 5, 2026. Over that period, the ten-year nominal yield rose 127 basis points and the real yield rose 113 basis points. This measures Bitcoin's price performance and shows that rising yields and a rising Bitcoin price can coexist; it establishes no ETF-driven explanation for the gain.
The inflation-adjusted alternative has strengthened too. Treasury's ten-year real par yield stood at 2.91% on Oct. 6, down from 2.95% the previous day. The Oct. 5 reading was also the highest in the daily series examined since January 2017.
Those levels describe the reward available from a competing interest-bearing alternative. They can make speculative exposure harder to justify, but they do not establish that a yield increase caused Bitcoin's latest decline. Today's investment hurdle and the measured relationship between Bitcoin returns and yield changes are separate questions.
What the post-ETF comparison shows
The full daily sample runs from Jan. 4, 2017, through Oct. 5, 2026. The post-ETF sample covers 682 matched daily changes from Jan. 11, 2024, through Oct. 5, 2026.
The later window follows the SEC's historical approval of spot Bitcoin ETP shares on January 10, 2024. BlackRock's IBIT began trading on Nasdaq on January 11, 2024. Those dates define the comparison period; the analysis does not isolate the effect of ETFs.
The table shows Pearson correlations. Values near zero indicate little linear co-movement, while a negative value means the variables tended to move in opposite directions. Neither yield measure had a strong negative daily relationship with Bitcoin returns in the later sample.
| Bitcoin daily returns versus | Since January 2017 | Post-ETF trading |
|---|---|---|
| Ten-year nominal yield changes | -0.004 | +0.054 |
| Ten-year real yield changes | -0.047 | +0.042 |
| ICE DXY returns | -0.098 | -0.089 |
The comparison uses Coinbase Bitcoin observations, nominal Treasury yields and real Treasury yields from FRED, alongside DXY observations distributed by Yahoo Finance. DXY is the ICE currency index, a different measure from the Federal Reserve's broad trade-weighted dollar index.
Observations were matched by date, with missing data omitted rather than filled. Returns between consecutive common dates can span weekends or holidays. Closing times differ across the series, so the comparison does not use synchronized intraday observations.
Monthly sampling changes the picture. Across 116 full months from February 2017 through September 2026, correlations were -0.081 for nominal yield changes, -0.228 for real yield changes and -0.164 for DXY returns.
For the 32 full post-ETF months from February 2024 through September 2026, those figures were +0.207, +0.126 and +0.002, respectively. Both yield relationships turn positive in the later monthly sample, while the dollar relationship approaches zero. With only 32 observations, those shifts do not establish a lasting change.
Monthly figures use the last common observation date in each month, excluding October's incomplete month. The change across frequencies limits any broad conclusion from the daily results, including claims that ETFs insulated Bitcoin from macro conditions. These correlations describe co-movement and do not establish causation or predict future returns.
S&P Global's pre-ETF research also found that crypto's relationship with interest rates varied over time and did not establish monetary-policy causality. Its different crypto and rate measures make its coefficients unsuitable for direct comparison here.
Yields near 5.3% can make the competition for capital more demanding. Nominal yields, real yields and DXY provide context for assessing Bitcoin's appeal.
The post Bitcoin price has risen 84% since January 2024 while Treasury yields climbed appeared first on CryptoSlate.
CryptoTicker.io
If a crypto exchange becomes insolvent and you later get something back, what decides the crypto tax is not the size of the payment but its form. If the same coins return into your control, nothing has happened for tax purposes: acquisition date and acquisition cost run on unchanged, and a holding period that expired long ago stays expired. If money arrives instead on a filed insolvency claim, the event is an entirely different one, and the tax authorities have not expressly regulated it to this day.
That difference is the whole article. It concerns many German investors right now, because several large proceedings are stuck in the wind-up phase and a deadline at Mt. Gox expires on October 31, 2026. Both routes are set out below in detail, along with the evidence question on which most cases turn in practice.
Two Routes Out of the Proceedings: Segregation in Coins or an Insolvency Claim in Euros
When insolvency proceedings open, the assets split into two pots. Everything belonging to the debtor forms the insolvency estate and is distributed among the creditors. What belongs to a third party, even though it sits with the debtor, is not part of it. For that case the German Insolvency Code provides for segregation: under Section 47 InsO, a person holding a right in an object that does not belong to the estate may demand its surrender. They are then not an insolvency creditor but an owner reclaiming their property.
Whether that route is open to you depends on the custody arrangement. If your coins sat in a holding that was separated from the exchange's own assets and attributed to you, much speaks for segregation. If they were mingled in the exchange's pooled wallets with the holdings of every other customer, the result is as a rule a simple insolvency claim under Section 38 InsO: a monetary claim valued as at the opening date which brings only a dividend in the end. We have written up the legal side of that distinction in a separate piece on segregation in an exchange insolvency, and how a filing works in practice is shown by the zondacrypto case.
Why This Classification Comes Before the Tax Question
The tax treatment follows the classification under civil law, not the other way around. Anyone who does not know whether they will get coins or a monetary claim back cannot determine the tax consequence. In case of doubt, the answer sits in the insolvency administrator's letter and in the schedule of claims: if a claim is listed there in euros or dollars, you are an insolvency creditor.
Surrender of the Same Coins Is Not a Disposal Within the Meaning of Section 23 EStG
Under settled case law, crypto-assets are “other assets” within the meaning of Section 23(1) sentence 1 no. 2 of the German Income Tax Act (EStG). The Federal Fiscal Court decided this in its judgment of February 14, 2023, and the Federal Ministry of Finance circular of March 6, 2025 carries that classification forward. Gains from a sale of privately held assets are therefore taxable only if no more than one year lies between acquisition and disposal.
The two terms are decisive. An acquisition is the acquisition from third parties for consideration. A disposal is, as its mirror image, the transfer of the acquired asset to third parties for consideration. Both presuppose consideration and a change of legal owner. When an insolvency administrator surrenders your own coins to you, they are fulfilling a claim for surrender. You pay no consideration for it, and ownership does not change hands but merely becomes accessible again. On that definition there is no private disposal, and the return itself triggers no tax.
One qualification belongs here: the Ministry circular does not deal with the insolvency case separately at this point. The classification follows from the general definitions set out in it, and not from any statement by the tax authorities on insolvency proceedings.
On Surrender, the Holding Period From the Year of Acquisition Runs On
The one-year periods of Section 23 EStG begin anew after every exchange of assets. A surrender is not an exchange, so nothing begins anew. For you that usually means good news: whoever bought in 2021, lost access in 2022 and receives the same coins back in 2026 holds assets whose holding period expired years ago. A sale after that is tax-free for privately held assets, regardless of how far the price has risen in the meantime.
Conversely, the same mechanism also works against you if the acquisition fell shortly before the collapse and the surrender came quickly. Then the period may still be running. For the total gain of a calendar year, the exemption threshold of Section 23(3) sentence 5 EStG remains: if the sum of all private disposals stays below €1,000, it stays tax-free. Up to the 2023 assessment period that threshold stood at €600. This threshold applies to all private disposals of one year taken together, not per coin.

Mt. Gox: The Extended Repayment Deadline Ends on October 31, 2026
The most concrete date for those affected in Germany comes from Japan. By a notice from the Rehabilitation Trustee of October 27, 2025, the trustee of the Mt. Gox proceedings moved the deadline for the base repayment, the early lump-sum payment and the intermediate repayment from October 31, 2025, to October 31, 2026, Japanese time. Japan is eight hours ahead of Germany, so for you the effective moment still falls on the preceding day.
As the reason, the trustee names that many creditors have not completed the necessary procedural steps to this day, among them identity verification and the lodging of payment details. It is already the third postponement of this kind. Anyone still waiting will find the particulars in our piece on the Mt. Gox repayment deadline. In tax terms the date matters because it fixes the assessment period in which the inflow falls.
The Dividend in Money Meets an Open Point in the Ministry Circular
The second route is the harder one. In the large proceedings, customer claims are not satisfied in coins but valued in money as at the opening date and later paid out as a dividend. At FTX, which opened Chapter 11 proceedings in November 2022, that is the basic structure of the wind-up. In economic terms you therefore receive money for coins you never sold.
On the wording of Section 23 EStG this can be read in two directions. One reading holds that a transfer to third parties for consideration is missing: the coins have perished in the estate, and the dividend is repayment on a claim, hence not a disposal and not taxable. The other reading sees the disposal event already in the conversion of the coins into a monetary claim. It would then turn on whether more than a year lay between the acquisition and the opening of the proceedings, which is almost always the case for holdings from the years before 2022.
Both readings lead to the same result for legacy holdings, namely no tax. They diverge only where the acquisition fell shortly before the collapse. The Ministry circular says nothing about the dividend payment from insolvency proceedings. If your case turns on that question, it is the case for a binding ruling from the tax office under Section 89(2) of the German Fiscal Code or for a tax adviser, and the facts belong openly in the return rather than quietly in a single line.
Payment in US Dollars: The Foreign Currency Balance Is an Asset of Its Own
Here lies a trap that has nothing more to do with the coins. Large proceedings pay out in US dollars. A foreign currency balance is, taken on its own, likewise an “other asset” within the meaning of Section 23(1) sentence 1 no. 2 EStG. With the inflow of the dollars you acquire that asset, and a one-year period of its own begins for it.
If you exchange the dollars into euros within that year and the dollar has gained against the euro in the meantime, a taxable gain can arise from it. That holds even if the underlying coins were long since unobjectionable for tax purposes. The exemption threshold of €1,000 applies here too, because it is the same category of income. Anyone holding the dollars for longer than a year has the question off the table.
Which Units Count as Returned Is Determined by Individual Attribution and FIFO
If only part of your holdings comes back, the question arises which units these are. The Ministry circular names the principle of individual attribution for this. Where individual attribution is not possible, the crypto-assets of one trading designation acquired first count as disposed of for the holding period, and the average method is to be applied for valuation. For simplification it may be assumed that the units acquired first were disposed of first, that is, first in, first out.
On top of that comes a wallet-based view: within one wallet the method chosen is to be retained until all units of that trading designation there have been disposed of. The account at the insolvent exchange was, in this logic, a unit of its own. Anyone who bought there in several tranches over the years has to reconstruct the order before calculating anything at all.

Paragraph 89: Missing Records Are Borne by the Taxpayer
The hardest sentence for those affected sits not in insolvency law but in tax law. The Ministry circular states verbatim at paragraph 89: “Missing records and data losses (for example because of the insolvency of the trading platform or as a result of a hacker attack) are borne by the taxpayer.” The insolvency of the exchange is thereby named expressly, and it is no excuse.
In practical terms that means: the tax office does not have to believe that you bought in 2017 merely because the platform has disappeared. The burden of evidencing the acquisition and its date rests on you. What usually carries weight are bank statements of the original transfer, archived transaction overviews, old confirmation emails from the exchange, blockchain transfers to an address of your own, and the documents from the insolvency proceedings themselves, that is, the filing of the claim and an extract from the schedule of claims. How such a line of evidence is built up, we worked through in the case of stolen coins.
For Foreign Trading Platforms, the Extended Duty to Cooperate Applies
Mt. Gox was wound up in Japan, FTX in the United States and the Bahamas. Almost every known proceeding therefore concerns a foreign operator, and the Ministry circular holds a tightening ready for exactly that. Where crypto-assets are acquired or disposed of through the central trading platforms of a foreign operator, that establishes an extended duty to cooperate under Section 90(2) of the German Fiscal Code. You must then not merely disclose the facts but clarify them and procure the necessary evidence. Expressly named is the regular and complete retrieval of transaction overviews for as long as the platform still exists.
For the tax reports of private providers the circular draws a clear line: a report can carry the audit trail if it appears plausible, is coherent in itself and does not contradict other findings of the authority. Obviously missing acquisition costs or missing trading platforms argue against plausibility. Adjustments and corrections, by contrast, do no harm where they are marked as such and reasoned comprehensibly, for instance because acquisition data is missing after an insolvency. Anyone who has to bring several sources together will find in our comparison of crypto tax software and portfolio trackers the programs that deliver exactly that consolidation and the settings extracts required.
Total Loss Without a Dividend: Section 23 EStG Knows No Write-Down to Zero
If proceedings end without a dividend, or with a dividend close to zero, the question of the loss suggests itself. The answer is uncomfortable. A loss under Section 23 EStG presupposes a disposal event just as a gain does. If the holding falls away without replacement and nothing is transferred, that event is missing, and for privately held assets no loss arises that you could deduct under Section 23 EStG.
Even where a loss is recognised, it is tightly fenced in. Under Section 23(3) sentence 7 EStG, losses may be offset only up to the amount of the gain you achieved from private disposals in the same calendar year. An offset against employment income, interest or share gains is ruled out. Section 23(3) sentence 8 EStG does at least allow a carry-back to the immediately preceding year and a carry-forward to the following years, but there too only against gains of the same kind. Which routes remain in an individual case, we have compiled under crypto total loss and tax.
Self-Custody Takes the Insolvency Risk Out of the Calculation
Everything described above arises only because a third party holds the keys. Coins in a wallet of your own never pass into the control of an exchange and therefore never into an insolvency estate. The question of segregation, dividend and opening date does not arise at all then, and the acquisition records sit in your own documents rather than in the books of a company that can disappear.
You pay the price for it elsewhere, namely in the key risk. Whoever loses the recovery words has no administrator with whom to file a claim. Which programs are suitable for your own custody and where their limits lie is shown by our comparison of software wallets. For larger holdings, separating the trading balance from the long-term holding remains the simplest rule: only what you really intend to move sits in an account belonging to a third party.
Exchange Insolvency: Your Next Three Steps
- Clarify the form of the return and gather the evidence. Read in the administrator's letter whether coins will be surrendered to you or a claim is being listed in money, and file purchase receipts, transfers and old transaction overviews in one place. A tool from the comparison of crypto tax software holds the acquisition records together with the settings extract the tax office wants to see for plausibility.
- Move the recovered holding into your own custody. What comes back out of proceedings does not have to land on the next trading account. A device from our hardware wallet comparison takes the holding out of every future insolvency estate, and the transfer to an address of your own is not itself a taxable event.
- Choose your future trading venue by authorisation and custody segregation. Whether a segregation succeeds when it matters is decided years earlier by the question of whether customer holdings are kept separately. Our overview of regulated crypto exchanges shows which providers are subject to European supervision.
(As of October 7, 2026. This article is not investment advice. Prices and fee structures change; check the terms with the provider before you buy.)
The Dogecoin price stands at $0.0886 on Wednesday evening, below the nine-cent mark for the first time in days. In euros that is €0.0791. The day's low was $0.0880, the day's high $0.0940. Over 24 hours DOGE is down 5.4 percent, over seven days 5.9 percent. The more important number, however, is not in the price but beside it: the entire meme segment has melted down to $33.2 billion and now carries only 3.9 percent of the altcoin market. For you as an investor, what hangs on it is whether the levels at $0.0871 and $0.0828 hold or whether the market takes the next step down.
Dogecoin Price on Wednesday Evening: $0.0886 and a Day's Low at $0.0880
Dogecoin is quoted at $0.0886 on the evening of October 7, 2026. Its market value stands at $13.84 billion, enough for twelfth place among all cryptocurrencies. Trading turnover over the past 24 hours comes to $1.18 billion.
Over 30 days it is down 1.4 percent, over one year down 64.4 percent. DOGE sits 87.9 percent away from its all-time high of $0.7316, reached on May 7, 2021. That span is the real frame for any decision: whoever buys today is entering a sideways phase at the lower edge of a long downward cycle, not a running uptrend.
Supply in circulation comes to 156.2 billion DOGE. Dogecoin has no fixed cap. The protocol issues 10,000 DOGE per block, which adds up over a year to around five billion new coins. That inflow is constant, and it is the reason an absent surge in demand weighs more heavily on the DOGE price than on a coin with falling issuance.
Meme Segment Down to $33.2 Billion: Our Own Count of October 7
For this article we counted the market value of the entire meme segment ourselves rather than adopting someone else's figure. The basis is the category data of a public market data provider, reconciled with the global market values of the same reading. 771 categories were examined, 18 of them meme categories with a stated market value. cryptoticker.io compiled this analysis itself on October 7, 2026.
The result: the meme segment carries $33.18 billion. The whole crypto market stands at $2.846 trillion. Bitcoin holds 58.8 percent of it, Ethereum 11.0 percent. That leaves $859.5 billion for all remaining coins. Measured against that remainder, the meme segment comes to 3.86 percent; measured against the whole market, to 1.17 percent.
15 of the 18 meme categories are down over 24 hours. The segment as a whole loses 5.0 percent. The retreat therefore concerns the entire class and not Dogecoin alone.

2.7 or 3.9 Percent: Two Routes to the Same Meme Share
Since October 6 the figure of 2.7 percent has been circulating in the industry. The analyst Darkfost published the value on the data platform CryptoQuant, and it was picked up by outlets including FXEmpire. Darkfost describes the value as the lowest reading in the history of that analysis.
Our own measurement arrives at 3.86 percent. The divergence is not a contradiction but a question of definition. Treat the altcoin market as everything without Bitcoin and without Ethereum, and you get a smaller reference base and therefore a higher share. Count Ethereum and other large assets as part of the altcoin market, and you get a larger base and therefore a lower share. Both numbers describe the same situation: the meme segment has collapsed to a fraction of what it was at the end of 2024.
Meme dominance denotes the share of all meme coins in the market value of a larger reference set, usually the altcoin market. The metric does not measure how well a single coin is doing, but how much risk capital still flows into this segment at all.
For your decision, the direction counts, not the second decimal place. Both routes show the same downward course. So rely on the range of 2.7 to 3.9 percent and not on a single value you read in one article.
Dogecoin Carries 41.7 Percent of the Meme Segment: The Concentration Risk in Numbers
From the same count of our own follows a figure that has been missing from the coverage so far. Dogecoin alone accounts for 41.7 percent of the entire meme segment. Shiba Inu comes to 9.6 percent. Together the two oldest meme coins carry 51.4 percent of the class.
That has two consequences which pull in opposite directions. For one, Dogecoin is not just any meme coin but the reference asset: when capital returns to the segment, statistically it lands here first. For another, the concentration means a recovery of the broad class is barely possible unless DOGE carries it. A glance at the smaller meme categories shows how thin the cover is: the Solana meme category weighs in at $3.50 billion, the Base meme category at $0.30 billion.
Anyone holding a meme position should therefore know that, as a rule, they are not holding a segment but a bet on two names. Spreading across five meme coins lowers this risk less than the number of positions suggests.
Downside Levels: $0.0871, $0.0828 and $0.076
Several analyses describe the technical situation consistently as a rising broadening wedge. The lower boundary of that formation runs between $0.090 and $0.092. At the current reading of $0.0886, DOGE has left that zone to the downside.
The FXEmpire analysis of October 6 names the targets derived from it in three steps: $0.0871 as a pullback to the 0.5 Fibonacci level, $0.0828 at the 0.618 level and $0.076 to $0.077 at the 0.786 level. The last step would correspond to a loss of around 20 percent against the reading at the start of the week.
Then there are the moving averages. The 50-day average sits at $0.088, the 100-day average at $0.086. DOGE is therefore sitting exactly on the first of those two lines. A daily close below $0.085 counts in the same analysis as the trigger for a move towards $0.070.
These numbers are derivations from the chart and not facts about the future. As orientation the values are useful all the same, because many market participants set their stops at exactly these points, which is why such levels often fulfil themselves. As a buy signal they are useless.
Upside Levels: $0.093, $0.102 and the Threshold at $0.1055
To the upside, the first hurdle sits at the 200-day average around $0.093. Above it follows the psychologically occupied ten-cent mark, then a resistance at $0.102. As the point at which the negative chart picture would lapse, the analysis cited names a sustained reading above $0.1055. The upper boundary of the wedge runs at about $0.11.
Between today's reading and $0.1055 lie 19 percent. That is the distance a recovery would have to cover before anything changes structurally in the situation. Anyone working with a short holding period should know that distance before building a position.
Short Ratio 0.68 at CoinGlass: What an Overcrowded Short Trade Can Trigger
The industry portal Parameter reports, citing derivatives data from CoinGlass, that the ratio of long to short positions in Dogecoin has fallen to 0.68, the lowest value in a month. A value below 1.0 means more capital is positioned for falling than for rising prices.
Long-short ratio is the quotient of the volume of all futures positions set for rising prices and the volume of all those set for falling prices. It measures positioning, not conviction.
A short ratio at a monthly extreme has two readings. On the one hand, the value confirms the negative mood. On the other, it creates the material for a rapid counter-move, because any recovery through a heavily occupied level closes short positions by force and thereby generates buying pressure. Both effects are real, and neither can be scheduled in advance.
For you that means one thing above all: if you trade Dogecoin with leverage, the liquidation price is the number that counts, not the price target. At five times leverage, a move of 20 percent against you is enough to end the position. The span between $0.076 and $0.1055 set out above covers 39 percent. If you want to compare the mechanics and the costs of such products, you will find the providers in our overview of perp DEXs.
Holding Period and Exemption Threshold: The Tax Rules for Dogecoin in Germany
In Germany, Dogecoin counts among other assets. A sale therefore falls under the private disposal rules of Section 23 of the German Income Tax Act. Two rules follow from it that influence your net return more than any chart level does.
First, the holding period. If more than twelve months lie between purchase and sale, the gain stays tax-free. Sell within a year, and the gain is taxable at your personal income tax rate.
Second, the exemption threshold. If all private disposal gains of one calendar year together stay below €1,000, no tax arises. If the threshold is exceeded, the entire gain becomes taxable and not only the excess. That is the difference between an exemption threshold and an allowance, and it is confused regularly.
From that follows a concrete calculation for this evening. Anyone who bought DOGE in October 2025 has been outside the period since the start of October 2026. Anyone who bought in December 2025 only reaches the period in December 2026. A sale at $0.0886 a few weeks before the cut-off date costs you the tax advantage for the entire position. So check the purchase date first and the chart level second. Which tools carry the periods cleanly per purchase is shown by our comparison of crypto tax software.
A note for completeness: if you hold Dogecoin through an exchange-traded product rather than directly in your own holdings, this calculation does not apply without qualification. The tax treatment of such products depends on their legal structure and is disputed in parts. Clarify that with your tax adviser before selling.

Buying Route Under MiCA and Custody: Where Your DOGE Sit After the Purchase
Since the European regulation on markets in crypto-assets became fully applicable, providers addressing customers in the EU need an authorisation as a crypto-asset service provider. For you that is not a formalism but the difference between a supervised counterparty and a provider with no European legal framework. Before your first purchase, check whether your provider states the authorisation and which supervisory authority granted it. A side-by-side view of the trading venues available in Germany is set out in our exchange comparison.
After the purchase comes the custody question. If the coins sit on the trading platform, what belongs to you is a claim against the provider, not the private key. With your own wallet, the key belongs to you, and with it the sole responsibility for backing up the recovery words. Dogecoin is supported by the common hardware wallets. Which devices differ, and in what, is set out in the hardware wallet comparison.
A practical tax point comes on top: if you transfer DOGE from the exchange into your own wallet, that is not a sale and triggers no tax. The holding period keeps running. Document the transfer all the same, because at a later sale you have to be able to evidence the original acquisition date.
Liquidity as a Risk: $1.18 Billion in Turnover on $13.8 Billion in Market Value
Daily turnover corresponds to 8.6 percent of market value. For a coin of this size that figure is in the normal range and means usual order sizes are executed without appreciable price movement. It says nothing, however, about the depth of the order book in a phase of stress.
More relevant for most readers is the spread and the fee on purchase. At smaller amounts, the trading fee outweighs any advantage from an entry half a cent better. So add up the total costs of trading fee, spread and, where applicable, withdrawal fee before buying, instead of looking only at the price.
Against Shiba Inu, Dogecoin gains an advantage here: turnover of $1.18 billion stands against turnover of $88 million at SHIB. The greater liquidity is one of the reasons DOGE has so far given way less sharply than smaller meme coins in downward phases.
Dogecoin Position: How to Proceed Now
- Purchase date before chart level. Dig out the acquisition records of your DOGE purchases and check which part-positions have already reached the twelve-month period. Only then do you decide on a sale. A tool that carries the periods per purchase is in the comparison of crypto tax software.
- Note two levels, not five. To the downside, $0.085 as the point from which the analysts bring $0.076 into play. To the upside, $0.1055 as the point from which the negative chart picture would lapse. Everything in between is noise.
- Settle authorisation and custody. Check whether your trading venue states a European authorisation, and decide whether the coins stay there or move into your own wallet. The trading venues are in the exchange comparison, the devices in the hardware wallet comparison.
The meme segment has shrunk to 3.9 percent of the altcoin market, and Dogecoin carries 41.7 percent of that. This concentration works in both directions. On the one hand it makes DOGE the first destination should capital return to the class. On the other it takes away the illusion that a meme position can be meaningfully spread.
(As of October 7, 2026. This article is not investment advice. Prices and fee structures change; check the terms with the provider before you buy.)
Bitcoin holdings on Binance have shrunk markedly in a little over two weeks. According to data from the analytics firm CryptoQuant, cited by several market reports, the trading platform's reserve stood at around 704,800 BTC on September 20 and at only around 663,100 BTC on October 5, 2026. That is 41,700 bitcoin less, a decline of 5.9 percent of the stock held there.
The price did not absorb it. Bitcoin is quoted at around $83,400, or roughly €74,500, on October 7, 2026, and is therefore 2.5 percent below the previous day's level (price data: CoinGecko). A falling exchange balance and a falling price on the same day look like a contradiction. They are not, and the reason matters more for your own planning than the headline does.
This article sets out what an exchange reserve actually measures, which figures are documented, why this Wednesday's liquidation wave has a cause of its own, and which questions genuinely follow from it for investors in Germany.
Exchange Reserve Explained: What a Trading Platform's Bitcoin Balance Tells You
The exchange reserve is the sum of all bitcoin sitting in a trading platform's known addresses. That balance is not reported by the company but reconstructed from the blockchain by analytics firms: whoever can attribute addresses to an exchange can count its holdings. CryptoQuant is one of these providers.
The common reading goes: coins on an exchange are ready to sell, coins in a private wallet are not. If the reserve falls, the supply available in the short term falls with it. That interpretation has a kernel of truth, but it is cruder than it sounds. Some of the movements arise when a platform reshuffles internally, spreads holdings across new addresses or switches custody partners. Such transfers look like an outflow in the statistics, without a single customer having sold or withdrawn anything.
What a Reserve Figure Cannot Tell You
A reserve figure says nothing about who owns the coins, whether they are pledged as collateral for loans, or whether a single large investor or ten thousand retail customers sit behind the withdrawal. A reserve figure is a signal about quantity, not about motive. Reading it as a forecast overstretches it.
41,700 Bitcoin in 15 Days: The Numbers on the Binance Outflow
The key values are consistent across several reports; the dollar figures are not. The reports round the withdrawal to "up to 40,000 bitcoin" and put it at around $3.3 billion. The difference between the two reserve readings, by contrast, comes to 41,700 BTC, and at the price on October 7 that would correspond to about $3.5 billion. The range of roughly $3.3 billion to $3.5 billion therefore comes solely from which price and which day the calculation used.
Within that period, one single day stands out: the largest daily net outflow came to around 14,300 bitcoin. That is more than was withdrawn in the whole of the preceding week, in which around 13,800 bitcoin left the platform. Daily peaks of that kind point to a handful of large addresses rather than to a broad withdrawal wave across many retail accounts.
23,100 Bitcoin in Seven Days: The Largest Weekly Outflow Since June 2023
The description "largest in three years" refers to the weekly view, not to the full two weeks. In the seven days to September 27, net outflows added up to around 23,100 bitcoin. That is the highest weekly figure since June 2023.
The comparison with that period puts it into perspective, however. In June 2023 the same platform lost 44,942 bitcoin in a single week, almost twice as much. One Korean market report notes explicitly that the two cases should therefore not be equated. Anyone drawing the parallel should name the difference in scale along with it.
An analyst who publishes at CryptoQuant under the name Darkfost has pointed to the same weekly figure. In the firm's reading, outflows of this order of magnitude are accumulation: bitcoin that leaves the exchange is no longer available to the order book as selling pressure in the short term. Historically, the outflow of June 2023 was followed by a recovery from around $26,300 to $30,500. That is a historical parallel and not a forecast; the situation in 2023 differed considerably from today in interest rates, market size and regulation.

The Price Falls Anyway: Around $550 Million in Liquidations in One Day
On October 7, 2026, according to CoinGlass data quoted in several market reports, crypto positions worth about $550 million to $555 million were force-liquidated within 24 hours. Around $487 million of that fell on long positions, meaning bets on rising prices. Total market capitalisation gave up 3.8 percent to around $2.925 trillion.
That is the decisive point behind the apparent paradox: the reserve outflow concerns the spot market, the liquidations concern the futures market. Anyone who bought with leverage and whose collateral no longer suffices is closed out automatically, and those forced sales hit the price immediately. A balance that migrates slowly into private wallets, by contrast, works over months.
On top of that comes a macro environment that operates independently of the blockchain. This Wednesday's market reports name higher bond yields, a firmer oil price in connection with tensions around Iran, and the mood ahead of the forthcoming Fed minutes. Ether lost around 5 percent on the same day to about $2,558, and Ethereum ETFs saw outflows of around $201.89 million. The pressure was therefore not on Bitcoin alone.
Why a Falling Exchange Balance Is Not a Buy Signal on Its Own
The accumulation thesis is plausible, but it is an interpretation and not a measurement. Three verifiable objections argue against adopting it too quickly.
First, the attribution question already mentioned: internal reshuffles and changes of custodian cannot be separated cleanly in the data from genuine customer withdrawals. Second, the direction of the money. The same reports describe stablecoins flowing onto the platform in parallel with the bitcoin outflow. Third, the price itself: if supply were the limiting factor, two weeks should show that at least in a stabilisation. Instead, Bitcoin stands lower than at the start of the period.
All that can responsibly be said, therefore, is this: the supply available in the short term at one large trading platform has fallen. Whether a rising price follows from it depends on demand, interest rates and inflows into the exchange-traded products, not on this single figure. You will find an overview of trading venues and their fee models in our comparison of the best crypto exchanges.
Stablecoins Instead of Bitcoin: What the Counter-Movement on the Dollar Side Shows
That bitcoin is flowing out while stablecoins are flowing in is perhaps the more telling signal. A stablecoin is a token pegged to a currency and intended to track its value one to one. Whoever sends stablecoins to an exchange is parking purchasing power there.
This constellation describes market participants who are taking bitcoin out of the platform's custody and setting aside dry powder at the same time. That fits neither the picture of a panicked exit nor that of a broad buying wave; it describes caution with readiness.
What That Means for Short-Term Investors
For someone trading on a horizon of days, the reserve figure is practically worthless, because it moves too slowly to deliver an entry signal. For someone with a horizon of years it is one building block among many, and it is no substitute for an answer to the question of where your own coins actually sit.

Self-Custody or a Regulated Custodian: The Two Routes for German Investors
Behind the term self-custody sits a simple distinction. If the coins sit at an exchange, you hold a claim against a company. If they sit in your own wallet, you hold the private key, and with it the coins themselves.
Both have costs. The exchange takes key management off your hands and carries a counterparty risk in doing so. Self-custody rules that risk out and replaces it with a risk of loss that rests entirely with you: whoever loses the recovery words loses the balance for good, with no hotline and no recovery procedure. A hardware wallet is a device that keeps the private key offline and signs transactions without revealing it.
For most retail investors the question is therefore not a matter of faith but a matter of amount. An amount whose loss would hurt does not belong on a trading account permanently. An amount that is actively traded belongs where the trading happens.
MiCA and the Segregation of Client Assets: The Legal Framework in Germany
Since the European regulation on markets in crypto-assets, MiCA for short, applies in full, providers of crypto services in the EU need an authorisation. In Germany, BaFin grants it and supervises it. Authorised custodians must hold client holdings separately from their own assets and give information on how and where custody takes place.
This segregation is the essential difference from the insolvency cases of 2022 and 2023, in which client balances were mixed with company assets. The segregation is not a deposit guarantee scheme, however: there is no statutory compensation for crypto-assets of the kind that covers €100,000 on bank deposits.
That the authorisation is no mere formality has just been demonstrated in Germany. BaFin has refused the MiCAR licence to the trading venue bitcoin.de; we described the case and the consequences for the balances concerned in detail on October 7, 2026. For you that means: the authorisation status of your provider is a piece of information that can change, and it is held in the BaFin register.
Tax: Transferring to Your Own Wallet Is Not a Sale
A widespread misconception keeps many from withdrawing. Under the German Federal Ministry of Finance's administrative view on crypto-assets, a transfer between two wallets belonging to the same owner is not a disposal. No taxable event therefore arises, and the one-year holding period under Section 23 of the German Income Tax Act keeps running instead of starting afresh.
What matters is the documentation. You still have to be able to evidence the acquisition date and acquisition cost, and to do so across the change of wallet. Anyone carrying out several transfers exports the exchange's transaction history beforehand; after an account closure it is often no longer retrievable. Whether the holding period survives in this form is currently the subject of a political debate whose state we report on continuously. This account does not replace tax advice in an individual case.
Binance Reserve Outflow: Your Next Three Steps
A figure from the blockchain only becomes something usable once it puts a question to your own portfolio. Three steps are worth taking regardless of how the outflow is to be read.
- Look up your trading venue's authorisation status. Is your provider in the BaFin register, and who actually holds the assets there in custody? Our comparison of regulated crypto exchanges offers an overview of authorised providers.
- Set the amount threshold. Decide which amount may stay on the trading account permanently and from which sum self-custody takes over. Which devices come into question and what they cost is shown by our hardware wallet comparison.
- Secure the acquisition records. Export the transaction history before you move larger holdings, and file it with your tax documents. Tools that carry this along automatically are in our overview of crypto tax software.
You can look up the data behind this article yourself: CryptoQuant publishes the exchange reserves per trading venue, CoinGlass the liquidations of the past 24 hours.
(As of October 7, 2026. This article is not investment advice. Prices and fee structures change; check the terms with the provider before you buy.)
Stellar trades at around $0.20 on October 7, 2026, down 6.27 percent in 24 hours. The XLM price hit $0.199392 at its low, the first time in this downward move that it has traded below the round 20-cent mark. No project-specific trigger sits behind it: Stellar is falling in step with a market that is broadly giving way this Wednesday, and a liquidation wave in the futures market pulled it further down.
For you as a holder or a prospective buyer, three things here are verifiable, and none of them is a price forecast: whether a leveraged position sits dangerously close to its liquidation price, whether a sale falls inside the one-year tax window, and where the coins actually sit should an exchange run into trouble. This article places the numbers in context and names the part of it that is in your hands.
Stellar at $0.20: The Trading Day in Numbers
Stellar is quoted at $0.20048, or €0.179156. The range of the past 24 hours runs from a high of $0.214726 to a low of $0.199392, so the price has covered just under seven percent of its band over the day and settled at the lower end. On a weekly view it is down 9.81 percent, while over 30 days it is still up 6.32 percent. That is the real finding: the slide of the past few days has eaten up the monthly gain, but has not yet reversed it.
With a market capitalisation of $7.02 billion, Stellar ranks 20th among the largest cryptocurrencies. Trading volume over the past 24 hours comes to $186.66 million. There are 35.04 billion XLM in circulation out of a total of 50.0 billion, so roughly 30 percent of the total supply has yet to reach the market. The price sits 77.1 percent below the all-time high of $0.875563, set on January 2, 2018. Over one year it is down 48.16 percent.
Where These Numbers Come From
The basis is market data from CoinGecko on the 25 largest cryptocurrencies by market capitalisation, as of October 7, 2026, stablecoins excluded. All 25 entries on that list were checked. cryptoticker.io compiled this analysis itself on October 7, 2026.
The 20-Cent Level as a Round Number on the XLM Chart
Round numbers have no mechanical effect on a price. What they do have is a cluster of orders: sell limits, bids, stop orders and the liquidation prices of leveraged positions all sit conspicuously often on even values when people set them. That is precisely why a level such as $0.20 becomes a zone where more volume changes hands than two cents higher up.
In Stellar's case, the same zone has already played a part twice in this move. In late September, according to our coverage of September 29, the price stood at $0.22; in mid-September it broke above $0.19. The 20-cent mark therefore marks the middle of the band in which XLM has been oscillating for weeks. That the price now sits at the lower edge does not automatically mean it will stay below it. It means the band is being tested from below.
A plain observation applies when placing the levels above and below: above $0.2147, the day's high, lies the next zone where sellers have shown up this week. Below $0.19 the price drops out of the band in which it spent September. Both values appear in this article as observed price levels, not as price targets.

Liquidation Wave in Futures: The Figures Diverge
A liquidation is the forced closure of a leveraged position by the exchange as soon as the collateral posted no longer covers the loss. The exchange then sells into the market automatically, which pushes the price down further and shoves the next position past its threshold. This mechanism explains why price moves appear in minutes with no fresh news behind them.
How large the wave was this Wednesday is reported differently across the trade press, and that spread is left unsmoothed here. Finance Magnates names more than $400 million in leveraged long positions closed within a window of about 20 minutes. Mitrade puts the figure for the day at around $550 million. CoinGape arrives at roughly $700 million over 24 hours, of which about $650 million was on the long side and $50 million on the short side. The direction is the same in all three accounts: it hit almost exclusively positions that had bet on rising prices.
For the market capitalisation of all cryptocurrencies, CoinGape reports a drop to $2.9 trillion, more than $100 billion less than the previous day. These totals are media figures and not our own survey; they appear here with their provenance, because the order of magnitude is what separates an isolated case from a market event.
Bond Yields and Oil as Drivers of the Pullback
The explanation for the pullback lies outside the crypto market. Rising yields on US Treasuries make it more expensive to hold assets that throw off no running income, and Bitcoin and XLM are among them. According to the US Treasury, the yield on ten-year US government bonds stood at 5.15 percent on October 6, 2026. On October 1 it was 5.12 percent, on October 5 it was 5.19 percent. The figure for October 7 had not yet been published at the time of writing.
These numbers matter more than they sound, because a higher yield of around 5.3 percent was circulating in market commentary that day. The official US Treasury series does not confirm that for the days published so far. The level is high and the trend of the past week points upward, yet the jump to 5.3 percent is not documented. Anyone testing the stated reason for the price decline is well advised to test the number along with it.
As a second driver, the market reports from CoinDesk name a firmer oil price with Brent quoted above $101 a barrel, plus a stronger dollar. A third factor is the news flow around Iran, which appears in the same reports as the trigger for renewed selling pressure in the bond market. These three points are attributions by the outlets named, not measurements of our own.
Stellar, Bitcoin and XRP: The Day's Losses Compared
Stellar's decline only falls into place with the larger assets set beside it. Bitcoin is down 2.6 percent at $83,453 and reached a low of $82,823 after a high of $85,788. Ethereum gives up 4.88 percent to $2,567.60, XRP 4.62 percent to $1.43, Solana 3.0 percent to $116.87. Cardano loses 5.42 percent to $0.2574.
At 6.27 percent, Stellar sits at the bottom of that row and is therefore markedly weaker than Bitcoin. This is no special case. It is the usual pattern of a day like this: the smaller the market capitalisation and the thinner the order book, the harder the same volume of selling lands on the price. On daily turnover of $186.66 million, a wave of selling moves XLM visibly more than it moves Bitcoin with its many times the liquidity.
The move had a run-up as early as October 3. Our English coverage from that day described a decline of a good five percent to around $0.214, accompanied by sharply higher altcoin inflows to exchanges, which pointed to profit-taking. Four days later the price is some seven percent lower. The difference between then and now is the driver: back then holders were selling their stacks, today exchanges closed leveraged positions by force.
Funding Rate and Liquidation Price in Leveraged XLM Trading
Two terms decide whether a day like this becomes expensive for you. The liquidation price is the price at which the exchange closes your leveraged position automatically, because the margin posted has been used up. The funding rate is the periodic payment that flows between the long and short sides of a perpetual futures contract and keeps the contract price tied to the spot price; it costs the dominant side of the market money continuously, regardless of where the price goes.
In an environment where several hundred million dollars of long positions are closed in a single day, neither value is a footnote. Anyone holding a leveraged XLM position can read the distance between the current price and the liquidation price in the position overview of their exchange, and widen it with additional collateral or a smaller position. How the platforms display these values and what fees they charge differs considerably; a look at our comparison of the best perp DEXs shows the differences in contract sizes, leverage tiers and liquidation logic.
Without leverage, this risk disappears entirely. A price decline of 6.27 percent then remains a price decline of 6.27 percent and does not turn into a total loss of the position. That is the sober reason a day with a liquidation wave mostly looks unpleasant for unleveraged holders and can become existential for leveraged accounts.

MiCA and the Route to Buying XLM in Germany
Anyone looking to buy or sell in a market like this first makes a decision about the provider. Since the EU's MiCA regulation took effect, trading platforms for crypto-assets need authorisation as a crypto-asset service provider in order to approach customers in the EU; in Germany, BaFin grants that permission and supervises it. For you this is a concrete check rather than a formality: an authorised provider is bound by requirements on segregation of client funds, complaints procedures and disclosure, an unauthorised one is not.
That this authorisation is not a given became clear only yesterday: according to our coverage of October 7, BaFin has refused the MiCAR licence to futurum bank AG, the operator of bitcoin.de. Which platforms hold a permission, and what they charge for buying, selling and withdrawals, is set out in our comparison of the best crypto exchanges. On a purchase of a few hundred euros, the gap between two providers quickly reaches a full percentage point, and that weighs noticeably alongside a price decline of a good six percent.
Holding Period and Loss Offsetting on Stellar Sales
A price decline is not only an annoyance in tax terms; it is first of all a question of dates. On private sales of crypto-assets in Germany, a gain is tax-free after a holding period of one year; within the first year it counts as a private disposal and is taxed at your personal income tax rate. There is an exemption threshold for this, which applies per year and above which the entire gain becomes taxable.
From that follows an order of operations that has nothing to do with the price. Before you sell into a falling market, it is worth looking at the purchase date of every single tranche. If a tranche sits shortly before the end of its one-year holding period, selling today may cost more tax than selling in a few weeks. If you sell at a loss, that loss can be offset against gains from other private disposals within the same category of income, including across tax years.
Running this calculation by hand becomes unpleasant from the third tranche onward, because every part holds its own purchase date and its own entry price. The tools in our comparison of crypto tax software and portfolio trackers read exchange transactions and assign tranches by purchase date. That does not replace a binding tax assessment of your individual case; the tax advisory profession is responsible for that.
Self-Custody: Moving XLM from the Exchange to Your Own Wallet
A day of high volume and fast price moves is the day trading platforms come under load. Self-custody means you hold the private keys to your coins yourself and are therefore independent of whether an exchange happens to be reachable or has halted withdrawals. The price for it is personal responsibility: if the keys are lost, there is no office that resets them.
For Stellar there is a particularity here that matters before the first transfer. An XLM account has to hold a minimum reserve in order to exist on the network; a completely empty account does not exist. Anyone withdrawing their holdings therefore cannot take the last XLM along. On top of that, deposits to exchange accounts at Stellar usually need a memo, because several customers pay into the same address and the memo establishes the assignment. A transfer without a memo lands in the exchange's pooled account and has to be traced by hand.
Which devices support Stellar, and how the models differ in backup procedures and handling, is set out in our hardware wallet comparison. What decides it is less the model than the question of whether you keep the recovery phrase somewhere that survives a house fire and a move.
Stellar Has No Native Staking in the Protocol
Because falling markets regularly bring questions about running income, this clarification belongs here: Stellar has no native staking. The network runs on the Stellar Consensus Protocol, in which selected nodes reach agreement through quorum slices. There is no deposit a holder locks up there, and no protocol reward they receive for it. An inflation payout that existed in the network's early days was switched off in 2019.
What is offered under the name of staking for XLM is therefore something else: a loan to a provider who earns the yield from using the coins themselves. That adds a counterparty risk which simply holding does not carry. Anyone examining such offers examines first who the contractual partner is, and what happens to the deposited coins if that partner becomes insolvent.
Stellar at the 20-Cent Level: The Key Points for Your Decision
The price stands at $0.20, the decline is 6.27 percent over a day and 9.81 percent over a week, and the reason for it lies in the bond market and the futures market, not with Stellar itself. What follows from it is a short list:
- Leverage first. Look at the distance between the price and the liquidation price of every open position, and do not shrink it by buying more on credit. How platforms structure leverage tiers and liquidation logic is shown in the comparison of the best perp DEXs.
- Purchase date before price decision. Look at the date of every tranche before you sell into this market, and factor in the one-year window. The tools in the comparison of crypto tax software assign tranches automatically.
- Settle custody before things get tight. Decide on a quiet day whether the holdings stay on the exchange or move into your own custody, and mind the minimum reserve and the memo at Stellar. The devices are listed in the hardware wallet comparison.
(As of October 7, 2026. This article is not investment advice. Prices and fee structures change; check the terms with the provider before you buy.)
$10 XRP is one of the most searched price targets in crypto, and right now it looks further away than it did a year ago. XRP trades at $1.42 on October 7, 2026, down 4.7% on the day after slipping below the $1.50 level it had defended for two weeks. It is down 22.5% year to date, while Bitcoin is down less than 5%.
That has not stopped the forecasts. Banks, research desks, chart analysts and even AI chatbots have put $10 on the table, some for 2026, some for 2030. In this article we look at who is claiming what, read the current and historical XRP charts, and run the one calculation most of these forecasts skip: what $10 would mean for XRP's market cap, and whether that number makes sense. You can follow the live XRP price on our prices page.
Who Says XRP Can Reach $10 or More?
The $10 forecasts come from very different places, and the dates attached to them range from this December to 2041. Here is what is actually out there.
| Source | Target | Timeline | Reasoning given |
|---|---|---|---|
| Standard Chartered | $10.40, then $12.50 | 2027, 2028 | Institutional adoption, ETF demand, regulatory clarity |
| Standard Chartered (2030 case) | $28 | 2030 | XRP used in financial infrastructure; implies a cap above Bitcoin's today |
| Ryan Lee, Bitget Research | $10 | 2030 | RLUSD stablecoin adoption, possible Ripple IPO |
| Valhil Capital | "Over $10" | No date | XRP replaces pre-funded nostro/vostro accounts at global banks |
| Chart analysts (CoinGabbar) | $10.36 | Mid-2026 to early 2027 | Cup-and-handle pattern, double 201% Fibonacci extension |
| Grok (xAI chatbot) | $10 | End of 2026 | An edited image; Grok itself later called it a fun hypothetical |
| CoinCodex algorithm | $10 | October 2041 | Trend extrapolation |
Three things stand out. First, the serious institutional calls (Standard Chartered, Bitget) all sit in 2027 to 2030, not 2026. Second, the near-term $10 calls rest on chart patterns or on a chatbot meme, and the chart-based one assumed a $3.40 breakout that has not happened. Third, even the bullish 247 Wall St piece that walks through the 2030 scenarios concedes that $10 needs proof of real demand from XRP Ledger activity, not just another bull market. And when Yahoo asked ChatGPT about the Grok call in January, it gave $10 in 2026 an 18% probability and called it an extreme bull case.
XRP Price Today: What Does the Chart Say?
$XRP opened Tuesday at $1.497, sold off sharply around 05:00 UTC to $1.45, and then ground lower for the rest of the session to a low of $1.413 before a small bounce to $1.426. That is a 4.72% daily loss and a clean break below the $1.50 line that had capped and then supported price since the August breakout.
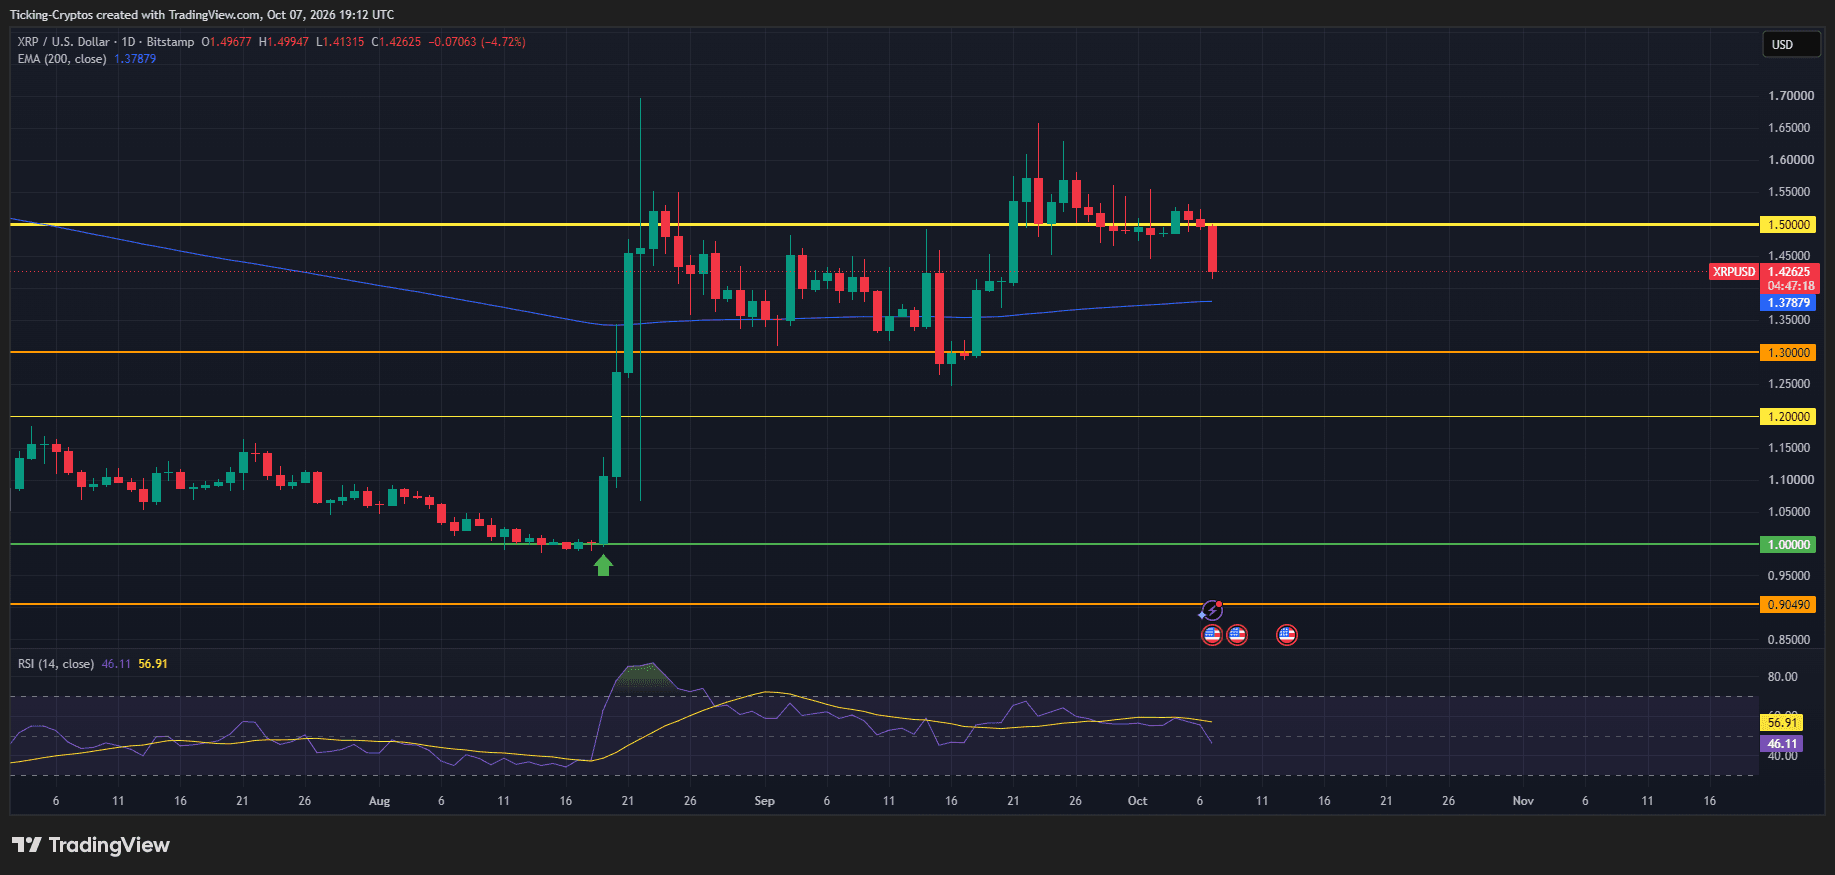
The key levels on the daily chart:
- $1.50: former support, now resistance. Price held above it from September 21 to October 6 and lost it today.
- $1.55 to $1.65: the late-September swing highs. A reclaim of this zone is needed before anyone can talk about $2 again.
- $1.38: the 200-day EMA, currently flat to slightly rising. This is the first real test below. XRP has bounced off this average twice since August, around August 29 and September 11.
- $1.30: horizontal support from the September 16 low, where the last 200-EMA break was bought back within a day.
- $1.20 and $1.00: the August base. The entire move from $1.00 to $1.50 happened in two candles on August 19 and 20, which means there is very little traded volume between those levels to act as support.
- $0.90: the deeper support line sitting under the August lows.
Momentum has turned too. The 14-day RSI dropped from the high 50s to 46, back below its signal line and below the neutral 50 mark for the first time since mid-September. There is no oversold reading yet, so there is room for further downside before a relief bounce becomes statistically likely.
The structure since August is a wide range between $1.30 and $1.65. Today's candle pushes price back into the middle of that range. The 200 EMA at $1.38 decides what comes next: a hold there keeps the range intact, a daily close below $1.30 opens the $1.20 to $1.00 gap. Nothing on this chart points at $10, or at $3 for that matter, in the near term.
XRP All Time High: What Does History Tell Us?
XRP has had three major cycles, and each one tells us something about how far this coin can run and how long it stays down afterwards.
- 2017 to 2018. XRP traded below $0.01 for years, then went vertical in the final months of 2017. The all time high of about $3.84 came in January 2018. The monthly closing high was closer to $2.00, which shows how much of that peak was a single wick. XRP then spent six years below that level and bottomed near $0.15 in March 2020.
- 2021. The next cycle peaked at roughly $1.96 in April 2021, a lower high, and this during a period when the SEC lawsuit kept XRP off most US exchanges. Price fell back to around $0.30 by 2022 and flatlined near $0.50 through 2023 and most of 2024.
- 2024 to 2025. The election-driven rally in November 2024 took XRP from $0.50 to $3.00 in roughly two months. A second push in July 2025 reached about $3.66, just shy of the 2018 record. That was the first time XRP had retested its all time high since 2018, and it failed to break it.
From the July 2025 peak, XRP has fallen more than 60%, touching $1.00 in August 2026 before the current bounce to $1.42. This is the fourth drawdown of more than 60% in XRP's history. Bulls point out that the previous three were each followed by rallies of around 1,000%. Bears point out that XRP has never set a new all time high in eight years and that the 2025 attempt failed at the same price zone as 2018.
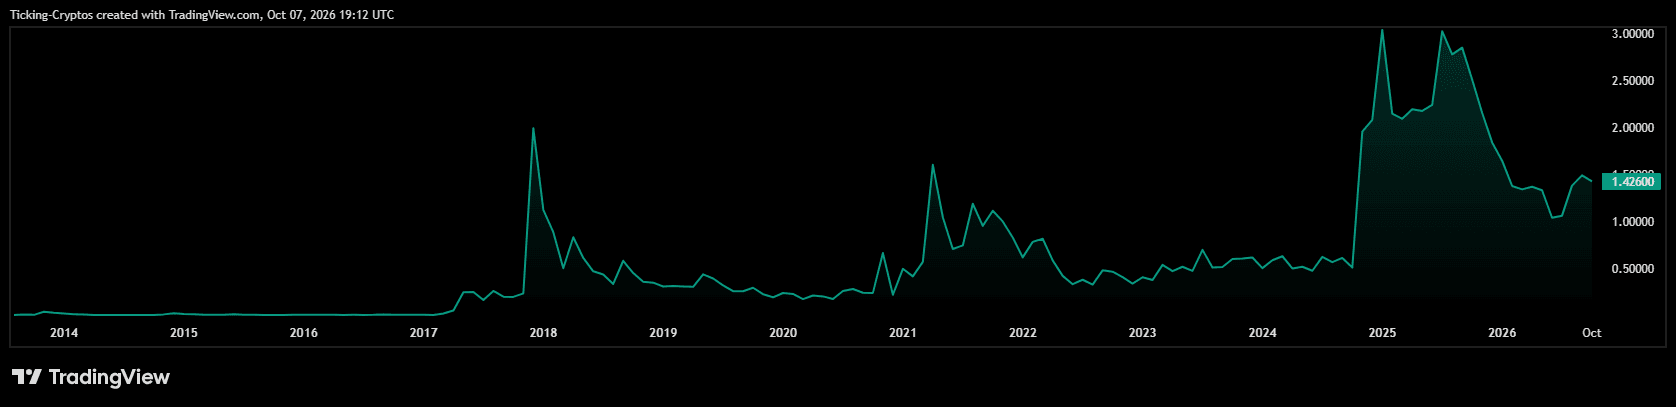
The lesson from history is that XRP moves in explosive, short bursts rather than steady uptrends. Both the 2018 and 2025 peaks were reached in under three months of parabolic movement. The question for $10 is therefore not "can XRP move fast" (it can) but "can it sustain a market cap three times larger than anything it has ever held". That is where the math comes in.
What Would XRP's Market Cap Be at $10?
At $10 per coin, XRP would be worth about $631 billion. The calculation is simple: there are 63.09 billion XRP in circulation today, and 63.09 billion times $10 gives $630.9 billion. Today, at $1.42, the market cap is $89.96 billion, so $10 means growing the market cap seven times over, a gain of 604%.
| XRP price | Implied market cap (63.09B supply) | Where that would rank today |
|---|---|---|
| $1.42 (today) | $90B | #5, behind BNB ($103B) |
| $2.00 | $126B | #4, above BNB |
| $3.84 (all time high) | $242B | #3, below Ethereum ($313B) |
| $5.00 | $316B | #2, roughly level with Ethereum |
| $10.00 | $631B | #2, double Ethereum, 38% of Bitcoin ($1.67T) |
| $28.00 | $1.77T | #1, above Bitcoin today |
A few comparisons put $631 billion into perspective:
- It is more than Ethereum ($313B), Tether ($184B) and BNB ($103B) combined, and roughly a quarter of the entire top-10 crypto market today.
- It is about three times the largest market cap XRP has ever held. At the July 2025 peak of $3.66, with around 58 billion coins circulating, XRP was worth roughly $210 billion.
- Supply keeps growing. Ripple can release up to 1 billion XRP from escrow every month. Even if most goes back into escrow, circulating supply has grown from around 58 billion to 63 billion in a little over a year, which raises the bar for every price target.
- The fully diluted valuation at $10 is about $1 trillion, since total supply is 100 billion XRP. That is where the market would eventually have to settle if escrow is fully released.
For context, Bitcoin needed 16 years, a spot ETF wave and treasury-company buying to reach $1.67 trillion. XRP at $10 would need to get 38% of the way there with a fraction of Bitcoin's ETF holdings. US spot XRP ETFs currently hold around 1.5% to 1.7% of supply versus more than 6% for Bitcoin, according to 247 Wall St.
Can XRP Reach $10? The Bull Case vs the Bear Case
So is a $631 billion XRP possible? Possible, yes. Likely on the timelines most headlines use, no. Here is what each side would have to be right about.
What the bull case needs
- A full crypto bull cycle. XRP has only ever made its big moves when Bitcoin was running. The 2028 halving is the next scheduled catalyst, which is exactly why the credible $10 calls cluster around 2028 to 2030.
- ETF demand to triple or more. ETFs are the one buyer group that kept adding while XRP fell. Getting from 1.7% of supply to 5% or more would absorb a meaningful chunk of escrow releases.
- Real usage on the XRP Ledger. RLUSD, institutional lending (the Clearpool and Cicada proposal), payments and tokenization need to create demand for XRP itself, not just for the stablecoin that runs on top of it. This is the weakest link today.
- A new all time high first. $10 is not on the table until XRP clears $3.84. It has tried once in eight years and failed.
What the bear case points to
- The chart. XRP is down 22.5% in 2026, just lost $1.50, and sits in a range with a 200 EMA that is barely rising. Momentum is pointing down, not up.
- Supply growth. A seven-fold price increase while supply grows means the market cap has to grow by more than seven times. Escrow releases are a permanent headwind that Bitcoin does not have.
- The scale. $631 billion would make XRP double the size of Ethereum, a network with far more applications, fees and developer activity. The market would need a reason to pay that premium.
- Pattern of failed peaks. Both XRP peaks were short parabolic spikes that could not hold. A $10 wick in a frenzy is more plausible than a $10 monthly close.
Our read. A $10 wick during a mania phase around 2028 to 2030 is a tail scenario that cannot be ruled out, because XRP has done 1,000% moves before. A sustained $10, meaning a $631 billion market cap that holds, requires XRP to become the second largest crypto asset by a wide margin with fundamentals to match, and nothing in the current data shows that happening. For 2026, the question is answered by the chart: XRP would need to rise 604% in under three months from a level where it is still losing support.
XRP Price Prediction: Our Verdict on the $10 Target
XRP can reach $10 only in a scenario where the whole crypto market roughly doubles and XRP takes a far bigger share of it than it holds today. That is a 2028 to 2030 story at the earliest, and even then it is a cycle-peak outcome rather than a base case.
- In 2026: no. XRP is at $1.42, below $1.50 and 604% away. Not a single credible source argues for $10 this year; the only one that did was a chatbot that retracted it.
- By 2027 to 2028: unlikely but not impossible. This is Standard Chartered's window and it depends on a full bull market plus ETF inflows that triple. A new all time high above $3.84 would be the first signal that the path is open.
- By 2030: a genuine tail scenario. Bitget and Standard Chartered both land here, and three past drawdowns of 60% were each followed by moves of around 1,000%. A fourth would take XRP from the August low of $1.00 to roughly $10.
What to watch in the meantime is much more mundane: whether the 200-day EMA at $1.38 holds this week, whether XRP can reclaim $1.50 and the $1.65 September high, and whether ETF holdings keep growing while the price does not. Those are the inputs. $10 is the output, and it is a long way off.
Decrypt
OpenAI posted 722 AI-written math manuscripts from an unreleased model, saying most came from a single prompt. Some mathematicians call the claims unverified.
Ethereum Foundation researcher Justin Drake urged holders to calmly move funds to unused addresses, warning that AI-driven math could break crypto signatures before quantum computers do.
Claude Haiku 5.5 costs about 75% less to run than its predecessor and targets high-volume jobs like summaries and live customer support. It arrives 15 days after Opus 5.5.
The House Financial Services chairman credited the SEC and CFTC for stepping in after the Clarity Act's collapse but said only "permanent law change" can secure U.S. leadership.
Tether, issuer of the USDT stablecoin, will help Kazakhstan's central bank study a tenge-pegged token and put real-world assets on a blockchain.
U.Today - IT, AI and Fintech Daily News for You Today
The U.S. government moved roughly $566 million in seized cryptocurrency to Coinbase Prime within hours.
Top Ethereum researcher Justin Drake is urging the crypto industry to prepare for “bunker mode,” warning that rapid advances in AI could potentially expose weaknesses in ECDSA and put wallets with revealed public keys at risk.
Ripple ends the "XRP Killer" narrative by integrating Canton Network to secure Wall Street's RWA pipeline.
Chainlink (LINK) has surged roughly 24% since Sept. 1, but the rally has failed to attract a comparable influx of new wallets, with address growth rising by less than 2%, according to Santiment.
Flare CEO Hugo Philion challenges Ripple’s David Schwartz, using proxy infrastructure to unlock the passive XRP lending market.
Blockonomi
TLDR
- Wells Fargo stock falls 1.53% as Payward crypto liquidity talks gain focus.
- Payward could provide Wells Fargo with liquidity for digital asset trading services.
- Wells Fargo already offers spot Bitcoin ETFs to eligible wealth management clients.
- Payward is expanding bank partnerships through Kraken Prime trading infrastructure.
- A potential deal would deepen Wells Fargo’s push into digital asset services.
Wells Fargo (WFC) stock closed at $80.26, falling 1.53%, before slipping another 0.10% after hours. The decline came as reports linked Wells Fargo with Payward, the parent company of crypto exchange Kraken. The reported discussions could expand Wells Fargo’s digital asset operations through external crypto trading infrastructure.
Wells Fargo & Company, WFC
Wells Fargo Explores Kraken Liquidity Partnership
Payward is discussing a potential agreement to provide Wells Fargo with liquidity for digital asset trading. Under the proposed arrangement, Payward would help the bank access crypto markets and execute client transactions. However, the companies have not announced any final agreement regarding the reported discussions.
Crypto exchanges increasingly provide infrastructure that allows traditional banks to offer digital asset products without building trading systems internally. Payward already provides liquidity, custody, settlement, payments, and trading technology through its Payward Services division. Therefore, a Wells Fargo agreement would extend Payward’s role as an infrastructure provider for established financial institutions.
The discussions follow Wells Fargo’s broader expansion into digital assets and blockchain-based financial services. The bank already provides eligible wealth clients with access to spot Bitcoin exchange-traded funds. It has also supported crypto compliance company Elliptic and institutional trading technology provider Talos.
Payward Expands Relationships With Major Banks
Payward has increased its focus on partnerships with banks, asset managers, fintech companies, and other financial institutions. In September, Payward partnered with SoFi to provide customers access to liquidity from Kraken Prime. The agreement also included continuous dollar settlement and supported the listing of SoFiUSD on Kraken.
Payward also entered discussions with BNY Mellon over a potential financial infrastructure partnership earlier this month. Those talks could include custody, trading, wealth management, crypto products, and payment services. The developments show Payward expanding beyond its traditional role as the operator of Kraken.
Wells Fargo already has a previous connection with Payward through Nasdaq’s investment in the crypto company. The bank advised Nasdaq during its $100 million investment agreement with Payward in September. That transaction valued Payward at $21 billion while expanding cooperation around tokenized equities and market surveillance.
Wells Fargo Builds Wider Digital Asset Presence
Wells Fargo has continued developing its digital asset strategy across trading, payments, and blockchain-based banking services. Earlier this year, the bank strengthened its digital assets team by hiring former Citi banker Mark Gracia. The move added experience as Wells Fargo expanded its involvement with crypto-related financial infrastructure.
The bank has also outlined plans for blockchain-based deposits as financial institutions test faster settlement systems. Wells Fargo joined a banking consortium working on a dollar-backed stablecoin for institutional and commercial payment applications. These projects extend its blockchain strategy beyond investment products offered to wealth management clients.
Meanwhile, clearer federal rules have encouraged deeper connections between banks and established digital asset companies. The GENIUS Act created a federal regulatory framework for payment stablecoins after becoming law in July 2025. A Payward agreement would further connect Wells Fargo with crypto infrastructure as traditional finance expands its digital asset services.
The post Wells Fargo (WFC) Stock: Drops as Kraken Parent Eyes Crypto Liquidity Deal appeared first on Blockonomi.
TLDR
- SpaceX seeks $40 billion in debt to fund a major Nvidia chip purchase in 2026.
- The financing may include $10 billion in loans and $30 billion in new bonds.
- SpaceX targets two gigawatts of AI compute capacity by the end of this year.
- Starlink wins approval for 15,000 more satellites to expand mobile coverage.
- New hosting deals and Starlink revenue support SpaceX’s aggressive expansion.
SpaceX is seeking about $40 billion in debt financing to buy Nvidia chips for its expanding compute operations. The plan could combine bank loans and investment-grade debt as the company accelerates infrastructure spending. SPCX stock closed at $167.60, down 2.51%, before edging 0.20% higher after hours.
Space Exploration Technologies Corp., SPCX
SpaceX Targets Major Debt Package for Nvidia Chips
Reports indicate SpaceX may raise $10 billion through bank loans and $30 billion through investment-grade debt. The financing would fund a large Nvidia chip purchase for terrestrial data centers and planned orbital compute projects. Apollo Global is reportedly leading the financing, while PIMCO has shown interest in the debt.
The package would expand SpaceX’s borrowing as management pushes deeper into large-scale compute infrastructure. SpaceX plans to use Nvidia architecture across its data centers and future orbital computing systems. The company also aims to reach two gigawatts of compute capacity by year-end.
That target compares with about 1.4 gigawatts reported at the end of the second quarter. The expansion adds another growth business alongside rocket launches and Starlink services. Management has tied recent growth to hosted computing demand and long-term service contracts.
Compute Growth Supports SpaceX Revenue Expansion
SpaceX has increased its focus on data centers as new hosting agreements add recurring revenue. SpaceX calls its Memphis facilities Colossus 1 and 2, which now support a larger commercial compute business. Company leadership expects these operations to contribute more annual recurring revenue.
SpaceX recently secured another hosting agreement expected to start generating revenue in December. Management said the deal could add about $1.11 billion in monthly revenue after operations begin. That agreement would equal roughly $13 billion in annual recurring revenue at the stated run rate.
The company now targets about $100 billion in annual recurring revenue across its operations. Starlink cash generation and contracted compute demand could help SpaceX support the heavier debt load. However, the financing would still represent a major increase in balance-sheet commitments.
Starlink Approval Expands SpaceX Growth Plans
SpaceX also received approval to launch 15,000 additional satellites for its Starlink Mobile network. The satellites will support direct-to-cell connections and broader mobile coverage from low Earth orbit. Regulators also approved spectrum use tied to planned EchoStar assets and certain T-Mobile frequencies.
The new satellites may operate as low as 326 kilometers above Earth to reduce network latency. SpaceX expects the system to support faster direct mobile connections without traditional ground infrastructure. The approval strengthens SpaceX’s position against established wireless carriers in satellite-based connectivity markets.
SpaceX has proposed much larger satellite systems beyond the latest Starlink expansion. Those plans include up to 100,000 Starlink Gen3 satellites and one million Starmind satellites. Together, the projects connect SpaceX’s satellite network, compute capacity, and infrastructure spending into one growth strategy.
The post SpaceX (SPCX) Stock: Eyes $40 Billion Debt Deal for Nvidia AI Chips appeared first on Blockonomi.
TLDR
- LEVI falls after Q3 revenue hits $1.6 billion despite stronger profit margins.
- Direct-to-consumer revenue rises 2% as U.S. sales stay under continued pressure.
- Adjusted EPS climbs to $0.48 as quarterly net income reaches $169 million now.
- Levi Strauss raises full-year EPS guidance to a range of $1.54 to $1.56 per share.
- Company plans a $100 million share buyback and raises its quarterly dividend.
Levi Strauss & Co. shares fell after the company reported higher third-quarter revenue but weaker direct-to-consumer growth. LEVI closed at $19.51, down 4.97%, then slipped another 1.18% to $19.28 after hours. However, stronger margins and higher profit guidance provided support against concerns surrounding slower U.S. and DTC demand.
Levi Strauss & Co., LEVI
Levi Strauss Q3 Revenue Reaches $1.6 Billion
Levi Strauss reported third-quarter net revenue of $1.61 billion, representing 4% reported growth from a year earlier. Organic revenue increased 5%, supported by gains across Europe, Asia, wholesale, and the Beyond Yoga business. However, U.S. revenue declined 1%, creating pressure on the company’s largest regional market.
The Americas generated $839 million in revenue, up 4% from $806 million one year earlier. Europe produced $442 million, while Asia generated $293 million as reported sales increased 4% and 5%, respectively. Meanwhile, Beyond Yoga revenue rose 9% to $36 million during the quarter.
Profitability strengthened sharply as operating margin reached 13.8%, compared with 10.8% one year earlier. Adjusted EBIT margin increased to 15.5%, while gross margin expanded 450 basis points to 66.2%. Tariff refunds contributed significantly to the margin improvement, although Levi Strauss reinvested part of the benefit.
DTC Growth Misses Levi Strauss Expectations
Direct-to-consumer revenue increased only 2%, while comparable sales remained nearly flat during the third quarter. DTC accounted for 45% of total company revenue, making its slower growth a key earnings concern. Furthermore, the U.S. DTC business declined 1% despite stronger performance across parts of Asia.
Asia DTC revenue rose 8% on a reported basis and 11% organically during the quarter. However, European DTC revenue fell 2% as reported, while organic revenue declined 1%. E-commerce provided stronger momentum and increased 10% on both reported and organic bases.
In contrast, wholesale revenue increased 6% as all geographic segments posted growth during the quarter. Europe and Asia delivered particularly strong wholesale performance and helped offset weaker direct sales trends. Management expects DTC growth to improve during the fourth quarter as holiday demand strengthens.
Levi Strauss Raises Full-Year Profit Guidance
Levi Strauss posted net income from continuing operations of $169 million, compared with $122 million last year. Adjusted net income increased to $189 million from $136 million, reflecting higher revenue and stronger operating margins. Adjusted diluted earnings per share reached $0.48, up from $0.34 one year earlier.
The company raised full-year adjusted EPS guidance to between $1.54 and $1.56. Previous guidance called for adjusted earnings between $1.46 and $1.52 per share. Levi Strauss also expects organic revenue growth of about 6% and reported growth near 7%.
Levi Strauss plans another $100 million accelerated share repurchase under its existing authorization. The company also declared a $0.16 quarterly dividend, representing a 14% increase from last year. Still, the stock decline showed that slower DTC growth outweighed stronger margins and improved full-year profit expectations.
The post Levi Strauss & Co. (LEVI) Stock: Falls After Q3 Revenue Hits $1.6B and DTC Growth Disappoints appeared first on Blockonomi.
TLDR
- Applied Digital revenue jumps 322% to $341.9 million in fiscal Q1 2027 results.
- HPC hosting revenue reaches $262.6 million as AI data center demand expands.
- Adjusted EBITDA rises to $64.4 million from $0.5 million in the prior year.
- APLD closes down 6.04% before rebounding 0.96% during after-hours trading session.
- Debt reaches $6.4 billion as expansion and financing costs pressure earnings.
Applied Digital reported fiscal first-quarter 2027 revenue of $341.9 million, up 322% year over year. APLD closed at $23.81, down 6.04%, before gaining 0.96% after hours to $24.04. The results showed data center growth, although higher costs and financing expenses widened the loss.
Applied Digital Corp., APLD
Revenue Growth Accelerates Across Core Operations
Services revenue reached $262.8 million, up 225% from $80.9 million one year earlier. Tenant fit-out work drove growth, while ChronoScale added $23 million from GPU hardware sales. Data center rental and other revenue added $79.1 million after hosting operations began.
Adjusted revenue rose to $300.4 million from $64.2 million during the prior-year quarter. Meanwhile, adjusted EBITDA increased to $64.4 million from $0.5 million in the comparable period. Net Operating Income reached $58.8 million, reflecting stronger core hosting performance.
Applied Digital reported a $221 million net loss for common stockholders. The loss equaled $0.76 per diluted share, compared with $0.07 previously. Higher compensation, fees, interest costs, and derivative losses pressured earnings.
HPC Hosting Drives Applied Digital Expansion
Applied Digital’s HPC Hosting business generated $262.6 million in quarterly revenue. The segment produced $33.4 million in operating profit from rent and fit-out services. Live capacity at Polaris Forge 1 reached 250 megawatts after the latest phase entered service.
The company holds leases covering about 1.41 gigawatts of critical IT load across five campuses. Those agreements represent about $36 billion in contracted base-term revenue across U.S. projects. Applied Digital expects Polaris Forge 2 to lift delivered capacity to 300 megawatts by year-end.
Expansion moved beyond the United States through an agreement covering one gigawatt in Finland. Management still centers execution on North Dakota, where power availability supports large data center projects. The company also secured power arrangements that could support further campus growth across the Dakotas.
Debt and Costs Remain Key Financial Factors
Applied Digital ended August with $3.7 billion in cash and restricted cash. However, total debt reached $6.4 billion after the company raised capital for construction. Interest expense climbed to $77.4 million from $8 million as debt balances increased sharply.
Selling, general, and administrative expenses rose 289% to $114.7 million during the quarter. Stock-based compensation contributed $51.7 million, while personnel and professional service costs climbed. Services cost of revenue also increased as tenant fit-out activity expanded across the HPC business.
Applied Digital continues building AI-focused campuses backed by long-term hyperscaler contracts and major power commitments. Revenue growth strengthens its scale, while debt and reported losses remain financial pressures. Fiscal first-quarter results showed stronger operating momentum alongside higher financing and corporate costs.
The post Applied Digital (APLD) Stock: Revenue Jumps 322% as AI Demand Surges appeared first on Blockonomi.
TLDR
- Amazon stock gains 0.98% as Prime Big Deal Days tests weaker consumer demand
- Consumer confidence falls to its weakest since 2014 as Amazon runs its major sale
- AWS generated $16.6 billion of Amazon’s $27.5 billion operating income in Q2
- Amazon Haul offered more than six million U.S. products priced below $10 in July
- Advertising revenue reached $19.8 billion in Q2, rising 26% from a year earlier
Amazon (AMZN) traded at $258.81, up 0.98%, after recovering from an intraday low near $253.30. The stock moved above $258 by early afternoon and remained near its session highs. The move came as Amazon continued its Prime Big Deal Days event during weaker consumer confidence.
Amazon.com, Inc., AMZN
Prime Big Deal Days Tests Consumer Spending
Amazon opened Prime Big Deal Days on October 6 as consumer confidence remained under pressure. The Conference Board’s consumer confidence index fell to 81.9 in September, Reuters said. That marked its weakest reading since 2014 and added pressure across consumer-focused stocks.
Meanwhile, the Consumer Discretionary Select Sector SPDR Fund declined 0.47% during the week ending October 2. Amazon remains the fund’s largest holding and carries significant weight within the consumer discretionary sector. Therefore, Amazon’s holiday sales performance could influence broader sentiment around discretionary spending.
Amazon has expanded its lower-priced offerings as households manage tighter budgets and shifting spending habits. The company reported 17% growth in worldwide paid units during the second quarter. Its Amazon Haul platform also offered more than six million U.S. products below $10 in July.
Amazon Expands Groceries and Low-Cost Products
Amazon has also increased its focus on groceries as it expands everyday retail categories. Monthly active customers purchasing perishables increased more than 50% since the beginning of 2026. The growth supports Amazon’s push beyond traditional online shopping into frequent household purchases.
Amazon reported second-quarter results before September’s sharp decline in consumer confidence. However, Prime Day timing affected comparisons between the second and third quarters. Management said third-quarter growth would increase nearly 400 basis points after excluding Prime Day timing effects.
Amazon expects third-quarter revenue between $197 billion and $202 billion. That range represents growth of roughly 9% to 12% from $180.2 billion one year earlier. The company’s quarterly results will provide more detail about retail demand during the current holiday period.
AWS and Advertising Support Amazon’s Business
Amazon Web Services generated $16.6 billion of Amazon’s $27.5 billion second-quarter operating income. However, the total included about $1.2 billion from tariff refunds and an energy contract accounting benefit. AWS therefore remains a major contributor to Amazon’s overall operating performance.
Advertising also continued expanding during the quarter and generated $19.8 billion in revenue. The segment increased 26% and added another high-growth business alongside Amazon’s cloud operations. These businesses give Amazon revenue sources outside its core online retail operations.
Amazon also reported $62.6 billion in second-quarter GAAP net income. That figure included $53.4 billion in non-operating pre-tax income, mainly linked to its Anthropic investment. Meanwhile, Amazon continues spending heavily as it expands infrastructure, cloud capacity, and its broader logistics network.
The post Amazon (AMZN) Stock: Rises as Prime Big Deal Days Test Consumer Demand appeared first on Blockonomi.
CryptoPotato
An interesting case seems to be brewing around Hyperliquid.
Reports have emerged that authorities in Singapore, the city-state the decentralized trading platform claims is home to its corporate headquarters, say they have no jurisdiction over Hyperliquid at all.
MAS Questions Where Hyperliquid Falls Under Regulation
According to a Financial Times report on October 7, the Monetary Authority of Singapore (MAS) is not aware of Hyperliquid being regulated in any major jurisdiction and has previously warned investors that its perpetual futures are not regulated by the authority.
People familiar with MAS’s thinking reportedly told the FT that the regulator did not consider the platform to be based in Singapore because of its decentralized nature. That could place the protocol outside MAS’s jurisdiction even though the corporate entity is located in the country.
Hyperliquid Labs confirmed to the FT that it is based in Singapore. Even job advertisements posted as recently as the previous week asked applicants whether they could work from the company’s Singapore office, while company documents identified Singapore as its registered headquarters.
The company also made its position clear on licensing. It stated that Hyperliquid is unregulated and “is not, and has never claimed to be, licensed or authorized by MAS,” while adding that it respected regulators’ roles and remained committed to engaging with them.
The distinction has drawn attention because the protocol has grown into a sizeable trading venue. Hyperliquid Financials data covering the 12 months through October 6 shows $730.5 million in protocol revenue and $723.7 million in operating net income. Total perpetual derivatives volume reached $716.4 billion in the third quarter, while open interest stood at $16.4 billion at quarter-end.
HYPE Activity Grows as HIP-3 Expands
The regulatory question has come at a time when the platform is broadening the type of markets available through HIP-3, its deployer-based perpetual futures system.
At TOKEN2049 Singapore, founder Jeff Yan stated that HIP-3 markets accounted for about 51% of trading volume at one point in July, and Hyperliquid Financials data puts HIP-3 at 36.6% of total perpetual derivatives volume in the third quarter, up from 32.7% in the second quarter.
Yan argued that users are moving toward on-chain versions of financial products that were previously harder to access, pointing to perpetual contracts tied to assets such as crude oil and pre-IPO markets. He also described the project as infrastructure rather than a conventional trading front end, saying, “No one is competing with the internet.”
HYPE, the platform’s native token, has also moved well beyond its earlier August peak, when it passed $82 to set a then-record high, after it got to within touching distance of $98 on September 23. However, at the time of writing it had retreated more than 7% from that ATH and was trading near $91 after falling about 2% over 24 hours.
The post Hyperliquid Faces Singapore Regulatory Questions Despite Local HQ: Report appeared first on CryptoPotato.
Bitcoin (BTC) was trading near $84,000 after another failure to break above its yearly open at $87,700. Bitfinex said the next move will depend more on renewed spot demand than on increased futures leverage.
Bitcoin had reached $87,200 on October 2, before retreating below the key level. The rejection marked the third failed breakout in the past ten days. The question now is whether it will flip the trend.
Leverage Drops as Demand Slows
According to Bitfinex, futures activity drove much of the move, with open interest rising by $2.1 billion before the September payrolls report. Futures open interest then fell by $1.5 billion as traders closed positions after the data.
Aggregate futures open interest now stands at about 625,000 BTC, its lowest level since January 1. The decline suggests lower leverage.
At the same time, spot demand has also weakened, with US spot Bitcoin ETFs recording $241.1 million in net inflows from September 28 to October 2. That was about 90% below the $2.39 billion recorded a week earlier. The nine-day inflow streak also ended on September 30 with a $148.7 million outflow.
ETF Demand and Key Levels
BlackRock’s IBIT recorded $450.2 million in inflows, while Fidelity’s FBTC saw $168 million in outflows. Bitfinex attributed the weaker demand partly to the average ETF holder’s cost basis of about $84,320.
Meanwhile, ETF inflows have averaged about $65 million when Bitcoin trades within 2% of that level, compared with $136 million when it trades more than 10% above it. Bitfinex sees $86,000 as an important level, while a drop below $82,600 could put ETF holders back in losses.
Beyond ETF flows, the $84,000 to $84,500 range holds roughly 867,000 BTC. It is the largest cost-basis cluster, with about 75% of Bitcoin supply in profit. Weak payroll growth has also raised expectations of an October rate pause, although inflation, spending and Treasury yields remain elevated.
Bitfinex expects BTC to consolidate between $84,000 and the yearly open. Stronger ETF inflows could support a move toward $90,000. Sustained trading below $81,300 could bring $77,000 and the True Market Mean near $77,200 into focus.
The post Bitcoin Struggles to Break Higher as ETF Demand Weakens: Bitfinex Alpha appeared first on CryptoPotato.
Russia has taken a major step toward a regulated crypto market. The Bank of Russia has registered the country’s first digital asset operators under rules that came into force on September 1st.
The regulator added five firms to its digital depository register and four to its crypto exchange register. Sberbank is among the newly approved custodians. VTB Bank was listed in both categories.
Crypto Rules Take Shape in Russia
The move follows a law signed by President Vladimir Putin in August. It created a formal framework for crypto exchanges, custodians, brokers, and investors, with the Bank of Russia overseeing the market. Crypto still cannot be used to pay for goods and services in Russia.
Sberbank is already preparing products for the new market. The bank plans to launch its first crypto offerings on December 1st. Bitcoin, Ether, and USDT are expected to be supported at launch. The central bank said the approved firms must follow the new transaction rules and bring their operations fully in line with the legislation by September 1, 2027.
There’s an interesting contrast in how quickly Russia and the US are moving on crypto rules. In the latter, the industry is still waiting for clearer rules. The Digital Asset Market Clarity Act, which aimed to define whether different digital assets fall under the Securities and Exchange Commission (SEC) or the Commodity Futures Trading Commission (CFTC), failed to clear a Senate procedural vote last month.
The bill fell short of the 60 needed, due to roadblocks over ethics rules for senior officials with crypto interests, including President Donald Trump, as well as concerns around investor protection and illicit finance.
Wallet Demand Rises
Demand for hardware crypto wallets also picked up sharply in Russia. Data released in August from two major retailers pointed to a clear jump in sales during 2026. M.Video said unit sales on its marketplace climbed 107% in the second quarter compared with the first three months of the year. Sales by value also rose 92%.
Wildberries saw a similar trend. According to RIA Novosti, citing the marketplace’s parent company RWB, hardware wallet sales by units increased 84% in the first half of 2026 from the same period last year. Sales value was up 60%.
The post While America’s CLARITY Stalls, Russia’s Crypto Market Gets Official Operators appeared first on CryptoPotato.
Chainlink’s LINK has rocketed by approximately 24% since the start of September, but the latest on-chain data from Santiment reveals an unusual disconnect as new wallet creation has barely moved in the right direction.
Today’s price correction, though it’s happening alongside the rest of the market, has raised questions about whether demand is keeping pace with the recent rally or whether another leg down is in the making.
The Good and the Bad
The analysts from Santiment Intelligence noted that Chainlink averaged 1,249 new addresses per day during the four weeks ending October 6, compared with 1,225 during the four weeks leading up to September 1. This is a very modest increase of less than 2%, even though the native token rocketed by almost 25% within the same period.
The contrast with other chains such as Solana is worth mentioning. Santiment reported that new SOL addresses skyrocketed 33% alongside a price surge of around 20% over comparable periods. Ethereum looked more similar to Chainlink, with new addresses remaining relatively flat. However, ETH’s price increase was a lot more modest during that period at 11%.
It’s worth noting, though, that Santiment’s metric counts LINK activity on Ethereum mainnet, so it doesn’t capture tokens bridged through Chainlink’s Cross-Chain Interoperability Protocol (CCIP) or held through exchange-traded products.
$LINK is up 24% since Sep 1. Are new wallets following? Not really, according to our data.
LINK went from $11.22 to $13.96 between the Sep 1 and Oct 6 closes.
New LINK addresses averaged 1,249 a day over the four weeks to Oct 6, against 1,225 in the four weeks to Sep 1. That’s a rise of under 2%.
Over the same windows, Solana’s new addresses rose 33% on a ~20% price move.
Ethereum’s new addresses were flat while ETH gained ~11%.
One caveat: this counts LINK on Ethereum mainnet. LINK bridged through CCIP or held through ETFs doesn’t show up here.
The headlines keep coming, but the new wallets do not.
Explore LINK network growth in Sanbase: https://t.co/TLd0ygMsnh
— Santiment Intelligence (@SantimentData) October 7, 2026
Nevertheless, Chainlink has generated substantial headlines and price momentum, but that has yet to translate into a significant influx of new on-chain wallets. Separately, as we reported recently, the number of non-empty LINK wallets had declined to 912,020 while the asset rallied to a multi-month peak of over $15. This suggested that some smaller holders were using this run to secure profits.
LINK Slides
LINK was rejected at the recent high of $15.80, and the past 24 hours have been quite painful, with the token slumping to $13.40 as of press time. Beyond the broader market correction, another plausible reason explains its pullback.
Further on-chain data from Onchain Lens showed that GSR has transferred another 303,010 LINK to Binance after receiving the tokens from a Gnosis Safe. This was the second major asset transfer to the leading crypto exchange over the past couple of days, with the total exceeding 578,000 LINK (valued at $8.25 million). Similar developments could intensify the immediate selling pressure but also be mimicked by smaller investors.
The post LINK Is Up 24% in Weeks: But This Key Growth Metric Is Barely Moving appeared first on CryptoPotato.
Arthur Hayes, the former BitMEX CEO and co-founder of crypto investment firm Maelstrom, told CNBC at the Gamma Prime Investing Conference in Singapore that humanity is “wasting multi-trillion dollars” on AI data centers.
His bet is that the overbuilding ends in a crash and a bailout, and that Bitcoin and other crypto absorb the money that follows.
Overbuilt, Then Bailed Out
The buildout, he argued, will leave computing power “extremely cheap and extremely plentiful.” “If you study financial history and you study every single major technological rollout, it always is overbuilt. There always is a crash, and there always is a bailout,” he stated, pointing to the aftermath of the 2008 financial crisis and other episodes since.
“Thankfully, we have Bitcoin and other crypto to soak up that excess liquidity, and so we know the asset that’s going to perform the best when the bailout comes,” he added, telling investors “you just have to be patient.”
He claimed SpaceX, OpenAI and Anthropic are among the end users behind demand for computing power, and that none of them makes money.
His contention is backed by Anthropic’s own numbers, with the firm recently sharing a prospectus ahead of a possible IPO that showed $4.6 billion in 2025 revenue, up from $400 million, against net losses near $42 billion, including a $34 billion noncash charge.
Additionally, compute and infrastructure cost $7.33 billion, which was over half of $12.65 billion in operating expenses.
According to Hayes, once the data centers under construction are finished, infrastructure providers will want payment for the compute Anthropic and the other AI firms committed to, which he expects in late 2027 or 2028.
He did leave room for a different outcome, though, where AI could become “so useful” over the next 12 months that demand expands enough for AI companies to become profitable. Some suppliers already earn money, he noted, including the likes of Nvidia.
The Debt Behind the Argument
As CryptoPotato reported in September, Hayes had pointed out that compute demand from some of the biggest artificial intelligence builders backs more than $1 trillion of investment-grade debt.
According to him, a downgrade would leave insurers tied to that debt short of capital, pushing Washington to buy compute as a last resort or print money to rescue them.
Before that, the crypto investor had predicted that AI spending would slow next year, then contract, with bailouts bigger than 2008 that could possibly take Bitcoin near $1 million.
The post Arthur Hayes: AI Is Overbuilt, and Bitcoin Could Benefit From It appeared first on CryptoPotato.