Cryptocurrency Posts
Crypto Briefing
Pump.fun's shift to profit-based rewards may democratize gains, but raises transparency concerns and challenges in measuring follower success.
The post Pump.fun ties callout rewards to followers’ profits starting October 10 appeared first on Crypto Briefing.
Tech firms' bond surge amid high costs may strain credit markets, testing their capacity and impacting investor risk perceptions significantly.
The post Tech companies increase bond sales despite rising financing costs appeared first on Crypto Briefing.
Nvidia's potential acquisition of Reflection AI could strengthen its position in open-weight AI models, impacting global AI competition dynamics.
The post Nvidia reportedly in talks to acquire Reflection AI, its open-model bet appeared first on Crypto Briefing.
Uniswap's dominance in stablecoin DEX volume highlights its critical role in onchain finance, impacting trader strategies and liquidity dynamics.
The post Uniswap v4 and v3 capture 47.2% of $161.4 billion in stablecoin DEX volume appeared first on Crypto Briefing.
The platform's design shifts financial risk to traders while rewarding stakers, potentially incentivizing risky trading behavior and market volatility.
The post Papertrade traders lose $18.6 million while stakers collect $12.57 million in rewards appeared first on Crypto Briefing.
Bitcoin Magazine
Bitcoin Magazine
Bitcoin Life Insurer Meanwhile Raises $37.5M as Wealthy Families Look to Pass On Their BTC
Meanwhile, the first life insurer licensed to operate entirely in Bitcoin, has raised $37.5 million in new funding from its existing investors, the company announced.
Bain Capital Crypto led the round, with participation from Haun Ventures, Framework Ventures, Pantera Capital, Apollo, Northwestern Mutual Future Ventures and Morgan Creek Digital. The raise brings Meanwhile’s total funding to more than $180 million. Sam Altman is also among its backers.
The company said the round follows a surge in demand for its Bitcoin life insurance policies outside the US, particularly in Asia, Europe and the Middle East, amid broader macroeconomic instability.
“Wealthy families around the world already hold Bitcoin. What they haven’t had is a regulated way to pass it on,” Zac Townsend, Meanwhile’s co-founder and CEO, said in a statement.
“Brokers came to us because their clients kept asking. This round lets us keep up with them.”
In early 2026, Meanwhile launched BTC Life 1-Pay, a single-premium whole life policy aimed at high-net-worth clients outside the US. It is the company’s second product line, after BTC 10-Pay, which is designed for US taxpayers.
Under BTC Life 1-Pay, a client pays one premium in Bitcoin and receives a guaranteed death benefit in Bitcoin for life. The policy’s value grows in Bitcoin, and after the first year the owner can borrow up to 90% of it, with no repayment schedule and no margin calls.
Policies can be owned by individuals, trusts or companies, which the company says makes them suited to succession and estate planning.
Since launch, Meanwhile has signed 15 brokers serving wealthy families, including in Singapore, Hong Kong, the UAE and Switzerland. Partners include Lioner, an insurance, trust and family office group with offices in Hong Kong, Singapore and Zurich, and Apeiron Group, a marketplace for high-net-worth life insurance.
“We’re reaching a turning point where more high-net-worth clients are asking not just how to hold Bitcoin and digital assets, but how to plan around them and ultimately transfer that wealth to the next generation,” said Justin Man, CEO of Apeiron Group. Digital assets.
Meanwhile said its net long-term underwriting income has already passed last year’s total and is on track to more than double in 2026. The company did not disclose specific figures.
“Meanwhile owns every layer of a regulated life insurer and builds it like an AI-enabled startup,” said Stefan Cohen, partner at Bain Capital Crypto. “The growth this year proves the model, and we’re glad to back them again.”
The company’s operating entity, Meanwhile Insurance Bitcoin (Bermuda) Limited, holds the first Class IILT license granted by the Bermuda Monetary Authority. It received the license in July 2024 after two years in the regulator’s sandbox.
The insurer’s balance sheet, reserves and audited financial statements are all denominated in Bitcoin. Policyholder Bitcoin is held with regulated institutional custodians.
This post Bitcoin Life Insurer Meanwhile Raises $37.5M as Wealthy Families Look to Pass On Their BTC first appeared on Bitcoin Magazine and is written by Mathew Di Salvo.
Bitcoin Magazine

‘We Know Where It Is’: Treasury Secretary Threatens To Freeze $1B of Iran’s Crypto
U.S. Treasury Secretary Scott Bessent has said the American authorities will soon seize $1 billion in crypto from Iran.
Speaking on Newsmax’s NPolicy Summit in Washington, D.C. on Thursday, Bessent added that economic sanctions on the Middle Eastern country were working.
Iran has been using bitcoin — and other cryptocurrencies — to skirt around U.S. sanctions. The U.S. in April started targeting crypto wallets linked to the Iranian regime, Bessent said at the time.
“What we have done has never been seen before,” Bessent said Thursday on Iranian sanctions.
“We’re probably going to seize $1 billion of crypto this week,” he continued. “We know where it is. We are isolating them. We did have a maximum pressure campaign, now we have an absolute isolation campaign and it’s working.”
Bessent didn’t reveal what cryptocurrencies the U.S. will seize or how.
It would be very hard — if not impossible — for the U.S. to freeze Iran’s bitcoin unless it keeps it on a centralized exchange.
Bitcoin, being censorship resistant, cannot be frozen. But many other cryptocurrencies, including Tether’s USDT, can. Bessent previously said the feds had seized Iran’s crypto in the form of the popular stablecoin.
Iran started a bitcoin-backed insurance service for its counties shipping companies earlier this year.
The Financial Times last month reported that the Middle Eastern country was using bitcoin to settle cross-border transactions through Iranian crypto exchanges after the central bank advised its countrymen to do anything necessary to help the economy.
U.S. President Donald Trump revived his “maximum pressure” campaign weeks after returning to office. A national security memorandum signed in February 2025 put the Treasury on a sustained campaign against Iran’s shadow banking, money laundering and sanctions-evasion networks.
This post ‘We Know Where It Is’: Treasury Secretary Threatens To Freeze $1B of Iran’s Crypto first appeared on Bitcoin Magazine and is written by Mathew Di Salvo.
Bitcoin Magazine

Here’s How Not To Screw up Your Bitcoin Privacy
Just one transaction can compromise years of discreet Bitcoin activity, Cake Wallet’s chief operating officer has warned.
Speaking on the Bitcoin Rails podcast this week, activist Seth for Privacy talked about different ways of protecting one’s privacy when using Bitcoin and said that focusing on privacy was a must for the West.
Bitcoin privacy is a hot topic again ever since the developers of private coin mixer Samourai Wallet went on trial last year and were subsequently imprisoned.
But just this week, the U.S. Department of Treasury scrapped two long-stalled crypto surveillance proposals, handing a major win to privacy advocates and the digital asset industry.
“If you ever spend your no-KYC coins with one of your KYC coins — which if you just let the wallet do its thing, it could do because it doesn’t know the difference — you immediately connect all of the non-KYC Bitcoin that you spend in that with your identity,” Seth said, referring to UTXO management, also called “coin control” by some wallets.
Bitcoin wallets don’t hold a single balance but a collection of separate unspent transaction outputs — UTXOs — each one a discrete “coin” from a specific past transaction.
When you send a payment larger than any one UTXO, the wallet picks several and combines them as inputs to the same transaction — an easy mistake to make, Seth highlighted.
Seth added that unlike in the global South, where people have experienced more oppressive states, citizens in the West will need to “feel pain” in order to realize how important privacy is.
Still, he added that attitudes were changing and people were getting more serious about protecting their privacy.
“It has been shifting, in the last five or six years a lot of people — even in the West — are starting to think [privacy] really matters, we really need to think about this seriously now,” he said.
Cake Wallet is a privacy-oriented, self-custody, open-source wallet. The wallet earlier this year integrated Bitcoin’s Lightning Network into its platform.
Using the second layer solution is not only faster and cheaper, it also offers more privacy than Bitcoin’s main chain.
While Cake Wallet supports other cryptocurrencies, including privacy coin Monero, Seth for Privacy added that he’d love it if the digital coin didn’t exist.
“If Bitcoin’s privacy got good enough that you could use it and have at least almost as good privacy as Monero without massive hoops to jump through, and Monero ceased to exist, that’s fine,” he said.
“I would much rather the thing that more people use has better privacy than a more niche tool that has perfect privacy, and that’s something that less people are using because it’s less well known.”
This post Here’s How Not To Screw up Your Bitcoin Privacy first appeared on Bitcoin Magazine and is written by Mathew Di Salvo.
Bitcoin Magazine

Bitcoin ETFs Shed $729M in Two Days as Investors Reverse Course
U.S. investors this week reversed course, cashing out $729 million from spot bitcoin exchange-traded funds — putting downward pressure on the leading cryptocurrency’s price.
Funds managed by BlackRock, Fidelity, Morgan Stanley, and ARK 21-Shares all experienced significant outflows on Wednesday and Thursday, according to data from Farside Investors.
Investors had started the week by selling close to $90 million in shares but then bought nearly $119 million on Tuesday.
The rest of the week has seen outflows following news that the Federal Reserve may raise interest rates. Other negative news includes the price of Brent crude jumping following renewed attacks on tankers in the Strait of Hormuz.
U.S. President Trump also hinted that talks with Iran weren’t bearing fruit — a sign war in the Middle East could continue.
Bitcoin’s price recently stood at a little over $82,688, down more than 3% over a seven-day period. The leading cryptocurrency has rebounded slightly over the past day, jumping nearly 2% over 24 hours.
Still, the coin was fast closing in on $90,000 last week. Investors are expecting decent returns as the month dubbed “Uptober” has historically delivered for bitcoin speculators.
The price of bitcoin has been particularly sensitive to geopolitical headwinds this year — especially since the U.S. and Israel attacked Iran, leading to an oil price surge.
Oil prices going up tend to lead investors to bet on the Federal Reserve raising interest rates. And with higher interest rates comes less liquidity for the price of bitcoin to do well.
Still, that’s not always the case: the Fed last month talked tough on getting inflation down and raised interest rates by a quarter of a percentage point and bitcoin’s price rose in the following days.
Bitcoin’s price is 34% below the all-time high of $126,080 it touched in October. It has spent most of 2026 in a bear market but analysts are now increasingly pointing to evidence of a bull market following a rally in August and September.
This post Bitcoin ETFs Shed $729M in Two Days as Investors Reverse Course first appeared on Bitcoin Magazine and is written by Mathew Di Salvo.
Bitcoin Magazine

Ledger Warns Buyers Not to Set Up Wallets From Reseller After Users Report Losses
Hardware wallet manufacturer Ledger has said that it is investigating loss of user funds after customers in South East Asia reported issues with devices bought from a reseller.
The Paris-based company on Friday advised customers who’d bought from vendor CryptoBilis within the last 90 days to not set up their devices.
Ledger did not reveal how much money users had lost but one blockchain investigator, Specter, wrote on X that he’d traced theft addresses following social media posts and that over $86 million had been lost.
The issue comes following a number of data breaches this year in the crypto world and a huge hack of popular Coldcard hardware wallet devices in July.
“Ledger is investigating reports of loss of funds from users in South East Asia who purchased products from a reseller named CryptoBilis,” Ledger said via its support X account.
Ledger added that it had asked CryptoBilis to pause all sales and shipments of Ledger devices.
“If you have set up your Ledger device, consider moving assets to a new Ledger signer (with new seed). We will continue to inform customers of updates as the investigation progresses,” the company said.
In a statement to Bitcoin Magazine, Ledger said that based on the information to date, the incident is isolated specifically to this reseller in this specific market.
“No reports were made of products purchased directly from Ledger, and Ledger’s infrastructure, systems and services were not compromised,” the company added.
CryptoBilis is a Kuala Lumpur, Malaysia-based hardware wallet vendor, according to its website. The company did not immediately respond to questions from Bitcoin Magazine.
The crypto industry is still reeling after hackers in July were able to steal close to $120 million in bitcoin from Coldcard users.
The products, made by Canadian company Coinkite, had a firmware bug which led to faulty seed generation, allowing hackers to essentially guess investor seedphrases.
Galaxy Research said in the months following the attack various attackers were able to exploit the bug independently.
In a separate incident, hardware wallet manufacturer Trezor last month reported that close to 81,000 customers had their details leaked after its third-party fulfillment partner had data stolen.
Criminals have been targeting data this year, with scammers getting hold of customer information via crypto wallet Ledger’s payment processor Global-e to send phishing emails.
This post Ledger Warns Buyers Not to Set Up Wallets From Reseller After Users Report Losses first appeared on Bitcoin Magazine and is written by Mathew Di Salvo.
CryptoSlate
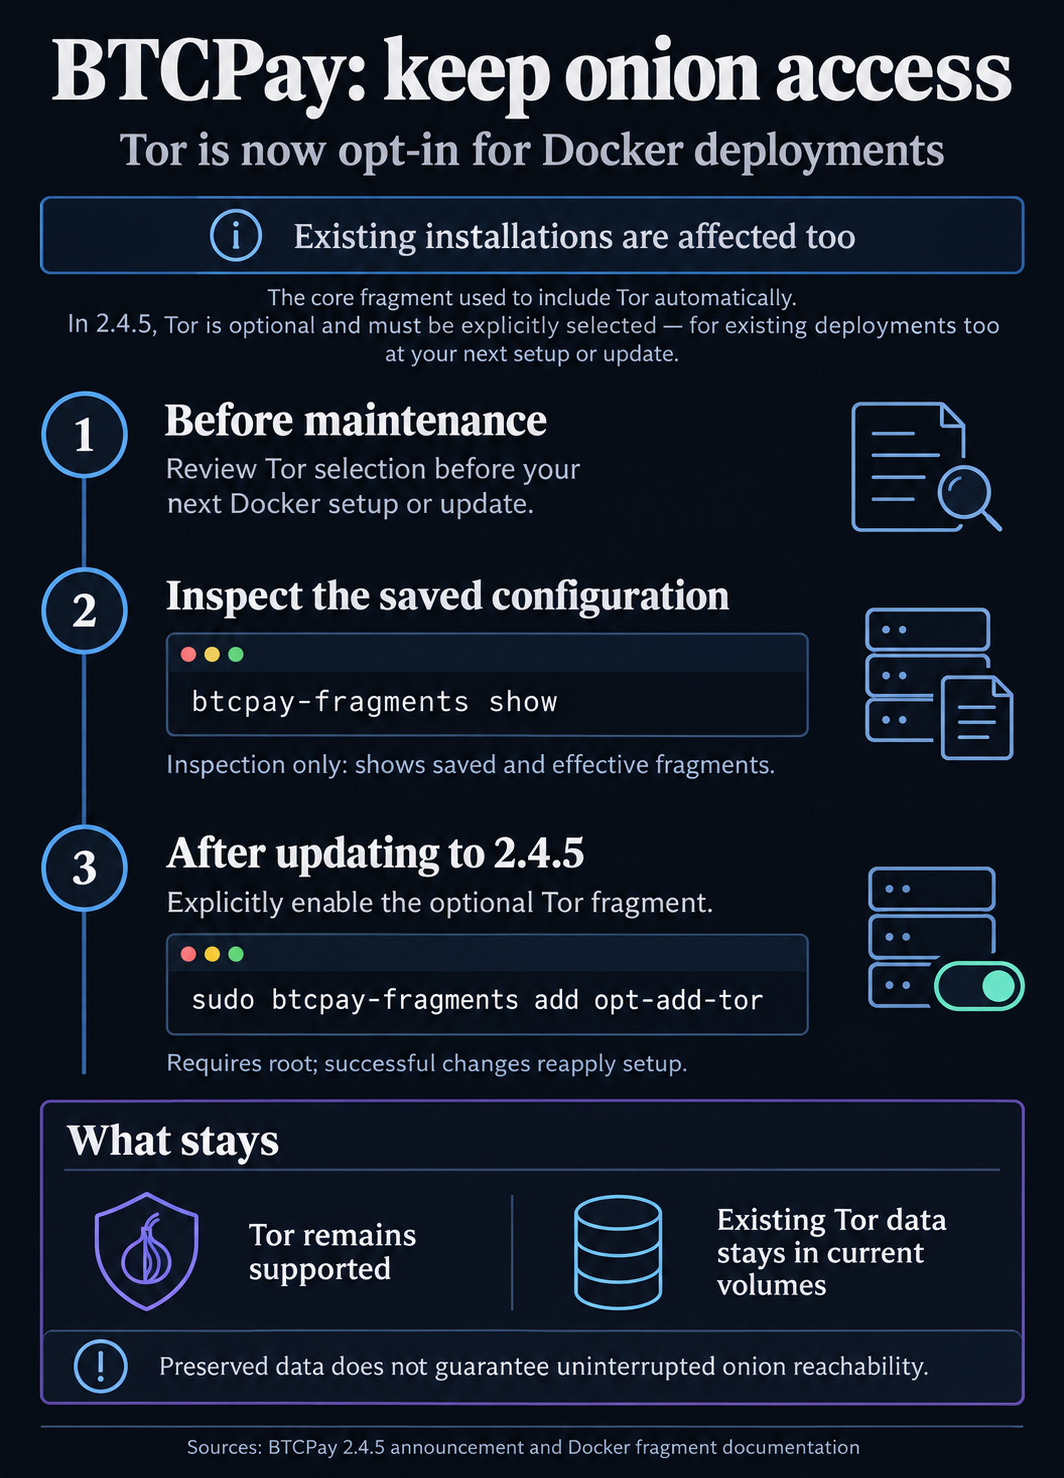
Operators running the Bitcoin payment software BTCPay Server through its standard Docker deployment must explicitly select Tor at their next setup or update if they want to retain onion access. The change removes Tor from the automatically included components, making a previously bundled service an administrator’s configuration choice.
BTCPay detailed the deployment change in its Oct. 5 announcement accompanying version 2.4.5. The official GitHub release page records the software release on Oct. 6. For existing installations, the relevant trigger is their next Docker setup or update.
The change matters to Docker operators who rely on Tor, including access through their server’s onion address, but previously received it through the core BTCPay Server fragment. Fragments are the configuration components used to assemble the Docker stack.
BTCPay advises administrators to review the deployment changes before updating. After updating to 2.4.5, its instruction for enabling Tor is:
sudo btcpay-fragments add opt-add-tor
Tor remains supported, and BTCPay says existing data stays in the current Tor volumes. That preserves stored data; continued onion access still depends on including and running Tor in the deployment.
BTCPay Server documentation describes the optional Tor fragment opt-add-tor as adding hidden services and selected onion connectivity. Operators can inspect configuration using btcpay-fragments show, which does not change configuration and reports saved additional and excluded fragments alongside the effective fragments from the last generated manifest.
Fragment-changing commands require root and reapply setup immediately.
Private services need separate exceptions
The 2.4.5 release notes also identify a breaking change for outbound HTTP requests: private-network destinations are blocked by default for Lightning connections, LNURL requests, invoice notification URLs and webhooks. The restriction is intended to prevent server-side request forgery, or SSRF.
With that protection enabled, operators intentionally using private services must allow the needed destinations through ssrfexceptions.
BTCPay’s operator guide says to restart the application and exercise the affected integration after changing the setting.
The post BTCPay Docker users must opt into Tor at their next update to keep onion access appeared first on CryptoSlate.
Coinbase reported Oct. 7 that newer versions of three major AI model families caught fewer fraudulent payments and a smaller share of fraud value in a historical test of payment screening for its Onramp service, despite an unchanged decision policy. The findings challenge the assumption that upgrading a model improves an existing payment screener.
The company’s evaluation replayed 16,140 transactions across 7,293 users, including 813 confirmed fraudulent transactions. The cohort covered nine weeks before its risk agent rolled out, retaining all matured fraud cases while sampling legitimate traffic.
Each candidate reviewed recent transaction behavior under fixed guidance and the same policy for turning risk classifications into decisions. This isolated the decision model’s behavior within that setup, rather than comparing redesigned screening systems.
Results from a fixed historical replay
Coinbase compared Opus 4.5 with Opus 5, Sonnet 4.6 with Sonnet 5, and GPT-5.4 with GPT-5.6 (sol). Every newer version had lower recall, a lower combined precision-and-recall score called F1, and lower dollar-weighted recall. Recall measures the share of fraud cases a model catches; dollar-weighted recall measures how much of the total fraud value it catches.
Sonnet’s recall fell 22.2 percentage points and its dollar-weighted recall dropped 22.9 points. Opus’s recall declined 0.8 points. Both newer models also had lower precision, meaning a smaller share of transactions they classified as fraud were actually fraudulent.
GPT showed why one improving score can be misleading. Its precision rose 11.5 percentage points, but recall fell 20.7 points and dollar-weighted recall fell 21.8 points. Its fraud flags were more accurate, while more fraud cases and value escaped detection in the replay.
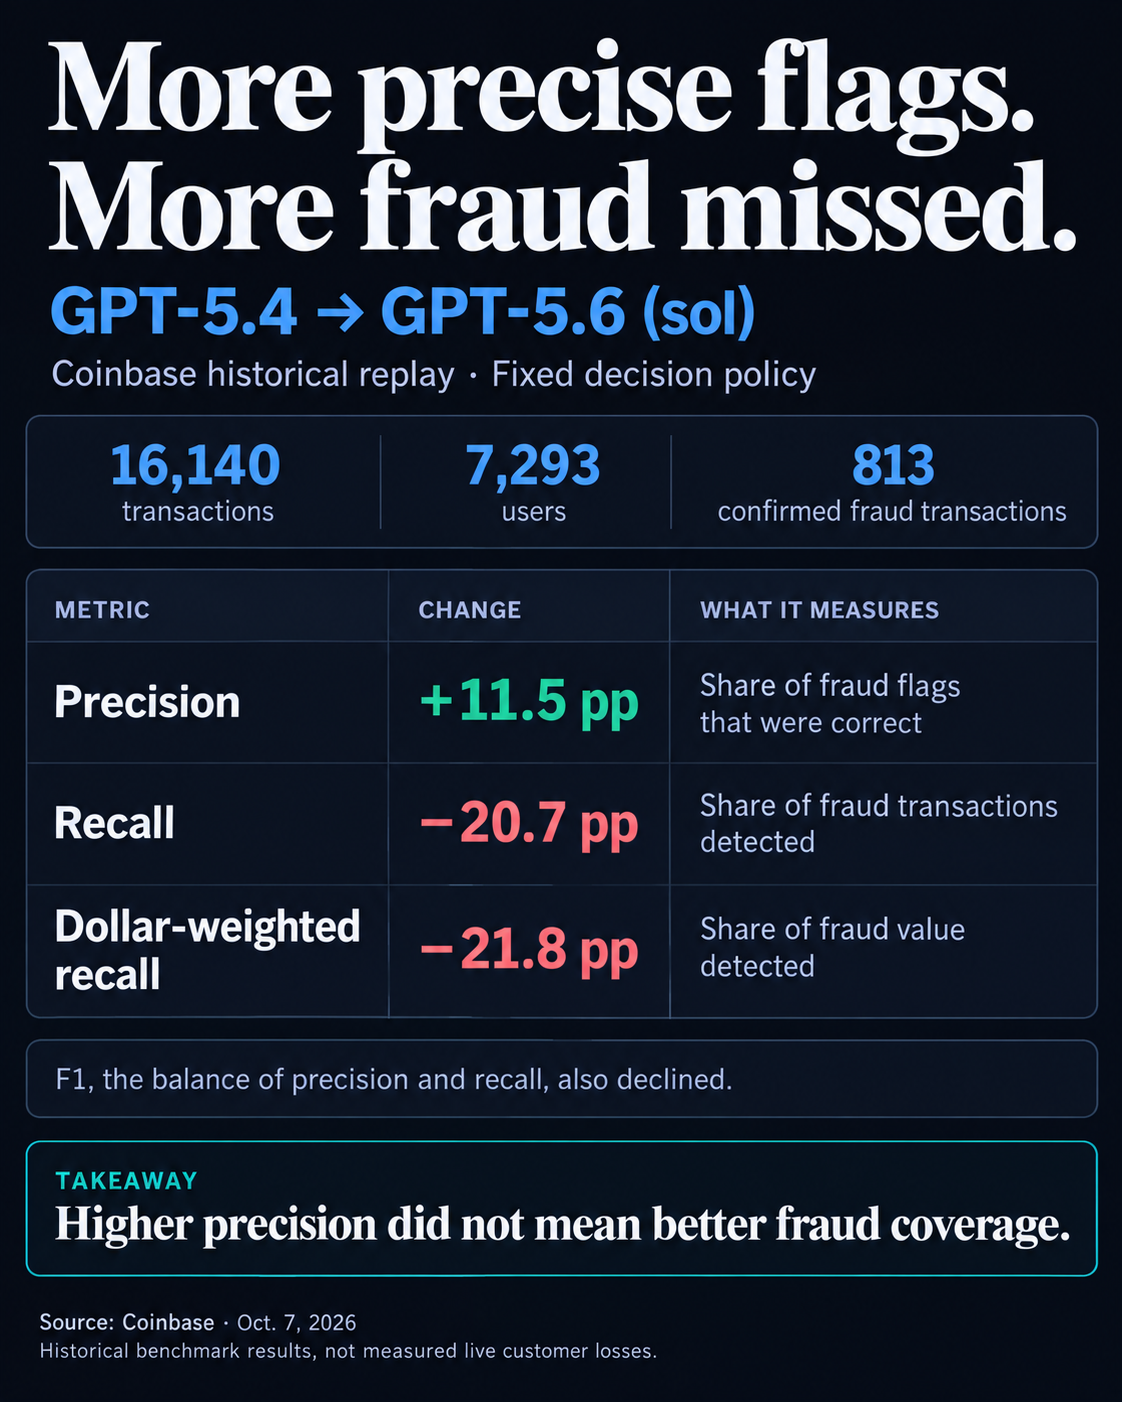
The replay does not establish customer losses from deploying those versions. Coinbase also said it could identify the regressions without establishing their cause.
Coinbase’s earlier online experiment compared adding selective LLM review with the existing models and rules alone. That agent-enabled flow recorded 30% fewer fraudulent transactions and 22% less fraud value; it did not compare newer model versions.
In their limitations, the SR-Fraud researchers say the proprietary dataset cannot be released, restricting independent replication and generalization. Their related payment-fraud study first appeared Sept. 23 and was revised Sept. 30, before the October blogs.
A separate case for a custom model
In its Oct. 8 disclosure, Coinbase reported that a post-trained Qwen3.5-9B model exceeded Opus 4.5 across four fraud-detection metrics. F1 improved 9.6 percentage points and dollar-weighted recall rose 35.4 points. The company specialized it using historical fraud outcomes and deterministic rewards balancing fraudulent and legitimate examples.
Separately, production measurements put median end-to-end LLM-request latency at 0.683 seconds versus 1.515 seconds for Opus 4.5, a 55% relative reduction. Faster inference and stronger benchmark detection came from different evaluations.
For payment providers, the upgrade question is whether a candidate improves fraud coverage under their actual decision setup. Coinbase recommends testing that configuration first, then evaluating changed prompts or thresholds separately, with latency, reliability and cost alongside detection quality.
The post Newer AI models missed more payment fraud in Coinbase’s benchmark appeared first on CryptoSlate.
Bitcoin's next recovery could vindicate your investment thesis but leave your leveraged fund deep in the red, because the fund's daily reset can make waiting a pretty expensive habit.
Getting Bitcoin right and actually making money on Bitcoin are becoming two different skills, especially now that Wall Street is preparing products for people who don't find the ordinary version exciting enough.
On Oct. 2, the SEC approved exchange-listing rules for proposed 3x Bitcoin and Ethereum funds from VS Trust. The approval brings them closer to trading, with the appeal captured neatly in the multiplier: more exposure to a market you already believe will go up.
But what happens between buying the fund and being proved right? Bitcoin can fall, recover, and return to your entry price while a leveraged fund still nurses losses, even when it's doing exactly what the product promised.
That promise covers just one day, a much shorter relationship than many investors intend with their money.
Your Bitcoin conviction doesn't reset
The proposed funds seek three times their benchmark's daily return, before fees and expenses. Holding them for a month doesn't extend that promise to three times the month's return, because each day's gain or loss becomes the starting balance for the next.
The Bitcoin investor thinks about where the market will be in six months, while the fund continually resizes its exposure around how much money it has today.
When the market falls, leverage eats through the fund's capital faster than it reduces the size of its market position. To restore the intended multiple, the fund cuts exposure, leaving it with a smaller position when the rebound begins.
Gains then apply to that reduced balance, so getting the underlying market back to its old level doesn't necessarily get the shareholder there too.
During a rally, profits give the fund more capital, allowing it to take on more exposure for the next session. You can leave your shares untouched while the investment inside them grows and shrinks every day, indifferent to your long-term Bitcoin outlook.
The SEC describes in its investor bulletin on leveraged funds a real four-month period when an unnamed index gained about 8%, while a fund seeking three times its daily return lost 53%. That wasn't a Bitcoin fund or a forecast for these proposed products, but it puts a financial result behind an easily dismissed prospectus warning.
Daily compounding can also work beautifully during a sustained advance, allowing a leveraged fund to earn more than three times the benchmark's cumulative gain. The mechanism rewards some price paths and punishes others, which means a buyer needs to be right about more than the eventual destination.
Bitcoin's reputation for rewarding patience affects this, and not in a good way, since a daily-reset fund continually recalculates how much exposure your remaining money can support.
The ETF wrapper comes with extra paperwork
The listing approval showed that these funds use futures, adding another layer between the Bitcoin price people follow and the return they receive.
Futures are contracts with expiration dates, so maintaining exposure requires replacing contracts as they approach expiry. The prices of those replacements can make the strategy more expensive or work in its favor, depending on the relationship between nearer and later contracts.
Either way, multiplying Bitcoin's spot-price return by three won't reproduce the fund's results.
VS Trust's Oct. 7 amended filing lists a 1.85% annual management fee for both proposed products. Its estimated trading return needed to cover costs is 1.98% for the Bitcoin fund and 2.78% for the Ethereum fund, incorporating other expenses and assumed interest earned on collateral.
Those breakeven estimates describe the return needed to cover the estimated operating bill under the filing's assumptions, before the investor earns anything from taking the risk.
But the familiar ETF comes with less familiar paperwork. These are commodity-pool products outside the Investment Company Act of 1940 framework that governs conventional investment-company ETFs, and the filing anticipates partnership tax reporting through Schedule K-1.
Shareholders may have taxable allocations without receiving cash distributions, adding another complication to a trade likely bought for price appreciation.
The Oct. 7 filing says the funds haven't begun trading, so none of this amounts to a record of returns from BITH or ETHK. The listing decision permits a route to market, while the disclosures explain what buyers would actually own.
When a bad trade becomes a long-term investment
Traders who want amplified exposure over a short period, and understand what they're buying, find a legitimate attraction here. Buying shares with cash can save them the work of managing their own futures margin account, though the leverage remains.
The trouble begins when a short-term position loses money, and its owner promotes it to a long-term investment. Waiting for Bitcoin to recover is more comfortable than accepting a loss.
But the fund keeps rebuilding its position around the capital left inside it, regardless of whether shareholders choose to be patient. Even the prospect of waiting assumes enough capital will remain to participate in a rebound: the issuer warns that the entire investment could be lost in a day or overnight.
Buying a 3x fund means accepting daily exposure adjustments and the possibility that a volatile recovery will leave you far behind the asset you correctly believed in.
Even if Bitcoin recovers, a daily-reset fund has no obligation to restore the money lost along the way. Conviction can't persuade a fund to calculate tomorrow's return on money that disappeared yesterday.
The post Being right about Bitcoin won’t save your 3x leveraged ETF position appeared first on CryptoSlate.
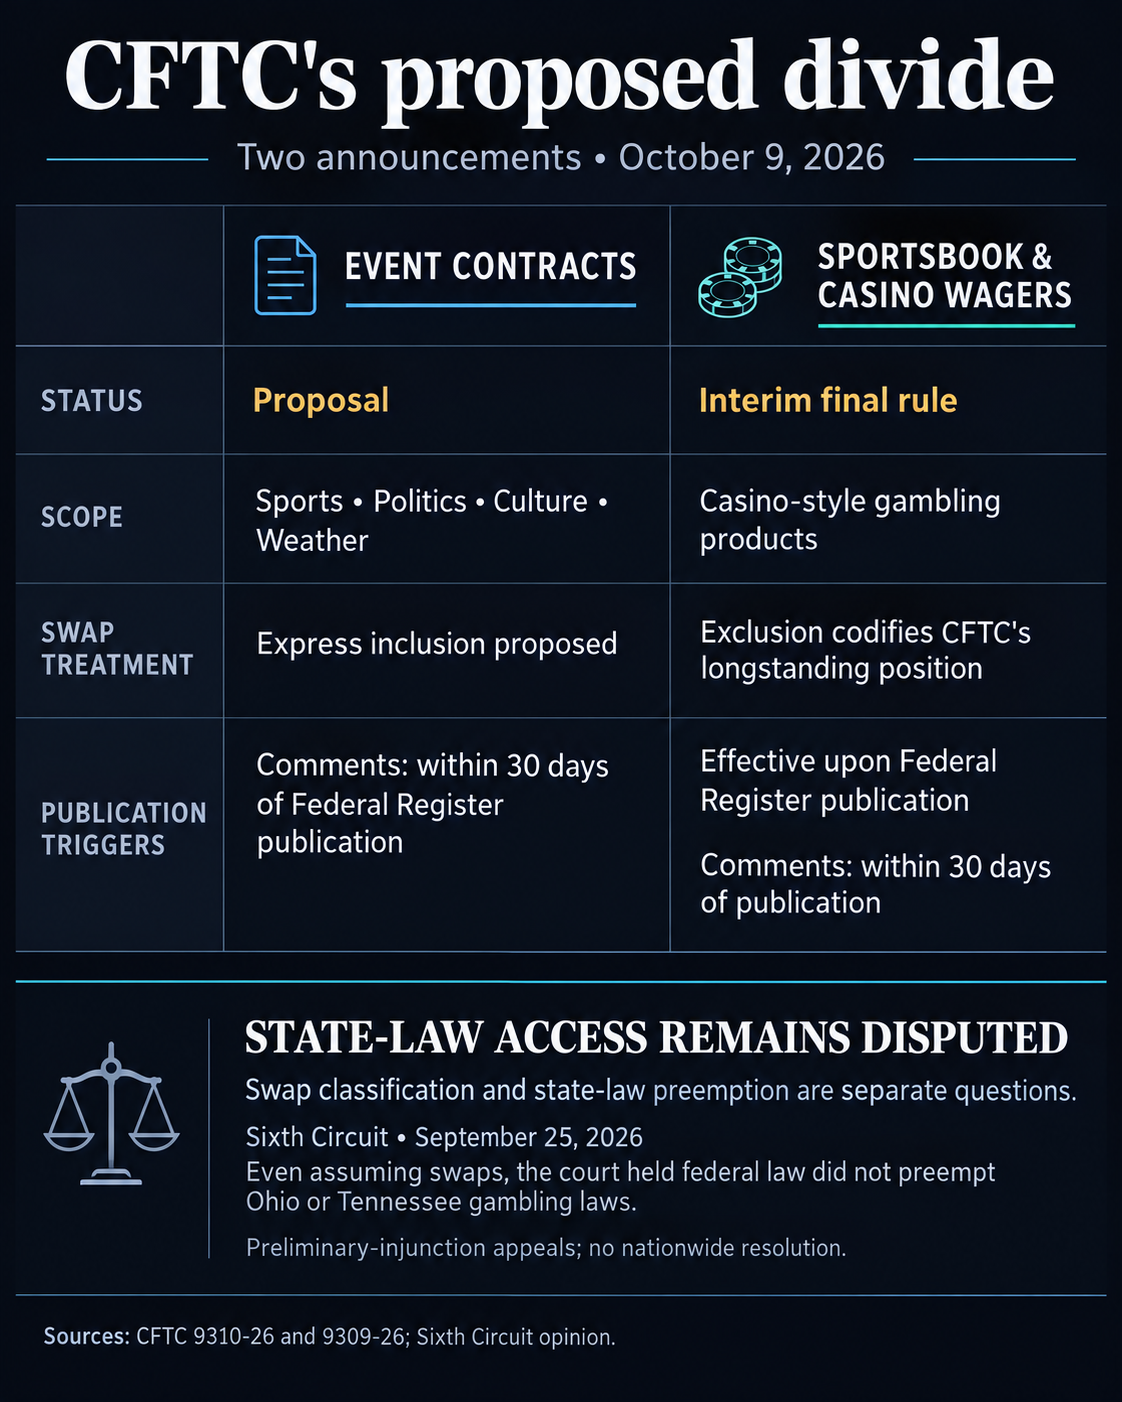
The Commodity Futures Trading Commission announced two actions on Oct. 9 seeking to clarify the federal regulatory boundary between prediction-market contracts and traditional gambling. It proposed expressly including sports and other event contracts in the definition of a swap, a category of financial derivative, while announcing a separate interim final rule to codify the exclusion of sportsbook and casino wagers.
The event-contract proposal covers sports, politics, cultural events and weather-related outcomes. CFTC Chairman Michael S. Selig said these products fall within the agency’s exclusive jurisdiction under the Commodity Exchange Act.
That classification matters because the products can look familiar to bettors. The CFTC explains that event contracts often let traders buy yes-or-no positions on a future outcome, with a fixed payout, usually $1. Their value depends on that outcome, and they can be used to hedge risk or speculate.
The distinction is visible in how platforms present their products: CryptoSlate’s Cloudbet sportsbook review examines odds-based wagers, while its Polymarket review examines tradeable outcome contracts.
The proposed inclusion is not final. The CFTC is seeking written comments through Regulations.gov within 30 days of the proposal’s publication in the Federal Register.
The casino-wager action is an interim final rule. The agency describes it as codifying its longstanding position that casino-style gambling products, including wagers placed on sportsbooks and casino games, fall outside the swap definition.
According to the CFTC, the exclusion takes effect immediately upon publication in the Federal Register. It also carries a 30-day comment window tied to that publication. Neither announcement specifies the Federal Register publication date, so the Oct. 9 date does not establish an effective date or comment deadline.
State-law disputes remain consequential
The agency’s classification position faces a separate legal question: whether federal regulation displaces state gambling laws.
In a Sept. 25 ruling on preliminary-injunction appeals involving prediction-market operator Kalshi, the Sixth Circuit held that the company had not shown its sports-event contracts met the statutory swap definition. It also held, alternatively, that even assuming the contracts were swaps, the Commodity Exchange Act did not expressly or impliedly preempt Ohio’s or Tennessee’s gambling laws.
That alternative holding illustrates the obstacle for operators seeking nationwide access: winning an argument about product classification does not necessarily win the argument over state authority.
The distinction also drew criticism from advocacy group Better Markets. In an Oct. 9 statement, securities-policy director Benjamin Schiffrin argued that sports event contracts enable sports betting and should remain subject to state gambling laws.
The post CFTC proposes a divide between prediction contracts and sportsbook wagers appeared first on CryptoSlate.
Luxor, a Bitcoin mining derivatives provider, reported a 6–13% annualized Bitcoin financing spread in its September lookback, published Oct. 9. It says lenders and Bitcoin treasury companies bought prepaid mining power and paired it with a price hedge, while miners used the reverse trade to obtain financing.
The return comes from the discount a miner accepts for receiving money upfront. The hedge can fix gross BTC receipts if mining delivery and settlement perform, while the investor’s capital remains exposed to failure in that repayment chain. Luxor’s reported September range does not establish an executed return after costs or a quote available today.
Where the Bitcoin return comes from
Mining power, or hashrate, produces revenue at a rate known as hashprice. Luxor’s contracts express that rate in Bitcoin or dollars per unit of computing power per day. Buying future mining power gives the purchaser exposure to the income that power generates over the contract period.
In a deliverable forward, the buyer pays the full purchase price upfront. The seller must deliver hashrate to Luxor’s Bitcoin Mining Pool, with the buyer’s daily BTC settlement tied to the hashprice index and contracted amount of mining power.
That prepayment supplies financing to the miner. Luxor says deliverable forwards typically trade below comparable non-deliverable forwards to compensate the buyer for credit risk and the cost of committing capital. The lower prepaid purchase price is the source of the lender’s potential profit.
Without a hedge, the buyer’s receipts would vary with the mining-revenue rate. The paired trade adds a sale of a non-deliverable forward, or NDF, which settles in cash rather than requiring physical mining-power delivery.
For the NDF seller, daily settlement is the agreed hashprice minus that day’s index rate, multiplied by the contracted hashrate. When the index is below the agreed price, the seller receives the difference. When it is above, the seller owes the difference.
If the two legs use the same BTC denomination, hashrate quantity, settlement dates and index methodology, their price exposures cancel. Fully delivered mining receipts at the daily index rate, plus the NDF settlement, equal receipts at the fixed NDF rate. The profit depends on how much those receipts exceed the prepaid purchase cost and other costs.
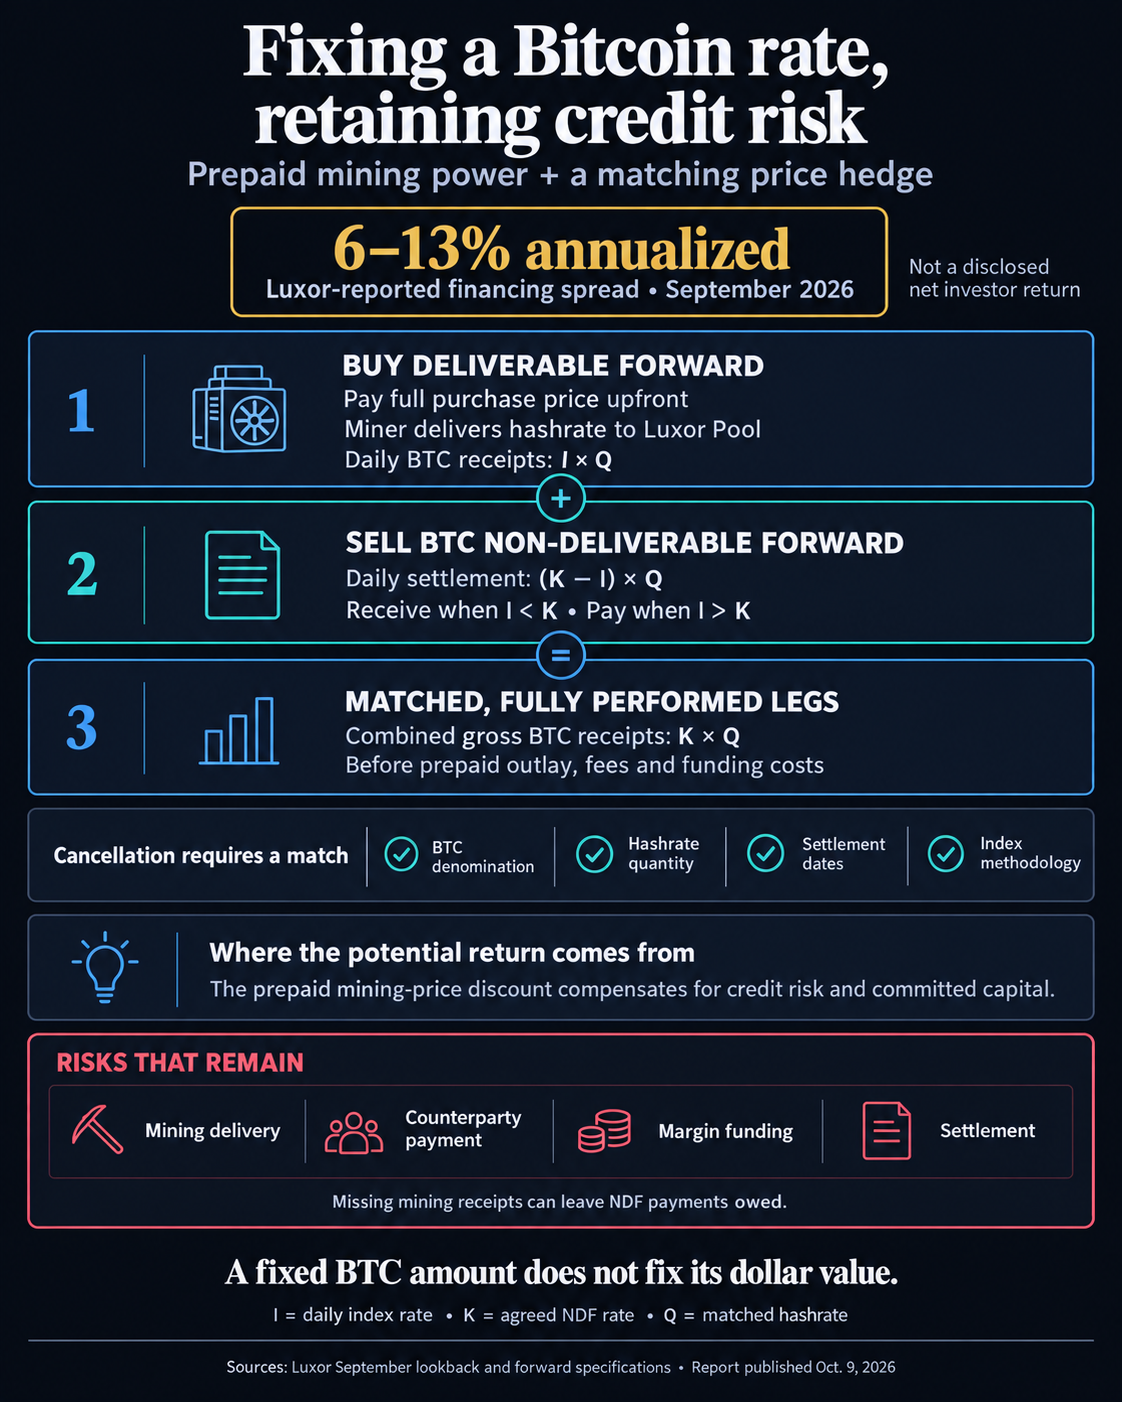
The matching conditions matter. A hedge covering different quantities or dates leaves part of the mining revenue exposed. A dollar-denominated contract also cannot simply be substituted for a BTC-denominated one while preserving the same Bitcoin payoff.
A BTC-denominated hedge also leaves the dollar value of Bitcoin receipts exposed to BTC/USD changes.
Luxor’s product pages describe monthly contracts up to 18 months out and custom durations. That is the general product range; the September financing discussion does not identify which tenors produced the reported 6–13%, or give its annualization formula.
Annualized pricing also does not mean an investor earns the quoted percentage over any shorter contract. The actual contract period, repayment timing, costs and capital committed across both legs determine the return on the investor’s funds.
Delivery failure can leave the hedge running
The cancellation works because the buyer receives the mining revenue against which the NDF settles. If promised mining power is not delivered and the shortfall is not cured, that revenue leg can be smaller than expected while the hedge still has settlement obligations.
When settlement hashprice exceeds the NDF’s fixed rate, the seller owes the difference, expecting higher mining receipts to offset it. If those receipts fail to arrive, the price hedge can require payment without the corresponding income.
There is also a distinction between the miner supplying the output and the investor’s contractual counterparty. Luxor’s order-book documentation says Luxor is counterparty to both the buyer and seller. The platform displays buy and sell orders, and its derivatives team contacts the parties to confirm trades; the book itself is not an execution system.
For an investor, that makes Luxor’s own performance part of the repayment chain alongside the mining operation.
Luxor’s upfront-payment procedures require seller credit profiling before money is advanced. The requirements cover mining-site and power documents, insurance, pool performance, financial statements and future obligations. Its margin policy also lists documentation for a performance bond or guarantor among its supplemental checks.
Credit checks reduce uncertainty about a seller’s ability to perform, while recovery after failure depends on enforceable claims. The public requirements do not specify a complete repayment priority or identify which assets an investor could enforce against after default.
For eligible investors, collateral custody and the ability to exit remain part of the credit exposure. The order book allows open orders to be canceled; that does not establish an exit from a confirmed forward.
Margin changes the capital calculation
Collateral determines how much additional capital may be needed to maintain the hedge. Luxor’s margin policy requires BTC collateral for BTC contracts and collects variation margin when the lower of realized and unrealized margin balances falls below maintenance requirements. Credit-qualified deliverable sellers can have custom procedures based on realized balances.
The policy describes initial margin as protection against potential exposure during the time needed to close out and replace a defaulted position.
The public schedules are not consistent: the NDF page quotes 18% BTC initial margin and the DF page quotes 18% seller hashprice margin plus possible delivery margin, while the general policy lists 17.5% BTC initial and 14% maintenance on non-offset future daily notional. The pages do not explain the difference.
The policy identifies Nov. 14, 2025, as its last initial-margin evaluation. Qualified BTC deliverable sellers can receive discretionary initial terms after supplemental credit profiling, so neither product-page rate establishes a universal requirement for the paired trade.
Prepaid DF buyers are exempt from that leg’s initial-margin schedule because they already pay in full. That exemption does not establish that their NDF leg is collateral-free.
That capital matters when comparing the reported spread with an investor’s net return. Fees, execution prices and any additional funds committed to support the hedge can affect the amount earned relative to the money put at risk.
Luxor’s Steelhead Capital Management case study describes the pairing in practice: Steelhead bought physical hashrate upfront, added an NDF to fix hashprice, and used Luxor Pool for delivery, reward distribution and settlement.
Luxor says daily repayment reduces exposure over the contract’s life. That supports the mechanism of returning funds progressively, while the remaining unpaid amount still depends on performance.
Access is also restricted. Luxor’s resources page says participants must qualify as Eligible Contract Participants. Its examples include entities with more than $10 million in assets and entities with at least $1 million in net worth hedging commercial risk. The structure is not universally available to retail Bitcoin holders.
The post Luxor’s reported 6–13% annualized Bitcoin yield depends on mining delivery appeared first on CryptoSlate.
CryptoTicker.io
Ethereum costs $2,507 on Saturday afternoon, a good 0.8 percent more than on Friday. The move that really explains this week, however, is not in the price chart but in the two queues through which capital enters staking and leaves it again. Since October 4 the lead of the entry queue over the exit queue has melted away by 252,402 ETH, around $633 million at today's price. That produces two numbers you can work with today: just under 24 days until a new deposit sees its first reward, and a good 24 days until withdrawn ETH sits freely available on your address again.
Ethereum at $2,507 and a week that cost 6.9 percent
As of October 10, Ether trades at $2,507. On the day that is a gain of 0.77 percent, over the week a loss of 6.9 percent, and over the month still a gain of 3.4 percent. Market capitalisation stands at $306.2 billion, turnover over the past 24 hours at $5.82 billion. All figures in this section come from CoinGecko.
For comparison, the larger neighbour: Bitcoin stands at $82,943 and has lost 2.5 percent in the same week. Ether has therefore given up almost three times as much. The ETH to BTC ratio sits at 0.0302, and 49.3 percent separate the price from the all-time high of $4,946.05 on August 24, 2025.
For a daily price question this reading yields little. A gain of 0.8 percent on a Saturday with neither fund trading nor economic data carries no message. The situation only becomes interesting one level down, at the question of how much ETH is still tradable at all and how fast that is changing.
415,072 ETH of buffer: what has shifted in the queues since October 4
Anyone wanting to put their ETH to work in the network joins a queue. Anyone wanting to take it out again does too. Both queues are publicly visible. According to the figures from validatorqueue.com, 1,379,437 ETH are currently waiting to enter, the equivalent of $3.46 billion, and 964,365 ETH to exit, so $2.42 billion. The stated waiting time is 23 days and 23 hours on entry and 16 days and 18 hours on exit.
The gap between the two queues, called the buffer here, therefore stands at 415,072 ETH or around $1.04 billion. On October 4, in our article on the exit queue and the $2,775 level, we still measured 1,480,361 ETH in the entry queue and 812,887 ETH in the exit queue. The buffer that day came to 667,474 ETH.
In six days, then, three things have shifted. The entry queue has become 100,924 ETH shorter. The exit queue has become 151,478 ETH longer. And the buffer between the two has shrunk by 252,402 ETH, which is 37.8 percent of its value last week. The direction is unambiguous, and so is the speed: if this pace continues, the buffer would be used up in around ten days and would flip.
To place the order of magnitude: 851,608 validators are active in the network, together holding 43.7 million ETH, that is 35.78 percent of supply. The entry queue corresponds to 3.2 percent of that holding, the exit queue to 2.2 percent. Neither amounts to a shock to the system. As an early indicator of where patient capital currently wants to go, the two figures are nevertheless useful, because nobody who wants to sell the next day joins a queue for 24 days.

Churn limit of 256 per epoch: what the almost 24 days of waiting hang on
The waiting time is not a delay caused by overload, it is a built-in brake. A validator is an account that deposits ETH and in return proposes and attests blocks. An epoch is the network's metronome and lasts 32 slots of twelve seconds each, so 6.4 minutes. The churn limit sets how many validators may join or leave per epoch; currently it is 256 in each direction.
This limit is the reason for the 24 days. The brake protects the network against a large part of the security deposit disappearing all at once or appearing all at once, because both would be open to attack. Since the Pectra upgrade the protocol counts the ETH behind it rather than mere validator numbers, which is why the queues on ethereum.org and the common trackers are reported in ETH rather than in accounts.
In practice that means the waiting time is predictable but not negotiable. No fee speeds it up, no provider gets around it. Anyone staking through a service sometimes notices nothing of it, because the provider fronts the payout from its own funds. That is then a service of the provider and not a property of the protocol, and it ends the moment many want to exit at the same time.
Why a full entry queue does not support the price
A long entry queue is readily read as a buy signal. That conclusion does not survive the mechanics. The ETH in the queue was already bought before it joined. The buying pressure on the market is therefore in the past, not the future. What the queue does is something else, and it is time-shifted: as soon as the deposit becomes active, that ETH disappears from the freely tradable holding for the duration of the stake.
The same applies in reverse with the opposite sign. The 964,365 ETH in the exit queue are not a sell order. Part of it merely changes provider, part moves into other forms of staking, part is genuinely sold. How large that third part is, nobody knows in advance, and any figure for it would be guesswork. The only robust observation is that the willingness to wait 24 days to enter is easing, while the willingness to leave is increasing.
Funding rate back in positive territory: the futures market after three negative settlements
The second level alongside the chain is the futures market. The funding rate is the balancing payment that flows between buyers and sellers every eight hours on perpetual futures so that the contract price does not detach from the spot price. If it is positive, buyers pay. If it is negative, sellers pay, and that counts as a sign that bets are being placed on falling prices.
According to public market data from the exchange OKX on the ETH-USDT-SWAP contract, the rate was negative three times in a row on October 9, at minus 0.00507 percent at midnight, minus 0.00845 percent in the morning and minus 0.00204 percent in the afternoon. Since October 10 it has been positive again, most recently at 0.00147 percent, with the running period carried at 0.00056 percent. Open interest in the same contract stands at 598,771 ETH or $1.50 billion.
The values are small, and that is precisely the message. A rate close to zero means the leveraged overhang on one side has been worked off. After a week with a seven percent price loss, a cleared futures market is the friendlier of the two possible situations, because forced sales from liquidations then become rarer. It does not predict a direction.
Fund investors out, validators in: two money flows in two directions
While capital continues to move into the entry queue on the chain, it runs the other way at the exchange-traded funds. According to data from Farside Investors, reported identically by FXStreet and CoinGape, investors pulled $542.07 million out of the American spot Ethereum funds in the week to October 9, the largest weekly outflow since the end of January. October 9 alone accounted for $56.1 million. How long the streak is, the sources state differently; depending on the counting method, seven or nine consecutive trading days. We name both values rather than smoothing one of them away.
This countermovement is the real finding of the day. The price against which both are measured fell below the $2,500 mark on October 9, which we reported on yesterday with a view to the entry question. Taken together, the two flows produce a picture that neither figure delivers alone: the fast money, movable by the day, is leaving, and the slow money is hesitating noticeably for the first time in weeks.
16 days to the exit plus 7.4 days of sweep: the price of illiquidity
Anyone giving notice today waits, according to the source named above, 16 days and 18 hours in the exit queue. After that comes the sweep delay of currently 7.4 days. That is the period the protocol needs to clear and pay out the balances in order. Together that is a good 24 days between your decision and the moment the ETH sits on your address again.
That span belongs in every calculation before you stake. A ten percent price slide takes hours on a bad day; your exit takes three and a half weeks. Anyone who cannot or will not endure that time has two routes: stake a smaller share of the holding, or choose a liquid form in which a tradable claim takes the place of the locked ETH. The second route costs something of its own, namely the risk that this claim trades below its calculated value in tense phases. Which providers offer which form and at what fees is in our comparison of staking platforms.

Staking under MiCA: custodians, contractual partners and the possible total loss
In Germany, more hangs on the form of staking than on the yield. What is decisive is who holds the keys. If you stake yourself, you carry the operating risk and are liable for outages; if you stake through a provider, that provider's default risk is added, and then it matters whether your ETH is held separately from the provider's own assets. Since the requirements of the EU regulation MiCA have applied in full, providers holding customer assets need authorisation for it and must keep customer holdings segregated. Deposit insurance as with a bank account does not replace that.
For tax, two things have to be kept apart in Germany. The sale of ETH from private assets is tax-free after a one-year holding period, and that deadline is not extended by staking under the current view of the tax administration. The rewards themselves count, irrespective of that, as other income at the moment they accrue and are captured at the personal tax rate, with an annual exemption threshold applying. We already cited the relevant administrative instruction in our article of October 4 in connection with staked ETH. Because the time of accrual and the price at that time have to be documented, a clean record of the rewards matters more than the yield figure in a provider's advertising copy.
Before staking it is therefore worth looking at three points that cannot be changed afterwards: the form of custody, the provider's actual notice period as distinct from the protocol deadline, and the question of whether the rewards are recorded automatically. Crypto remains an asset with the risk of total loss, and the waiting time in the exit queue merely extends the period over which you carry it.
Our assessment: the buffer is shrinking faster than the price reflects
From the newsroom's point of view, the shift in the queues is the more important signal of this week, and the market has not priced it in so far. The evidence: the buffer falls 37.8 percent in six days, from 667,474 to 415,072 ETH, and from both sides at once, with 100,924 ETH less inflow and 151,478 ETH more outflow. In parallel, $542.07 million leave the funds. The price lost 6.9 percent in the same week, considerably less than those two flows would suggest.
Against that stands the fact that the absolute magnitudes remain small. The exit queue corresponds to 2.2 percent of the staked ETH, and exited ETH is not the same as sold ETH. The funding rate argues against it too: a futures market close to zero carries no overhang that would accelerate a downward move. Our assessment is therefore: the price does not have to fall, but the support is thinner than the quiet Saturday makes it look. That becomes verifiable on a single number: if the buffer flips into negative territory, meaning more ETH wait for the exit than for the entry, the argument about patient capital is finished. At today's pace that would be the case in around ten days.
Staking queue: 24 days between deposit and first reward
The figures in this article translate into three steps you can take today:
- Calculate with 24 days, not with the daily price. If you want to stake ETH, check first whether you can do without the amount for almost four weeks, and stake only that part. Where you buy ETH at all and at what fees is shown by the crypto exchange comparison.
- Settle the time of accrual before the first reward arrives. The rewards have to be recorded at the moment they accrue, and doing so retrospectively is laborious. Which tools record the inflows automatically is in the comparison of tax tools and portfolio trackers.
- Separate custody from staking. What you do not stake does not belong on an exchange. Which devices are suited to it and what they cost is in the hardware wallet comparison.
(As of October 10, 2026. This article is not investment advice. Prices and fee structures change; check the terms with the provider before you buy.)
A decentralised crypto exchange, DEX for short, is a program on a blockchain that settles swaps itself, without a company holding customer funds in custody. Anyone using one pays two prices: a network fee to the blockchain and a fee to the liquidity pool the swap draws on. On Ethereum the network fee for a swap currently stands at three to five cents, which effectively removes it as an argument.
What remains is the question that fees cannot answer: who holds your coins, who is liable when something goes wrong, and who provides the records for the tax office. This article works out the costs of both routes against each other and shows where the difference really lies.
What separates a decentralised crypto exchange from a centralised one
At a centralised exchange, often called a CEX, you transfer euros to a company account, buy coins there and leave them in place. The house keeps an internal account of your holdings, matches buy and sell orders in its own order book and holds the keys.
At a decentralised exchange the holding stays in your own wallet. You connect the wallet to a website, confirm a signature there, and the program on the blockchain executes the swap. Nobody receives money beforehand, there is no account, no registration and no identity check. That removes the counterparty, but also every place that could correct a mistake.
The second practical limit lies with the money itself: a DEX does not accept euros. Entry almost always runs through a centralised exchange or a broker, and only after that can you swap decentrally. The two routes are therefore less often alternatives than stations one after the other.
How a swap through an automated market maker works
An automated market maker, AMM for short, is a liquidity pool of two crypto assets whose price follows solely from the ratio of the two balances. There is no order book and no counterpart who wants to sell at your price.
If you put asset A into the pool, you take asset B out. That raises the balance of A and lowers the balance of B, and for exactly that reason the price shifts against you with every swap. With small sums in a large pool that shift is barely measurable; with large sums in a small pool it becomes the main cost item. Those who provide the liquidity pools collect the fee that every swapper pays.
Three to five cents: what the network fee on Ethereum costs right now
The network fee is the amount the blockchain charges for executing a transaction; it depends on the computational load of the operation and on demand in the network, not on the sum swapped. It is paid in Ether.
On October 9 the gas price on Ethereum stood at just under 0.12 Gwei, so around one eighth of a billionth of an Ether per computational unit. A simple swap through a decentralised exchange needs roughly 120,000 to 200,000 such units. That produces three to five cents, regardless of whether you swap 50 euros or 50,000 euros.
This figure is a snapshot and not a rule. In phases of high demand the gas price has stood at 30 Gwei and more; the same swap then costs around ten euros. The network fee is thus the only item that can move by a factor of two hundred between two days, and it hits small amounts hardest.
The pool fee is the actual price, not the network fee
The fee for the liquidity pool, by contrast, is calculated as a percentage and falls due on every swap. Large decentralised exchanges tier it by trading pair; the usual steps are 0.01 percent for stablecoin pairs, through 0.05 and 0.30 percent, up to 1.00 percent for rarely traded assets.
That puts both routes in the same order of magnitude. A centralised exchange likewise charges fractions of a percent of the order size, tiered by house and trading volume; what actually applies there is in each provider's price list. The claim that decentralised is fundamentally cheaper does not survive the arithmetic, because it applies only to the network fee and collapses on the pool fee.
The break-even sits at a few euros, and after that it no longer counts
A short calculation with today's values, as an example and not as an offer: if you put the network fee at four cents and a centralised exchange's fee at one percent, then both routes cost the same at an order size of four euros. At a quarter of a percent the break-even sits at 16 euros, at a tenth of a percent at 40 euros.
Above those amounts the network fee disappears into the noise, and all that decides is whose percentage fee is lower. Below them the decentralised route does not pay off even at four cents, because connecting the wallet, the signature and checking the target price cost time that bears no relation to a ten-euro swap. Anyone regularly buying small sums is practically always better served by a savings plan at a centralised provider.

Custody: at a DEX there is no recovery of access
This is where the difference lies that makes the fee calculation redundant. At a centralised exchange you can reset a password, write to support and, in a dispute, lodge a complaint. If you lose access to your own wallet, the holding is gone, finally and for any amount.
The same applies to mistakes while swapping. A signature you confirm is executed; a wrong destination address, a cloned portal or a tolerance set too wide cannot be revoked. Which device protects the keys and what can go wrong during setup is in our hardware wallet comparison. A decentralised exchange cannot be used without self-custody, and anyone who does not trust themselves with that responsibility has already answered the question of the DEX.
Supervision and MiCA: who is liable at a decentralised exchange, and who is not
A centralised exchange serving customers in Germany has needed authorisation as a crypto-asset service provider since 2025 and is under supervision. How the German legislature has framed that permission is set out in our article on the Crypto Markets Supervision Act.
For a protocol with no provider behind it, the classification is contested: whether and when an interface, a foundation or a development team counts as a service provider is examined case by case by the supervisory authorities, and no conclusive line exists. For the user the consequence is the same on either reading. There is no authorised contractual partner, no complaints body and no requirements on the segregation of customer funds, because there are no customer funds.
A widespread misunderstanding belongs corrected here: deposit insurance does not protect crypto assets at a centralised exchange either. What supervision delivers is organisational duties, complaint routes and a body that can be held to account, not a guarantee on the holding.
Just under a fifth of spot trading runs through decentralised exchanges
The relative sizes put the topic in context. On October 9 decentralised exchanges turned over around 10 billion dollars in 24 hours, the twenty largest centralised venues around 44 billion dollars in spot business. Decentralised venues therefore account for 18 to 19 percent of volume, depending on whether some offerings not settled on a blockchain are counted in.
The distribution within decentralised trading is narrow: Uniswap alone, in its two current versions, carries around three billion dollars and thus almost a third. Then follow, at a clear distance, PancakeSwap with about 680 million and Aerodrome on Base with around 620 million dollars. Anyone swapping decentrally ends up in practice at a handful of venues, and on the smaller ones the price shift from the section on the automated market maker becomes noticeable.
Slippage: the sum decides the price you get
Slippage is the deviation between the price an interface displays and the price at which the swap is ultimately executed. At a decentralised exchange you set a tolerance for it yourself, usually as a percentage.
This setting is the most delicate point of the whole operation. A tolerance set too tight makes the swap fail, and the network fee is still due. A tolerance set too wide opens the door to a worse price, up to deliberate exploitation by third parties who see a large order in the network and place themselves in front of and behind it. In practice that means: the smaller the liquidity pool and the larger your sum, the more precisely the displayed execution price needs checking, and before the signature, not after.

Tax: every swap on a DEX is a disposal
For tax the decentralised route brings no advantage, and many underestimate exactly that. Under Section 23 of the German Income Tax Act, the gain from a private sale of crypto assets is taxable if less than a year lies between acquisition and disposal; after that year has passed it remains tax-free. For the total of all private disposals in a year an exemption threshold of 1,000 euros has applied since 2024, and anyone exceeding it pays tax on the entire gain.
A disposal counts not only as a sale for euros but also as a swap into another crypto asset. The Finance Ministry circular of March 6, 2025 states this expressly for the administration and has replaced the older circular from 2022. A swap from Ether into a stablecoin is therefore a taxable event like a sale, even though no euro was moved.
With every swap, moreover, a new one-year period begins for the asset received. Anyone swapping back and forth several times within a year resets the clock each time, and with decentralised exchanges and their low network fees that is a realistic pattern. What a change of trading venue means for the deadline, by contrast, we have written up under switching crypto exchange: a mere transfer to an address of your own is not a sale.
Records: what the tax office expects from you at a decentralised exchange
A centralised exchange keeps an account, shows a history and often provides an annual statement. A decentralised exchange keeps no account on you. What remains are entries in a public blockchain which are complete, but not ordered by person.
Since the 2025 circular the administration expects a complete record of transactions and a consistent determination of market values. For the order of the holdings disposed of, the administration provides for the method under which the units acquired first count as sold first; a tax court in 2025 also held the reverse order admissible, which does not make the situation easier for investors. Which records are demanded in an audit we have gathered in our article on the crypto tax audit.
In practice that means three things which should be settled before the first decentralised swap: the address of your own wallet noted down, every swap recorded with date, quantity and value, and a tool in use that can read in the blockchain entries. Anyone starting only at the turn of the year reconstructs prices from the past, and that is more work than the record-keeping itself.
What a decentralised exchange is not: leverage, perpetuals and prediction markets
In the same world there are offerings that have little to do with a simple swap. Perpetuals are open-ended futures contracts with leverage, where a price move against your position leads to forced closure. The products look similar in presentation and are not comparable in risk; they belong in a separate treatment, which we keep in our comparison of perp DEXs.
For this article a clear demarcation therefore applies: what is meant is the swap of one crypto asset into another at the prevailing price, without leverage, without funding costs and without liquidation risk. Anyone who, while browsing a decentralised interface, strays into a section with leveraged products has changed product area, even if the page looks the same. Total loss is possible there within minutes.
DEX or centralised exchange: custody decides, not the fee
Three steps lead to a decision that fits your own situation:
- For entry with euros it stays with the centralised exchange. A decentralised venue accepts no bank money, and for regular small purchases a savings plan beats any network fee. Which provider works at which costs is shown by our crypto exchange comparison.
- Authorised or not, settle it before the first euro. Check whether the provider you have chosen holds a permission for business in crypto assets, because the complaint route and organisational duties hang on that. The houses with authorisation are in our comparison of regulated crypto exchanges.
- Swap decentrally only with your own custody and your own bookkeeping. Only once the keys are secured and every swap is recorded with date and value is the decentralised route manageable. The tools from our overview of crypto tax tools and portfolio trackers help with the recording.
(As of October 9, 2026. This article is not investment advice. Prices and fee structures change; check the terms with the provider before you buy.)
On October 30, 140,844 Bitcoin contracts expire on the options exchange Deribit. At a price of $82,977 on Saturday afternoon that is $11.69 billion in notional value, and two thirds of it are bets on higher prices. The largest of them sits at $95,000, a good 14 percent above today's level. Arithmetically, an expiry at $78,000 would be cheaper for the other side. The rest of the month plays out between those two numbers, and the level where the direction is decided is $80,000.
An options expiry is not an event that moves the Bitcoin price by itself. It does change how expensive hedging is and how many contracts the option writers still carry on their books as the date approaches. Anyone buying, selling or hedging over the coming three weeks meets a market whose positioning is already visible today. This article reads that positioning off the open contracts instead of guessing it.
140,844 Bitcoin options expire on October 30, worth $11.69 billion
Deribit handles the bulk of global trading in Bitcoin options. In its public statistics the exchange reports for every expiry date how many contracts are still open. The reading from October 10, queried in the afternoon: 140,844 contracts for October 30, of which 95,165 are calls and 45,680 puts.
A call gives its holder the right to buy Bitcoin at a fixed price. It gains value when the price rises. A put is the counterpart and gains when the price falls. The ratio of puts to calls for this date is 0.48. For every dollar betting on falling prices there are therefore a good two dollars betting on rising ones.
For comparison: at 140,844 contracts the monthly expiry is 9.4 times the size of the next weekly one on October 16, which comes to 15,037 contracts. The large addresses position themselves on a monthly horizon, not a weekly one. For price formation, October 30 therefore carries more weight than any date before it.
Why the biggest call wall sits at $95,000 while the price sits at $82,977
The distribution across strike prices says more than the total. Three strikes alone account for 54,750 of the 95,165 open calls:
- $95,000: 25,031 contracts, 14.5 percent above the current price
- $90,000: 15,158 contracts, 8.5 percent above it
- $100,000: 14,562 contracts, 20.5 percent above it
Among the puts the picture is different. There the largest single position is the $70,000 strike with 3,212 contracts, followed by $80,000 with 2,791 and $72,000 with 2,531. The hedges therefore sit much closer together and further down, while the call bets cluster in a narrow band far above.
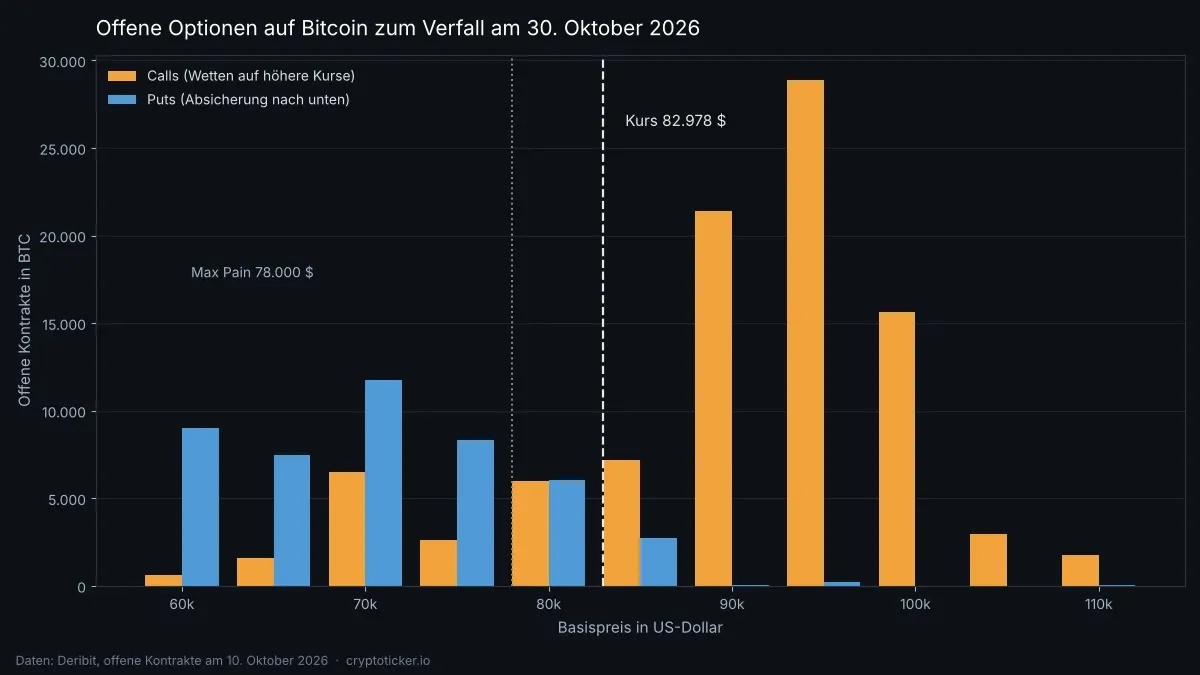
This pattern has a plain explanation, and it has little to do with conviction. A call far out of the money costs little. Anyone holding a large portfolio who does not want to miss the upside buys a cheap option at $95,000 rather than Bitcoin at the full price. The height of the call wall therefore measures how much money stands ready, not how many market participants actually expect $95,000.
Max pain at $78,000, and what that number does not do
From the same distribution you can calculate the point at which the sum of all payouts to options buyers would be smallest. That point is called max pain and for October 30 it sits at $78,000, 6 percent below today's price. If Bitcoin expired there, the bulk of the open contracts would expire worthless and the writers would keep the premiums they collected.
Caution is in order here. Max pain is an accounting figure derived from today's positioning, not a forecast and not a price target. The number changes with every newly opened contract, and it assumes that the writers leave their books untouched. Studies of max pain theory on equity options show no reliable link to the actual expiry price. What the number does deliver is a weighting: the value shows where in the price range most contracts sit.
More consequential in practice is the writers' hedging. Anyone who has sold options holds an offsetting position in the spot market and adjusts it continuously. As the price approaches a strike with many open contracts, that adjustment grows. In the final trading days before an expiry this can dampen price moves as long as the price stays in the zone with many contracts, and amplify them as soon as it leaves. The densest zone currently lies between $78,000 and $80,000, where 5,262 put contracts are open in total.
The weekly expiry on October 16 turns the ratio around
The next date is considerably smaller, but it tells the opposite story. For October 16, 15,037 contracts are open, of which 9,025 are puts and 6,012 calls. The ratio of puts to calls is 1.50 instead of 0.48. The largest single position there is a put at $80,000 with 2,262 contracts.
The same level thus appears at both dates as the largest hedge below the price. Over the short term investors are insuring against a slide below $80,000, over the monthly horizon they are betting on $95,000 and above. That is not a contradiction but the usual division of labour between insurance and wager: nobody wants to come through the next two weeks unprotected, and the month is still meant to run higher.
What has moved since the forecast of October 9
On October 9 this slot carried the assessment by the major bank Standard Chartered, which had reaffirmed its target of $100,000 by year-end while $729 million flowed out of the spot ETFs within two days. Since then the price has recovered from $81,686 on Thursday to $82,977, a gain of 1.58 percent. The $80,000 level was not tested in that period.
What is new is the futures-market view of the same target. The $100,000 that Standard Chartered names is covered on the options market with 14,562 contracts for October 30, the $95,000 with 25,031. The analyst target therefore does not stand alone: on the futures market more money sits one step below it than on the round number itself. Anyone holding the bank's forecast against the positioning sees the same optimism, only with a slightly nearer target.
The daily range stays narrow in the meantime. Between $82,229 and $82,987 there were only $758 over the past 24 hours, which is 0.9 percent. Over 30 days the range runs from $75,590 to $86,597; the current price sits 1.07 percent above the monthly average of $82,097 and 4.2 percent below the monthly high.
Funding at 0.00595 percent: the perpetual shows no greed
Alongside the options there is the second futures market, the perpetual contracts. These contracts never expire and are kept in line with the spot price through a balancing payment, the funding rate. When it is high, long positions pay the short positions, and the market is top-heavy to the upside.
On Deribit this rate for the Bitcoin perpetual stands at 0.00595 percent per eight hours, so 0.0179 percent per day and around 6.5 percent per year. That is an unremarkable value. At tenfold leverage, merely holding the position costs 0.18 percent of the stake per day, so 3.6 percent over the 20 trading days until the expiry, before the price has moved at all. Open interest in the perpetual there amounts to $829.2 million.
The reading from this: the options side is positioned optimistically, the leverage side is not. An overheated funding rate would be the warning signal for a wave of liquidations. At 6.5 percent per year that signal is missing.

Difficulty rises by 3.03 percent, of all days on October 16
A third angle comes from the chain itself. Every 2,016 blocks the Bitcoin network adjusts its difficulty so that a block is found every ten minutes on average again. According to data from mempool.space, 920 blocks are still missing until the next adjustment, and it comes out at 3.03 percent to the upside. It is expected around October 16, the day of the weekly expiry.
Computing power in the network stands at around 1.0 zettahash per second, the current difficulty at 132.72 trillion. A rising difficulty means that miners have added capacity despite the price decline of recent weeks instead of switching off. For the direction of the price that is no signal; for context it is: production costs per Bitcoin rise with difficulty, and miners who have to sell to pay their electricity bill then tend to sell more rather than less.
How to check your position before the expiry
For investors in Germany, more hangs on the question of which instrument you hold Bitcoin through than just the return. Directly held coins fall under private disposal under Section 23 of the Income Tax Act, with the familiar one-year deadline. Options, futures and perpetuals are forward transactions and are treated as investment income under Section 20 of the Income Tax Act. The one-year deadline does not apply there, and gains are taxable from the first euro above the saver's allowance.
That has a practical consequence which tends to get lost before an expiry date: hedging your coins with a put does not cost you the one-year deadline on the coins themselves, because the hedge and the holding are two separate transactions. Selling your coins and getting back in later through a perpetual, by contrast, means you have disposed of the holding and the deadline starts at zero. Which variant is more favourable for tax depends on the acquisition date, and that is in your own records. A tax tool with a portfolio tracker works through both cases for you before you trade.
Three points can be checked today without pre-empting a direction. First, your entry date: if it is more than twelve months back, a sale would be tax-free, and a sale shortly before the deadline expires is rarely the better choice. Second, your funding costs if you are leveraged: 0.18 percent per day at tenfold leverage adds up to 3.6 percent by October 30. Third, your trading venue. A provider of perpetual contracts reports the funding rate and the liquidation price differently, and the differences become expensive precisely when things have to happen fast.
From the newsroom's view: the call overhang is not yet a price signal
Our assessment of this data: the ratio of 0.48 puts per call is frequently read as confidence, and that is exactly what we consider too short-sighted. The evidence for that is in the distribution. 54,750 of the 95,165 calls sit at $90,000 and above, that is at strikes which cost little today and only become worth something on a move of more than 8 percent in three weeks. Positions like that are cheap lottery tickets and make poor sentiment gauges.
What argues against turning that reading against the confidence: the funding rate of 6.5 percent per year shows no overheated leverage, and the price has recovered 1.58 percent since October 9 without testing the $80,000 level. A market that does not head for the most important hedging zone is not in panic. Our reading is therefore the sober one: the positioning is friendly but thin, and the robust information lies not in the direction but in the $80,000 level, where both expiry dates carry their largest hedge. We derive no price prediction from that.
Expiry on October 30: below $80,000 the call camp loses its cushion
The situation in three steps you can work with:
- Note the $80,000 level. That is where 2,262 put contracts sit for October 16 and 2,791 for October 30, in both cases the largest hedge below the price. If the price falls below it, the call side loses its cushion and the writers' hedging transactions amplify rather than dampen. Where you buy or sell Bitcoin is something you compare in the exchange comparison, before it comes to that.
- Keep an eye on the funding rate. If it rises markedly from today's 0.00595 percent per eight hours, the risk of a wave of liquidations before the expiry grows. The current values by trading venue are in the comparison of perpetual providers.
- Look up your acquisition date. Whether a sale before October 30 would be tax-free or not depends on it. A portfolio tracker with a tax function pulls the deadlines out of your transactions.
(As of October 10, 2026. This article is not investment advice. Prices and fee structures change; check the terms with the provider before you buy. Trading crypto assets, and leveraged forward transactions all the more so, can lead to the total loss of the capital employed.)
You can buy Bitcoin at ING, but not as a coin. What ends up in the bank's Direkt-Depot are crypto ETNs: exchange-traded notes that track the price of a cryptocurrency. The bank lists around 50 of them in a promotional offer, from five issuers, as a one-off purchase or as a savings plan from one euro per instalment. You need no wallet for this and no private key. What you hold at the end is a security, not a cryptocurrency, and two things hang on that distinction that cost or save more money over the years than any order fee: the ongoing product costs and the question of whether the one-year holding period applies to you.
This article sorts out ING's crypto investments: what is tradable, what trading costs, who really pays the zero-euro order fee, and what the tax treatment equal to a direct purchase of Bitcoin actually depends on.
Can you buy Bitcoin at ING? Crypto ETNs yes, coins no
ING lists crypto as a separate product group within its securities offering, not as a crypto exchange. On its product page the bank describes the offer as access to Bitcoin and other cryptocurrencies without a wallet and without private keys, traded through the existing Direkt-Depot. No account at a crypto exchange is needed for this, and no custody solution either: these securities sit in the portfolio like a share or an ETF, with the same settlement and the same tax statement.
What the bank does not offer is the purchase of real coins. There is no crypto trading, no ING wallet and no way to send purchased Bitcoin to your own address. Anyone who wants to hold the coins themselves needs a crypto exchange or a broker with delivery; you will find an overview of the providers with German authorisation in our comparison of regulated crypto exchanges.
For many investors that is precisely the appeal. The portfolio is familiar, the tax statement comes from the bank, and the question of where to keep the key never arises. The price for that is in the product documents, and it is higher than the order fee suggests.
What a crypto ETN is: a bearer note, not a crypto asset
An ETN is an exchange traded note, a listed debt security; in the plural the industry speaks of exchange traded notes. Legally it is a promise by the issuer to pay you the value of an underlying asset, and not a stake in assets that belong to you. The key information document for the VanEck Bitcoin ETN contains this sentence: “The product is a bearer debt security under German law.” It is certified by a global note held in custody at Clearstream Banking Frankfurt.
The difference from an investment fund matters, because it is often lost. An ETF is a separate pool of assets: investors' money is segregated from the assets of the fund company and survives the insolvency of the provider. An ETN has no such segregated pool. It is a claim against a company, and that claim is only as good as the company and the collateral it has posted for it. Physically backed means, for the common crypto ETNs, that the issuer stores the corresponding amount of cryptocurrency with a custodian for every note issued.
How this product type differs from certificates and directly held coins is something we have broken down in a separate article: Bitcoin certificate, ETN or coin compares the three routes for your portfolio. If you want to sort out the product category as a whole, the overview is at buying a crypto ETF in Germany.
Around 50 crypto ETNs from five issuers: what you can trade in the portfolio
On its crypto page the bank names five premium partners as issuers: 21Shares, Bitwise, VanEck, WisdomTree and iShares. The promotional offer covers around 50 crypto ETNs. That spans the large underlying assets, Bitcoin above all, plus Ethereum and Solana, and depending on the issuer further crypto assets and index products that bundle several coins.
Which ETN belongs to which underlying is something you read from the ISIN and the product name, not from the issuer alone: each of the five providers runs several notes. The VanEck Bitcoin ETN carries the ISIN DE000A28M8D0, the issuer is VanEck ETP AG, and the Liechtenstein financial market authority FMA is responsible for that product's key information document. The fact that an ETN is tradable in Germany and carries a German ISIN therefore does not mean that the issuer is under German supervision.
Each of these notes tracks performance through a reference price. For the VanEck product that price is calculated by MarketVector Indexes GmbH, a company affiliated with the issuer, from the prices of the most important trading venues for digital assets, weighted by liquidity. The product's price is determined on every business day. For you that means the quote in your portfolio follows an index calculated by a company within the issuer's group, not the price of a single exchange where you could buy yourself.

The zero-euro order fee is paid by the issuer, not the bank
Under the promotional offer, buying the crypto ETNs carries an order fee from zero euros, plus product costs, spreads and inducements. That footnote is the interesting part. The bank explains the promotion itself: during the promotion a reduced order fee applies, and the bank is reimbursed for it by the distribution partner, meaning the issuers. The term for this is an inducement.
The arithmetic behind it is simple. The issuer earns its money from the ongoing costs of the product, which it deducts from the invested value every year, and not from your individual order. The longer you hold the note, the more it earns. Covering an order fee that is charged once is, for the issuer, an investment in a holding that pays annually. The purchase is therefore free only at the till, not over the holding period.
ING also expressly reserves the right to end promotions at any time, to change their terms or to postpone announced promotions. The zero-euro order is thus a condition subject to withdrawal and not a guaranteed feature of the portfolio. Anyone calculating for the long run does better to calculate with the standard order fees in the price list and to check them in the portfolio before buying. How widely German providers differ on order fees and spreads is shown in our crypto broker comparison.
Running costs of 1.00 percent: what the key information document works out
The key information document for the VanEck Bitcoin ETN puts management fees and other administrative or operating costs at 1.00 percent of the invested value per year, estimated on the basis of the previous year's actual costs. Transaction costs inside the product are stated as 0.00 percent. The issuer charges no entry fee and no exit fee either, although the selling institution may charge fees of its own.
The document works it out using an example of $10,000: exiting after one year, total costs are $100; exiting after five years, $490. The annual cost impact is 1.0 percent in both cases. As a recommended holding period the issuer states five years.
Transferred to a smaller sum: anyone who puts 1,000 euros into a product with 1.00 percent ongoing costs pays around ten euros in the first year, regardless of whether the price rises or falls. On a direct purchase at an exchange this item does not arise; there you pay a trading fee and the spread when you buy and when you sell, and nothing after that, but you carry the responsibility for custody yourself. The calculation therefore comes down to a threshold: the holding period beyond which the ongoing product fee exceeds the one-off trading fee of a direct purchase.
Crypto ETN savings plan from one euro: where it differs from an ETF savings plan
Crypto ETNs can also be bought through a savings plan at ING. The bank states the execution fee in the discounted savings plan as zero euros, plus product costs, spreads and inducements, and names a minimum instalment of one euro. That puts the crypto ETN in the savings plan range alongside ETF, fund, share, ETC and certificate savings plans.
Technically it works like any securities savings plan: on the execution date the bank buys units for the instalment, fractional units included. The difference from an ETF savings plan lies in the product underneath, not in the mechanics. An ETF savings plan buys units in a segregated pool of assets, a crypto ETN savings plan accumulates debt securities of a single issuer. Anyone saving over years is therefore also building concentration risk towards that issuer, and it grows with every instalment.
A second point concerns tax and is often overlooked: in a savings plan every instalment has its own acquisition date. If the one-year holding period applies to your product, it runs separately for each individual instalment. After a year of saving, then, the whole holding is not free, only the instalments that are more than twelve months old.
Tax: why the delivery claim decides the one-year holding period
On its product page ING lists among the opportunities the tax treatment equal to a direct investment in cryptocurrencies, and adds that price gains may be exempt from capital gains tax on a holding period of more than one year. That is the bank's position, and it describes the favourable case accurately. What the sentence does not say is what that equal treatment depends on.
What matters is whether you, as the holder of the note, have a claim to delivery of the cryptocurrency. If such a delivery claim exists, the tax authorities regularly treat the sale like the disposal of the crypto asset itself, that is as a private disposal transaction under Section 23 of the German Income Tax Act, with the one-year deadline and the exemption threshold within that period. If the delivery claim is missing, or the note tracks the price synthetically through derivatives, the instrument is a monetary claim: then the flat-rate withholding tax under Section 20 of the Income Tax Act applies, with no holding period at all, and even a sale after ten years remains taxable.
This is exactly where it pays to look into the product documents instead of the advertising. The key information document for the VanEck Bitcoin ETN states: “Investors may, under certain conditions, demand redemption in kind or, in limited cases, redemption in cash directly from the issuer.” Redemption in kind means delivery of the coins. The same document, however, also states that authorised participants are empowered to acquire baskets of 50,000 notes from the manufacturer and to return them to it. The precise conditions for redemption are governed by the final terms, not by the information document.
Our assessment: equal tax treatment is a question about the individual product and not a property of the category. The evidence for that is in the documents themselves, namely in the combination of redemption in kind “under certain conditions” and a basket size of 50,000 units for authorised participants. Anyone sitting on a three-digit number of notes in their portfolio should therefore check before buying what claim the final terms actually grant them personally, and discuss the result with a tax adviser. Against that stands the fact that for years the tax authorities have in practice treated physically backed products with a delivery claim like a direct investment; a binding ruling on a specific note is not replaced by that. How to document holding periods and acquisition dates cleanly across several portfolios is shown in our comparison of crypto tax tools.
On top of that, a change is on the horizon: a draft bill from the German Federal Ministry of Finance would tax gains from crypto assets as investment income in future, irrespective of the holding period, and a parliamentary paper from May 2026 on the subject is before the Bundestag. Nothing has been decided. For the current year the one-year deadline applies unchanged, and as things stand the drafts would affect only assets acquired after December 31, 2026.
Issuer risk: what the global note at Clearstream means and what it does not
ING names issuer risk expressly in its list of risks: in the event of the issuer's insolvency, the holder of the ETN faces a risk of loss up to and including total loss. That sentence is not a mandatory platitude, it describes the legal core of the product type.
The global note at Clearstream Banking Frankfurt ensures that the security can be held in custody and transferred at all. It is not security for the value of the claim. What counts in an insolvency is the coins on deposit and the legal construction by which they are allocated to the holders of the notes. Physically backed means that the cryptocurrency is genuinely stored; whether and how quickly you can reach it in insolvency proceedings is governed by the terms of issue and by the law at the issuer's domicile.
A second right appears in the same documents: the issuer may call the product before the maturity date, and the redemption amount may then be lower than the amount that would have been expected at the end of the term. The maturity date of the VanEck Bitcoin ETN is December 31, 2039. A call before that date is possible, and it would trigger the sale whether the timing suits you or not. Which documents you should go through before buying is something we have written up in our article on issuer risk in crypto ETNs.
Risk class 6 of 7 and the securities knowledge on file
In the key information document the VanEck Bitcoin ETN is classified in risk class 6 on a scale of 1 to 7. The issuer offers no capital guarantee, there is no guaranteed minimum return, and the investor may lose all or part of their investment. The risk indicator is based on the assumption of a five-year holding period; on an earlier sale the actual risk may differ considerably.
ING therefore sets a hurdle before the first order: to trade these products, securities knowledge must be recorded in the portfolio. The bank points out that crypto ETNs are suitable above all for experienced investors who can assess the opportunities and risks. Anyone who has not kept those details up to date in their portfolio will have the order rejected and must add the knowledge first.
The same list of risks at the bank contains four further points that advertising material tends to leave out: the high risk of loss from the volatility of prices, regulatory uncertainty, because changes in the law can heavily influence prices and taxation, the susceptibility of crypto markets to manipulation and fraud, and liquidity risk, meaning the danger of not being able to trade crypto assets at fair market prices. Total loss is possible in this asset class.

ETN, ETP or ETF: why Germany has no true Bitcoin ETF
The three abbreviations get used interchangeably, in press coverage too. ETP is the umbrella term for exchange-traded products and covers ETFs, ETCs and ETNs. An ETF is an investment fund with a segregated pool of assets. An ETC tracks commodities. An ETN is the debt security at issue here. ING describes crypto ETNs on its page as exchange-traded products that track the performance of cryptocurrencies, and also calls them crypto trackers.
A fund under European law may not put its assets into a single cryptocurrency, because the rules on risk diversification prevent it. In Europe that limit is the reason for the entire ETN construction. That is why Germany has no Bitcoin ETF in the legal sense, even though the term is everywhere. What exists are ETNs and ETCs on crypto assets. The spot products approved in the United States are called ETFs there, but they are subject to different rules and are generally not tradable for a German portfolio.
For your portfolio that yields a clear reading rule: when a provider speaks of a crypto ETF, it is worth looking into the key information document to see which product type is named there as the type. If it says bearer debt security, you are holding an ETN, and issuer risk and the tax question described above apply.
Portfolio versus your own wallet: when the detour through a securities account pays off
ING's offer has a clear addressee: investors who already run a securities portfolio, who see crypto assets as an admixture in their asset statement and who do not want to take on responsibility for a private key. For them the barrier to entry disappears that an exchange account with verification and a withdrawal address represents. The bank names as further advantages a reduced third-party risk, because no dependence on external crypto services arises, and lower spreads compared with a direct investment.
Three things argue against the portfolio route that cannot be negotiated away. The ongoing product costs continue every year, in a sideways market too. Issuer risk is added to price risk rather than replacing it. And the coins do not leave the product: you cannot spend them, cannot transfer them, cannot use them for staking and cannot move them onto a hardware wallet of your own.
Anyone who plans to hold or move crypto assets themselves anyway is paying, with an ETN, for a wrapper they do not need. In that case the direct route runs through an authorised exchange with withdrawal to your own address, with everything that entails in terms of responsibility.
ING and Bitcoin: without a delivery claim the holding period stays open
Around 50 crypto ETNs from five issuers, a zero-euro order fee during the promotion and a savings plan from one euro make getting started at ING convenient. The two items that count over the years sit elsewhere: in ongoing costs of one percent a year and in the question of whether your note grants a delivery claim. Three steps before you send off your first order:
- Read the product documents before you buy. Take the ISIN of the note that interests you and look in the key information document to see which product type is stated there, how high the ongoing costs are and when the term ends. How to work through these documents is set out in our crypto broker comparison.
- Settle the delivery claim before you rely on the one-year deadline. Request the final terms of your product from the issuer and have the tax treatment for your case confirmed by a tax adviser. You document the holding periods and acquisition dates with the tools from our comparison of crypto tax tools.
- Calculate the portfolio route against the direct purchase. Set the ongoing product fee against your planned holding period and compare it with the trading fee and spread at an authorised exchange from our comparison of regulated crypto exchanges. If you want to hold the coins yourself anyway, the decision is made there.
(As of October 10, 2026. This article is not investment advice. Prices and fee structures change; check the terms with the provider before you buy.)
Bitcoin stands at $82,749 on Saturday afternoon, which is around 73,863 euros. Over the past 24 hours the price has moved by 0.2 percent; measured across the week it is 2.1 percent lower. Set against the days before it, that is close to standstill. And that standstill is the story of the day, because Wednesday brings the US consumer price index, the appointment likely to set the direction for the coming weeks.
Anyone looking at the Bitcoin chart today sees little. Anyone looking at the range sees something that can be put in figures: the gap between the daily high and the daily low has fallen to less than a third of the weekly average. This article tells you which levels count coming out of that calm, what happens on Wednesday at 2.30 p.m. German time, and which three figures in your own portfolio should be settled beforehand.
Bitcoin price at $82,749: the figures on Saturday afternoon
The price has been moving in a narrow band since the morning. The 24-hour high stands at $83,204, the low at $82,229. Between the two lie $975, or 1.2 percent. For comparison: on Thursday, $3,136 lay between high and low.
Converted into euros, Bitcoin stands at around 73,863 euros. The figures come from CoinGecko, as of Saturday, October 10, early afternoon. For context: a good 34 percent currently separates the price from its record of $126,080.
A brief definition, because it carries the rest of the article. The daily range is the distance between the highest and the lowest price of a day, expressed as a percentage of the daily low. The figure measures how far the market swung on a given day, irrespective of where it ends up. A day can close at plus zero percent and still have had a range of four percent.
0.74 percent: the narrowest range of the week
For this article we evaluated CoinGecko's four-hour candles for the past two weeks and determined the high and low for each calendar day from them. The result for the past seven days, in each case as the percentage gap between daily high and daily low:
- Sunday, October 4: 1.12 percent
- Monday, October 5: 2.28 percent
- Tuesday, October 6: 1.79 percent
- Wednesday, October 7: 3.42 percent
- Thursday, October 8: 3.90 percent
- Friday, October 9: 2.24 percent
- Saturday, October 10 up to the early afternoon: 0.74 percent
The six days before today average 2.46 percent. The running Saturday sits at 0.74 percent and therefore at just under 30 percent of that value. The day is not over yet, so the range can still grow. Even if it doubled by midnight, it would stay below the week's average.
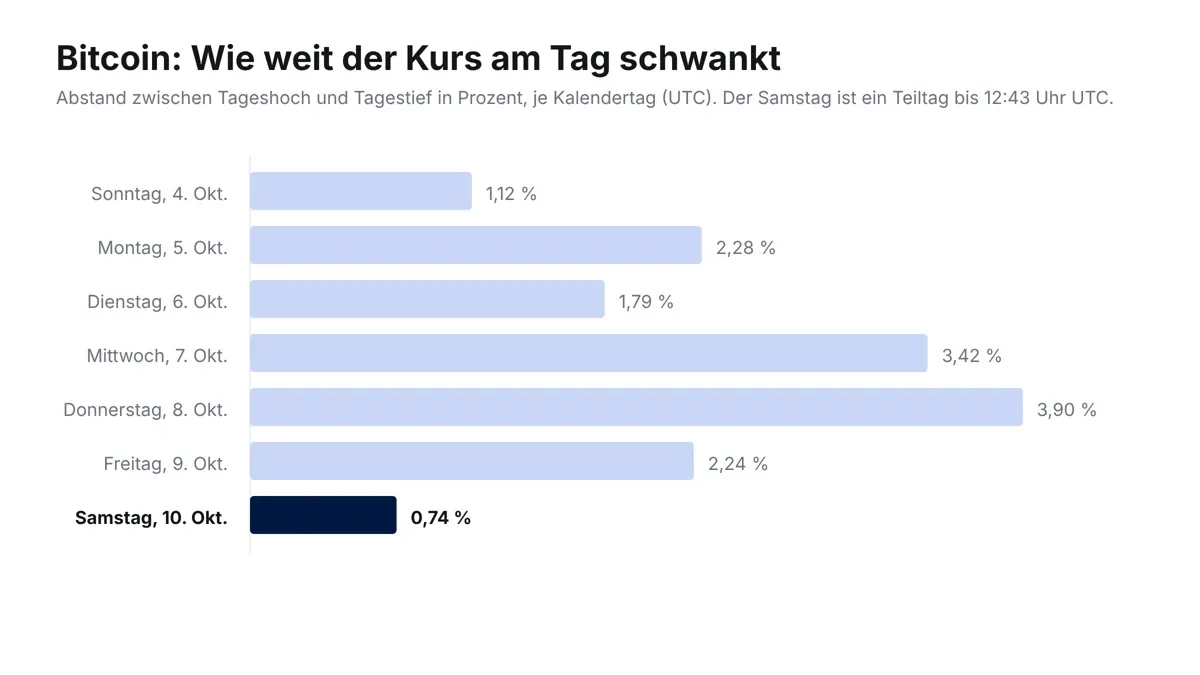
That Saturdays run quieter than weekdays is normal: the US exchanges are closed, the ETF counters stand still, institutional orders pause. What is remarkable is the margin. The previous Saturday, October 3, came to 0.93 percent, and the Sunday after it to 1.12 percent. So today is narrow even for a Saturday.
What has changed since Friday
On Friday we wrote in this slot about the Bitcoin price and the oil price. Bitcoin stood at $82,991 at the time, Brent had fallen to $103.53, and the question was whether a retreating oil price relieves the crypto market.
Since then almost nothing has happened to the price: $82,749 today against $82,991 on Friday afternoon is a difference of $242, or 0.3 percent. What has changed is something else, namely the movement itself. On Friday the price still swung 2.24 percent within the day, today 0.74 percent. The $82,000 level, briefly breached on Thursday evening, has not been touched since early Friday. Thursday's low of $80,427 has therefore stood unchallenged as the week's lowest point for two days.
For you as a reader following this thread, that means the question has shifted. Last week it was about whether the slide would continue. That question has been answered for now; it did not continue. Now it is about which direction the market comes out of this calm in, and what pushes it there.
Why a narrow range ahead of a data release is no cushion
The mechanism behind it is less mysterious than it is often made out to be, and it can be explained in three steps.
First: when the price barely swings for hours, measured volatility falls, and the risk models of trading houses hang on it. Lower measured volatility allows those same models a larger position on the same risk budget. So positions tend to get bigger, not smaller.
Second: in the futures market, stop orders and liquidation thresholds gather close together in such phases, because many participants set their levels at the same visible points, at the daily high, at the daily low, at a round number. The narrower the range, the closer together those points lie.
Third: when a piece of news then forces a direction, those thresholds get touched in quick succession. Every triggered liquidation is a market order that pushes the price further in the same direction and reaches the next threshold. That is how a cascade forms.
What that looks like in practice could be observed on Thursday of this week. We analysed at the time that 94 percent of Dogecoin liquidations hit long positions, meaning bets on rising prices. Bitcoin fell from $83,563 to $80,427 that day. The trigger was no catastrophe but a chain of the oil price and restrained expectations of the US Federal Reserve.
The CPI on Wednesday, October 14: what happens at 2.30 p.m. German time
On Wednesday the US Bureau of Labor Statistics publishes the consumer price index for September. The time is 8.30 a.m. local time on the US East Coast, so 2.30 p.m. in Germany. The CPI, short for consumer price index, measures how much a fixed basket of goods and services has risen in price against the same month a year earlier. It is the single most important figure for rate expectations in the market.
Why this release matters for Bitcoin: the expectation of whether and how far the US Federal Reserve cuts rates moves the dollar and the appetite for risk across all markets. Rising inflation argues against rate cuts, and rate cuts failing to arrive have regularly weighed on crypto prices over the past two years. The link is not mechanical, but it has been stable enough since 2022 that trading desks position themselves accordingly.

Two things make this Wednesday particular. For one, analysts cited by Admiral Markets expect the annual rate to rise from 3.4 to between 3.6 and 3.7 percent, driven above all by petrol prices in September. For another, it is the last inflation figure before the US Federal Reserve's rate decision on October 28. A reading markedly above expectations would therefore meet a market that has no further opportunity to reorganise itself before then.
You can look up the release date itself at the US Bureau of Labor Statistics, where the publication calendar is kept.
Bitcoin is holding up better than the altcoins: the weekly balance
A second perspective alongside the chart is the comparison within the market. Over the past seven days the large names stand as follows:
- Bitcoin: minus 2.1 percent
- Shiba Inu: minus 4.1 percent
- XRP: minus 5.4 percent
- Ethereum: minus 7.0 percent
- Chainlink: minus 7.1 percent
- Dogecoin: minus 7.6 percent
- Solana: minus 8.1 percent
So Bitcoin has taken on around a quarter of Solana's loss and a good third of Dogecoin's. In market phases where money moves out of risk, that is a familiar pattern: the smaller names give way more strongly, because their order books are thinner and because investors sell first where the leverage was greatest.
For placing today, that means the quiet range in Bitcoin is no sign of general market calm. The picture shows rather that Bitcoin is at present the most stable part of a market that is giving way overall.
The levels to the upside: $83,204 and $84,150
To the upside, two points can be justified. The first is the 24-hour high at $83,204. It is the boundary of the current range, and a break above it would be the first signal that the calm is ending upwards.
The second lies higher. The analysis service DiarioBitcoin locates the next resistance in the zone between $84,150 and $84,260, and points out that the price trades below the moving averages of the past 7, 15 and 20 days while still sitting above those of the past 30, 50, 90 and 200 days. Trading volume there is below the average of the past 30 days, which fits the picture of a narrow range.
What that distance means in practice: from the current level to the upper zone is around 1.7 percent. That is a move the market has managed several times on a normal trading day this week.
The levels to the downside: $82,229 and $80,427
To the downside, the first level is the 24-hour low at $82,229, a good 0.6 percent below the current price. That marks the lower edge of the calm zone.
The second and more important level is the weekly low at $80,427 from Thursday evening. The weekly low sits around 2.8 percent below the current level. What is special about it is not the number but what it marks: the price was last below that point in early September. A break beneath it would not merely repeat Thursday's slide but extend it.
The analysis service Börse Global additionally names the round $83,000 as a short-term decision level and sees the zone around $80,000 in focus on a slip below it. Both assessments point in the same direction: between a good $80,000 and a good $84,000 stretches the frame in which the coming days will be decided.
Leverage and liquidation: three figures that should be settled before Wednesday
When the range is narrow and a release is pending, the obvious action is not to guess a direction. It makes more sense to know your own figures beforehand. Three of them can be calculated concretely.
First, the liquidation price. Anyone holding a leveraged position finds it in the position overview at their exchange. What matters is the distance to the current price in percent. If it is under 3 percent, it lies within what Bitcoin covered on each of this Wednesday and last week's Thursday in a single day. Anyone working with leverage should additionally know how the funding rate and the settlement work on their platform, because both shift the liquidation price over the holding period.
Second, the holding period. In Germany, gains from selling cryptocurrencies are tax-free after a holding period of one year; within the year the exemption threshold of 1,000 euros per calendar year applies. Anyone holding balances close to the year-end cut-off should know which part of the holding was bought when, before reacting in panic on Wednesday. What comes together for tax purposes in October this year is set out in our article on Bitcoin tax and the December 31 cut-off.
Third, the buying route. Anyone wanting to buy more should $80,427 be tested needs the route beforehand, not in the moment of the move. Verification at a new exchange takes hours to days, a bank transfer overnight. Which providers are authorised in Germany under the MiCA regulation and what they cost per order is set out in our crypto exchange comparison.
Our assessment of the situation ahead of Wednesday
In the editorial team's view, the narrow range is the most remarkable signal of this weekend, and it argues for tension rather than relief. The evidence: at 0.74 percent, the range sits at less than a third of the weekly average of 2.46 percent, trading volume is below the 30-day average as measured by DiarioBitcoin, and the market has the CPI on Wednesday ahead of it, the last inflation figure before the rate decision on October 28.
What argues against overstretching this reading: a quiet Saturday is first of all a Saturday. October 3 came to 0.93 percent without an extraordinary week following it. And the direction in which a market emerges from a narrow phase cannot be derived from the narrowness itself; it says something about the possible force of the move, nothing about its sign.
What follows from that is therefore not a directional bet but a question of preparation: the two levels of $82,229 and $80,427 to the downside, along with $83,204 and the zone around $84,150 to the upside, are the points at which Wednesday will show where the market wants to go.
Bitcoin before the CPI: $82,229 is the first level on Wednesday
To take away, in the order in which the three steps make sense:
- Recalculate your own thresholds. Note the liquidation price and its distance to the market in percent. If that distance is under 3 percent, it lies within a normal daily move of this week. The settlement models of the leverage platforms are in the perp DEX comparison.
- Settle the buying route beforehand. Verification, payment method and order fee are fixed before a level is tested, not after. The providers authorised in Germany and their cost per order are in the exchange comparison.
- Put the date in the diary. Wednesday, October 14, 2.30 p.m. German time. Anyone with an order open at that moment should know that spreads regularly widen in the minutes afterwards. Anyone preferring to track the move through an exchange-traded product will find the routes tradable in Germany in the overview of crypto ETFs and ETPs.
(As of October 10, 2026. This article is not investment advice. Prices and fee structures change; check the terms with the provider before you buy.)
Decrypt
A proposed rule would expressly fold event contracts tied to sports, politics, culture and weather into the “swap” definition, while an interim rule excludes casino-style gambling—sharpening the agency’s claim to exclusive jurisdiction.
The Bermuda-based insurer, which runs entirely on Bitcoin, drew the funding from existing backers led by Bain Capital Crypto after a record year driven by demand from wealthy families in Asia, Europe and the Middle East.
Physicists at George Washington University say a formula can estimate when an AI chatbot will flip from good answers to bad ones, and early tests on small models back it up.
A National Assembly committee adopted amendments taxing stablecoin swaps and crypto exits by wealthy holders, then rejected the 2027 budget's revenue section.
Executives are war-gaming the political fallout of a major AI-driven cyberattack and preparing to brief Congress fast if and when necessary.
U.Today - IT, AI and Fintech Daily News for You Today
This week’s top stories: October 4–10.
The surge puts Shiba Inu layer 2 Shibarium’s transaction activity back in focus.
BTC Pioneer Adam Back Takes Aim at Ethereum in favor of Bitcoin’s UTXO Model.
Ex-Ripple Exec highlights XRP Ledger’s next growth chapter amid AI payments surge.
A large amount of Solana tokens exit major cryptocurrency exchanges as sellers appear to be dominating the market following its price downturn.
Blockonomi
TLDR:
- The Bitcoin price fell 3.6% for the week after touching $80,400, then recovered above $83,000 following Thursday’s sharp decline.
- NEAR lost just 0.3% in the weekly comparison after a 91.7% monthly advance, then jumped more than 10% to about $5.25 on October 10.
- Monero’s 1.3% weekly decline beat Bitcoin’s loss, though price performance alone cannot show whether trading activity or buying demand drove the difference.
- Bitcoin ETF outflows reached $244 million in one day, while XRP funds saw $8.2 million in inflows even as XRP fell 9% for the week.
The Bitcoin price fell to a weekly low near $80,400 on October 8 as a crypto market selloff accelerated. By October 9, BTC had recovered to $83,247, leaving it 3.6% lower for the week. Most large tokens lost more over that same seven-day period.
NEAR Protocol and Monero were exceptions, down 0.3% and 1.3%, respectively, in the weekly comparison. Yet those figures capture only one point in a volatile stretch. NEAR had climbed 91.7% over the prior month, then rose more than 10% on October 10. The Bitcoin price and altcoin moves show resilience in the data, but not its cause.
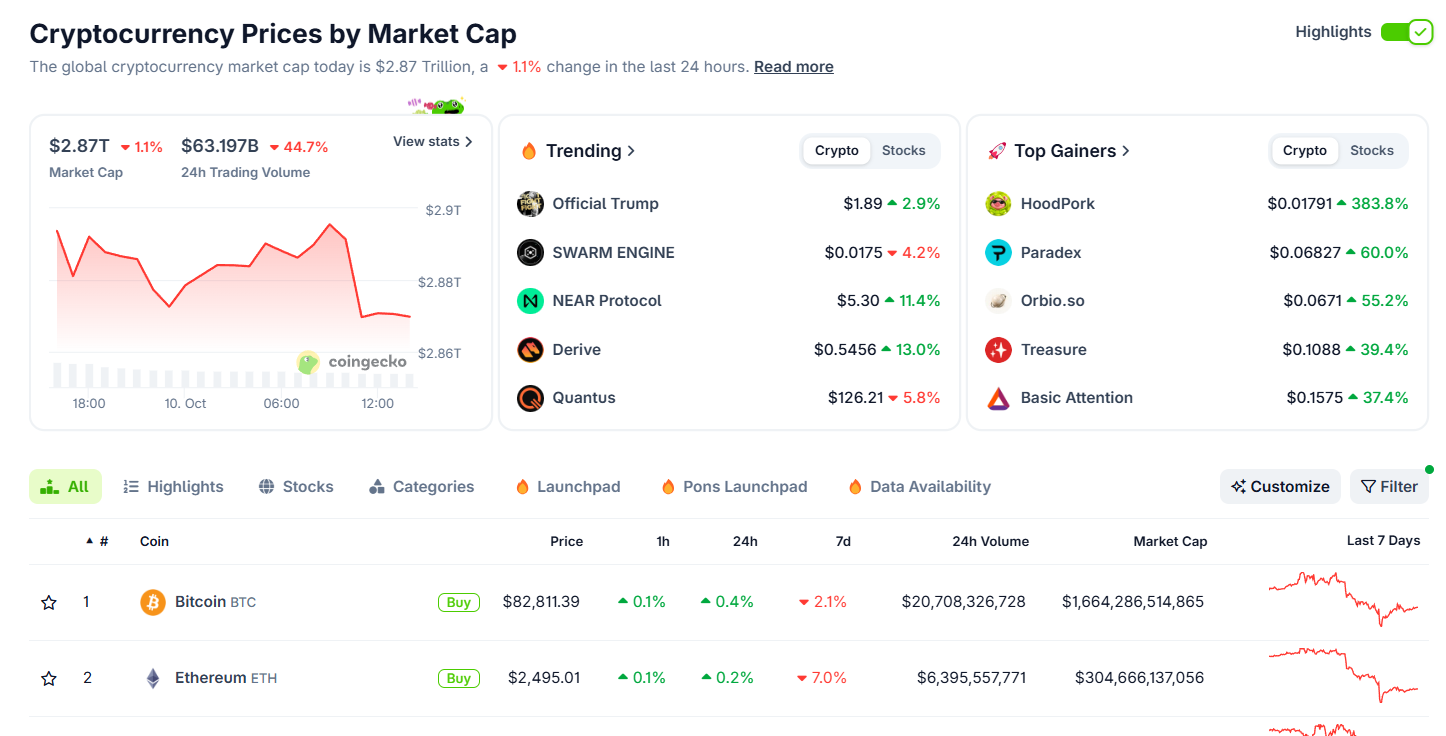
Bitcoin Price Slide Put NEAR and Monero Under Scrutiny
The selloff followed several failed attempts by BTC to reclaim $87,000. After slipping below $84,000 earlier in the week, Bitcoin fell to $80,400 on Thursday. The decline erased nearly $7,000 in a few days before buyers lifted BTC above $83,000. Bitcoin price weakness contrasted with the narrower weekly losses in NEAR and Monero.
NEAR’s small weekly drop deserves context. Its token price had climbed 91.7% in the previous month. That run can change how a weekly selloff appears. Even an intraday pullback may leave a token close to its starting price for the week. NEAR then gained more than 10%, reaching roughly $5.25 on October 10.
BTC price rebound shows how quickly the comparison shifted as prices recovered. Monero’s 1.3% loss also compared favorably with BTC. But a small decline alone cannot show whether buyers were accumulating, holders were inactive, or trading was thin.
ETF Flows and Weekend Recovery Point to Uneven Demand
Gains were not broad among large-cap coins. Thirteen of 16 tracked major tokens fell more than BTC during the measured week. Stellar posted the steepest decline at 13.5%. XRP lost 9%, despite XRP funds recording $8.2 million in inflows. Bitcoin ETFs, meanwhile, had $244 million in daily net outflows. Those flows complicate a simple demand narrative. Positive fund subscriptions did not protect XRP from falling. BTC declined despite its ETFs recording daily net outflows.
Bitcoin’s dominance increased to 59.5% as its market capitalization stood around $1.66 trillion. The total crypto market value rebounded to about $2.8 trillion after losing roughly $200 billion from its high to low. ETH recovered toward $2,500 after falling to $2,400, while XRP moved from $1.34 to around $1.41. The bounce restored some lost value but left several large tokens below recent levels.
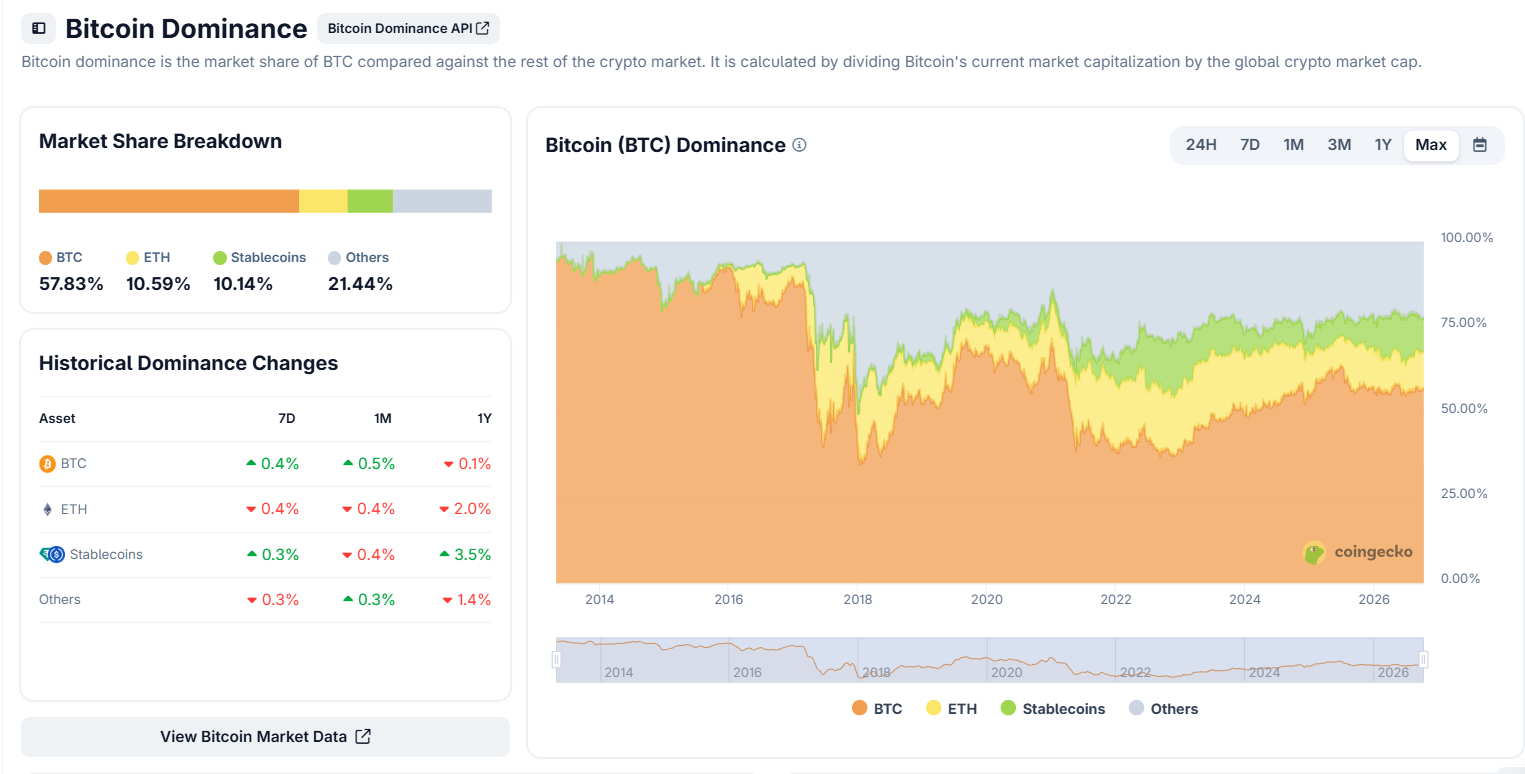
NEAR and ADA led the daily rebound among larger altcoins. Cardano rose about 7%, reclaiming $0.255, while NEAR’s advance outpaced peers. The Bitcoin price remained near $83,000 on October 10, below Monday’s $87,000 test and above Thursday’s low. This places the weekly outperformance beside a quick bounce, without confirming a lasting change in market leadership.
That matters for the Bitcoin price beside smaller tokens. Daily changes can look calm if trading is light, but weekly returns alone do not reveal activity. The same result can emerge from steady demand, limited selling, or a sharp drop followed by a rebound.
The post Bitcoin Price Holds Near $83K as NEAR and Monero Defy Selloff appeared first on Blockonomi.
TLDR:
- Strive Bitcoin funding through SATA generated an estimated $55 million during the week of Oct. 5, enough to purchase roughly 638 BTC at recent prices.
- SATA traded above its $100 par value on Oct. 5 and for much of Oct. 6, then stayed below par through Oct. 9, slowing estimated issuance.
- Strive held 29,462 BTC on Oct. 2 after buying 2,000 BTC at an average price near $84,422 between Sept. 28 and Oct. 2, while quarter-to-date BTC Yield reached 18.5%.
- Strategy sold zero STRC shares from Sept. 28 to Oct. 4, yet bought 334 BTC using MSTR common stock, lifting its holdings to 848,000 BTC.
Strive Bitcoin funding is accelerating through its SATA preferred stock program. The company generated an estimated $55 million during the week beginning October 5. That amount could purchase about 638 BTC at current prices. SATA traded $317 million in total volume during the period. However, issuance depends on shares trading at or above the $100 par value.
The preferred stock spent three sessions below that level. Most estimated proceeds came during Monday and Tuesday. Bitcoin traded near $82,800 on Friday, valuing 638 BTC at roughly $53 million. The result closely links Strive’s Bitcoin treasury strategy to Strategy’s capital markets playbook.
Strive Bitcoin Funding Depends on SATA Trading Above Par
That distinction matters because volume is not the same as corporate funding. Traders can exchange SATA below par without creating new proceeds. Strive therefore needs active demand and a supportive price. The next filing will actually determine how much cash reached its Bitcoin treasury.
Market trackers estimate that Strive sold about $55 million through its at-the-market program. The estimate uses eligible SATA volume and a capture ratio. That ratio reflects how much trading typically converts into newly issued shares. Past Securities and Exchange Commission filings help calibrate the calculation.
An ATM program lets a company issue shares gradually into public trading. It avoids the timing pressure of a large financing. Yet SATA cannot issue efficiently when its market price falls below par. Selling beneath $100 would weaken the program’s economics and dilute its yield proposition.
SATA traded above $100 on October 5 and for much of October 6. It then remained below par through October 9. Daily volume still reached some of its highest levels. The gap shows that trading activity alone does not guarantee Bitcoin purchases.
For Strive Bitcoin buyers, the distinction between volume and issuance is material. A busy tape can suggest strong demand, yet the company may receive little cash. Only eligible trading produces room for new shares. The estimate therefore remains provisional until the company files its next report.
The mechanism creates a brake. Investors must support SATA at par or higher before Strive can expand supply. When that support disappears, issuance pauses. Bitcoin buying then relies on cash already available or another financing route.
Strive Bitcoin Holdings Grow While Strategy Uses Common Stock
Strive reported 29,462 BTC on October 2. The balance followed a purchase of 2,000 BTC between September 28 and October 2. The average purchase price was about $84,422 per coin.
The company also reported adding 8,137 BTC during the third quarter. Those purchases carried an average cost of $78,885. Strive’s BTC Yield reached 18.5% quarter-to-date and 63.2% year-to-date on September 30. The metric measures Bitcoin growth per share.
The balance sheet has no debt principal. However, SATA carries about $168 million in annualized dividend obligations. Each new preferred share adds to that future payment burden. The model depends on continued investor demand for the income-oriented security.
Strategy provides the larger comparison. Its October 5 filing showed no STRC shares sold between September 28 and October 4. Strategy still bought 334 BTC from October 1 through October 4. It funded that purchase with MSTR common stock, taking its holdings to 848,000 BTC.
Both companies illustrate the same Bitcoin treasury model. Preferred or common equity raises capital for Bitcoin accumulation. The financing channel changes when market prices move. Strive’s SATA program currently shows that constraint more sharply because issuance stops below par.
The next weekly 8-K filings should provide the exact number of Bitcoin bought with SATA proceeds. They will also show whether Strive resumed issuance after the preferred stock recovered above $100.
The post Strive Bitcoin Has Enough for 638 BTC Through SATA Stock Sales appeared first on Blockonomi.
TLDR:
- Ethereum price prediction is bearish below the 50-day SMA, with $2,370 support and the 100-day average near $2,200 shaping the next levels to watch.
- U.S. spot Ethereum ETFs shed about $542 million in the week ended October 9, their largest weekly outflow since late January.
- BlackRock’s ETHA accounted for roughly $477 million in weekly withdrawals, while total U.S. Bitcoin ETF outflows reached $681 million.
- Whales reportedly added more than 166,000 ETH in 72 hours even as exchange balances rose 90,000 ETH and futures open interest declined.
Ethereum price prediction has weakened recently. Ether fell below its 50-day simple moving average. U.S. spot Ethereum ETFs logged their largest weekly outflow since January. ETH traded near $2,491 on October 10. It was down more than 7% in seven days, while trading volume fell 61% to $7.2 billion.
Yet whale data offered a counterpoint: holders added about 166,000 ETH over 72 hours, alongside Bitcoin and XRP purchases. The conflicting signals leave traders watching $2,370 support for now. A break could expose the $2,200 area, while a defense may steady the market. ETF redemptions and rising exchange balances remain risks.
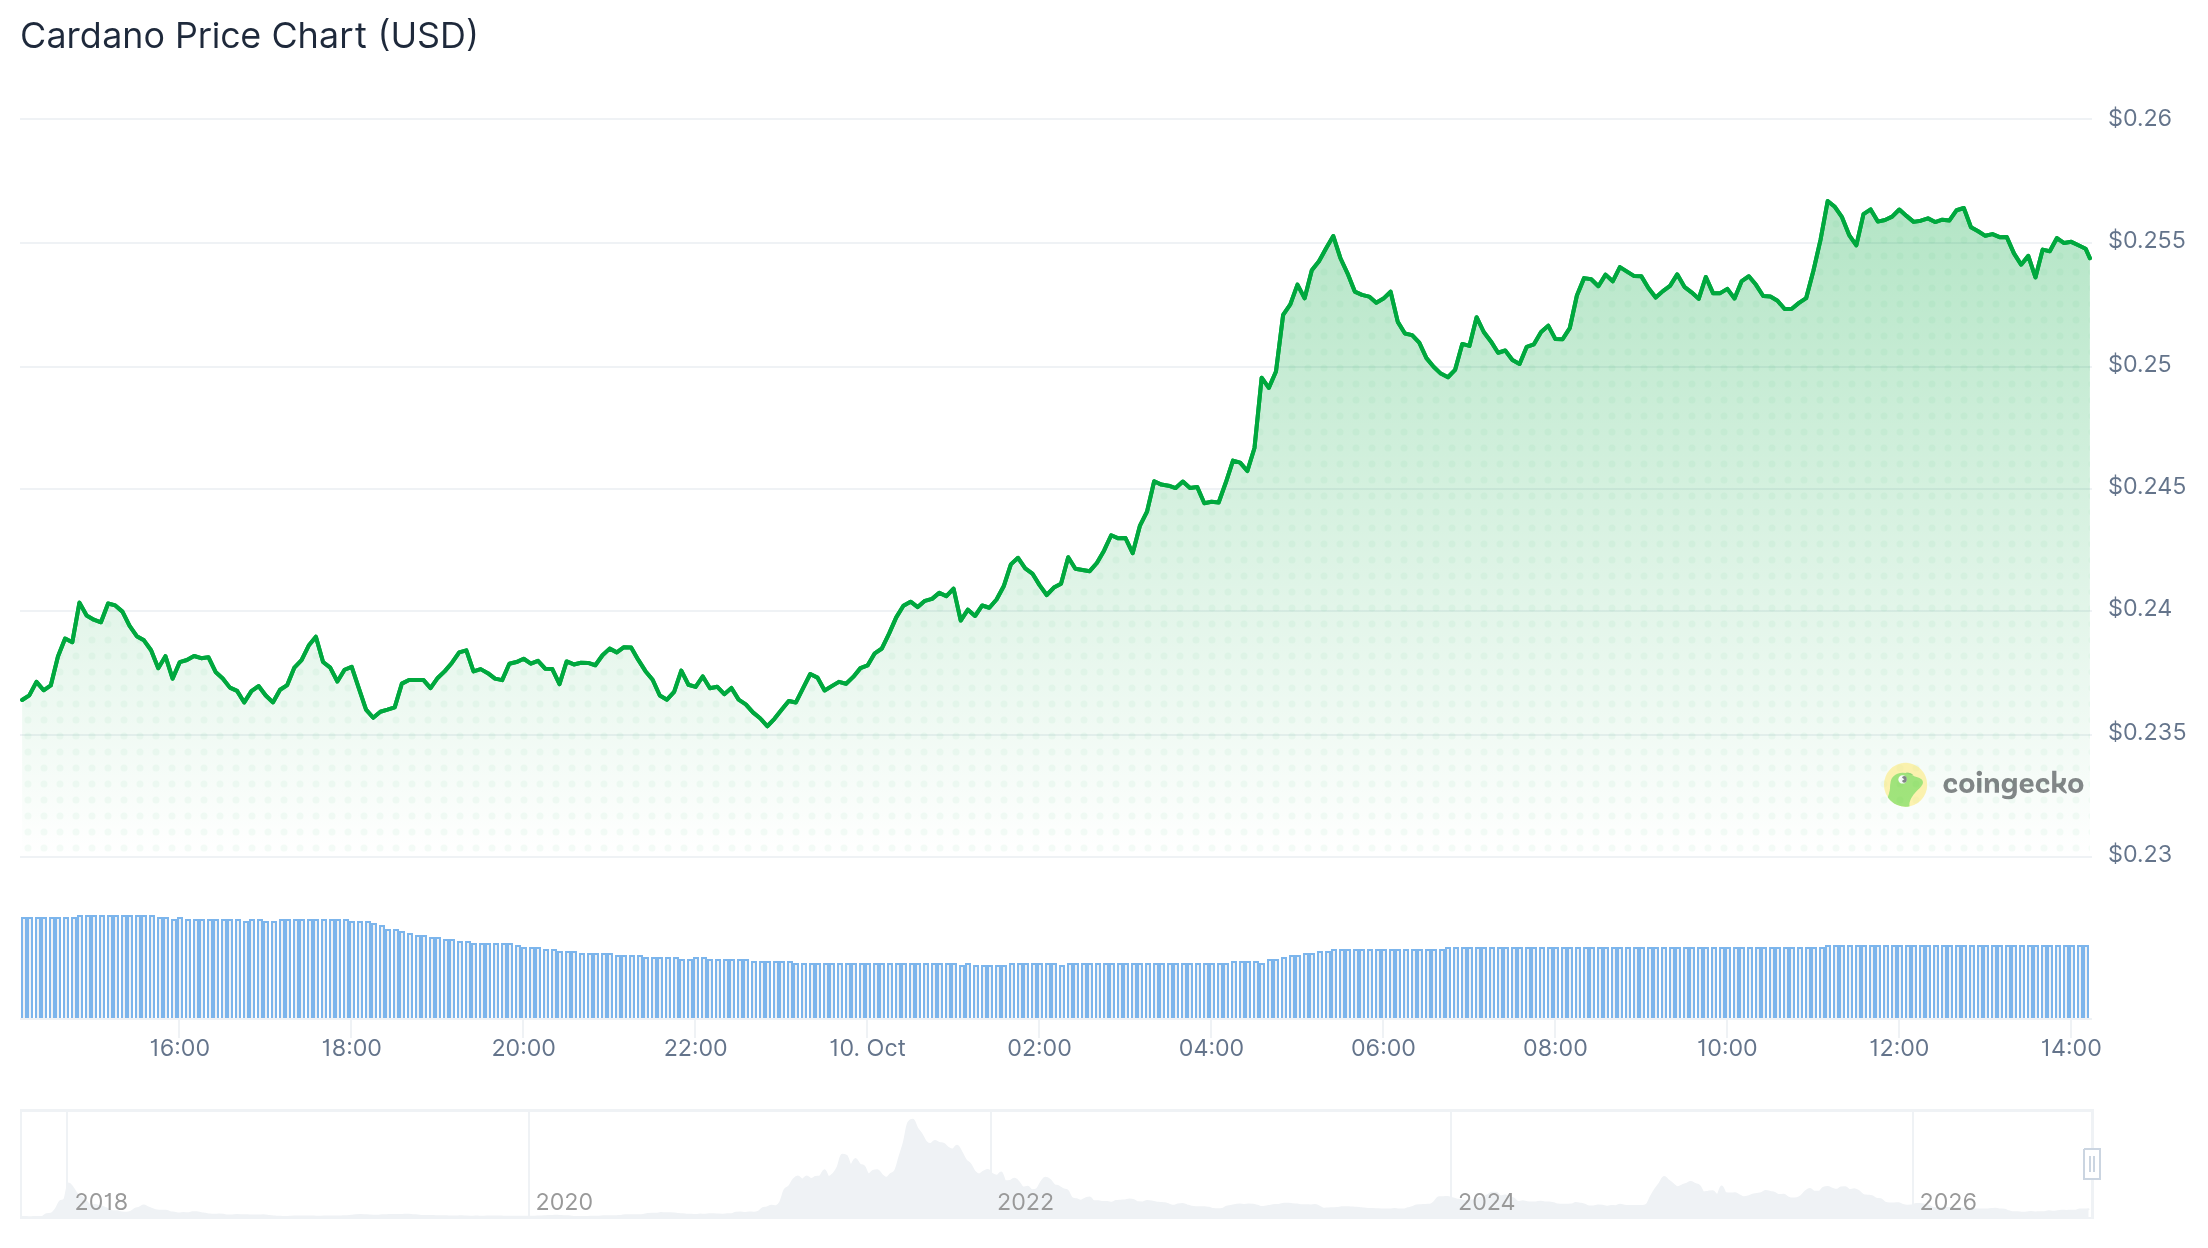
Ethereum Price Prediction Weighs ETF Outflows Against Whale Buying
U.S. spot Ethereum ETFs saw approximately $542 million in net withdrawals for the week ended October 9, SoSoValue data showed. It was their largest outflow since late January. BlackRock’s iShares Ethereum Trust, known as ETHA, accounted for about $477 million. It was the fund’s largest weekly withdrawal since December 2025. Bitcoin ETFs saw pressure, with $681 million leaving during the period.
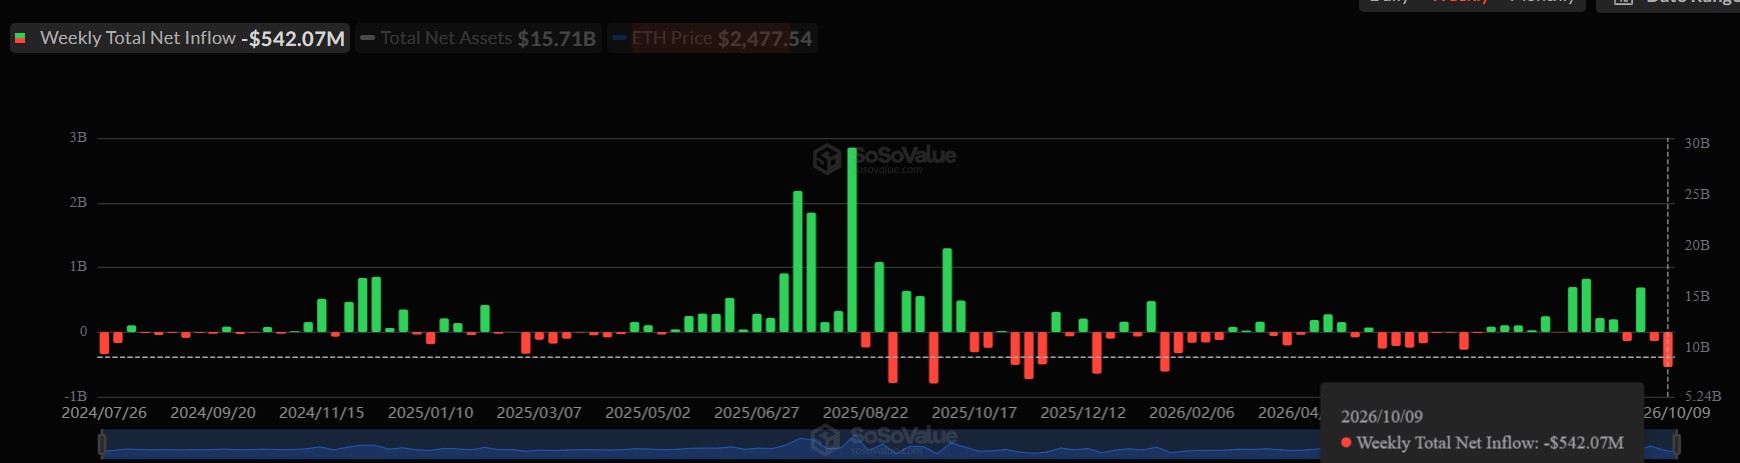
These Ethereum ETF outflows point to reduced exposure. They do not show every investor is selling ETH. However, they weaken a key source of demand during a price decline. An outflow streak could cap attempts to recover above resistance. Whale accumulation complicates that bearish picture. Analyst Ali Martinez says large wallets added roughly 15,000 BTC and more than 166,000 ETH. They also added about 45 million XRP in 72 hours.
Whale balances can rise while smaller holders or funds distribute coins. For the Ethereum price prediction, this divergence matters. Wallet demand may absorb some supply without quickly reversing ETF outflows or retail selling. Traders need follow-through in spot buying to treat the signal as durable.
ETF flows and wallet data track different activity. ETF figures capture listed-product flows; whale estimates track large on-chain balances. Those signals can diverge if ETF investors withdraw while other holders accumulate.
The Ethereum price prediction depends on whether whale buying continues beyond the 72-hour window. Continued purchases could absorb some supply, but a pause would leave ETF redemptions as the clearer demand signal.
Exchange Inflows and Futures Deleveraging Add Pressure on ETH
Exchange data adds caution. CoinGlass figures show Ethereum balances on trading platforms rising from 11.71 million ETH on October 8. They reached 11.8 million the next day. That 90,000-ETH increase marked the highest balance since September 23. Coins transferred to exchanges may be prepared for sale, but transfers alone do not prove liquidation. At the same time, open interest fell from 13.29 million to 12.77 million ETH.
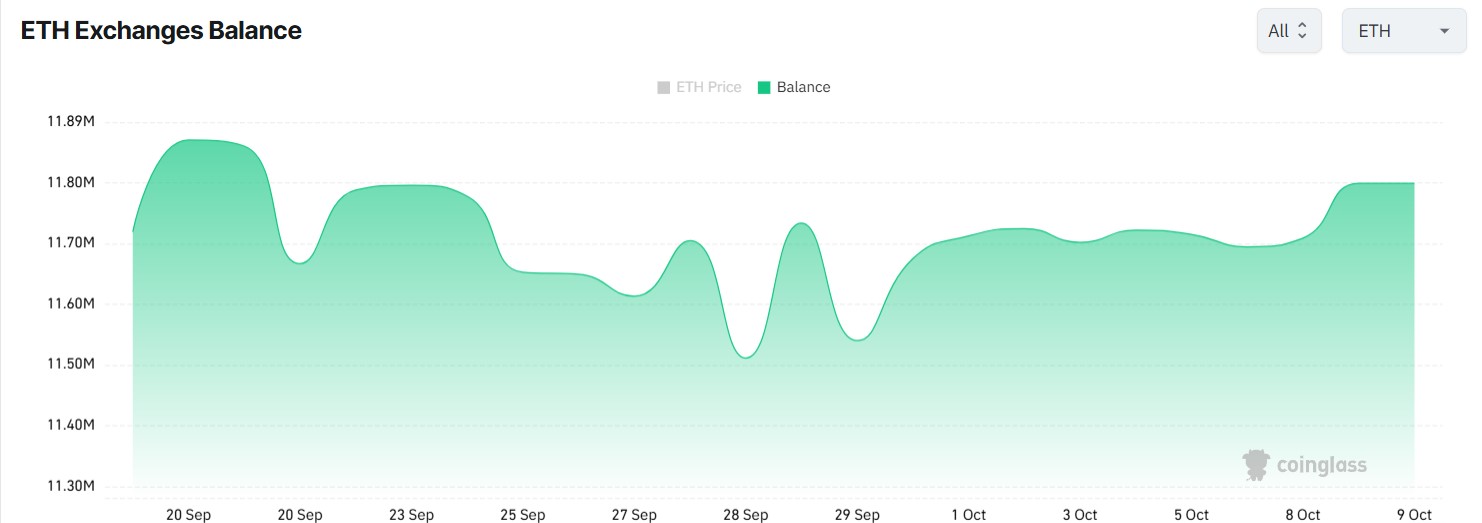
Lower futures open interest points to reduced outstanding positions and possible deleveraging. It can ease liquidation risk, but it also signals weaker appetite for leveraged longs. Combined, rising exchange balances and lower OI suggest traders are reducing exposure as spot supply increases. For the Ethereum price prediction, exchange balances now add another warning.
On the daily chart, ETH’s relative strength index slipped to 39, its lowest reading since June. Price also moved below the 50-day SMA. The $2,500 level has also turned into overhead resistance after ETH fell beneath it. The ETH price forecast hinges first on $2,370. A daily close below that support would strengthen the bearish case.
It would put the 100-day SMA near $2,200 in view. This Ethereum price prediction would need confirmation from continued selling or weak demand. If buyers defend $2,370, ETH could consolidate instead. A recovery above the 50-day average would give bulls a stronger signal. ETH had not reclaimed it by publication.
The post Ethereum ETFs Post Biggest Weekly Outflows Since January as Price Breaks Below $2,500 appeared first on Blockonomi.
TLDR:
- Cardano price rose nearly 7% on Oct. 10 and reached about $0.256 after a short-window rebound.
- ADA reclaimed the $0.2353 moving average and $0.2359 Fibonacci level, while reported volume fell 34.86%, leaving the breakout short of strong confirmation.
- Daily active addresses reached 27,500 and 27,200 on Oct. 7–8 after CIP-0113 launched, but ADA fell roughly 13% over that same period.
- Analyst Andreou’s $0.90 scenario remains conditional: ADA must hold the 0.22–0.25 base, reclaim 0.30–0.35, then clear higher resistance zones.
Cardano’s ADA token climbed 7% on Oct. 10, trading near $0.256 as buyers returned to the market. The Cardano price gain outpaced major cryptocurrencies during the session. The rebound followed an October decline, making this a recovery attempt rather than a confirmed trend reversal.
Cardano price analysis reveal ADA reclaimed its 30-day average near $0.2353 and the 50% Fibonacci level around $0.2359. But reported trading volume fell 34.86%, leaving buyers to prove they can defend the breakout. Network activity had increased earlier in the week.
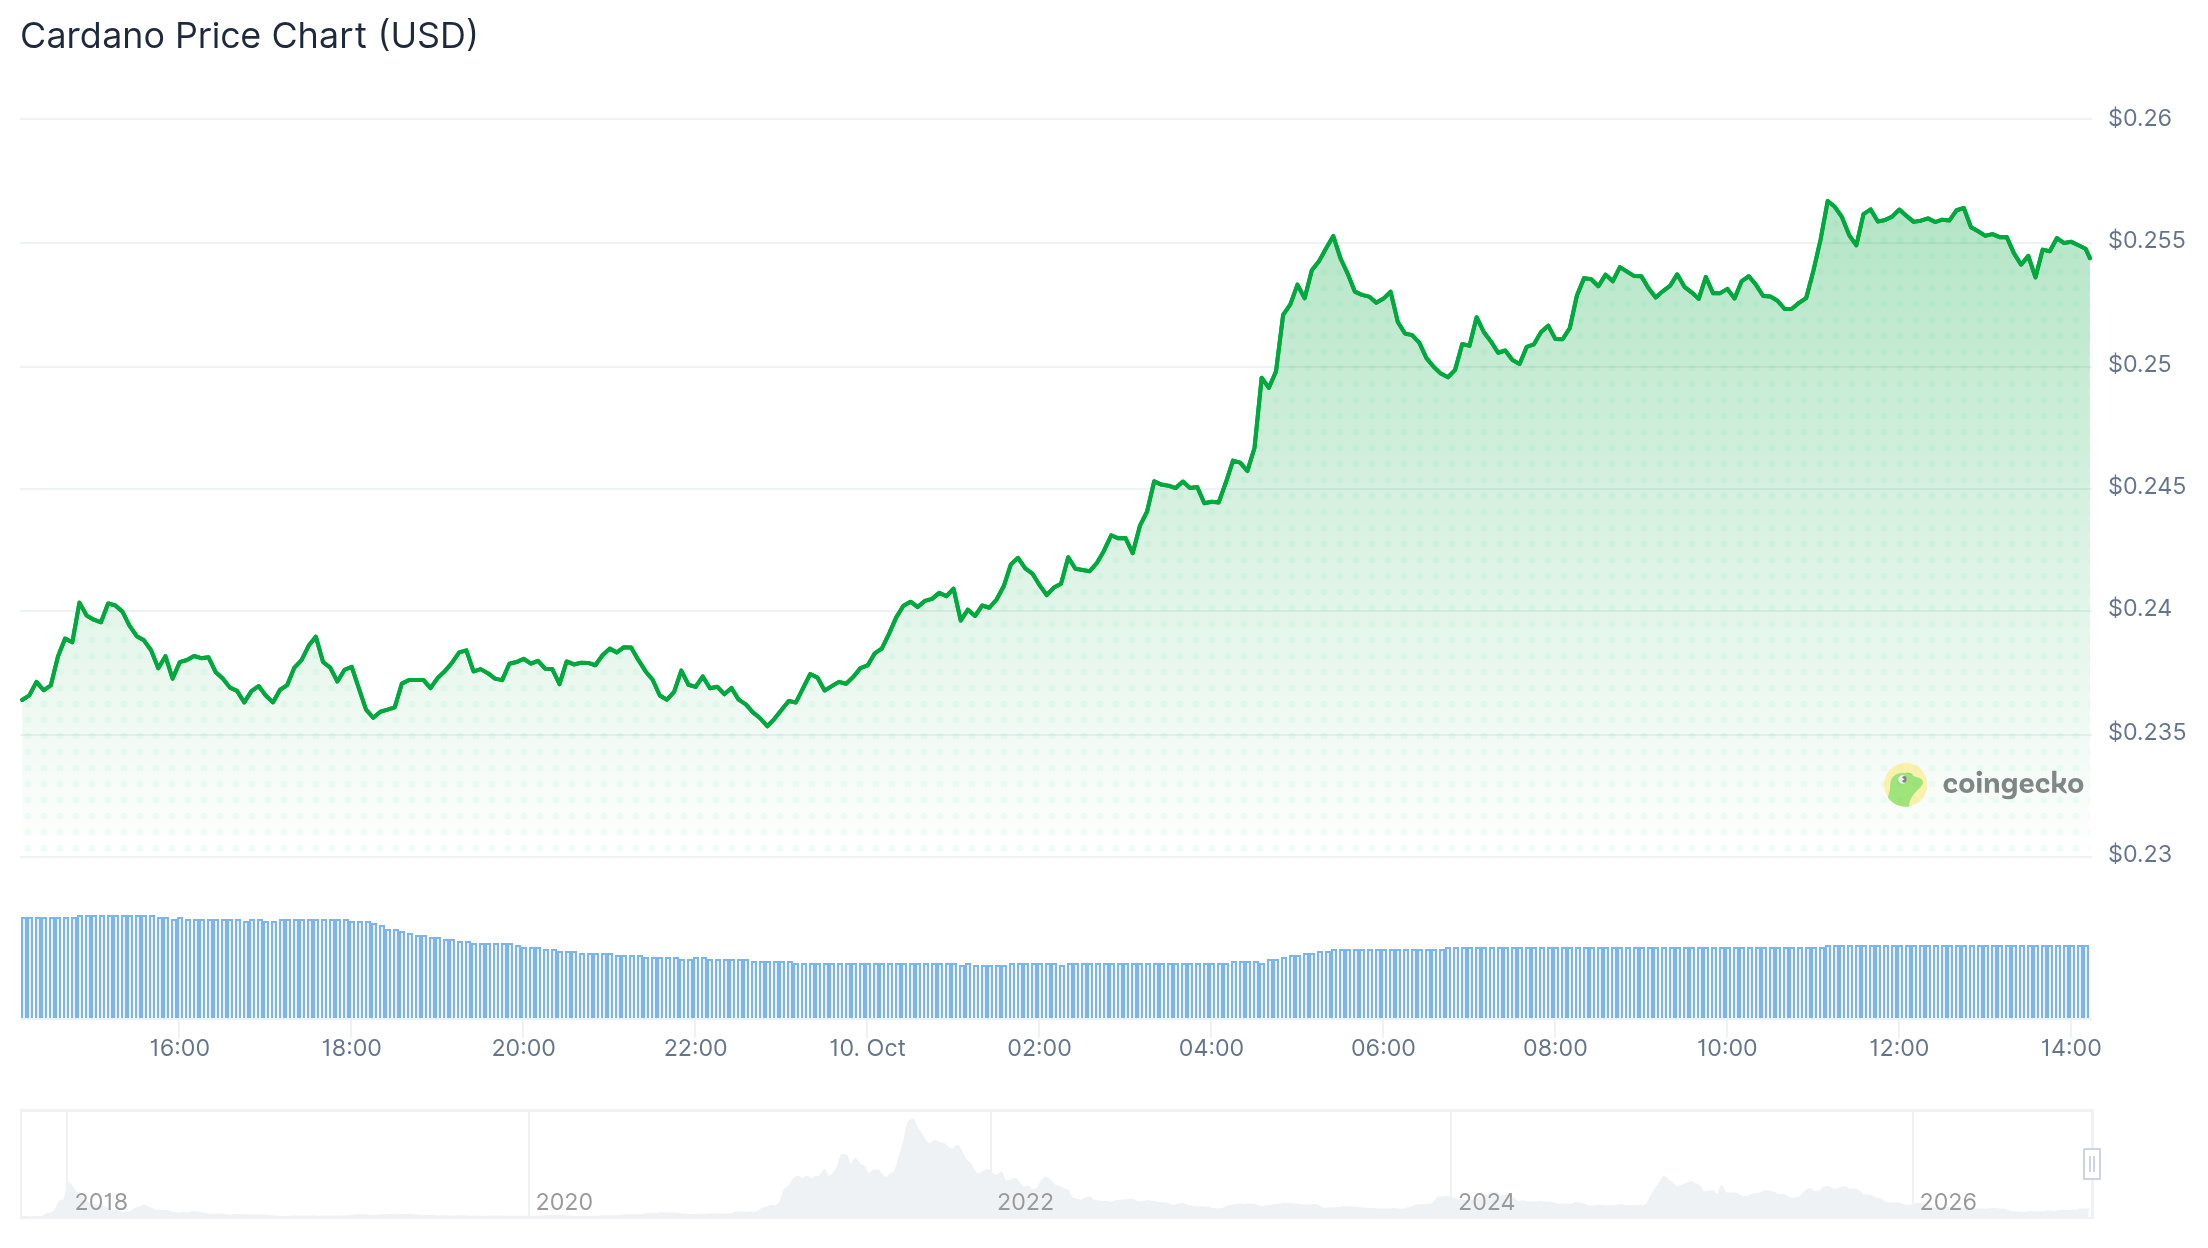
Cardano Price Rebound Tests Support as Volume Remains Thin
The reclaimed average and retracement level now form a short-term checkpoint. A drop below them would weaken the breakout case. The support band extends from $0.2359 to $0.2276.
Holding that area could leave room for a test of weekly Supertrend resistance near $0.2762. The Cardano price would need a daily close above $0.256 to show that buyers can sustain the bounce. A rejection at that level would raise the risk of a false breakout.
Volume remains a key concern. The 34.86% decline suggests the rally drew less participation than its price move implied. The figure varies by exchange and measurement window, but the direction argues for caution. The Altcoin Season Index rose 5.17% to 61, pointing to stronger relative demand for alternative tokens. That measure describes rotation; it does not prove capital will stay in ADA.
Bitcoin traded near $82,800, a level that matters for altcoins. Spot Bitcoin ETFs shed $729 million over two days, adding pressure to risk assets. Renewed selling could again put ADA support levels under strain.
The immediate test is twofold: defend reclaimed levels and attract stronger spot volume. Until both happen, the Cardano price recovery remains technically constructive but unconfirmed.
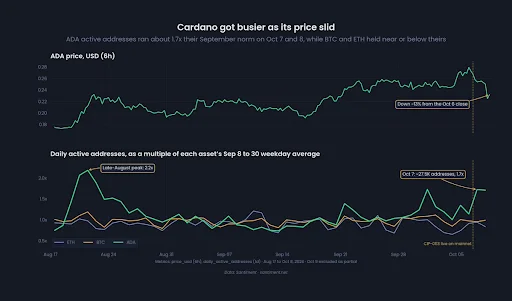
ADA Active Addresses Rose After CIP-0113, Then Price Fell
Santiment reported about 27,500 daily active Cardano addresses on Oct. 7 and 27,200 on Oct. 8, around 1.7 times September’s weekday average. The increase coincided with CIP-0113 going live on mainnet on Oct. 7. The standard enables programmable tokens with issuer-defined rules. The Cardano Foundation says issuers can add KYC checks, sanctions screening, and transfer restrictions to native tokens. Wallets and explorers can handle these assets like other Cardano tokens. The standard required no protocol hard fork.
Coincidence does not establish that the upgrade caused the address spike. Santiment’s figures also showed Bitcoin and Ethereum addresses at or below September averages. Active addresses measure participation, not intent.
They cannot show whether users bought ADA, moved tokens, staked, or used applications. The Cardano price fell about 13% from the Oct. 6 close through Oct. 8, despite the increase. That divergence shows network use did not translate into immediate buying pressure.
The Cardano price bounce came on October 10, after both the activity increase and the selloff. It should not be attributed to CIP-0113 without evidence linking buyers to the upgrade. A lasting signal would require elevated addresses to persist beyond launch.

Analyst Giannis Andreou says initial support is present at 0.22–0.25 and first resistance at 0.30–0.35. A weekly reclaim and successful retest would strengthen that recovery case. Higher zones sit at 0.40–0.45 and 0.55–0.65. The $0.90 scenario depends on clearing each barrier, so it remains conditional. A sustained break below $0.22 would weaken the setup.
The post Cardano Price Rises 7% as ADA Tests Key Resistance Near $0.28 appeared first on Blockonomi.
TLDR
- Eli Lilly stock gains 0.62% as new Phase 3b findings highlight treatment gains.
- Combined therapy changes 482 proteins versus 140 with Taltz alone by Week 36.
- Gene activity shifts span 467 genes with both drugs, versus 16 on Taltz alone.
- Taltz and Zepbound deliver improved skin clearance and weight loss at Week 36.
- Researchers report consistent safety findings, but no new approved indication.
Eli Lilly and Company stock rose 0.62% to $1,176.80 on Friday, gaining $7.20 during the trading session. The company announced new Phase 3b findings showing broader biological responses from combined Taltz and Zepbound treatment. The results expand earlier evidence of improved psoriasis symptoms and weight reduction among adults living with psoriasis and obesity.
Eli Lilly and Company, LLY
Eli Lilly Reports Stronger Phase 3b Results for Taltz and Zepbound
Eli Lilly released new exploratory findings from its TOGETHER-PsO Phase 3b clinical trial examining two existing prescription medicines. Researchers compared the combined use of Taltz and Zepbound against Taltz alone in adults with moderate-to-severe plaque psoriasis. The study also included participants with obesity or overweight alongside at least one additional weight-related medical condition.
The latest analysis identified broader changes in proteins and genes among participants receiving both medicines compared with Taltz alone. By Week 36, researchers identified changes involving 482 proteins in the combination group, compared with 140 in the other group. Similarly, gene expression changes affected 467 genes with combined treatment, against only 16 genes with Taltz alone.
These biological differences appeared as early as Week 12, according to the pharmaceutical company’s newly released findings. Researchers also identified stronger reductions in inflammatory immune activity among participants receiving both treatments over the study period. Eli Lilly presented the findings at the 2026 Fall Clinical Dermatology Conference in Las Vegas.
Combined Treatment Improves Skin Clearance and Weight Reduction
The latest findings build on earlier clinical results showing better treatment outcomes among participants receiving Taltz alongside Zepbound. At Week 36, the combination delivered superior skin clearance and meaningful weight reduction compared with Taltz alone. Furthermore, participants maintained or improved these clinical benefits through Week 52, according to Eli Lilly’s previously reported findings.
The analysis also examined neutrophils, which play an important role in the body’s inflammatory immune response. Researchers found that combined treatment produced greater changes in inflammatory pathways associated with these immune cells. Changes in certain neutrophil-related markers partly explained the additional improvement in psoriasis severity scores among combination-treatment participants.
The TOGETHER-PsO trial included 274 adults across multiple clinical research centers, with participants divided equally between two treatment groups. One group received Taltz alone, while the other received Taltz and Zepbound through injections under the skin. Both groups also received guidance on reducing calorie intake and increasing physical activity throughout the clinical study.
Eli Lilly Expands Research Into Psoriasis and Obesity
Eli Lilly designed the study to examine the relationship between metabolic health and inflammatory skin conditions. Approximately 61% of Americans with psoriasis also experience obesity or overweight alongside another weight-related medical condition, according to Lilly. The findings provide additional research into how treatments targeting different biological processes may influence both conditions.
Taltz works by blocking interleukin-17A, an immune signaling protein involved in inflammation and several related inflammatory conditions. Zepbound targets GIP and GLP-1 receptors, helping regulate appetite and support weight management in eligible adults. The two medicines therefore act through different biological pathways, providing the basis for investigating their combined clinical effects.
Eli Lilly reported that the combination’s safety findings matched the established safety profiles of the individual medicines. The exploratory results do not establish a new approved indication for using the medicines together. The company continues examining the relationship between immune and metabolic processes as researchers assess broader approaches to psoriasis management.
The post Eli Lilly and Company (LLY) Stock: Rises as Taltz and Zepbound Show Promising Results appeared first on Blockonomi.
CryptoPotato
XRP is attempting to stabilize after a sharp correction from its September highs, with the price currently trading around $1.40. While buyers have managed to trigger a rebound from the $1.30 support area, the broader technical picture remains mixed. XRP needs to claim nearby resistance to continue the recovery, while another rejection could expose lower support levels.
Ripple Price Analysis: The USDT Pair
XRP’s daily chart shows a significant recovery from the August lows below $1, followed by a sharp rally that carried the asset toward the $1.60 region. However, the market has rejected this level twice, suggesting bullish momentum has weakened considerably.
The price is currently hovering around $1.40, with the $1.30 zone serving as the key nearby support area. This region has already attracted buying interest, as demonstrated by the recent rebound. Holding this zone could allow the asset to consolidate and attempt another move higher. A decisive breakdown, however, would weaken the recovery structure and bring the $1 support zone back into focus.
The 100-day and 200-day moving averages are also converging for a potential bullish crossover near the $1.30 zone, adding to this level’s importance for XRP’s short- to mid-term trend. Yet, with the RSI dropping below the neutral 50 level, bullish momentum is clearly weak, putting the market at significant risk of losing the key support zone.
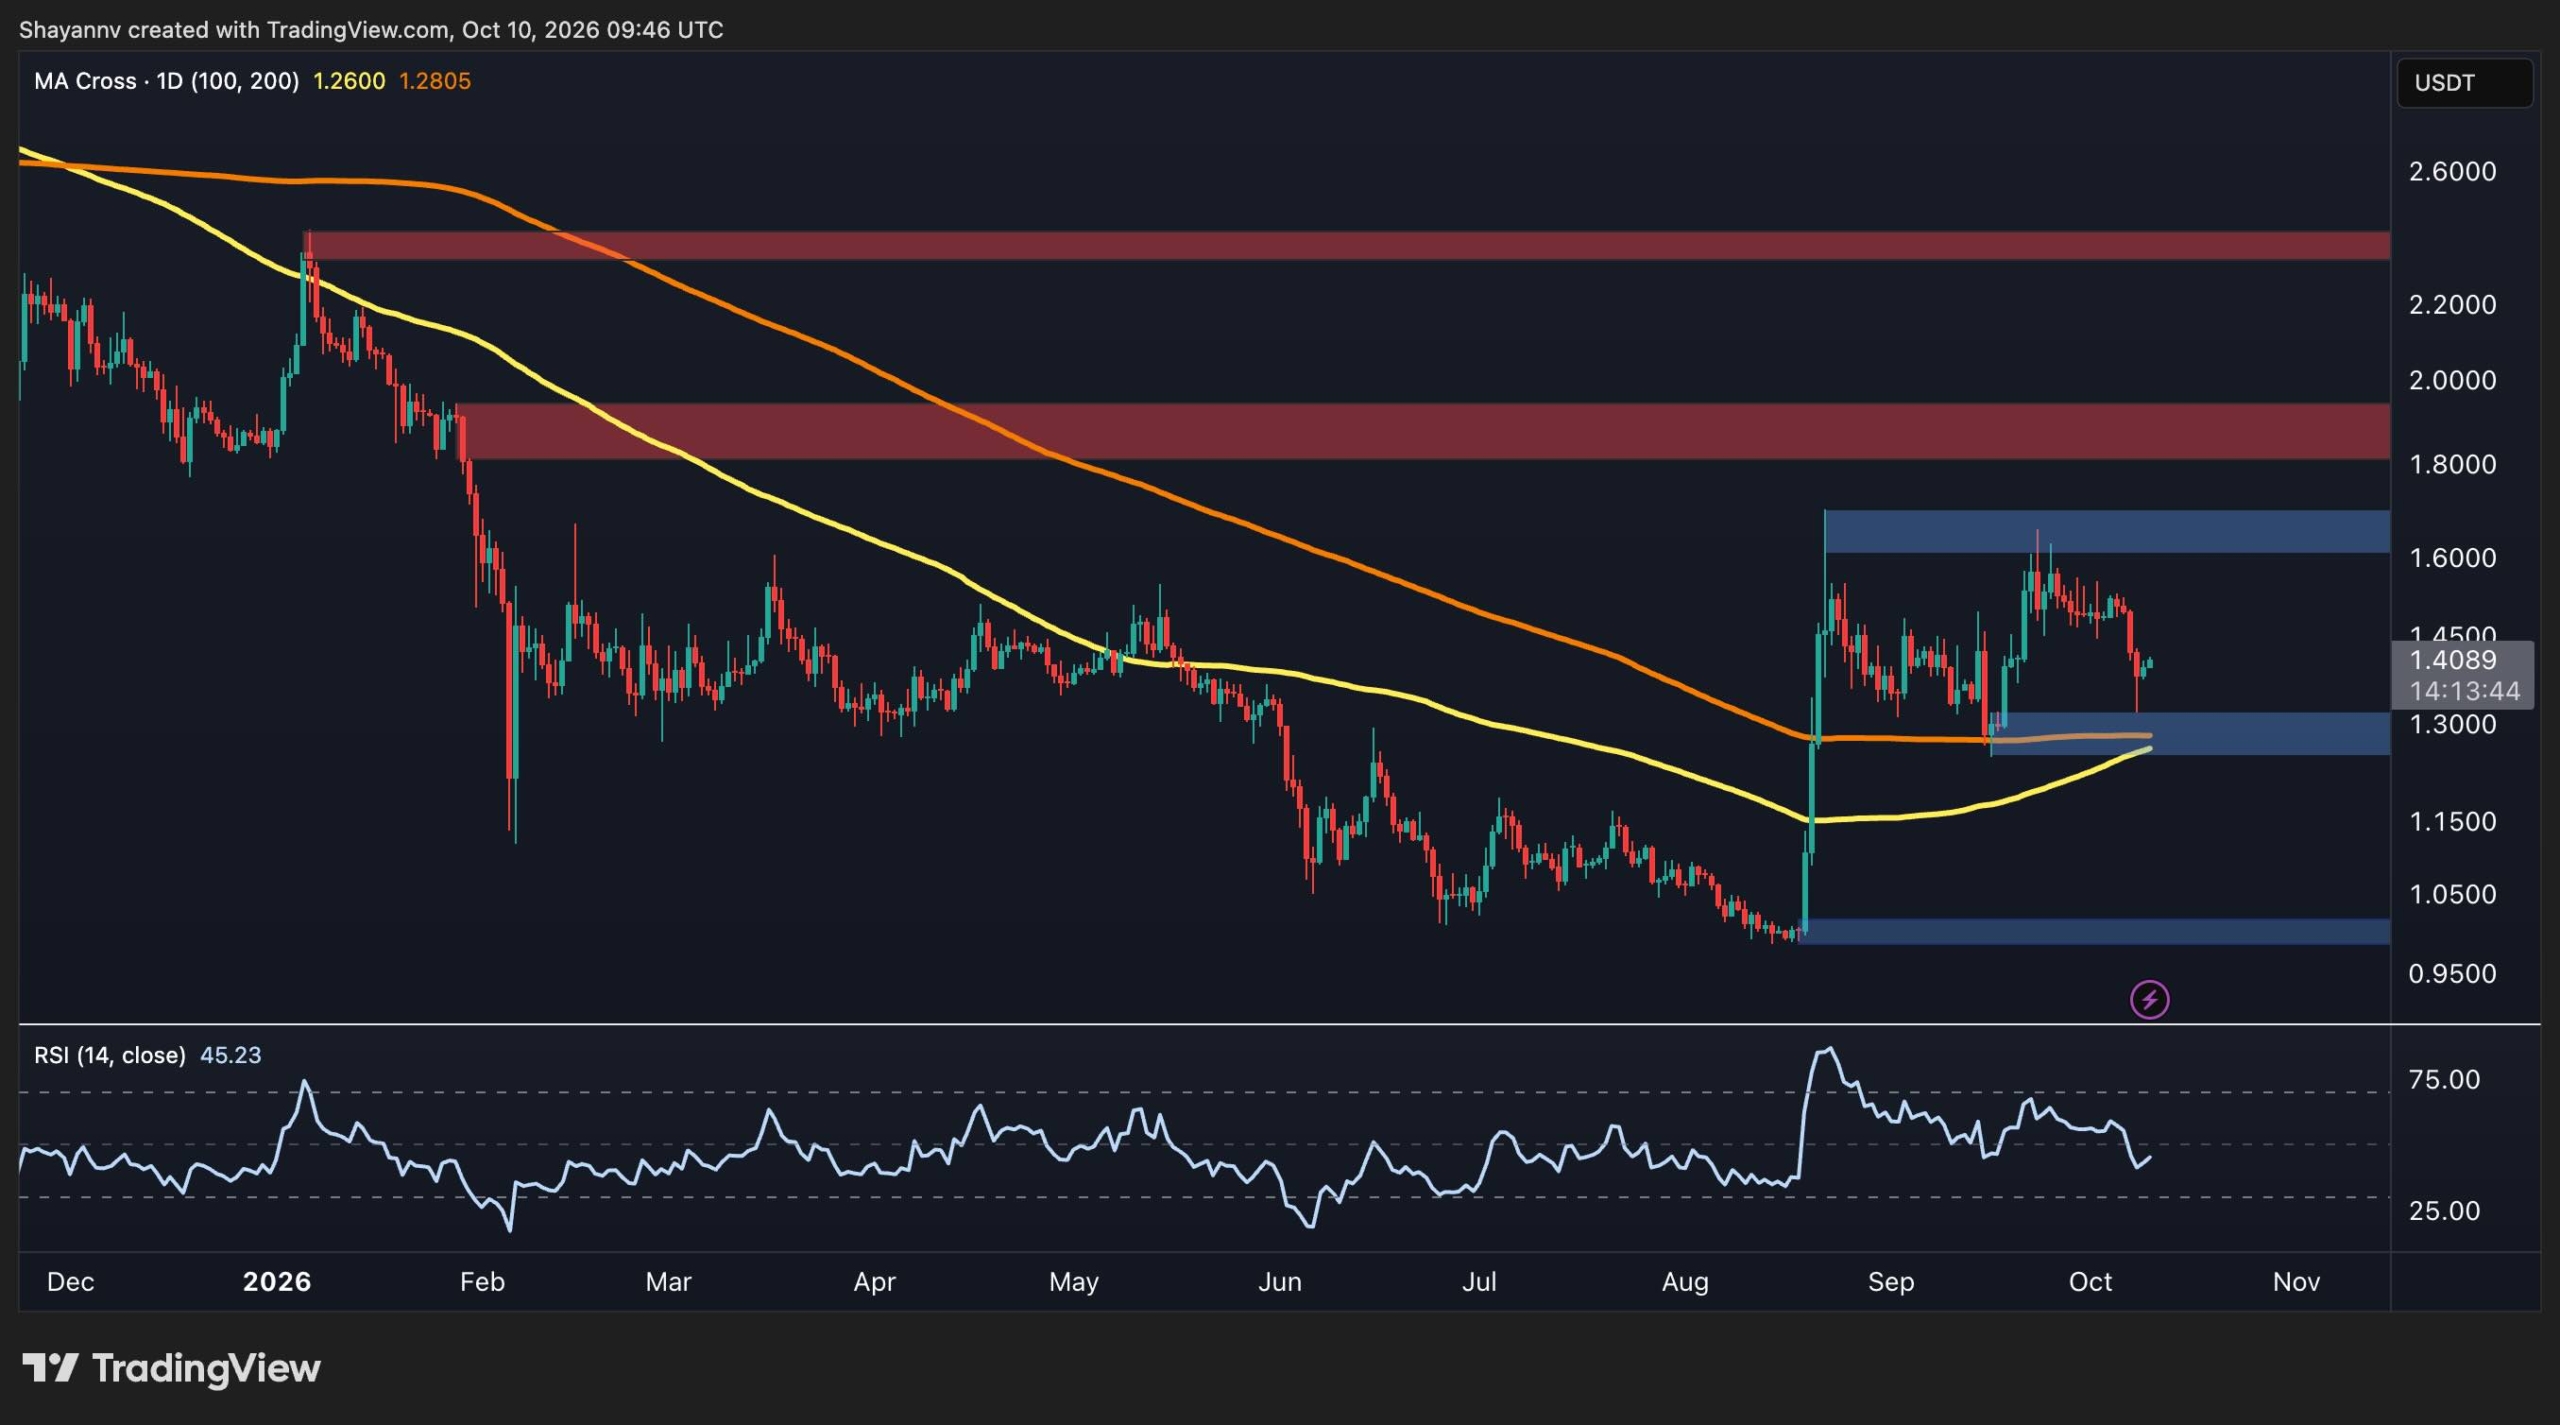
The 4-Hour Chart
The 4-hour chart highlights the recent correction more clearly. XRP has been trading beneath a descending resistance trendline drawn from the September highs, with successive lower highs reflecting persistent selling pressure. The latest decline pushed the price toward the $1.30 support zone before buyers stepped in and initiated a modest rebound toward $1.40.
Despite this recovery, XRP remains below the $1.45 resistance area. This zone is particularly important because it aligns with the descending trendline, making it a key level for determining whether the latest rebound can develop into a broader recovery. A convincing breakout above $1.45 could invalidate the immediate bearish structure and allow the price to target the $1.60 region once more.
Conversely, a rejection near $1.45 could send XRP back toward the $1.15 imbalance which was formed during the almost vertical rally mid-August. With the 4-hour RSI climbing back above the oversold region to approximately 40, selling pressure has moderated, although the indicator remains below 50 and does not yet confirm a bullish momentum shift.
Overall, XRP is at a pivotal point. The defense of $1.30 offers the bulls an opportunity to extend the rebound, but the descending 4-hour trendline and resistance near $1.45 remain significant obstacles. A breakout above this barrier would strengthen the recovery case, while a renewed loss of $1.30 would increase the risk of a deeper correction.
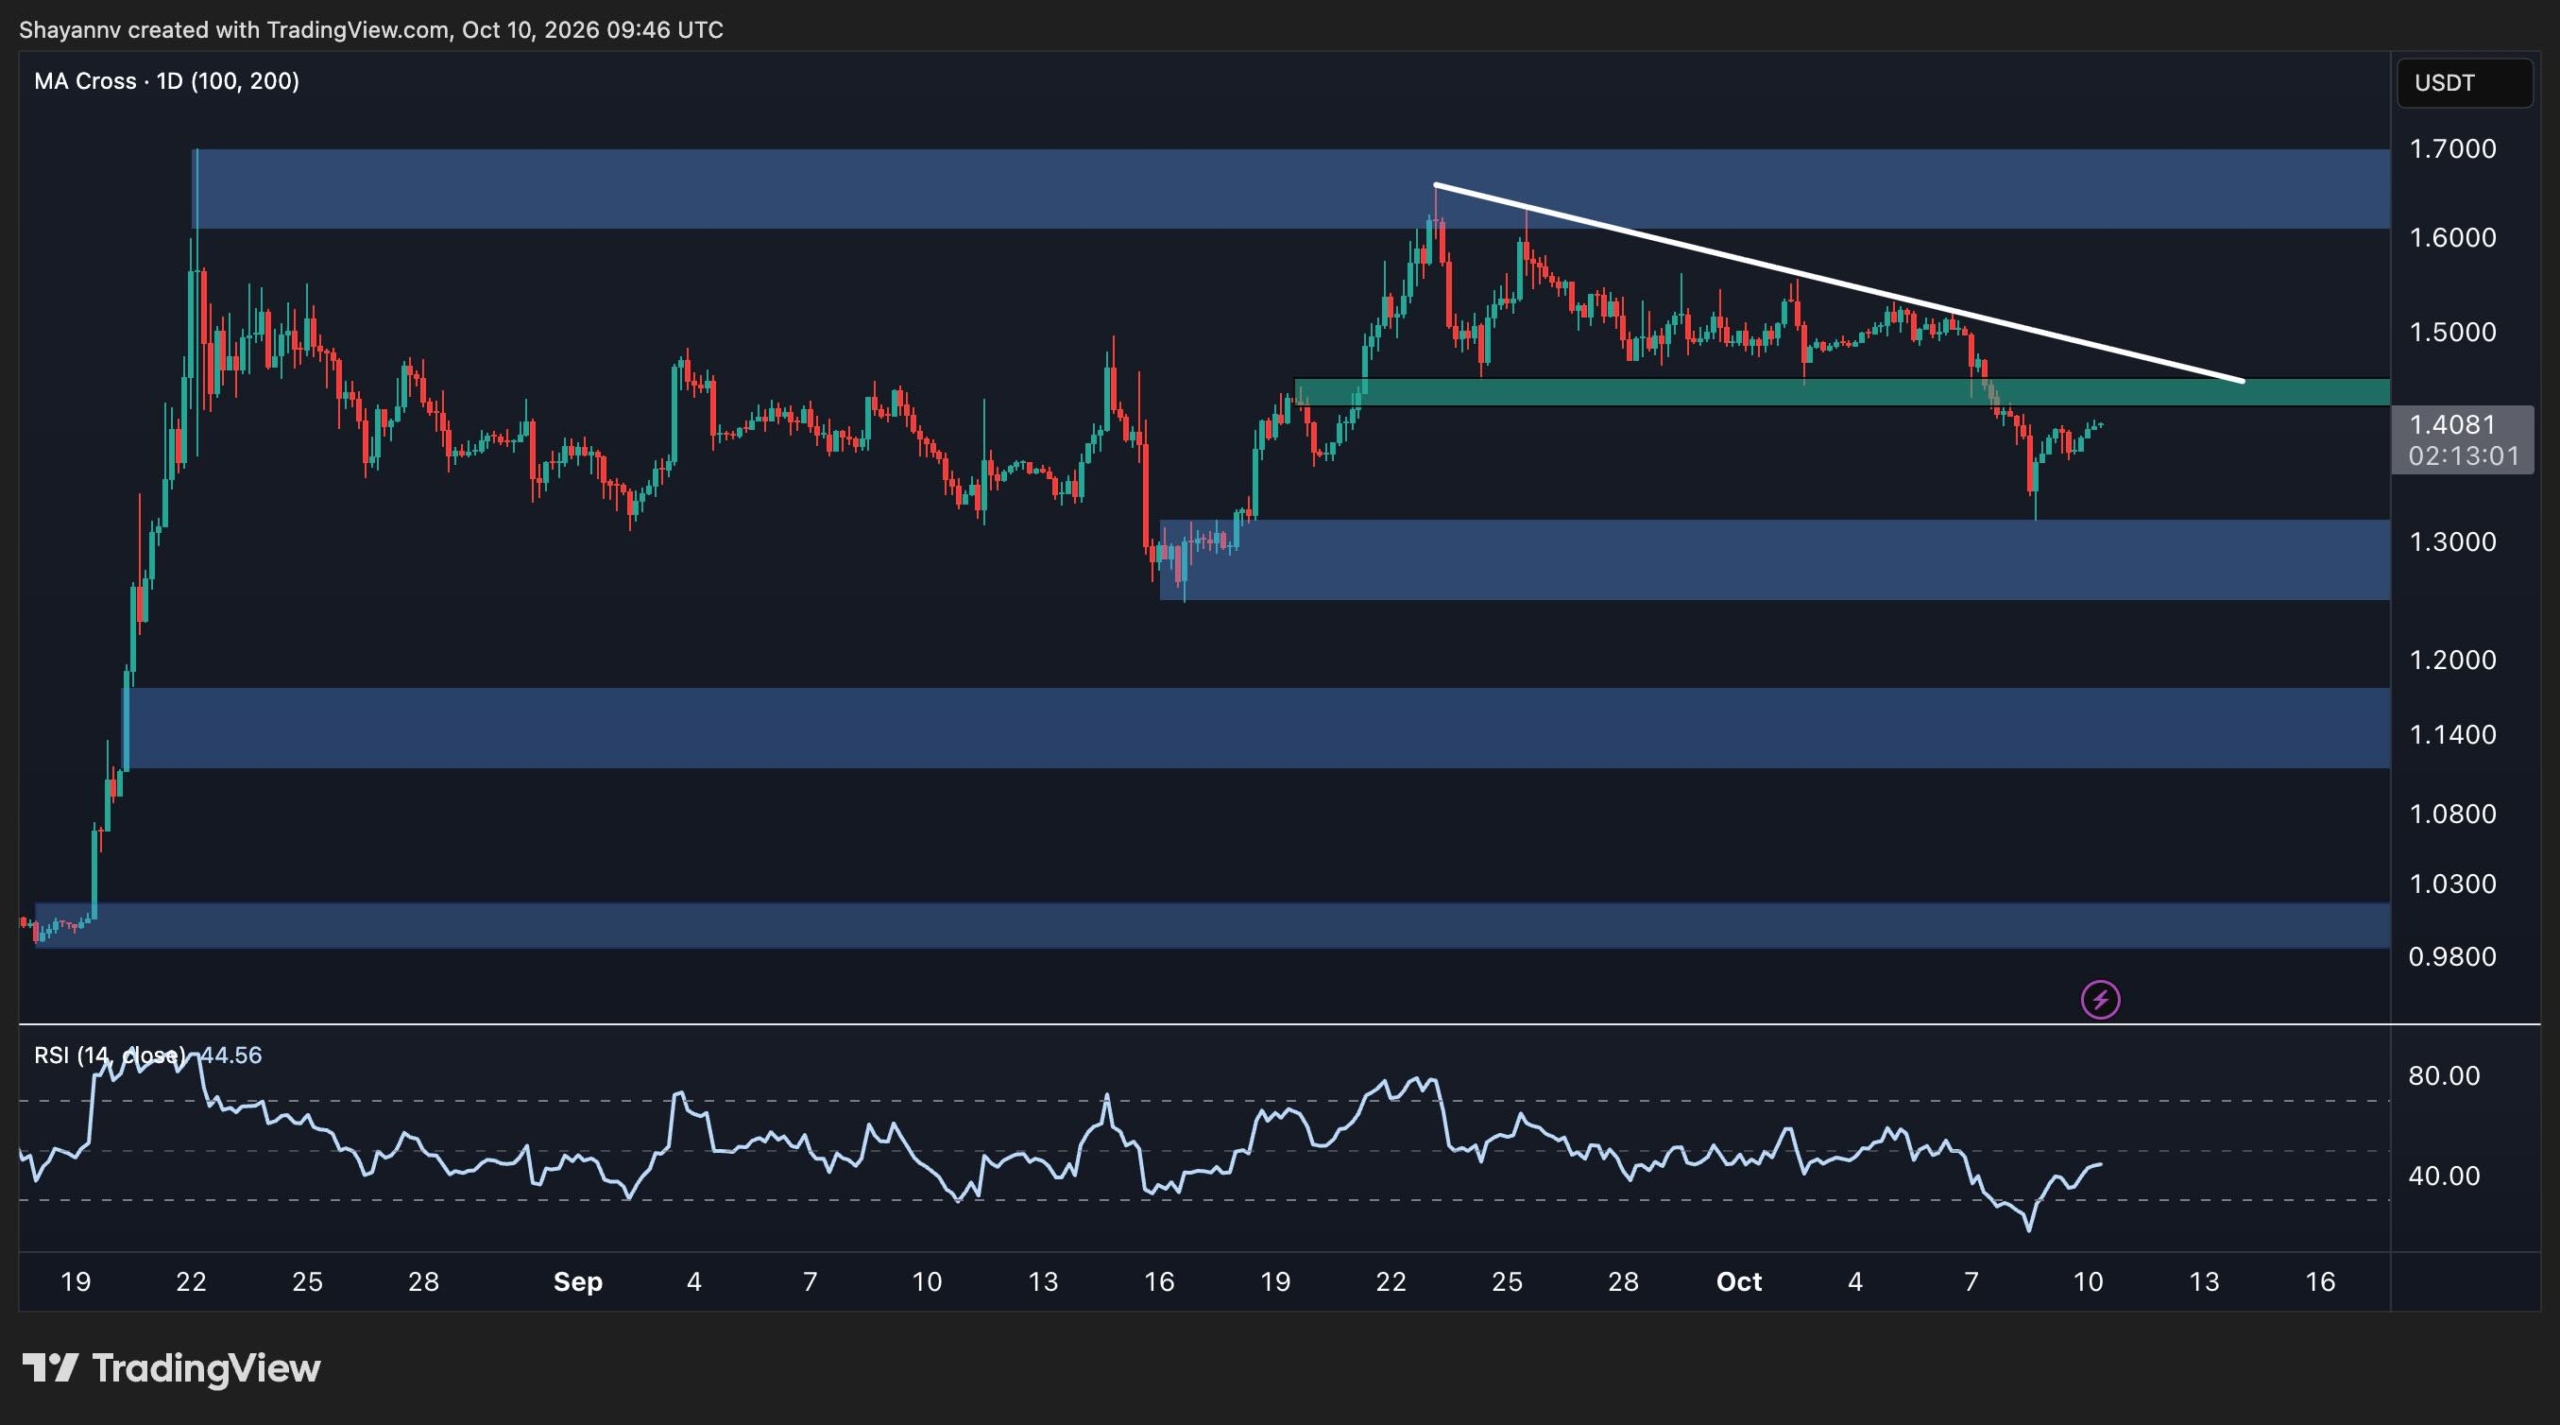
The post Ripple Price Analysis: XRP Tests Critical Trendline Following Recent Correction appeared first on CryptoPotato.
Ethereum is trading near $2.5K after a sharp correction from the $2.7K resistance area, with the latest price action putting a key support zone under pressure. While ETH remains above its daily 100-day and 200-day moving averages, weakening momentum and a recent rebound in the exchange supply ratio suggest that traders should watch for further volatility before assuming the broader recovery will resume.
Ethereum Price Analysis: The Daily Chart
Ethereum’s daily chart shows a strong recovery from the June lows near $1.5K, followed by a sharp rally that carried the asset through the $2K region and into the $2.4K area. ETH subsequently climbed toward the $2.7K resistance zone, where it consolidated for the last few weeks before sellers regained control in early October.
The latest rejection from the $2.7K supply zone has pushed ETH back toward $2.4K, the immediate support area. Buyers have started to respond after the latest sell-off, as yesterday’s candle wicked through the support and bounced, but the rebound remains modest and has yet to establish a convincing bullish reversal.
If this support holds, ETH could attempt to recover toward the major resistance around $2.7K. A sustained breakout above the level would improve the near-term structure and potentially reopen the path toward $3K.
However, a decisive daily close below the $2.4K support zone would weaken the recovery structure, as the ascending channel that has carried the price higher from June lows would also get broken to the downside. In that scenario, the next notable support area lies around $2K-$2.2K where the 100-day and 200-day moving averages have recently printed a bullish crossover.
The Relative Strength Index (RSI) has also dropped to approximately 40, indicating weakening momentum and a shift toward bearish territory. Although the indicator is approaching oversold levels, it has not yet reached the conventional threshold below 30. A recovery above 50 would provide a stronger indication that buyers are regaining control, while continued weakness below 40 would leave ETH vulnerable to another test of support.
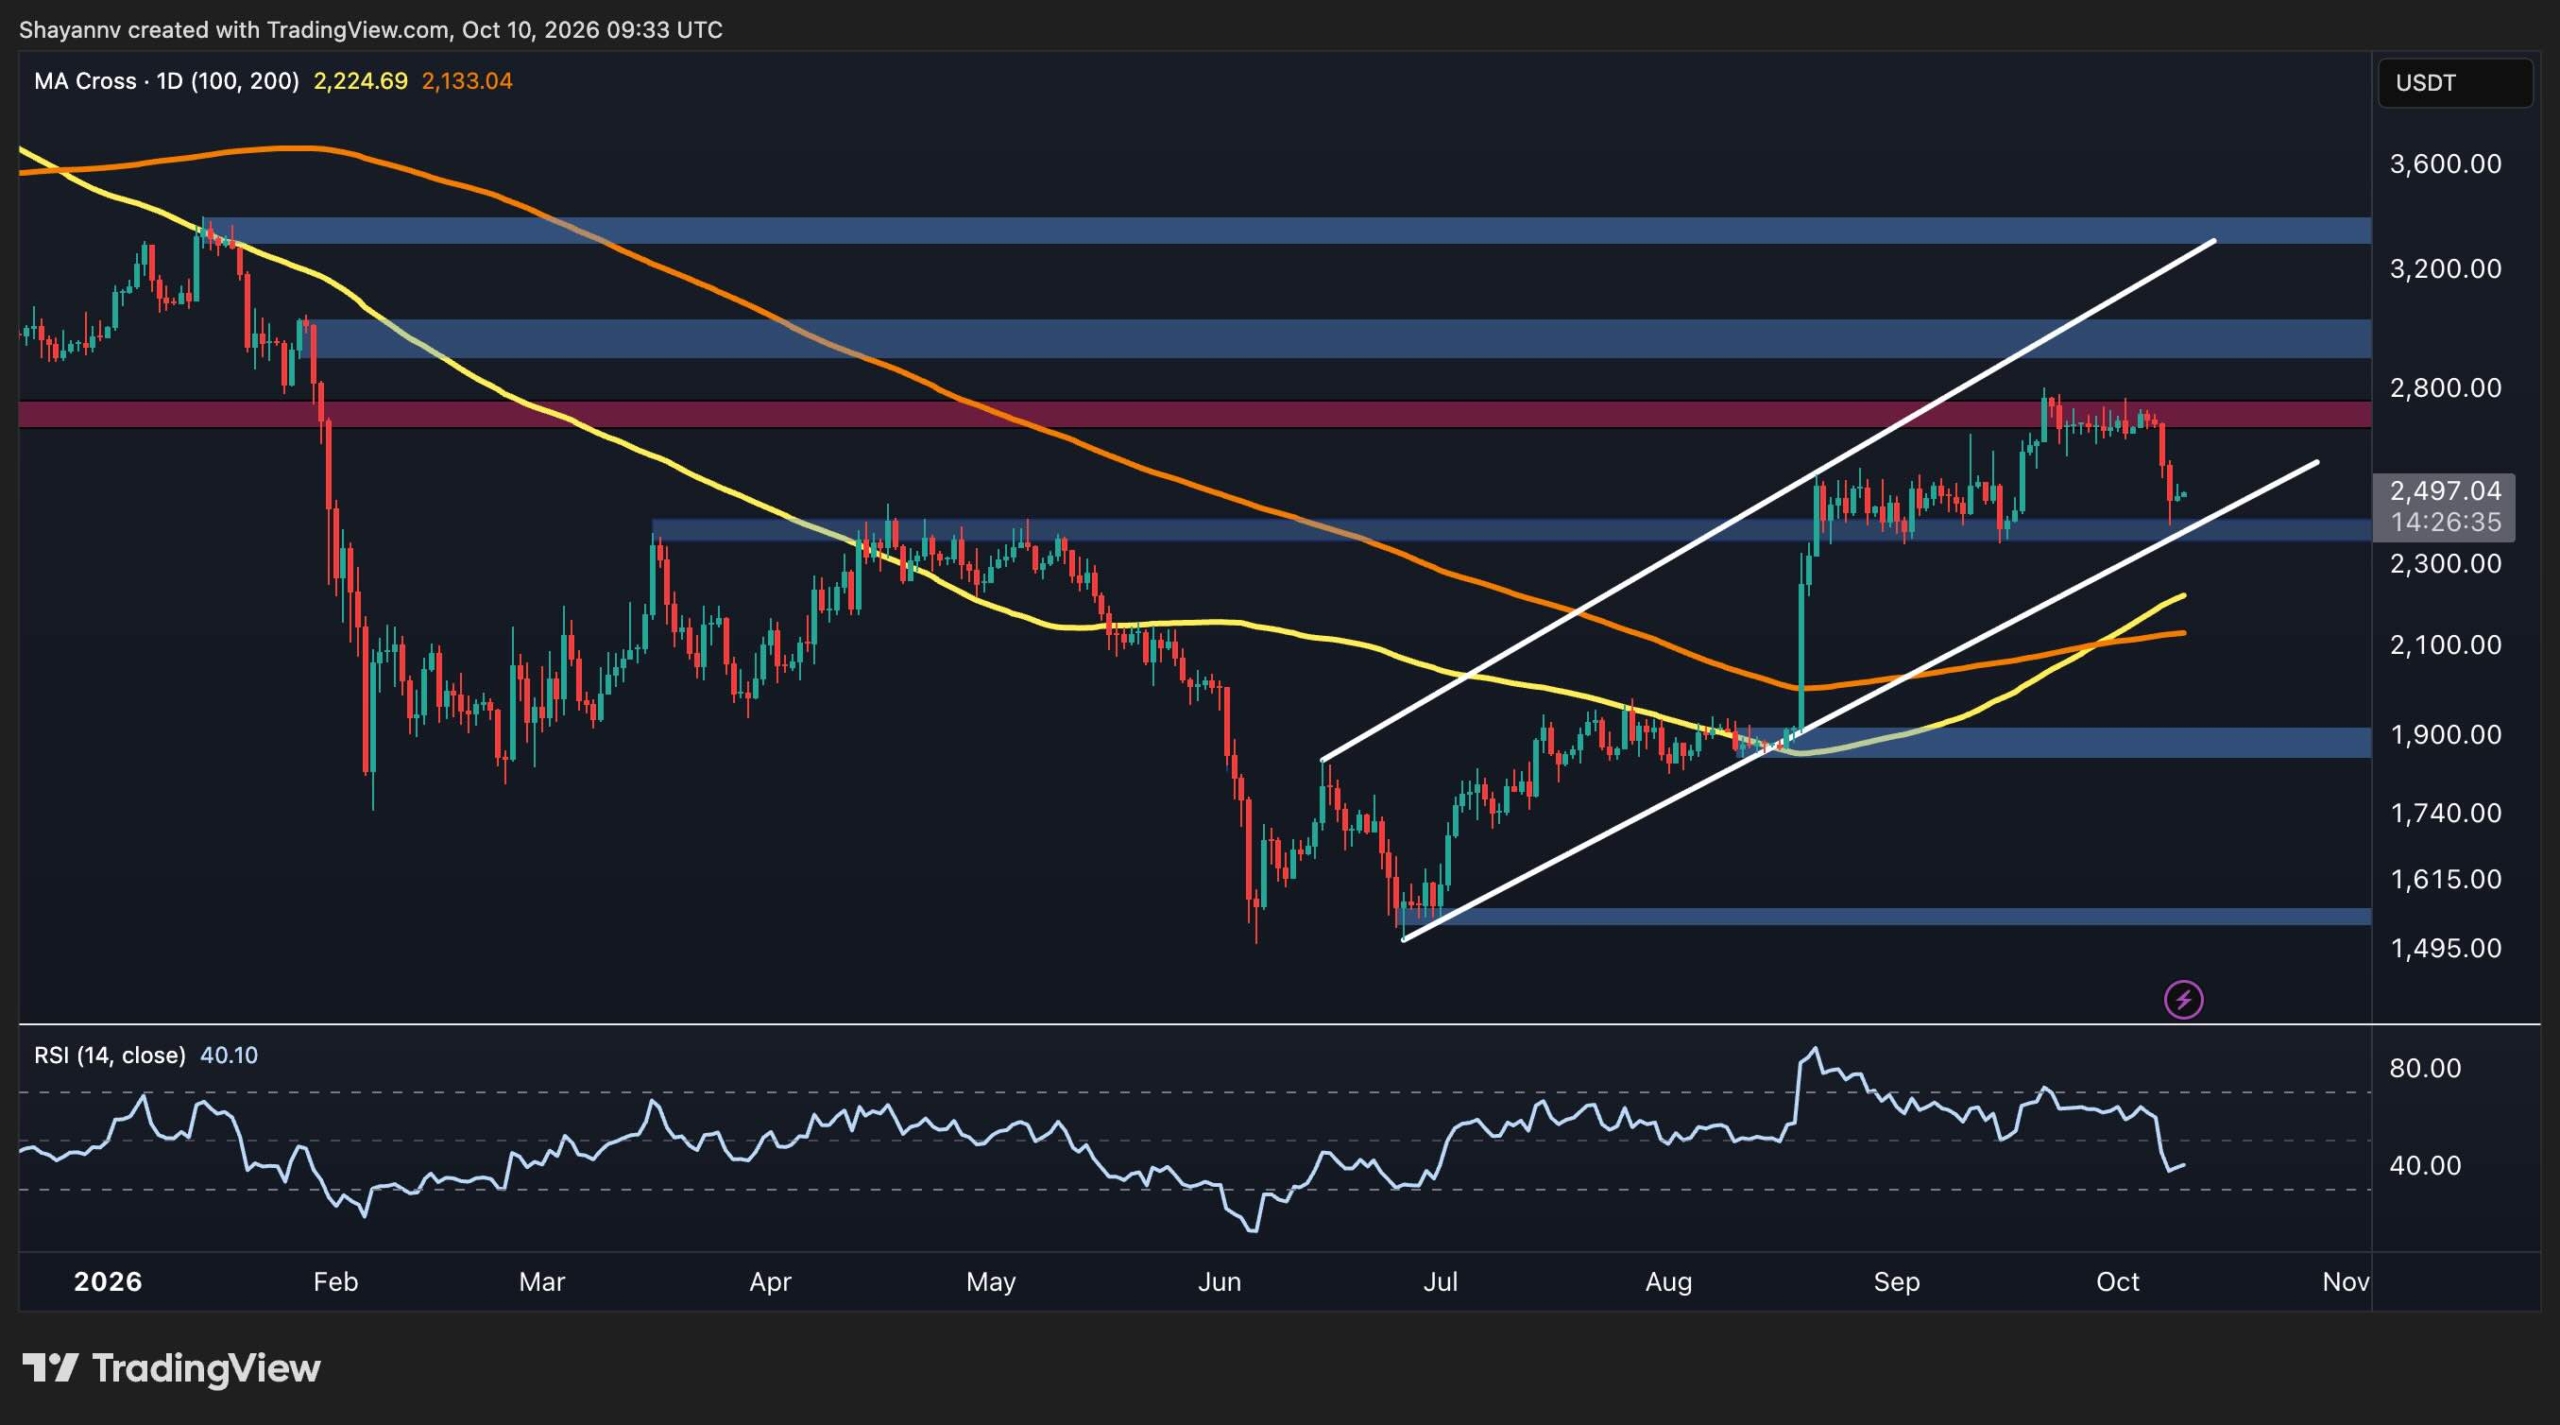
ETH/USDT 4-Hour Chart
The 4-hour chart provides a clearer picture of the recent selling pressure. Ethereum spent much of late September consolidating between approximately $2.6K and $2.8K before breaking lower aggressively earlier this week. The move accelerated as ETH lost the $2.6K lows, eventually driving the price toward the $2.4K region.
The latest candles show a modest recovery toward $2.5K following the sharp downside moves. This suggests that buyers have stepped in around support, but the rebound is still too limited to confirm that the correction has ended.
The immediate resistance area is around $2.6K to $2.7K, where ETH must climb through the bearish imbalance formed during the drop. On the downside, the $2.4K support zone is the first level to monitor. ETH has reacted positively from this area, but a renewed breakdown could push the price below this region, and the market would potentially test the broader $2.2K support zone if this scenario materializes.
Meanwhile, the 4-hour RSI has recovered from a deeply oversold reading to approximately 40. This rebound indicates that selling pressure may be easing, but momentum remains relatively weak and below the neutral 50 level. The indicator would need to strengthen alongside price to support a more convincing recovery.

On-Chain Analysis
The exchange supply ratio measures the proportion of Ethereum’s circulating supply held on centralized exchanges relative to the broader supply tracked by the metric. It can help illustrate changes in the amount of ETH available on exchanges, although it does not independently establish whether holders intend to sell.
The chart shows a prolonged decline in the exchange supply ratio throughout much of 2026. The indicator fell from approximately 0.142 at the beginning of the year toward 0.124 in September. Over the same period, ETH’s price recovered from its summer lows and climbed toward $2.7K.
This behavior is notable. The declining ratio suggests that exchange-held supply has generally become smaller relative to the total supply represented by the metric. Reduced exchange availability can be consistent with accumulation or withdrawals into self-custody, potentially lowering the amount of ETH immediately available for spot selling. However, the chart alone cannot establish the reasons behind these movements.
More recently, however, the exchange supply ratio has rebounded from its lows. The increase is relatively modest compared with the decline seen earlier in the year, but it warrants monitoring alongside ETH’s latest price correction.
If the ratio continues to rise while ETH struggles below $2.7K, it could suggest that a larger proportion of supply is returning to exchanges, potentially increasing available selling liquidity. That interpretation would be more concerning if accompanied by continued price weakness and stronger exchange inflows, and could overwhelm demand and push the price even lower in the coming weeks.

The post Ethereum Price Prediction: Rebound Ahead or Will ETH Breakdown Toward $2K? appeared first on CryptoPotato.
CryptoQuant’s latest weekly report, shared with CryptoPotato, said that bitcoin miners’ revenues have jumped 78% from the July lows, profitability has improved, and the extreme miner outflows have disappeared.
After concluding that these major network participants have emerged from their toughest period of the year, CQ added that BTC’s price could further benefit due to the removal of this consistent selling pressure.
Selling Pressure From Miners Is Fading
The report highlighted no extreme miner outflow events since August 21, when roughly 29,000 left wallets associated with them as the cryptocurrency’s price rallied from under $65,000 to $76,000. The largest daily outflows were approximately 12,000 BTC, within what the analytics company considers a normal range.
Older miners are also selling substantially fewer units. Excluding Patoshi-associated BTC, Satoshi-era miners moved approximately 600 units out of their wallets in September, around 70% below January’s 2,000 BTC. At the same time, their combined holdings remain close to 590,000 bitcoins.
The trend extends to larger modern miners as addresses holding between 100 and 1,000 units saw their collective balance drop by about 20%, from roughly 64,000 BTC in December 2025 to 51,000 BTC by early September. However, the figure has since stabilized rather than continuing to decline.
Although CQ admitted that miners are not accumulating yet, the report determined that the persistent selling pressure has stopped. This is a notable change from early August, when we reported that major miners, including MARA and Riot Platforms, were continuing to move BTC to NYDIG amid difficult industry and market conditions.
Why Such a Change?
The report explained that miners are not obligated to sell right now because BTC has rallied 45% from under $58,000 at the start of July to over $83,000 this week. This lifted the total daily miner revenue from $27 million to around $48 million, which shows a 78% increase. Transaction fees also recovered from a seven-day average of $195,000 to $275,000, although they remain far below the peaks seen in 2025.
CryptoQuant’s Miner Profit/Loss Sustainability Indicator shifted from “extremely underpaid” between May and August to “fairly paid” after August 21. This means miners earning enough to cover operating costs need less to liquidate BTC just to stay afloat.
Bitcoin’s hash rate has recovered as well, going from under 900 EH/s in late July to over 960 EH/s, while its drawdown from the previous peak narrowed from 18% to 13%. CQ interprets this as mining capacity returning rather than operators capitulating.
However, the report outlined a missing piece. Miners have stopped selling, but they have not yet started rebuilding their BTC balances. CQ believes a sustained return to accumulation would provide an even stronger signal that the backbone of the Bitcoin network has shifted decisively from a source of market supply to long-term holders.
The post Bitcoin Miners Stop Selling Aggressively: Why This Could Be Big for BTC appeared first on CryptoPotato.
October has a very solid reputation in the cryptocurrency markets as “Uptober” – a green month that has historically led to major gains.
Last year’s edition was quite historic. On the one hand, BTC skyrocketed to its latest all-time high of roughly $126,000. On the other hand, though, it experienced its worst liquidation event ever. This weekend marks the first anniversary of the latter.
A Date to Remember
In the days leading up to October 10, more on that date in a second, BTC was climbing hard, earning the name Uptober. The latest record came on October 7 at just over $126,000. Analysts and permabulls were quick to praise the move and highlight the next massive targets of $200,000 or even $500,000 by the end of the year.
The reality was different. Very different. And a lot more painful. On October 10, 2025, escalating US-China trade tensions, among other reasons, triggered a violent sell-off that was exacerbated by the enormous amount of leveraged positions. According to most estimates, the total value of wrecked positions exceeded $19 billion within 24 hours. This was the worst such day in the entire 16-year history of the cryptocurrency industry at the time.
Bitcoin led the charge with a nosedive from $122,000 to $105,000 on most exchanges and even to $101,000 on a few. Over 1.6 million traders were caught by surprise and were liquidated.
The timing made the collapse particularly brutal: BTC had reached a fresh (and its latest) all-time high above $126,000 just 48-72 hours earlier. Today, a year later, that level sounds like a mirage.
Yet to Recover in a Different Market
That crash was the start of a prolonged bear market that culminated, at least for now, with a price slump to under $58,000 on July 1. In other words, bitcoin tumbled by 53% in months after its worst liquidation event to date. It now sits at around $82,000-$83,000, which is still around 34% lower than the 2025 peak.
Although the situation appears significantly better now than it did in July, there are still some warning signs, such as the correction experienced in the past week, in which BTC dipped from $87,000 to $80,400 before it rebounded to the current levels. On the plus side, at least five indicators tracked by BIT recently moved into territory associated with bullish market regimes.
But the October 10, 2025 event is one that has to be remembered. Hopefully, it could serve as a lesson to certain traders who tend to go all-in once the market is doing well and vice versa. I wish I could say that this is precisely the case, and people have learned their lesson. However, last week’s pullback in which over $1 billion in leveraged positions was wiped out in less than a day says otherwise.
The post 1 Year Since Crypto’s Biggest Liquidation Event: Bitcoin Hasn’t Fully Recovered Yet appeared first on CryptoPotato.
Despite the major leg down at the end of the business week, on-chain data showed that the daily active addresses on the Cardano network surged to roughly 1.7 times September’s weekday average following the launch of a new token standard.
At the same time, Cardano reached a substantial milestone in its bid for a .ada internet domain.
On-Chain Activity Pumps
Data from Santiment Intelligence shows that Cardano recorded approximately 27,500 daily active addresses on October 7 and almost as many a day later, which is significantly higher than the average weekday level seen in September. The analysts tested whether the broader market decline could explain the increase but found that active addresses on Bitcoin and Ethereum remained at or below their respective September norms during the same period.
The timing coincided with the October 7 launch of CIP-0113, Cardano’s new programmable token standard. The Cardano Foundation explained that the standard lets issuers of regulated assets such as stablecoins and tokenized funds build requirements, including KYC, sanctions checks, and transfer restrictions, directly into native Cardano tokens.
It went live following multiple independent security audits and has been recognized by the Capital Markets and Technology Association (CMTA), CF said.
Despite this uptick in activity, Santiment warned that it remains below Cardano’s late-August local high. It remains to be seen now whether this increase survives beyond the initial launch period, especially as ADA’s price rally has cooled. The asset recently soared to a multi-month peak of $0.28, where it was rejected, and the subsequent leg down drove it below $0.24 on Friday. However, it’s up by over 7% in the past 24 hours again.
New Cardano Milestone
The activity spike coincided with another potentially important development for the broader Cardano ecosystem. CF revealed at TOKEN2049 earlier this week that its application for the .ada generic top-level domain has advanced to the next phase of ICANN’s New gTLD Program. The proposal previously received approximately 75% support from the Cardano community through an on-chain Governance Action.
If approved, .ada would operate as a genuine internet top-level domain, similar to extensions such as .com or .org. CF believes it could eventually support simplified wallet addresses, decentralized identity integrations, and domain tokenization. However, ICANN still needs to assess the application’s technical, financial, and operational readiness, with successful domains from the current round expected to be delegated between 2028 and 2030.
The post Cardano Just Delivered Two Bullish Signals at TOKEN2049 as ADA Rebounds appeared first on CryptoPotato.