Cryptocurrency Posts
Crypto Briefing
Speculation about Khamenei's status fuels uncertainty in Iran's political future, impacting prediction markets and regime stability perceptions.
The post Iran’s Supreme Leader Khamenei funeral updates prompt leadership change speculation appeared first on Crypto Briefing.
Logan's hawkish stance may lead to tighter monetary policy, impacting crypto markets and prompting investors to shift towards stablecoins.
The post Dallas Fed’s Lorie Logan speaks as 2026 FOMC voter with rate hike talk in the air appeared first on Crypto Briefing.
Rising oil prices and market volatility highlight the global economic risks of geopolitical tensions, potentially impacting energy security and financial stability.
The post Iran conflict escalates, oil prices surge amid US tensions appeared first on Crypto Briefing.
Anthropic's strategic IPO move with top underwriters signals strong market confidence, potentially reshaping AI industry valuations and dynamics.
The post Anthropic taps Morgan Stanley, Goldman Sachs for IPO lead: Bloomberg appeared first on Crypto Briefing.
Nvidia's RTX Spark could redefine PC roles, enhancing local AI capabilities and security, while opening new revenue streams for tech giants.
The post Nvidia unveils RTX Spark, advancing AI integration in Windows PCs appeared first on Crypto Briefing.
Bitcoin Magazine
Bitcoin Magazine

Franklin Templeton CEO: Blockchains Threaten Wall Street’s Fee Machine, Not Its Technology
Franklin Templeton CEO Jenny Johnson has a straightforward explanation for why major financial institutions have been slow to embrace public blockchains: the technology destroys their fee-based revenue streams.
Speaking at the Proof of Talk summit in Paris, Johnson — who oversees $1.74 trillion in assets at Franklin Templeton — told a panel audience that the resistance from traditional financial players is not about technology skepticism.
It is about protecting the business model. Banks and intermediaries that collect transaction fees at every step of the settlement process stand to lose that income the moment a smart contract can handle the same function at a fraction of the cost.
Johnson pointed to Franklin Templeton’s tokenized money market fund, Benji, as a concrete demonstration of the cost differential. Running 50,000 transactions through the firm’s legacy system cost $1.30 per transaction. The same volume processed on the Stellar blockchain came in at $1.13 per transaction — a meaningful reduction at institutional scale.
The announcement came as Franklin Templeton disclosed a new partnership with MoonPay, designed to let institutional investors move between stablecoins and the firm’s tokenized fund through an on-chain workflow.Franklin Templeton’s push into digital assets is one of the most aggressive moves by a legacy asset manager in the industry’s history. The California-based firm, which manages roughly $1.74 trillion in assets, began building its dedicated digital assets team in 2018 — years before tokenization became a mainstream focus among institutional players.
Franklin Templeton’s bitcoin and crypto push
Benji launched in 2021 as the world’s first U.S.-registered mutual fund to use a public blockchain as its official system of record for processing transactions and recording share ownership. The fund invests predominantly in U.S. Treasury securities and uses blockchain strictly for operational efficiency rather than crypto exposure.
On the bitcoin front, Franklin Templeton launched the Franklin Bitcoin ETF (ticker: EZBC), a passive product that holds only bitcoin and cash, designed for investors seeking direct price exposure without managing custody.
The firm also offers a dynamic bitcoin/ethereum separately managed account product for investors wanting active allocation between the two largest digital assets.
In April 2026, Franklin Templeton announced plans to acquire 250 Digital, a spinoff from crypto venture firm CoinFund, forming a new division called Franklin Crypto to pursue active cryptocurrency investment strategies at institutional scale.
The deal itself broke new ground — BENJI tokens were used as part of the acquisition payment, making it one of the first M&A transactions structured on-chain. The firm’s digital assets division manages approximately $1.8 billion in assets.
This post Franklin Templeton CEO: Blockchains Threaten Wall Street’s Fee Machine, Not Its Technology first appeared on Bitcoin Magazine and is written by Micah Zimmerman.
Bitcoin Magazine

Bitcoin Price Crashes to Precarious Position Below $65,000 as Momentum Rotates Into AI, IPOs
Bitcoin price is holding a risky position near $65,000 Wednesday, down roughly 12% over the past seven days and trading at its lowest level since February as a broad rotation out of crypto into competing speculative trades chips away at the foundation of its recent bull run.
The world’s largest cryptocurrency touched a bitcoin price of $64,987 earlier in the session before a partial recovery, but analysts and strategists say the weakness runs deeper than any single catalyst.
The most popular explanation — that Strategy’s (MSTR) first bitcoin sale in four years triggered the slide — is being challenged by a growing chorus of market voices.
Charles Schwab director of digital currencies research and strategy Jim Ferraioli that the issue in simpler terms: bitcoin is losing its status as the market’s dominant momentum trade.
“Bitcoin has been in a bear market since October,” Ferraioli said according to CoinDesk reporting. “There’s a lack of a reason to be buying here when there’s other things you can choose.”
A broader sentiment in the bitcoin space is that the asset class is facing a competition problem, not a confidence problem.
JUST IN: Bitcoin falls to $64,997
— Bitcoin Magazine (@BitcoinMagazine) June 3, 2026
HODL!pic.twitter.com/oKimXD2fjg
Capital that once poured into crypto in search of high-octane returns is rotating toward artificial intelligence stocks, gold, and a wave of high-profile IPOs from private tech firms including SpaceX, OpenAI, and Anthropic.
Those offerings represent some of the most anticipated market events of the year, and investors appear to be freeing up liquidity to participate.
Wall Street bank Citi reinforced a similar structural concern Wednesday. Analyst Alex Saunders estimated that spot bitcoin ETF flows account for roughly 45% of weekly BTC price variation — the clearest real-time gauge of investor demand.
Those flows have turned negative. Saunders also flagged diminishing prospects for the Clarity Act, a U.S. crypto market structure bill that many in the industry viewed as a potential catalyst for fresh institutional inflows.
Without that regulatory tailwind, the bank sees sentiment remaining muted.
Strategy’s sale of 32 BTC for approximately $2.5 million in late May did rattle markets. The transaction marked a rare departure from Executive Chairman Michael Saylor’s longstanding “buy and hold” approach and sparked concern that one of bitcoin’s most prominent corporate backers could shift from buyer to seller.
Strategy attributed the move to a tax-optimization plan disclosed during its first-quarter earnings call.
Citi said the sale was anticipated and does not change the firm’s broader strategy. Ferraioli described it as a convenient narrative attached to a trend already underway, noting that many ETF investors sitting near breakeven are treating the current price level as an exit opportunity rather than a buying opportunity.
Are the U.S. and Iran tensions causing a bitcoin price dip?
Another theory gaining traction in analyst circles points to U.S. sanctions on Iran’s digital asset ecosystem as a source of persistent selling pressure.
Treasury Secretary Scott Bessent announced the freezing of more than $1 billion in Iranian crypto assets last week, and the U.S. sanctioned Nobitex, Iran’s largest crypto exchange, on Tuesday for alleged ties to the Islamic Revolutionary Guard Corps.
From a technical standpoint, the bitcoin price at $65,000 level is critical. This level is a test of year-to-date lows around $60,000. Bitcoin Magazine Pro data points to an initial support in the $63,000–$64,000 bitcoin price range, where bids emerged in February and March, with a bitcoin price of $60,000 representing the next major psychological floor and $58,000 beyond that.
This marks the third test of bitcoin price’s February 6 panic low. The prior two — on February 24 and March 29 — produced sharp recoveries above $70,000. Seasonal weakness, historically concentrated in summer months, gives bulls little immediate help.
With AI assets outperforming, IPO pipelines absorbing speculative capital, and legislative catalysts receding, bitcoin’s path back to momentum-driven price discovery depends on investor attention returning — and right now, that attention is pointed elsewhere.
At the time of writing the bitcoin price is near $65,300.

This post Bitcoin Price Crashes to Precarious Position Below $65,000 as Momentum Rotates Into AI, IPOs first appeared on Bitcoin Magazine and is written by Micah Zimmerman.
Bitcoin Magazine

Blockware Appoints Megan Brooks-Anderson as Chief Executive Officer
HOUSTON, Texas – June 3, 2026 – Blockware, a vertically integrated infrastructure platform spanning AI/HPC compute, Bitcoin mining, data center hosting, and marketplace liquidity, has named Megan Brooks-Anderson as its new Chief Executive Officer. The appointment follows the board’s removal of Mason Jappa from the role.
Brooks-Anderson comes to the CEO seat after serving as Blockware’s Chief Strategy Officer, and is one of the architects of the very direction she’s now been tapped to execute. She brings more than 20 years of experience across Bitcoin mining, public and private company operations, risk management, M&A, and internal controls. Before Blockware, COO at Riot Platforms (NASDAQ: RIOT), where she helped build and scale one of the largest Bitcoin mining operations in North America.
“I’m honored to step into this role at such a pivotal moment for Blockware,” said Brooks-Anderson. “We have an exceptional team, strong partnerships, and a clear path forward. My focus from day one is on execution and delivering immediate value for our investors, our partners, and the talented people who make this company what it is.”
Brooks-Anderson will lead alongside co-founder and newly-appointed President, Sam Chwarzynski. The two share a long-standing commitment to doing right by the team and investors — a standard rooted in the legacy of co-founder Matt DSouza, whose vision for building something meaningful continues to shape the company’s culture and direction.
The leadership transition comes at an inflection point for Blockware. The company is moving aggressively into artificial intelligence and high-performance computing infrastructure, with a formal announcement expected in July. That expansion will build on Blockware’s existing infrastructure footprint through partnerships with major AI/HPC partnerships. Blockware’s core mining business remains a central piece to its long-term strategy, and existing clients and partners will remain a priority as the company scales into new verticals.
Backed by an experienced leadership team led by Brooks-Anderson and Chwarzynski, established strategic partnerships, and a clear path for expansion, Blockware is poised to enter its next chapter with strong momentum and the leadership required to capitalize on emerging opportunities.
For more information, visit blockwaresolutions.com.
###
About Blockware
Blockware is a vertically integrated infrastructure platform powering AI/HPC compute, Bitcoin mining, data center hosting, and marketplace liquidity. Since 2017, the company has built end-to-end capabilities across hardware sourcing, deployment, and operations, and is expanding its marketplace and infrastructure model into AI/HPC infrastructure through it’s subsidiary, Nodestream. By combining procurement, site readiness, marketplace liquidity, and operational expertise, Blockware enables institutional and enterprise customers to access compute resources more efficiently for both Bitcoin and AI workloads. With over 400,000 servers sold, nearly 1 GW of energized capacity, and a growing institutional client base, Blockware is distinguished by its cross-market scale and integrated execution.
Media Contact: blockware@melrosepr.com
Disclaimer: This is a sponsored press release. Readers are encouraged to perform their own due diligence before acting on any information presented in this article.
This post Blockware Appoints Megan Brooks-Anderson as Chief Executive Officer first appeared on Bitcoin Magazine and is written by Bitcoin Magazine.
Bitcoin Magazine
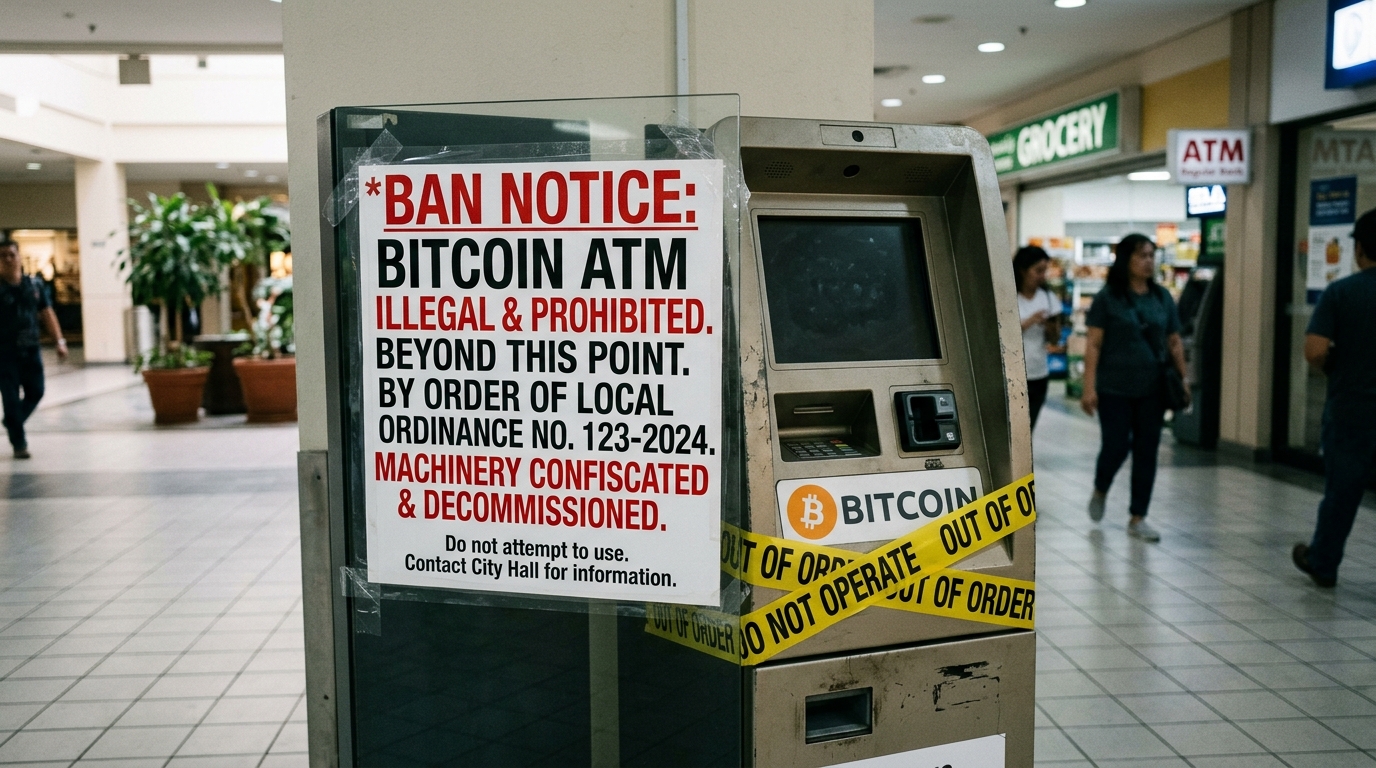
Bitcoin ATMs: The Canary in the Coal Mine
State regulators have been quietly banning Bitcoin ATMs. An entire subsection of the Bitcoin ecosystem is being deemed illegal and shut down. And since there’s not much of a cross-section between people who are chronically online and cash bitcoin buyers, it’s not getting a lot of attention. But the Bitcoin ATM ecosystem represents $3.63 billion, with a B, dollars going into bitcoin every year, and that’s just in the United States.
Beyond the financials, Bitcoin ATMs are vital to maintaining self-sovereignty in the system. A Bitcoin ATM enables something no other service in the financial industry can: it lets you walk up with cash, no bank account, no credit check, no exchange account, and walk away with bitcoin in a wallet only you control.
Perhaps it’s the self-sovereignty the regulators don’t like. Alas, they’re blaming the boogeyman, Fraud.
Total bans, making Bitcoin ATMs illegal, have already been enacted in Indiana, Tennessee and Minnesota. De facto bans are also in place, creating limits that make it impossible to operate with any net profit in California, South Dakota, Wisconsin, and Virginia.
All of the bans and regulations are, of course, done under the guise of “protecting the consumer,” but legislation is not stopping fraud. The chain of fraud is easy to track, and Bitcoin ATM operators are doing just that, joining forces to form a coalition and fight back.
No other industry is more heavily scrutinized than a fully licensed MSB (money services business) carrying MTLs (money transmission licenses) operating cash businesses subject to FinCEN’s AML KYC regulations.
The fraud argument is selectively applied to Bitcoin ATMs because it’s politically easy. It’s also caught in the crosshairs of the AARP’s two-billion-dollar operating budget. But the facts don’t support the narrative. Across the broader financial industry, the standard rate of fraud is somewhere between 3 – 5%. It’s only 1.2% at Bitcoin ATMs. In other words, 98.8% of Bitcoin ATM transactions are legitimate.
Why aren’t the states banning Western Union or Visa gift cards? Or robocalls, for that matter?
The median Bitcoin ATM transaction is $300; 80% of all transactions are under $1,000. The average ATM customer is someone putting $50, $100, or $500 at a time into an appreciating asset, the same way someone DCAs on an exchange. The repeat purchase average is every 24 days, and the average lifetime spend per customer is $12k. Per the Federal Reserve’s own research, Bitcoin ATM’s primary users are the 24.6 million unbanked and underbanked Americans who are “disproportionately Black, Hispanic, immigrant, rural, low-income.” They’re moving $20–$100 at a gas station because they don’t have a bank account. States aren’t banning speculative tools; they’re banning legitimate financial access for people who already have the fewest options.
The “fraud” is just a Trojan horse. The banning won’t stop with ATMs. “A canary in a coal mine” is a metaphor for an early warning sign of impending danger or failure. While the President tries to claim the USA as the “Bitcoin capital of the World” his own justice department has put industry developers in prison. Another trend we cannot allow.
In order for Bitcoin to succeed, we need all sections of the Bitcoin ecosystem to thrive. Similarly, in order for the industry to thrive here in the United States, we need the States to maintain their rights.
If the banning is allowed to stand, it will not stop with just ATMs. This is a test case for “ban first, ask questions never.” Both the current and previous administrations have proposed a litany of bills that would similarly ban other parts of the ecosystem, encroaching on the rights of nearly everyone interacting with the bitcoin network in one way or another.
A short list of some of the bills that came close:
S.5267 — Digital Asset Anti-Money Laundering Act of 2022: explicitly named wallet providers, miners, validators and others as MSBs (triggering KYC/AML law).
S.2669 — Digital Asset Anti-Money Laundering Act of 2023: reintroduced the same general approach of treating digital asset providers/facilitators as BSA financial institutions. S.2355 — CANSEE Act: targeted DeFi facilitators/backers and sought to apply AML/sanctions obligations to DeFi-style activity.
S.3867 — Digital Asset Sanctions Compliance Enhancement Act: targeted transaction facilitators and platforms for sanctions-related prohibitions.
And H.R.3684 — Infrastructure Act: which was enacted and sparked a debate around the definition of “exchanges and brokers” which initially included miners, node operators and software developers despite the fact that the required reporting would have been technically impossible. The Treasury and IRS eventually narrowed their scope before the bill was implemented. But how many in the industry knew how close this was to becoming law?
We cannot let them define self-custody wallets as “money laundering tools,” P2P exchanges as “unlicensed money transmission,” Lightning nodes as “unregulated payment processing,” or Bitcoin ATMs as “fraudulent activity.”
The entire promise of Bitcoin is that no one can stop you from holding and transacting with your own money. The Bitcoin ATM is where that promise meets physical reality. A person with cash and a cell phone can participate in a global, censorship-resistant financial network without asking anyone’s permission.
Let’s keep it that way.
If the state can eliminate the only way to go from cash to self-custody, then the self-custody right is theoretical. It exists only for people who already have bank accounts and exchange
relationships, which is to say, people who already have permission. The bitcoin ATM is the canary. If it dies and nobody notices, the coal mine is next.
This is a guest post by Michelle Weekley. Opinions expressed are entirely their own and do not necessarily reflect those of BTC Inc or Bitcoin Magazine.
This post Bitcoin ATMs: The Canary in the Coal Mine first appeared on Bitcoin Magazine and is written by Michelle Weekley.
Bitcoin Magazine

Scott Bessent Backs Strategic Bitcoin Reserve, Urges Senate to Pass Clarity Act
Treasury Secretary Scott Bessent told the Senate Finance Committee on Wednesday that the Trump administration is committed to building out the United States’ Strategic Bitcoin Reserve, expressing enthusiasm for the effort and calling on lawmakers to advance major crypto legislation before the summer’s end.
Bessent appeared before the committee at a hearing on “The President’s Fiscal Year 2027 Budget for the Department of the Treasury,” where senators pressed him on a range of fiscal priorities.
The exchange quickly moved into the administration’s digital asset agenda, with Bessent tying the bitcoin reserve to his broader national security doctrine.
“Economic security is national security,” Bessent told the committee — an argument he has been advancing in recent weeks, including in a major address at the Reagan National Economic Forum in California, where he argued that America had been “asleep” on economic security for 25 years before President Trump took office. Under Trump’s leadership, he said, that course is now reversing.
JUST IN:
— Bitcoin Magazine (@BitcoinMagazine) June 3, 2026Treasury Secretary Scott Bessent says he's looking forward to working with lawmakers on the Strategic Bitcoin Reserve
"We are proceeding with all deliberate speed. And we are making sure…we use best practices and things will be durable for the future"pic.twitter.com/wMuttlfTlc
The U.S. Strategic Bitcoin Reserve
On the reserve itself, Bessent struck a tone of measured confidence. “We are proceeding with all deliberate speed,” he said. “And we are making sure…we use best practices and things will be durable for the future.”
He acknowledged that standing up the reserve is a complex, unprecedented undertaking — “new technology,” “new ground” — but signaled no retreat.
The Strategic Bitcoin Reserve was established by executive order on March 6, 2025, and currently holds an estimated 328,372 BTC, valued at roughly $25 billion.
All holdings came from criminal forfeitures and law enforcement seizures, not open-market purchases. The executive order prohibits the Treasury from selling any of those coins and instructs it to develop budget-neutral strategies for acquiring more.
To give the reserve a permanent legal foundation, Congress has been weighing the BITCOIN Act — sponsored by Sen. Cynthia Lummis of Wyoming — which would authorize the Treasury to purchase 200,000 BTC per year over five years, for a total of one million bitcoin, held for a minimum of 20 years.
Without congressional action, the reserve rests on executive authority that a future president could rescind.
Bessent on Wednesday made clear he wants that legislative backbone in place, and he paired the bitcoin push with a direct call for lawmakers to pass the Clarity Act.
“I look forward to the Clarity Act being passed this summer,” he told the committee.
The bill, which cleared the Senate Banking Committee by a 15-9 vote in May, would establish a comprehensive regulatory framework for digital assets, defining when crypto tokens are classified as securities or commodities.
The combination of the reserve and the Clarity Act represents the most substantial federal crypto policy push in U.S. history — and on Wednesday, Bessent put his name behind both.
This post Scott Bessent Backs Strategic Bitcoin Reserve, Urges Senate to Pass Clarity Act first appeared on Bitcoin Magazine and is written by Micah Zimmerman.
CryptoSlate
For traditional US banks, the CLARITY Act was intended as a firewall that effectively barred crypto companies from offering “passive” interest on stablecoins.
The legislation aimed to prevent a catastrophic deposit flight in which everyday checking account balances drain from the banking system into high-yield crypto exchanges.
But as lawmakers prepare to finalize the framework, Coinbase appears to be quietly structuring a loophole that relies on complex financial engineering to keep the lucrative yield flowing.
The key lies in a critical semantic distinction within Section 404 of the proposed legislation. While the CLARITY Act explicitly outlaws savings-account-style interest on stablecoins, it preserves “activity-based” rewards.
Enter Ethena, a synthetic dollar protocol that generates returns through an active, delta-neutral basis trade that involves shorting crypto perpetual futures while holding the spot asset.
By integrating with Ethena, Coinbase could theoretically route idle USDC into this strategy.
If successful, the exchange could pass along the profits of an active trading strategy and potentially offer massive yields on digital dollars right under regulators' noses while deeply frustrating a traditional banking sector stuck offering negligible rates.
The legislative wall called CLARITY Act
The CLARITY Act, a sweeping US market-structure bill designed to define how crypto assets and intermediaries operate under federal regulations, has been a legislative battleground.
At the center of the dispute that dragged out the Senate Banking Committee's process is the question of stablecoin rewards.
The latest compromise is primarily captured in Section 404, which was born from the Tillis-Alsobrooks amendment. The provision draws a hard regulatory line that the industry negotiated for months.
On one side is passive yield: simply holding a stablecoin balance and receiving periodic interest, which is structurally identical to a bank savings account. This is explicitly banned.
On the other side are activity-based rewards: incentives tied to actual customer activity, such as payments, transactions, platform usage, and trading. These are permitted.
The bank lobby pushed hard for these restrictions. Banking executives contend that firms offering bank-like products should face comparable oversight, reserve, and capital obligations.
If crypto platforms could freely pay savings-account rates on stablecoin balances without FDIC insurance requirements, they could easily siphon depositor capital at the expense of the regulated banking system.
JPMorgan Chase CEO Jamie Dimon recently voiced this exact frustration. In a recent interview, Dimon criticized Coinbase CEO Brian Armstrong and warned that the CLARITY Act could fail if traditional banking concerns aren't addressed.
Asked if he was satisfied with the current draft of the bill, Dimon was blunt, saying:
“No, because it allows them to effectively pay interest on deposits, stablecoins or something like that, without protection that they should have. The banks will not accept it that way…”
For the legislation to become law, representatives from the Senate Banking and Agriculture committees must merge their advanced bills before it clears the full Senate, the House, and lands on President Donald Trump’s desk. But while Washington debates, the crypto industry is already building around the new rules.
Coinbase's Ethena workaround
Coinbase relies heavily on stablecoins. In Q1 2026, the exchange reported $305.4 million in stablecoin revenue, making up roughly 52% of its subscription and services revenue.
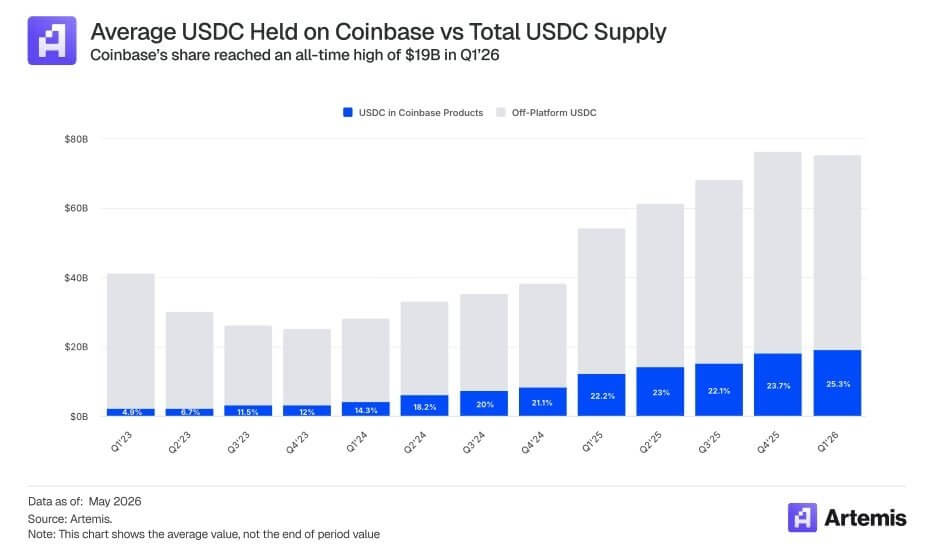
The firm also stated that it held an average of about $19 billion in USDC across its products, accounting for more than 25% of the total USDC in circulation.
To protect this vital revenue engine under Section 404, Coinbase needed a product in which yield is tied to explicit activity rather than passive holding. Its new partnership with Ethena perfectly threads this needle.
Ethena stated:
“Ethena and Coinbase have partnered to grow on-chain finance and savings products for their 100 m+ user base, with the first growth initiative launching next week.”
Alongside the integration, Coinbase Ventures made its first investment into Ethena on the open market.
Coinbase also confirmed its expanded role, noting it will support security and operations across more than $5 billion in Ethena assets. Coinbase now serves as Ethena's primary custodian, wallet provider, and perpetuals venue.
Because Ethena generates yield through complex trading activities, Coinbase can route yield-seeking USDC users into real borrow demand and active market strategies.
Guy Young, Ethena's Founder, explicitly acknowledged the regulatory tailwinds, saying:
“Excited to partner with Coinbase for the first time to support their dollar savings products…Given the evolving nature of the Clarity Act, we expect further potential tailwinds for onchain native products like USDe from idle balances on exchanges, and Ethena is well positioned to support this transition.”
Yan Liberman, a managing partner at Delphi Ventures, highlighted exactly how lucrative this structural shift could be for both sides. He stated:
“Reading between the lines for the upcoming product launch referenced. Coinbase x Ethena is bullish because it can turn Coinbase’s ~$19B USDC base, with an implied ~$13B of reward-earning balances, into a funding rail for Ethena. If sUSDe yields clear baseline USDC rates, Coinbase can offer better USDC lending yields, loopers can lever the spread, and Ethena gets deeper/cheaper funding than native DeFi alone. Aave mechanics, Coinbase distribution.”
Liberman added that the CLARITY Act makes this pivot highly valuable. If lawmakers restrict passive USDC rewards, Ethena gives Coinbase a way to route users into real borrow demand rather than simply paying them for holding USDC.
He added:
“Coinbase needs products where yield is tied to explicit activity: lending, collateral, liquidity, or platform usage. Ethena gives them a way to route yield-seeking USDC users into real borrow demand, rather than just paying rewards for holding USDC.”

The new “Coinbase problem” for banks
While banks might feel protected by Section 404’s ban on passive interest, the Ethena loophole presents a new and immediate threat.
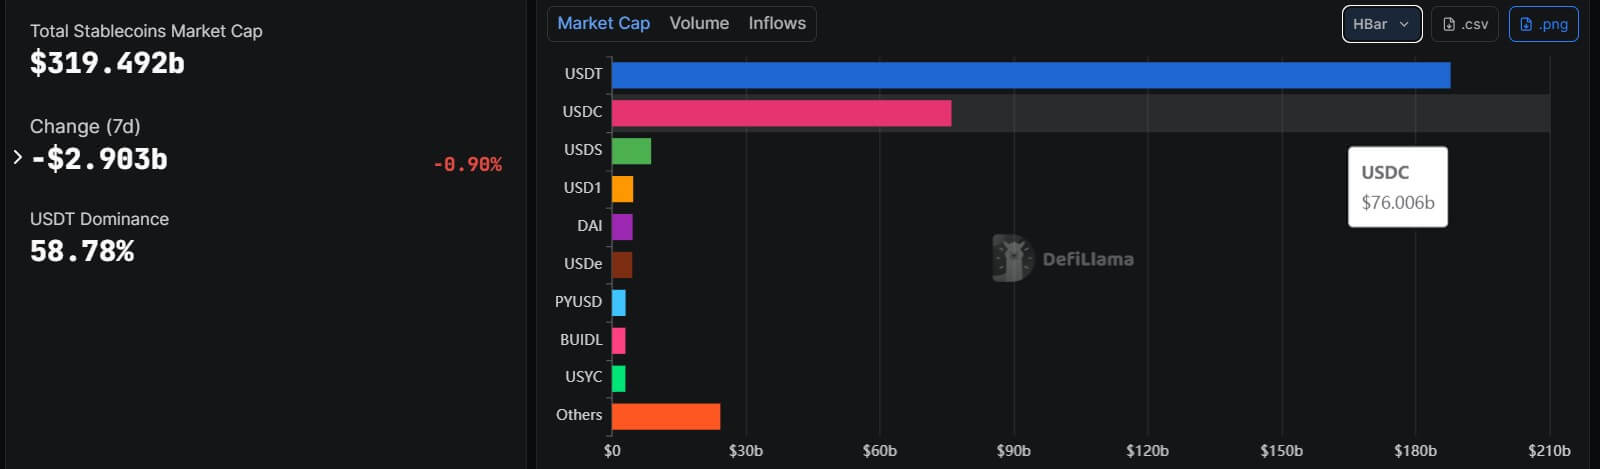
Stablecoins have outgrown their origins as a niche settlement layer. The total stablecoin market sits at roughly $320 billion, with USDC at about $76 billion and Ethena's USDe around $4.5 billion.
Because Circle backs USDC with highly liquid cash and cash-equivalent assets with monthly attestations, Coinbase’s strategy uses USDC as the trusted settlement asset, while Ethena supplies the yield-bearing synthetic-dollar layer.
Admittedly, an immediate systemic bank run is unlikely. US commercial bank deposits stood at roughly $19.3 trillion in late May 2026, and money-market fund assets sat at $7.78 trillion. Even if Coinbase converted its entire $19 billion USDC balance, it would be a drop in the bucket compared to the broader banking system.
However, the real danger to banks is marginal pricing pressure.
If mobile, yield-sensitive retail customers and institutional treasuries realize they can seamlessly access ~3.8% APY through an activity-based Ethena strategy inside a Coinbase app, they will inevitably move their idle cash.
To stem the outflow, traditional banks may be forced to raise their own historically low deposit rates, which directly eats into their net interest margins. Notably, US savings accounts yield just 0.38%, and interest checking accounts scrape the bottom at 0.07%.
Moreover, Tom Wan, head of research at Entropy Advisors, pointed out that the Coinbase and Ethena integration could be the beginning of an institutional synergy that bypasses traditional banking entirely.
Wan notes Ethena can leverage institutional lending via Coinbase Asset Management, utilize Coinbase Custody, and use USDC as a liquid stablecoin backing. In the future, Coinbase could become a primary basis trade venue and allocate backing assets to lending protocols like Aave on Base to grow USDe as a dominant savings product.
The post Banks pushed Congress to kill stablecoin yield with CLARITY Act – Coinbase may have found the loophole appeared first on CryptoSlate.
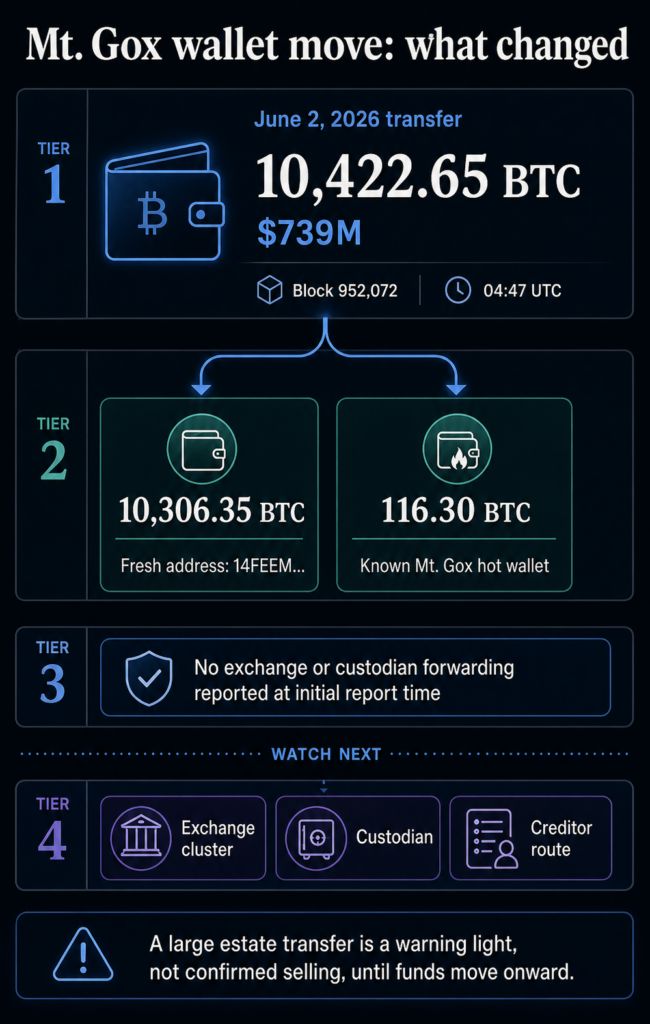
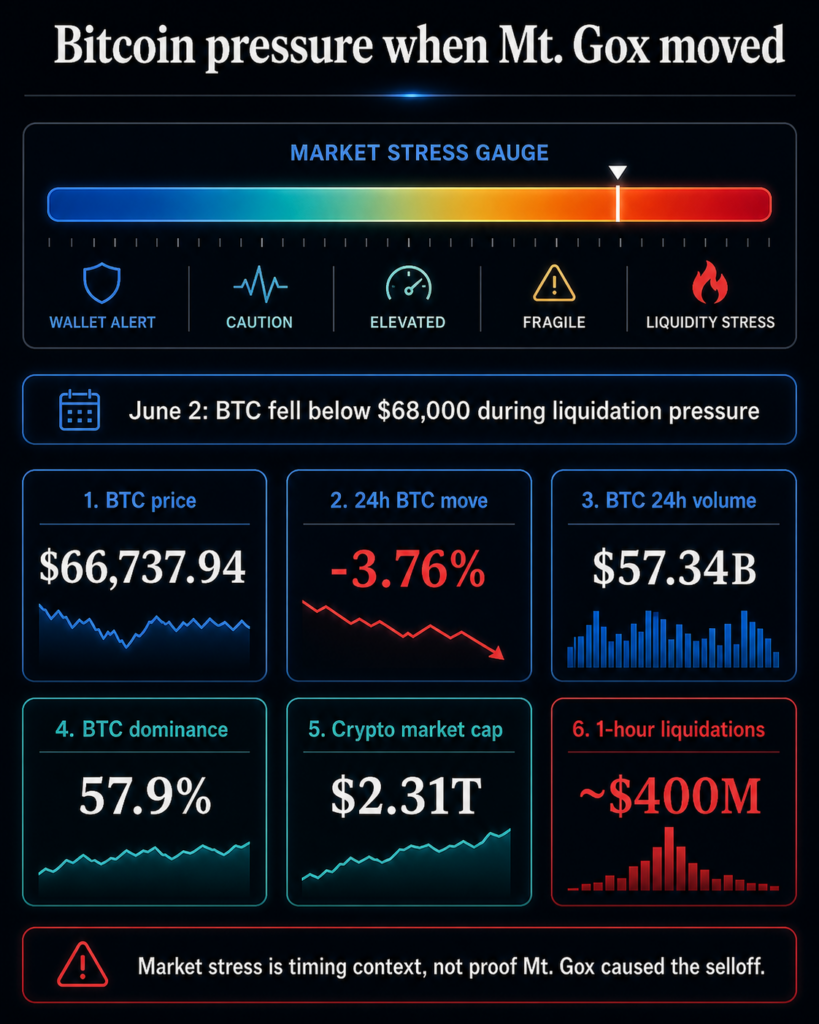
Mt. Gox moved more than $700 million worth of Bitcoin while the market was already under stress, giving traders a familiar reason to ask whether old bankruptcy coins are moving closer to new supply.
The estate-linked wallets moved 10,422 BTC on June 2, worth roughly $739 million at the time of the transfer. Most of the stack, 10,306 BTC, went to a fresh address beginning with 14FEEM, while 116 BTC moved to a known Mt. Gox hot wallet.
The transfer occurred in Bitcoin block 952,072 at around 04:47 UTC, months before the current repayment deadline of Oct. 31, 2026.
So, it seems that Mt. Gox is active again, while immediate sell pressure remains unconfirmed, as no onward movement to a custodian, exchange, liquidity provider, or creditor distribution venue was reported at the time of the initial report.
The transfer revived an old supply problem
Mt. Gox remains one of Bitcoin‘s longest-running market overhangs because the estate still controls a large BTC balance more than a decade after the exchange collapsed. The June 2 transfer carried weight because it reminded the market that a known pool of old coins can still move with little warning.
The remaining estate balance was reported at roughly 34,504 BTC after the move. The visible activity is split across multiple transfers rather than a single visible sell order, and direct exchange-bound flow remains unconfirmed.
Still, a balance of that size is enough to keep traders watching every large estate-linked movement for signs of distribution.
The official trustee process gives that concern a concrete calendar. In an Oct. 27, 2025 notice, the Mt. Gox Rehabilitation Trustee extended the deadline for several repayment categories from Oct. 31, 2025 to Oct. 31, 2026 with court permission.

The notice said many creditors still had not received repayments because some had not completed required procedures or because processing issues remained.
That language points to a drawn-out process rather than a single clean market event. It also explains why wallet movement can be meaningful before immediate selling is visible.
Coins may move for internal wallet management, repayment preparation, custody setup, or liquidity routing before any creditor receives BTC or any exchange sees flow.
| Signal | What it shows | What remains unconfirmed |
|---|---|---|
| 10,422.65 BTC moved on June 2 | Mt. Gox-linked wallets became active again with a large transfer | A confirmed market sale |
| 10,306.35 BTC went to a fresh 14FEEM address | Most coins shifted to a new destination | Whether the destination is an exchange, custodian, or creditor endpoint |
| 116.30 BTC went to a known hot wallet | A smaller slice moved through familiar estate infrastructure | Whether the larger stack is being sold immediately |
| Repayment deadline sits at Oct. 31, 2026 | The bankruptcy process remains active | Whether remaining BTC will be distributed in one batch or staggered flows |
The next signal is onward routing
The practical threshold is simple: the transfer becomes stronger evidence of sell pressure when the coins move from estate-linked wallets toward venues that can distribute, custody, or sell them.
That is why Arkham's Mt. Gox entity page carries more weight than the headline dollar value alone. On-chain labels, destination clustering, and counterparties can indicate whether the fresh address remains part of the estate's wallet structure or begins interacting with exchange and repayment infrastructure.
The distinction is practical. A large internal transfer can still shake sentiment because it changes market expectations for the timeline. But a wallet reorganization is different from coins arriving at a venue where they can be sold or handed to creditors.

The former is a warning light. The latter is closer to actual supply.
The June 2 routing, as reported at the initial deadline, sat on the warning-light side of that line. The coins had moved, the process was live, and the repayment deadline was visible.
Yet the key downstream signal was still absent: no confirmed move into a custodian or exchange had been shown in the initial reporting.
The market may care about the transfer even without proof of sale, especially during a weak trading window. It still needs proof of onward routing before treating the move as immediate supply hitting Bitcoin order books.
The timing made the movement feel larger. On June 2, Bitcoin fell more than 5% below $68,000, and nearly $400 million in leveraged positions were liquidated within an hour.

That backdrop carries weight because leveraged markets can turn a wallet alert into a sentiment catalyst.
The evidence supports timing, not causation. The Mt. Gox transfer occurred around 04:47 UTC, while the liquidation story describes same-day market pressure.
The cleaner conclusion is that Bitcoin was already vulnerable, and the Mt. Gox movement added another reason for traders to think about supply.
CryptoSlate market data on June 3 showed BTC trading at $66,737, down 3.76% over 24 hours, with $57.34 billion in 24-hour volume.
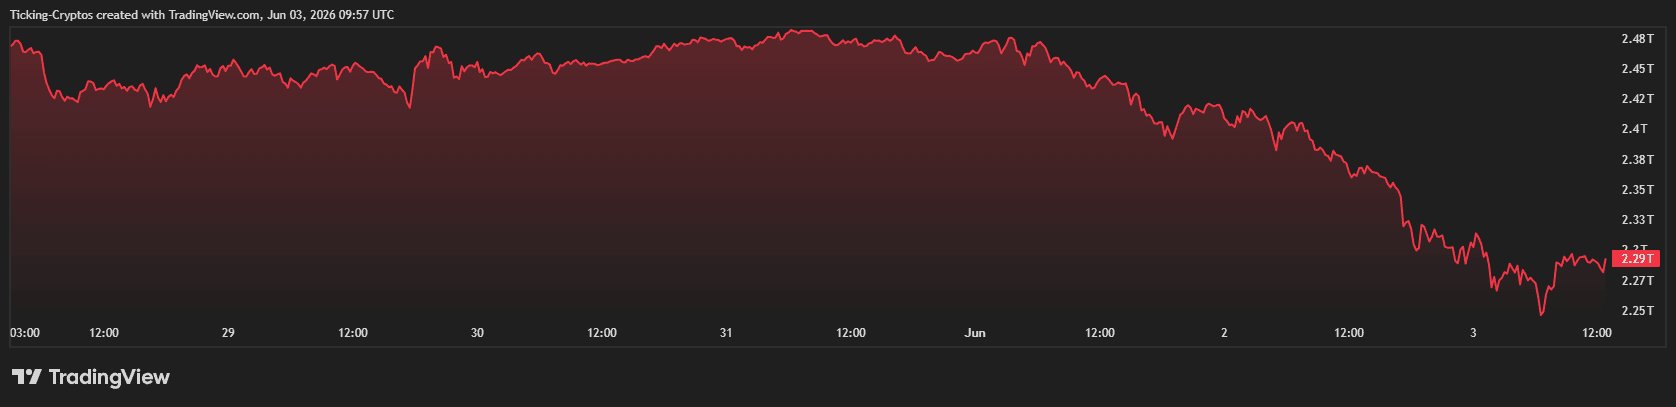
The broader CryptoSlate coin rankings showed a $2.3 trillion crypto market, $137 billion in 24-hour volume, and 57.9% Bitcoin dominance.
Those numbers cut in both directions. Bitcoin is deep enough that a staggered repayment process does not automatically overwhelm the market.
At the same time, a high-leverage selloff can make any large potential supply source feel more urgent than it would during calmer trading.
That puts the focus on whether a measurable path has opened from the estate to liquid supply. As of the initial reports, that path had not been shown.

Mt. Gox is now a process overhang
CryptoSlate's prior Mt. Gox coverage framed the 2026 repayment extension as a shift from a single-date shock to a recurring process overhang. That remains the best way to read the June 2 movement.
The deadline tells traders when the estate process is supposed to finish. The wallets tell traders whether that process is moving. The exchange, custodian, liquidity provider, or creditor endpoints indicate to traders whether the movement is shifting toward market supply.
Until those later signals appear, the most defensible answer is restrained. The June 2 transfer showed that a bankruptcy estate still holding tens of thousands of BTC is active again, even as Bitcoin is under pressure.
It also left the most important question about sell pressure unanswered.
That distinction is what keeps the move from becoming either complacency or panic. Mt. Gox has enough BTC left to remain a meaningful watch item, and the repayment process has a live deadline.
But the market signal to watch is not the first move into a fresh wallet. It is whether funds move from that wallet toward an exchange, custodian, liquidity provider, or repayment route.
The post Mt. Gox-linked wallets moved 10,422 BTC, worth roughly $739 million as BTC price slides appeared first on CryptoSlate.
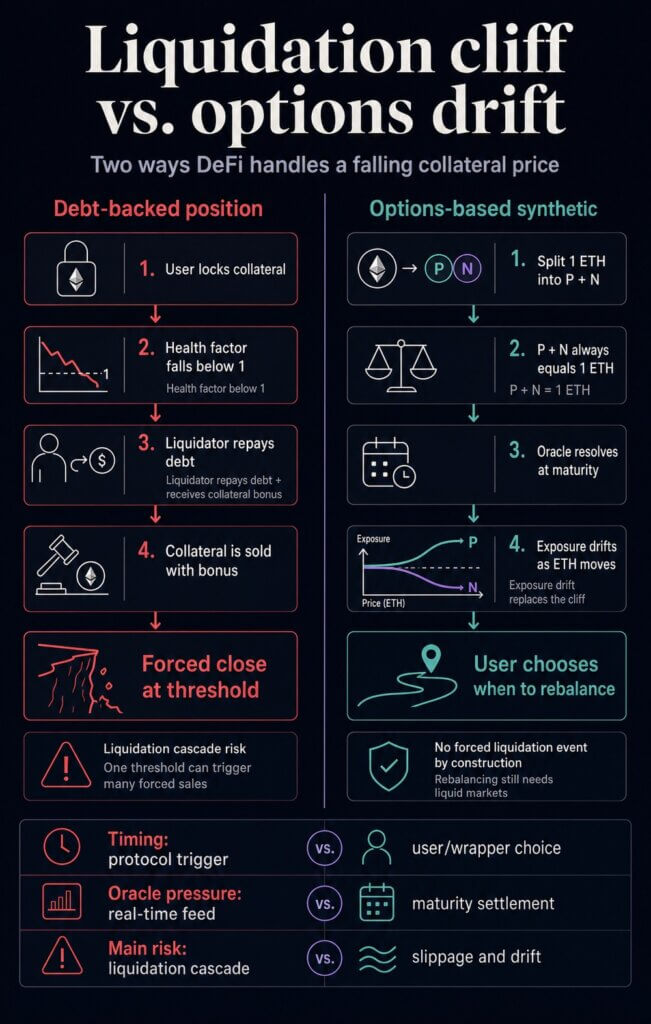
Vitalik Buterin is challenging one of DeFi's most familiar safety mechanisms: the automatic liquidation that closes a debt-backed position when collateral falls below the required backing for the loan.
In a June 1 Ethereum Research post, Buterin proposed building synthetic, index-tracking assets on top of options, with collateralized debt removed from the base design.
The idea would remove the hard liquidation trigger from the base design and replace it with a slower form of risk: the user's exposure drifts away from the target unless the position is rebalanced.
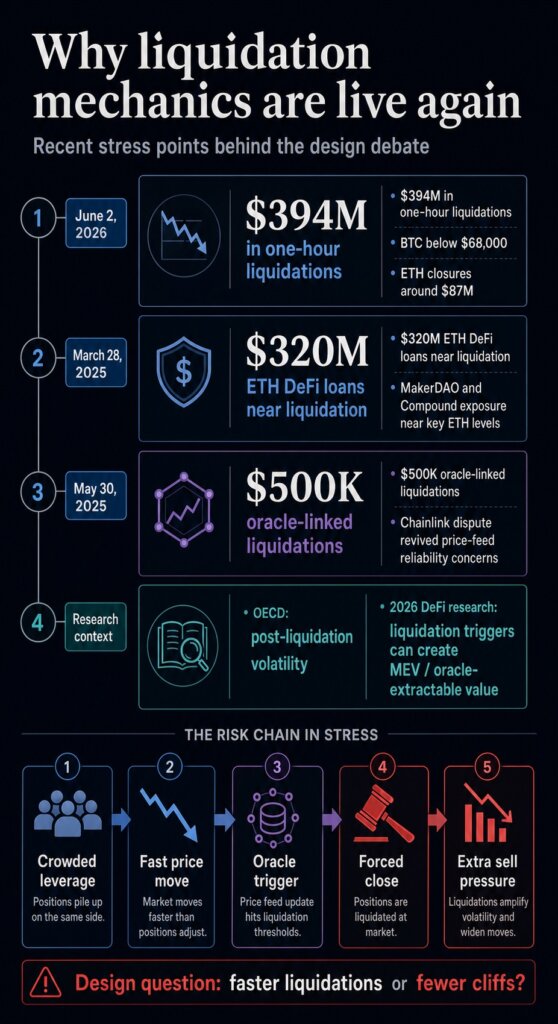
That distinction is important because the old mechanism is still showing up in market stress. Bitcoin‘s fall below $68,000 triggered about $394 million in one-hour liquidations on June 2, including roughly $87 million in ETH positions, as leveraged bets were force-closed across the market.
The flash crash came one day after Buterin's post and serves as a market reminder: when price moves hit crowded leverage, automatic closures can turn a drop into a wider market event.
The proposal is research-stage architecture: a design argument separate from any protocol launch, Ethereum roadmap commitment, or direct replacement for Aave, Maker, or existing stablecoins. It shifts the focus from collateral buffers and faster price feeds to a more fundamental design choice: whether instant liquidation should remain DeFi's central means of surviving a crash.
Why the safety switch can amplify stress
Most DeFi lending systems are built around the same basic problem. A user locks in collateral, borrows against it, and must keep the position above a required safety level.
In Aave's borrowing documentation, that level is expressed through a health factor. When it falls below 1, the position can be liquidated: a liquidator repays debt on the borrower's behalf and receives collateral plus a bonus.
That structure protects the protocol's solvency, but it also concentrates action at the worst possible moment. If ETH or another collateral asset falls fast enough, users do not choose when to sell. The system chooses for them.
Liquidators compete to close eligible positions, and the collateral can be pushed into markets already short on liquidity.
The record supports that concern. An OECD working paper on DeFi liquidations found a positive relationship between liquidation activity and post-liquidation price volatility across major decentralized exchange pools.
The paper also emphasized that liquidators rely on available liquidity during stress, which means the mechanism designed to restore balance can run into the same liquidity shortage as everyone else.
CryptoSlate has previously covered the operational version of that risk. A 2025 Chainlink-related oracle dispute led to more than $500,000 in liquidations on Euler Finance and revived questions about how protocols should interpret pricing data in illiquid markets.

Separately, a 2025 ETH decline put nearly $320 million in Ethereum-based DeFi loans within 20% of liquidation, with MakerDAO and Compound exposure concentrated near key price levels.
The common thread is the cliff. DeFi needs a way to handle undercollateralized positions, but the current method often waits until a number is breached and then requires immediate action.
That creates a crowded moment for borrowers, liquidators, oracle feeds, and liquidity providers simultaneously. It also gives sophisticated actors a clear trigger to watch, because the protocol rule announces when a position becomes profitable to close.
For users, the practical consequence is straightforward. A liquidation system can protect a lending pool while still giving the individual borrower the worst possible execution window.
The user may have intended to keep long-term ETH exposure, hedge a cash need, or wait out a sharp wick. Once the threshold is crossed, the system's priority becomes solvency, and the user's timing preference disappears.
How options turn a cliff into drift
Buterin's alternative starts by changing the primitive. A position that can become undercollateralized gives way to a split ETH claim: the proposal divides 1 ETH into two option-like assets, called P and N, tied to a price index, strike price, and maturity date.
At maturity, an oracle resolves the index value and determines how much of the ETH claim each side receives.
The key property is simple: P and N always add back up to 1 ETH. Because the system is dividing a fixed ETH claim between two sides, it can avoid seizing collateral from a borrower to close a deficit.
In Buterin's framing, the design removes the liquidation event by construction.
For a user trying to hold synthetic dollar exposure, the practical experience differs from a debt-backed stablecoin. In the debt model, a user can appear fully hedged until the collateral threshold is breached, at which point the position is force-closed.
In the options model, the holder avoids the sudden close, but the position can gradually stop behaving as the user intended.
Buterin's example uses a user who wants some level of dollar exposure while ETH is trading around $2,500. The user could buy a deep option tied to a lower strike, such as $1,500, and rotate into lower-strike options if ETH falls toward the original strike.
If the user does not rebalance, the exposure drifts. The user keeps a claim, but the hedge becomes less exact.
That is the central tradeoff. The design keeps risk in the system, and changes who controls the timing and what form the damage takes.
Liquidation-based systems outsource the decision to a protocol rule and liquidator bots. The options-based design pushes more of that decision toward users, wrappers, market makers, or automated rebalancing systems.
Buterin also acknowledged a limit for stablecoin use. A medium amount of annualized drift may be acceptable for someone seeking price stability relative to future expenses.
It is much less useful for an accounting stablecoin, where users want to treat the token as a dollar for payments, bookkeeping, or tax reporting.
The oracle tradeoff
The oracle argument may be the proposal's most important protocol-design claim.
Debt-backed liquidations depend on real-time price feeds. A protocol needs a binding price quickly enough to determine when a position is unsafe and to allow liquidators to act.
Buterin argues that this constraint makes real-time oracles hard to secure because they rely on automated actors watching live signals and leave little room for slower dispute resolution.
Options move the critical oracle call to maturity. Oracle risk remains, but the time pressure changes.
If a system can wait to resolve a contract, it can use slower, more contestable mechanisms, including prediction-market-style approaches or expensive fallback oracles that would be impractical for instant liquidation.
That is why the proposal is more than a stablecoin tweak. It shifts DeFi's risk architecture away from a single live price that can trigger irreversible action.
Recent research on liquidation dynamics in DeFi shows why that surface is central: liquidation mechanics can create incentives around price manipulation, MEV, and oracle-extractable value when a profitable closure depends on a market price crossing a trigger.
The benefit still depends on implementation. A wrapper that automatically rebalances for users could make the product easier to hold, but it could also recreate visible timing rules that sophisticated traders can anticipate.
A purely local user agent could hide some timing choices, but would raise its own usability and execution questions. An onchain DAO wrapper would need deterministic rules and deep markets to avoid becoming another predictable target.
Slow oracles help only if the rest of the design avoids forcing the same problem elsewhere. That is the tension Buterin's post leaves for builders.
A slower oracle can give a system more time to settle disputed information, but users still need markets deep enough to rotate exposure and rules strong enough to avoid turning every rebalance into an exploitable signal.
The comparison with prior oracle disputes is useful here because the risk arises when bad data meets a rule that must act immediately.
The options design reduces the need for that instant decision, while builders still have to decide who watches the index, who provides liquidity, and who absorbs losses when the market moves faster than the hedge.
What developers still have to prove
The next test is whether the market structure around Buterin's idea can be competitive with the debt systems it would challenge.
The proposal itself flags slippage as a major risk. Rebalancing through ordinary automated market makers could be expensive, especially if users need to rotate option exposure repeatedly during volatile periods.
Buterin suggested that rebalancing might need a different market structure, closer to patient one-sided market making than an instant sell.
That requirement is the adoption test. If users avoid liquidation but bleed too much value through drift, slippage, or operational complexity, the model becomes elegant research rather than useful DeFi infrastructure.
If builders can make rebalancing cheap and less exposed to attack, the idea could become a serious alternative for users who want price stability without signing up for a liquidation cliff.
The same test applies to stablecoin framing. The proposal is most defensible when described as a way to hold a stability-oriented exposure or personal hedge.
It becomes weaker if marketed as a simple dollar replacement. A token that drifts away from its target and needs periodic rotation is a different user promise from a redeemable dollar, an overcollateralized stablecoin, or a conventional CDP-backed synthetic.
For Ethereum, the significance is that one of its most influential designers is treating liquidation as an architectural choice rather than an unavoidable fact of DeFi.
The next signal is whether any protocol team turns the options model into a tested wrapper, simulation, or live market with sufficient liquidity to demonstrate the trade-off in practice.
Until then, the proposal is best read as a direct challenge to DeFi's crash mechanics: the industry can keep trying to make liquidations faster and better collateralized, or it can test designs built without sudden forced sales.
The post Vitalik wants DeFi price crashes to stop triggering automatic liquidations appeared first on CryptoSlate.
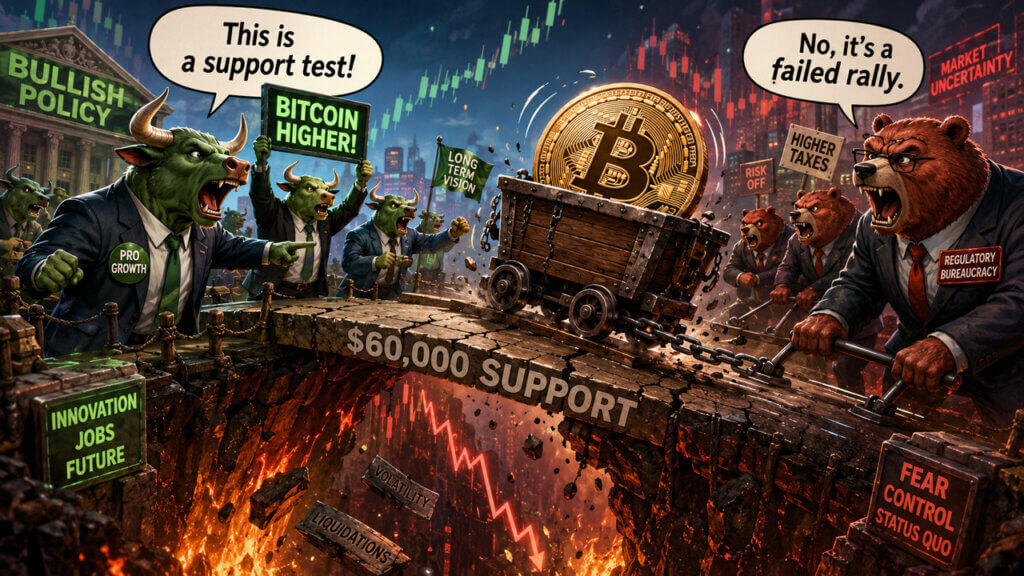
Bitcoin is back at a crossroads it has navigated multiple times in prior cycles, and this may be where the real test begins in this cycle.
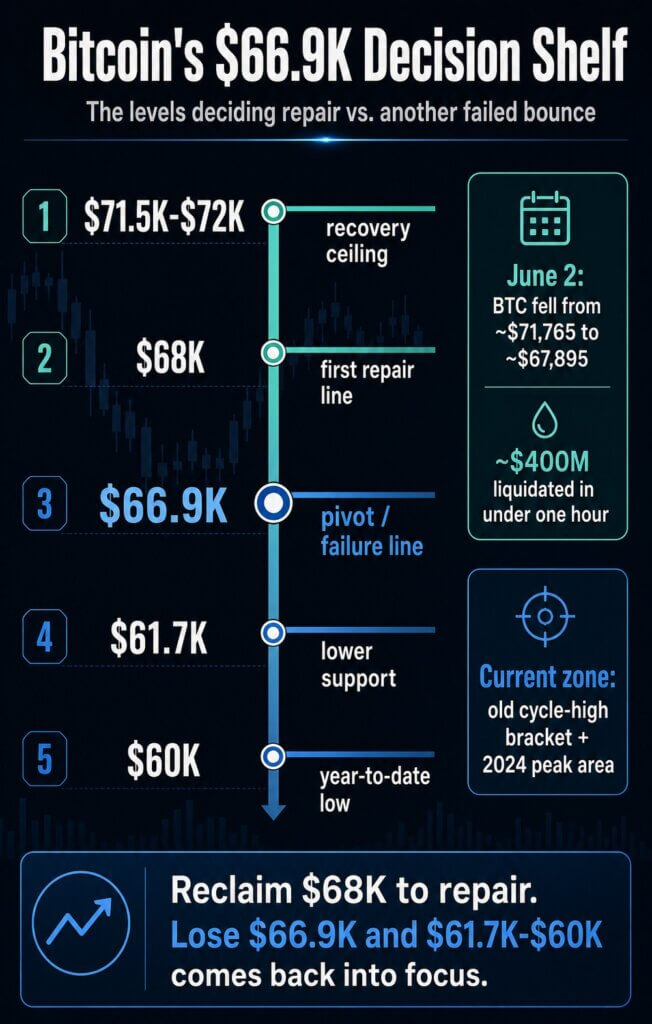
After weeks of trying to turn the low-$80,000s into a new recovery zone, BTC has returned to the $66,900-$68,000 area, the same band I have used through several recent CryptoSlate pieces as the difference between repair and renewed downside.
A June 2 break below $68,000 sent Bitcoin from roughly $71,765 to $67,895 and triggered about $400 million in liquidations in under an hour.
By Wednesday morning in London, CryptoSlate's Bitcoin price page showed BTC near $66,942, putting spot price directly inside the shelf.
The price point overlaps with Bitcoin's old cycle highs, the 2024 peak zone, and the failure line from the earlier channel work.
We must now ask ourselves: did Bitcoin revisit a known support shelf before rebounding, or has the market confirmed that the prior bounce failed?
The old map is back in control
My level map always depended on acceptance across sessions over one candle.
In March, my CryptoSlate analysis treated the $68,000-$71,500 area as the range Bitcoin needed to hold and identified $66,900 as the failure line below it.
The idea was that BTC had avoided a larger drop only if it could keep trading above the lower edge and rebuild toward the top of the range.
That same framework came back after the late-March drop toward $65,000. At the time, the recovery case needed Bitcoin to reclaim $68,000 first, then prove it could work back toward the $71,500-$72,000 ceiling.
If it failed there, $66,900 stayed active as the line that kept the downside path open.
That is where the market is again. The June 2 liquidation move dragged price back into the bracket that has separated recoveries from failed bounces throughout the recent channel work.
In practical terms, $68,000 has become the first line Bitcoin has to reclaim to show that the flush was a support test, not the start of another leg lower.
The upper side of the map is just as important. I have repeatedly treated $71,500 as the area where recovery attempts had to prove themselves.
My March 5 analysis warned that repeated rejection there raised the risk of rotation down through $68,000 and $66,900 toward the low-$60,000s.
That sequence gives the current market a cleaner signal. A wick into the band can be noise; a failure to reclaim the band changes behavior.
For bulls, the job is to turn $68,000 back into traded acceptance. For bears, the confirmation is sustained weakness through $66,900.
Until one side gets that, the market remains in the middle of an unresolved argument.

What actually panned out
The useful part of revisiting these levels is the sequence of decision points, more than perfect tick-by-tick precision.
On that test, the roadmap held up better than it may have felt in real time. Bitcoin held around $70,000 in early March, delaying the $49,000 path as the market tested the upper range again.
The follow-up asked whether the downside call had been invalidated. The market then failed to cleanly clear the upper side of the range.
The repeated inability to turn $71,500-$72,000 into support kept the old risk path alive.
The next phase looked better for bulls. In early May, Bitcoin was back in the low-$80,000s, with the market asking whether a new 2026 high was coming.
That was the V-shaped move from the late-March lows: roughly $65,000 at the end of March, back toward the low-$80,000s by early May.
Even that upside framework kept the $65,000-$70,000 area as the first support zone if risk appetite faded.
The move back to this band follows the first major support region that was supposed to come into play if the low-$80,000s could not hold.
The current price action has therefore answered part of the earlier question. The market delayed the deep-bear case, but it also failed to establish enough acceptance above $71,500-$72,000 to retire it.
The rally stretched higher, lost altitude, and returned to the same shelf that was marked as the next test if momentum broke.
That is the point of looking backward here. The prior framework only had to tell readers which levels would decide whether strength was real.
So far, Bitcoin has respected the order of the map: first the ceiling near $71,500-$72,000, then the repair line at $68,000, and now the $66,900 edge.
Macro did not give Bitcoin much cover
The chart levels gained force as the macro backdrop stopped helping.
In mid-May, I linked Bitcoin's retreat from the low-$80,000s to Treasury yields, ETF-flow dependence, oil, the dollar, and broader risk appetite.
The June breakdown is happening during a jobs-data week, with traders watching labor-market data, Fed expectations, and long-end yields alongside crypto-native positioning.
CryptoSlate's June jobs-week setup noted that Bitcoin was facing JOLTS and payrolls with the 10-year Treasury yield near 4.6%, the 30-year above 5%, ETF outflow pressure, and a market still pricing a Fed hold.

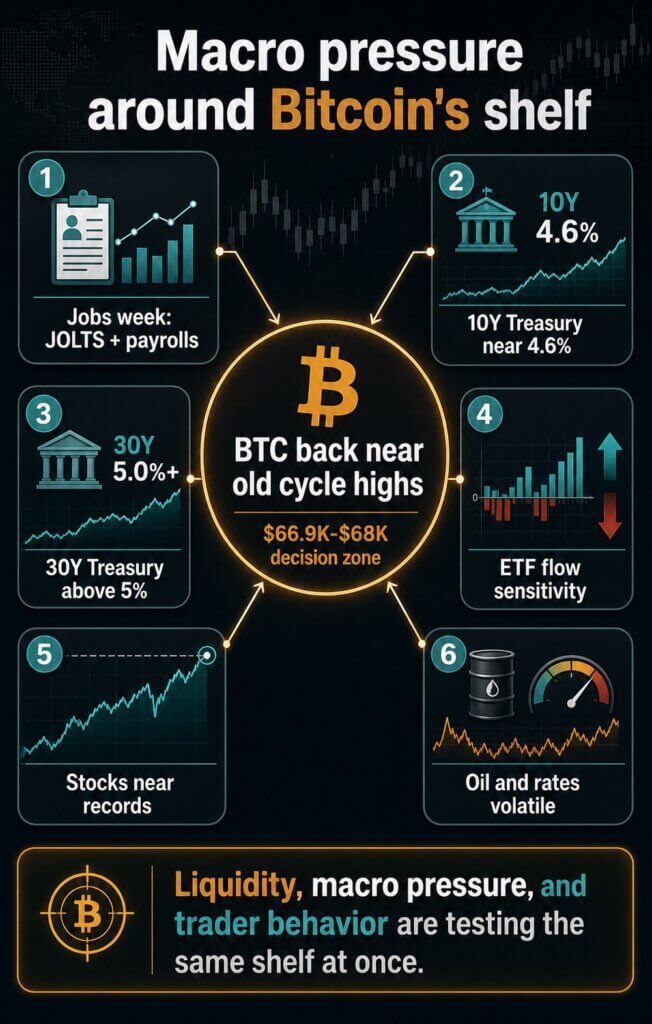
That gives the current level a macro catalyst. It is a support zone being tested as the bond market continues to pressure long-duration risk assets.
The tension is sharper because equities have held up better. US stocks are near record highs even as oil-driven volatility and rate pressure remained in the background.
Bitcoin, by contrast, has given back the early-May rally and moved back toward the same old all-time-high bracket that once defined the upper end of prior cycles.
That divergence changes the tone of the level test. If stocks are still near records while Bitcoin is losing the low-$80,000s and revisiting old-cycle highs, the weakness points to more than a broad risk-off washout.
It points back to crypto-specific pressure, ETF flow sensitivity, and the failure to build acceptance above the recovery ceiling.
Bitcoin is weakening into a known technical shelf without an obvious macro relief valve.
If yields keep pushing higher or ETF flows fail to absorb the selling, the chart levels become harder to defend. The same price shelf is being tested by liquidity, macro pressure, and trader behavior at once.
The next test is acceptance over one wick
This is why $66,900 and $68,000 carry more weight than the exact low from a single overnight move.
If Bitcoin can defend the $66,900 area and reclaim $68,000, the first repair target is acceptance back inside the prior range, followed by another attempt to rebuild toward $71,500-$72,000.
That would leave the liquidation shock on the chart, but it would show that the market treated the move as a flush into support rather than a confirmed breakdown.
If Bitcoin loses that defense, the lower path becomes the cleaner signal. A March CryptoSlate overlap piece directly connected $66,900 resistance or failure to a possible move toward $61,700, and the broader roadmap keeps the yearly low near $60,000 in focus, with that level beneath.
From the current $67,000 area, that is close enough to keep in view while still requiring BTC to lose the shelf first.
That's why I tend to work with roadmaps rather than predictions.
$71,500-$72,000 was the zone that would have shown recovery strength. $68,000 was the first repair line. $66,900 was the lower edge. $61,700-$60,000 was the next area if the edge failed.
Bitcoin is now sitting on that edge again.
The market can answer without drama. A sustained reclaim of $68,000 would put the range-repair case back on the table.
Failure to hold $66,900 would bring the return to $61,700 and the yearly low near $60,000 into question. Until one of those happens, the most honest conclusion is that Bitcoin has returned to the exact bracket that was supposed to decide whether the prior bounce was real.
The post Bitcoin returns to the price that capped 2021, defined 2024, and now tests the rally again appeared first on CryptoSlate.
A House of Lords committee has told the Bank of England to rethink stablecoin caps before the UK's regime is finalized.
The Financial Services Regulation Committee published its report, Stablecoins: waiting for regulation, on June 3, turning a technical debate over reserve design into a test of whether the UK can build a pound-denominated stablecoin market without making it uneconomic from the start.
The pressure point is the design of the safeguards. The committee supports 1:1 backing and accepts that stablecoins can create risks around financial stability, consumer protection, and illicit finance.
Its challenge is more specific: the Bank's proposed safeguards may be calibrated for a market that does not yet exist in the UK.
Two measures sit at the center of that critique. The Bank has proposed temporary per-coin holding limits of £20,000 for individuals and £10 million for businesses.
It has also proposed requiring systemic sterling stablecoin issuers to keep at least 40% of backing assets as deposits at the Bank of England that do not earn interest.
The Lords report says those choices could shape whether a GBP stablecoin market develops at all. If a pound stablecoin cannot be held in useful amounts or generate enough reserve income to support the issuer's business, the UK could end up with clear rules, but few firms willing to build the products those rules are meant to govern.
The Rules Under Pressure
The Bank of England's November 2025 consultation proposed a split backing model for systemic sterling stablecoins.
At least 40% of backing assets would sit as deposits at the Bank, while up to 60% could be held in short-term sterling-denominated UK government debt.
The Bank's case is that central-bank deposits provide immediate liquidity if holders seek large redemptions in a short period. In its consultation, it said the threshold aligned with estimates of possible short-term redemption requests drawn from stress events in traditional and crypto markets.
The 60% government-debt allowance was meant to improve issuer viability compared with an earlier model that would have placed all backing assets in unremunerated central-bank deposits.
That compromise is now under pressure. The Lords committee concluded that remuneration and liquidity requirements for backing assets could have a significant effect on issuer viability and UK competitiveness.
It urged the Bank to consider the impact of requiring a proportion of unremunerated assets and to reconsider whether deposits held at the Bank should be remunerated at Bank Rate.
The committee also pushed the Bank toward a more flexible approach to backing-asset composition. It said the Bank should be open to a principles-based and less prescriptive model, with requirements adjusted as market behavior and risks become clearer.
The same logic applies to holding limits. The Bank's proposal would cap each individual's holdings of a systemic stablecoin at £20,000 per coin and each business's holdings at £10 million, with possible exemptions for businesses that need higher balances in normal operations.
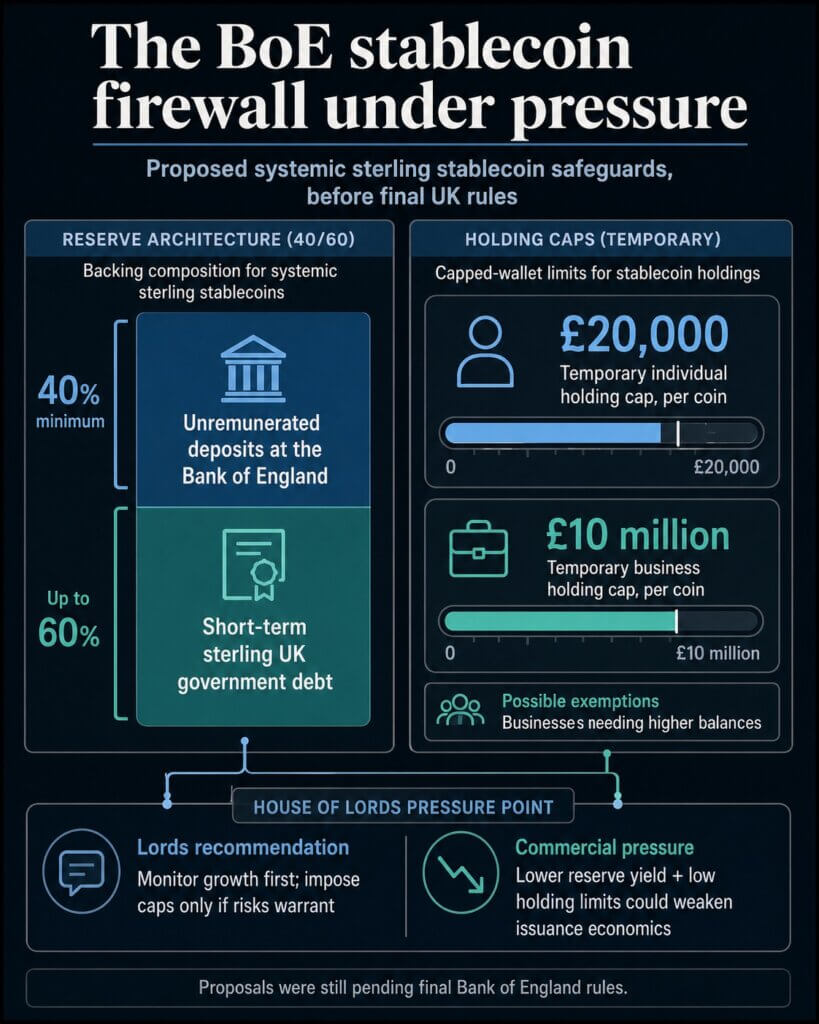
In a November news release, the Bank framed those limits as temporary tools to protect access to credit while the financial system adapts to new forms of money.
The committee's recommendation was sharper. Given the early stage of the GBP stablecoin market, it said the Bank should monitor growth and impose holding limits only if financial stability risks clearly warrant them.
If limits become necessary, the committee said the Bank should consult to ensure they can be implemented in a practical way that still meets the Bank's objectives.
Why The Bank Is Cautious
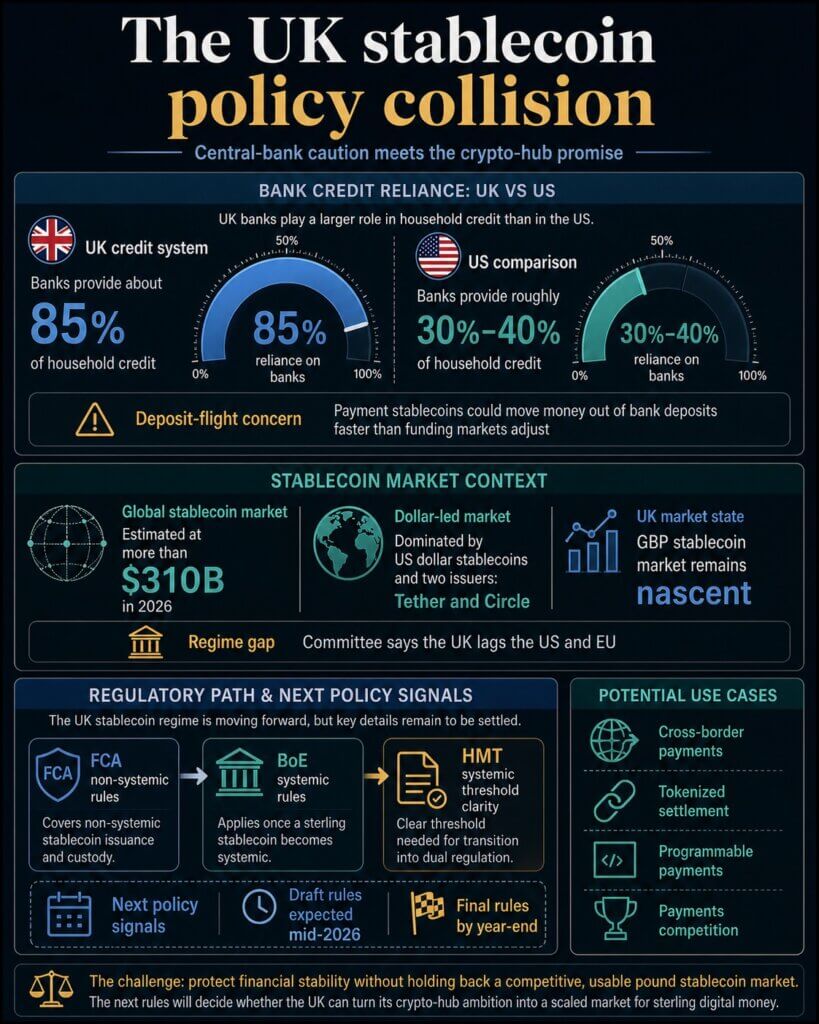
The Bank's concern goes beyond competition with banks. In the UK, bank deposits do more work inside the credit system than they do in some other major markets.
In oral evidence to the committee in March, Sarah Breeden, the Bank's deputy governor for financial stability, said banks provide about 85% of household credit in the UK, compared with roughly 30% to 40% in the US.
Her argument was that if deposits moved rapidly into payment stablecoins and that funding was not replaced, the result could be a drop in credit for households and businesses.
That is the financial-stability case for a circuit breaker. The Bank is designing for a future in which stablecoins are widely used as money for everyday payments, beyond their current use in crypto trading.
If adoption moved quickly through social media platforms, e-commerce networks, wallets, or automated payment tools, the Bank worries that money could leave deposits faster than banks and funding markets could adjust.
The committee accepts that risk. Its report says stablecoins can pose challenges around financial stability, illicit finance, and consumer protection.
It also welcomes 1:1 backing, audited reserves, disclosure, statutory trust protections, and the proposed Bank backstop lending facility for systemic issuers.
The disagreement is about timing and prescription. Lawmakers are asking whether the Bank should impose caps and reserve economics before there is enough evidence about how a pound stablecoin market would behave.
A protective rulebook could reduce the chance of a disorderly shift out of bank deposits. It could also make the regulated version of the product less attractive than offshore, dollar-denominated, or non-systemic alternatives.
The stakes are higher because the report describes the UK stablecoin market as nascent while the global market is already large and dollar-led.
It says the global stablecoin market was estimated at more than $310 billion in 2026, overwhelmingly dominated by US dollar stablecoins and two issuers, Tether and Circle.
For the UK, that creates a strategic problem. A sterling stablecoin market could support cross-border payments, tokenized settlement, programmable payments, and competition in payments.
It could also reduce the risk that UK users and businesses default to dollar stablecoins because pound alternatives never get enough regulatory clarity or commercial scale.
The committee says the UK is already lagging the US and EU in developing a stablecoin regime, though it says the country is now moving in the right direction.
The FCA's stablecoin issuance and crypto custody consultation covers the non-systemic side of the regime, while the Bank's rules apply once a sterling stablecoin becomes systemic.
The transition between those regimes remains one of the areas issuers need to understand before they can build durable business plans.


The Next Signal Is The Draft Rulebook
The timing makes the Lords report more than a retrospective critique. Breeden told the committee in March that the Bank expected draft rules in the middle of 2026, final rules by year-end, and applications from stablecoin issuers by the end of the year.
That means the next policy document will show whether the Bank treats the report as a reason to change the design or as a challenge to explain the existing model more clearly.
The signals to watch are specific: whether per-holder caps remain, whether the Bank shifts toward aggregate issuance guardrails or monitoring triggers, whether the 40% deposit share is adjusted, and whether any Bank deposits receive remuneration.
Rewards will count, too. The committee noted relatively little demand for issuers to pay interest on stablecoins, but said the treatment of rewards, rebates, or other incentives could affect the creation of a GBP stablecoin market and the UK's international competitiveness.
That question connects stablecoin rules to the broader payments market, where card networks and financial apps already compete through reward structures.
The report also asks for more clarity from HM Treasury on when a stablecoin becomes systemic. That threshold is central for issuers because it determines when a firm moves from the FCA-only track into dual regulation by the Bank and FCA.
If the transition is too uncertain, scaling may become a risk in itself.
CryptoSlate has already covered adjacent UK payment infrastructure moves, including Revolut's pound stablecoin sandbox trial and the Bank's 24/7 settlement plans.
The Lords report moves the debate to a different point: whether the UK's stablecoin rulebook will let a sterling market become commercially meaningful once tokenized payments enter the system.
The Bank is still finalizing the regime, and the committee is still asking for financial-stability protections. The new pressure is for the Bank to show that its safeguards will not stop a pound stablecoin market before it has a chance to form.
That is the live test for the UK's crypto-hub promise. The next draft rules will show whether the Bank's stablecoin firewall is a temporary guardrail, a redesign in progress, or a cost issuers decide the pound market cannot absorb.
The post Bank of England stablecoin caps may choke the UK’s pound-token market before launch appeared first on CryptoSlate.
CryptoTicker.io
The cryptocurrency market in June 2026 is experiencing a structural shift. Speculative hype is clearing out, making way for institutional capital, real-world asset (RWA) tokenization, and decentralized artificial intelligence infrastructure.
With major regulatory frameworks like the CLARITY Act shaping asset definitions and central banks adjusting interest rates, smart capital is moving into protocols that generate protocol revenue and real-world utility. For investors looking to build a balanced portfolio this month, identifying leading assets within specific sectors is crucial.
Below is an analysis of the top 5 altcoins to buy in June 2026, categorized by market sector, focusing on project fundamentals and technical growth targets.
1. Solana (SOL) – The High-Performance Layer-1 Leader
Project Ecosystem Overview
Solana continues to solidify its position as the premier Layer-1 blockchain for retail liquidity, decentralized finance (DeFi), and high-throughput consumer applications. Moving past the initial memecoin cycles, Solana's monolithic infrastructure has proven highly efficient for executing rapid transactions without relying on fragmented Layer-2 networks.
The network's execution speeds and low transaction fees have attracted major traditional fintech integrations. Platforms like PayPal and Visa utilize Solana's infrastructure for stablecoin settlements, securing its status as a major alternative to Ethereum’s settlement dominance.
Growth Catalysts and Target for 2026
- Institutional Traction: Continuous spot ETF developments and corporate stablecoin deployments.
- Firedancer Mainnet Optimization: The full implementation of the Firedancer validator client provides unprecedented network reliability and throughput capabilities.
- Growth Target: Market analysts project SOL to break past long-term resistance walls, targeting a mid-to-long-term valuation of $180 to $220 as institutional capital flows accelerate.
2. Bittensor (TAO) – The Decentralized AI Compute Infrastructure
Project Ecosystem Overview
The convergence of artificial intelligence and blockchain technology is a defining market narrative in 2026. Bittensor sits at the absolute forefront of this sector. TAO operates as a decentralized, open-source network that incentivizes machine learning models to collaborate and train across a global distributed node architecture.
Following its successful network upgrades, including the expansion of subnet capacities from 128 to 256, Bittensor has proven that distributed networks can train large-scale language models effectively. This makes it an essential infrastructure asset for developers seeking permissionless access to raw computing power and AI intelligence.
Growth Catalysts and Target for 2026
- Supply Scarcity: The long-term macroeconomic effects of its late 2025 halving event are constricting daily token issuance.
- Corporate Staking: Major institutional custody platforms like BitGo have established enterprise-grade staking infrastructure for TAO.
- Growth Target: As tech platforms transition away from centralized cloud monopolies, TAO aims to reclaim psychological resistance zones, targeting $450 to $500 by late 2026.
3. Ondo Finance (ONDO) – The Institutional RWA Pioneer
Project Ecosystem Overview
Real-world asset (RWA) tokenization has grown from a proof-of-concept into a multi-billion dollar sector. Ondo Finance is a market leader in this category, bridging the gap between traditional finance (TradFi) and on-chain liquidity. Ondo specializes in bringing institutional-grade financial products, such as US Treasuries and corporate bonds, onto public blockchains like Ethereum and Solana.
By embedding strict automated compliance directly into its smart contracts, Ondo allows global institutional investors to access yield-bearing tokenized products safely. Its structural integration with clearing giants and Tier-1 liquidity providers places it far ahead of competing asset tokenization protocols.
Growth Catalysts and Target for 2026
- Macroeconomic Shift: Declining interest rates push on-chain investors toward stable, institutional yield products.
- Banking Rails Integration: Broadening cross-chain deployments across major public and institutional private ledgers.
- Growth Target: Backed by structural inflows into tokenized securities, ONDO targets a price target expansion toward $2.50 to $3.10 as total value locked (TVL) hits new milestones.
4. Near Protocol (NEAR) – The Foundational Layer for AI Agents
Project Ecosystem Overview
Near Protocol has evolved significantly from a standard smart contract platform into a core foundational layer for cross-chain "user intents" and autonomous AI agents. In 2026, decentralized applications rely heavily on AI agents executing transactions autonomously on behalf of users. Near provides the cryptographic framework necessary for these agents to interact across multiple chains securely.
Through its advanced chain abstraction technology, Near eliminates the friction of managing multiple wallets, gas fees, and network bridges. This enables seamless interactions where software can transact instantly behind a unified interface.
Growth Catalysts and Target for 2026
- AI Agent Web Integration: Infrastructure partnerships with web infrastructure providers to automate micro-payments for data and API processing.
- Mass Consumer Adoption: Positioned as the primary abstract layer for Web3 consumer applications.
- Growth Target: Driven by the narrative of autonomous on-chain commerce, NEAR's valuation targets a structural move toward $8.50 to $11.00.
5. Base (Ecosystem Tracking Token / Base Infrastructure)
Project Ecosystem Overview
While Base does not feature a native network token, it dominates the Ethereum Layer-2 ecosystem, capturing over 60% of total L2 network revenues according to on-chain analytics. Developed by Coinbase, Base serves as the primary gateway for retail capital entering Web3.
The ecosystem's primary value capture mechanisms flow directly back to the wider Ethereum L2 infrastructure layer and decentralized protocols built natively on the network (such as high-performance automated market makers and decentralized derivatives exchanges like Hyperliquid). It serves as an essential index for measuring the health of retail on-chain activity.
Growth Catalysts and Target for 2026
- Smart Wallet Proliferation: Coinbase’s native smart wallets allow millions of mainstream users to interact with applications smoothly using passkeys.
- DeFi Capital Concentration: Base remains the most profitable execution environment for decentralized applications on Ethereum.
- Growth Target: For investors tracking this ecosystem, native building blocks within the L2 layer present clear asymmetric upside, with core ecosystem application tokens targeting a 3x to 5x growth multiple over the summer trading cycle.
Altcoin Market Allocation Comparison
To help visualize how to diversify into these sectors, investors can analyze how these top projects balance different market opportunities:
| Asset Name | Core Sector Category | Primary Utility Metric | Institutional Support |
|---|---|---|---|
| Solana (SOL) | Layer-1 Blockchain | High-speed payment settlements & Retail DeFi | High (Spot ETFs & Fintech partnerships) |
| Bittensor (TAO) | Artificial Intelligence (AI) | Incentivized distributed compute power | Medium-High (Crypto-native funds & Staking) |
| Ondo Finance (ONDO) | Real-World Assets (RWA) | Tokenized treasury bonds & Institutional yield | Very High (TradFi integrations) |
| Near Protocol (NEAR) | AI Infrastructure / L1 | Chain abstraction & AI agent interactions | Medium (Developer ecosystem) |
| Base Infrastructure | Layer-2 (L2) Ecosystem | Smart wallet retail onramps & Scalable DeFi | High (Coinbase ecosystem support) |
Summary: Building a Strategic Crypto Portfolio for June 2026
Success in the current crypto market requires a clear shift away from speculative assets toward platforms that generate verifiable economic value. Allocating capital across dominant Layer-1 chains like Solana, decentralized AI frameworks like Bittensor, and institutional infrastructure like Ondo Finance provides balanced exposure to the most resilient narratives of this market cycle.
The boundary between traditional payment networks and decentralized infrastructure is dissolving. Global payment leaders Visa, Mastercard, and Stripe are in advanced stages of launching a collaborative, institutional-grade stablecoin platform.
The joint initiative aims to standardize digital currency routing across legacy financial systems and capture the rapidly expanding market share of programmable, dollar-pegged digital assets.
The Push for Native Onchain Settlement
The cooperative project signals a collective strategic pivot. Stablecoin networks processed an unprecedented $33 trillion in total transaction volume last year, pushing past the cumulative settlement figures of standard credit card processors. Rather than competing against decentralized protocols externally, the payments triumvirate is building a native layer to absorb and route these token flows directly through their own ledgers.
The platform's primary utility centers on institutional settlement, business-to-business (B2B) cross-border routing, and programmatic liquidity provisioning. According to industry insiders, top-tier U.S. cryptocurrency exchange Coinbase is also positioned to participate in the joint launch, adding a deep consumer liquidity foundation to the network.
Integrating Bridge Infrastructure for Merchant Scale
The move leverages major corporate infrastructure plays executed recently. Stripe’s ongoing integration of its $1.1 billion acquisition, Bridge—a leading stablecoin orchestration network—supplies the technological backbone for the system. Concurrently, Visa has expanded its pilot programs with Bridge to enable programmatic, stablecoin-backed card issuance across 18 countries, targeting growth to over 100 countries.
The architecture addresses three core corporate payment bottlenecks:
- Instant Currency Authorization: Automated conversion mechanisms that allow digital asset balances to clear instantly at terminal points-of-sale without price slippage.
- Direct Acquiring Settling: Enabling international merchants to receive business revenues directly in major fiat-backed tokens like USDC or EURC, completely bypassing traditional banking intermediaries.
- Low-Cost B2B Remittances: Providing international supply chains with cross-border rails that cut standard transaction fees from the standard 1.5% to 3% down to sub-0.1% levels.
By pooling their technical reach, the participants create an insulated payment system that prevents capital flight from legacy banking systems toward entirely non-intermediated, decentralized payment architectures.
The digital asset market is experiencing heavy selling pressure today. The total cryptocurrency market capitalization has fallen to $2.29 trillion, marking a significant 8.7% decline over the past week.
As liquidations mount across major exchanges, traders are assessing whether this downward trajectory is a temporary correction or the start of a prolonged bearish phase.
Why is the Crypto Market Crashing Today?
The current market downturn stems from a combination of macroeconomic data releases, shifting monetary policy expectations, and heavy derivatives liquidations.
1. Macroeconomic Pressures and Interest Rate Outlook
Risk assets, including cryptocurrencies, are reacting to recent economic data indicating sticky inflation. This has led market participants to price in a "higher-for-longer" interest rate environment by global central banks. When interest rates remain elevated, capital typically rotates out of speculative assets like cryptocurrencies and into yields guaranteed by government bonds.
2. Cascading Derivatives Liquidations
The breach of key technical support levels for Bitcoin triggered an automated wave of long liquidations. According to data tracking platforms like Coinglass, hundreds of millions of dollars in leveraged bullish positions were wiped out within a 24-hour window. This forced selling accelerated the downward momentum across all major altcoins.
3. Institutional Capital Outflows
Data from institutional fund managers reveals a slowdown in net inflows into spot Bitcoin and Ethereum ETFs. A multi-day streak of net outflows indicates that institutional appetite has cooled off temporarily, reducing the baseline buying pressure required to sustain higher price levels.
Top Cryptocurrencies Price Analysis
Large-cap digital assets are flashing red, with layer-1 protocols suffering the sharpest intraday losses.
Bitcoin (BTC) Price Update
$Bitcoin is currently trading at $66,600, reflecting a 3% drop over the last 24 hours. BTC failed to sustain its position above the $68,000 psychological threshold. The immediate horizontal support now sits at $65,000. If buyers fail to defend this zone, a deeper retest of the $62,000 macro level is likely.
Ethereum (ETH) Price Update
$Ethereum has underperformed Bitcoin today, dropping 5% in the last 24 hours to trade at $1,880. The asset has broken below its short-term moving averages. Analysts monitor the $1,800 support level closely, as breaking below it could invalidate the current medium-term bullish structure.
Solana (SOL) Price Update
$Solana has matched Ethereum's downside, falling 5% over the past 24 hours to sit at $75.00. Despite strong network activity, SOL remains highly sensitive to broader market liquidity drains. Resistance is now firmly established at $82.00, while structural support rests near $70.00.
Ripple (XRP) Price Update
$XRP has shown relative resilience compared to its peers, down just 1.5% in the last 24 hours to trade at $1.23. Ongoing regulatory developments and liquidity patterns unique to the asset have decoupled its short-term price action slightly from the broader market dump, though it remains capped by overhead resistance at $1.30.
Market Outlook
The crypto market structure is currently undergoing a leverage flush. While the immediate intraday trend remains bearish, historical data shows that corrections of 10% to 15% are common structural occurrences during broader market cycles. Market participants are advised to monitor institutional fund flows and upcoming regulatory announcements, which can be tracked on major financial networks like Bloomberg.
Institutional Capital Rotates Out of Crypto Into Artificial Intelligence
$Bitcoin experienced a sharp 5.6% decline, dropping to the $67,400 mark following major corporate developments in the tech and traditional finance sectors. The market sell-off aligns with a massive capital allocation shift after Google launched an $80 billion artificial intelligence (AI) capital raise.
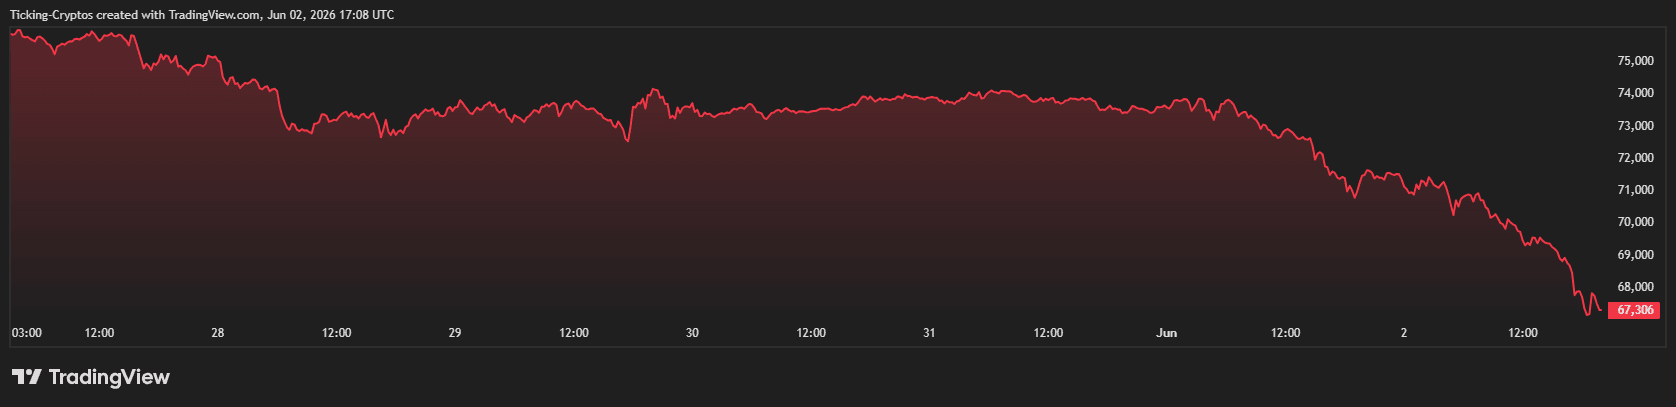
The initiative is notably backed by Warren Buffett's Berkshire Hathaway. This collaboration marks one of the largest institutional capital rotations from digital assets into AI infrastructure in recent financial history. Asset managers and corporate treasuries are rebalancing portfolios to fund these high-conviction AI initiatives, pulling liquidity directly out of the cryptocurrency ecosystem.
Crypto Treasury Inflows Collapse by 95% in May
The pressure on digital asset prices follows a broader liquidity drought that intensified over the last month. Data reveals that crypto treasury inflows collapsed by 95% throughout May, recording their lowest operational levels since 2024.
This drastic slowdown in capital entering crypto funds signaled an early warning of the institutional pivot. The sudden emergence of the mega-cap Google-Berkshire fund has accelerated this trend, leaving Bitcoin to test key support levels as buy-side pressure from corporate treasuries temporarily dries up.
Latest Cryptocurrency Prices
- Bitcoin ($BTC): $67,400 (-5.6%)
- Ethereum ($ETH): $1,920 (-3.2%)
- Solana ($SOL): $76.50 (-4.8%)
- $XRP: $1.23 (-4.7%)
Ethereum Fails to Hold $2,000 as Bitcoin Plummets
The cryptocurrency market is experiencing a severe intraday correction on June 2, 2026. Ethereum ($ETH) has officially breached its critical $2,000 psychological support zone, hitting an intraday low near $1,963. This macro markdown follows a systemic bleed-out led by Bitcoin ($BTC), which cascaded below the definitive $70,000 threshold for the first time in nearly two months.
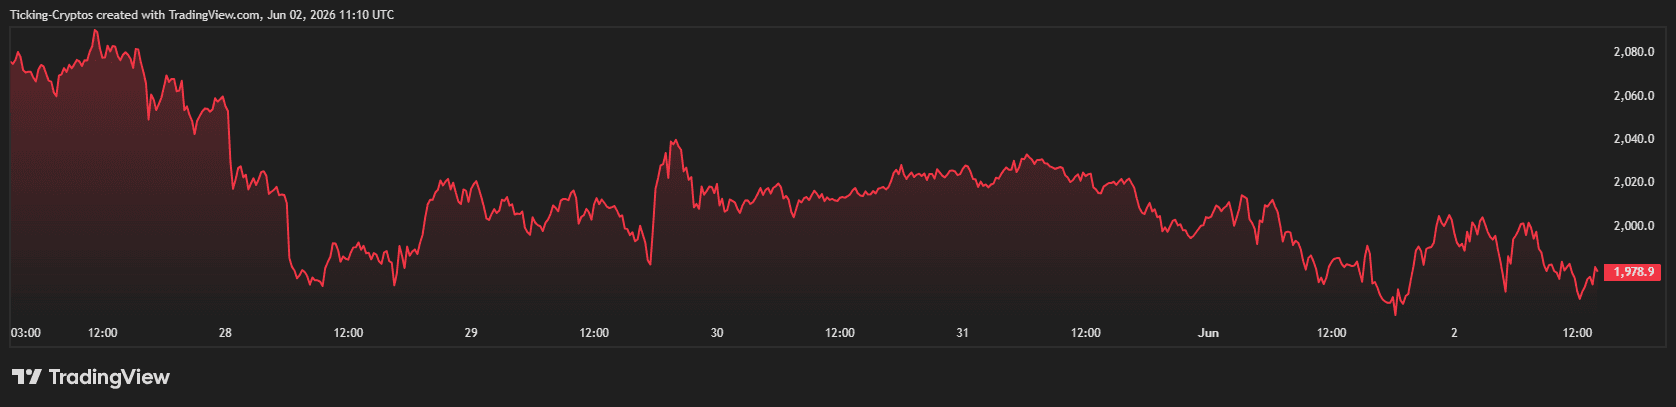
The downside momentum accelerated during early European trading hours, triggering automated stop-losses and derivative liquidations across major digital asset exchanges like Bitstamp and Binance.
Why is the Crypto Market Crashing Today?
The driving force behind Ethereum’s sudden decline is entirely tied to the negative structural shift in Bitcoin’s price action. The leading cryptocurrency faced dual headwinds that crushed buyer sentiment over the last 24 hours:
- Strategy’s Surprise Token Sale: MicroStrategy (disclosed on markets simply as Strategy) revealed its first $Bitcoin liquidation since late 2022. The corporate treasury sold $2.5 million worth of BTC to satisfy preferred shareholder dividends. While the nominal amount is small, the break in Michael Saylor's strict "HODL" playbook heavily spooked market participants.
- Massive ETF Outflows: According to institutional data compiled by Bloomberg, US spot Bitcoin ETFs are currently on a record-breaking 11-day streak of net capital outflows, with investors yanking nearly $3.5 billion from fund vehicles amid escalating geopolitical tensions between the US and Iran.
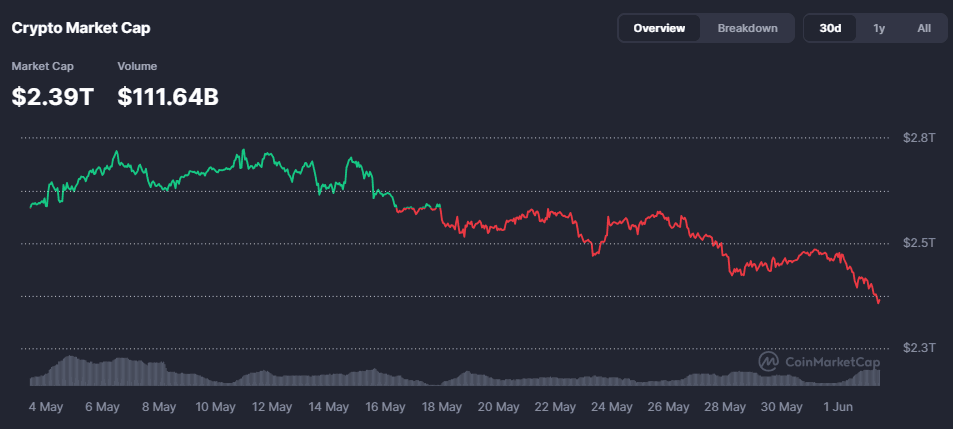
As capital aggressively rotated out of Bitcoin, the wider altcoin landscape collapsed. Since $Ethereum remains tightly correlated with BTC's market dominance, the drop under $70,000 forced an immediate technical breakdown in Ethereum.
Ethereum Technical Analysis: $1,800 is the Next Defensive Line
Looking at the 4-hour ETH/USD chart, the price action paints an intensely bearish picture for short-term holders.
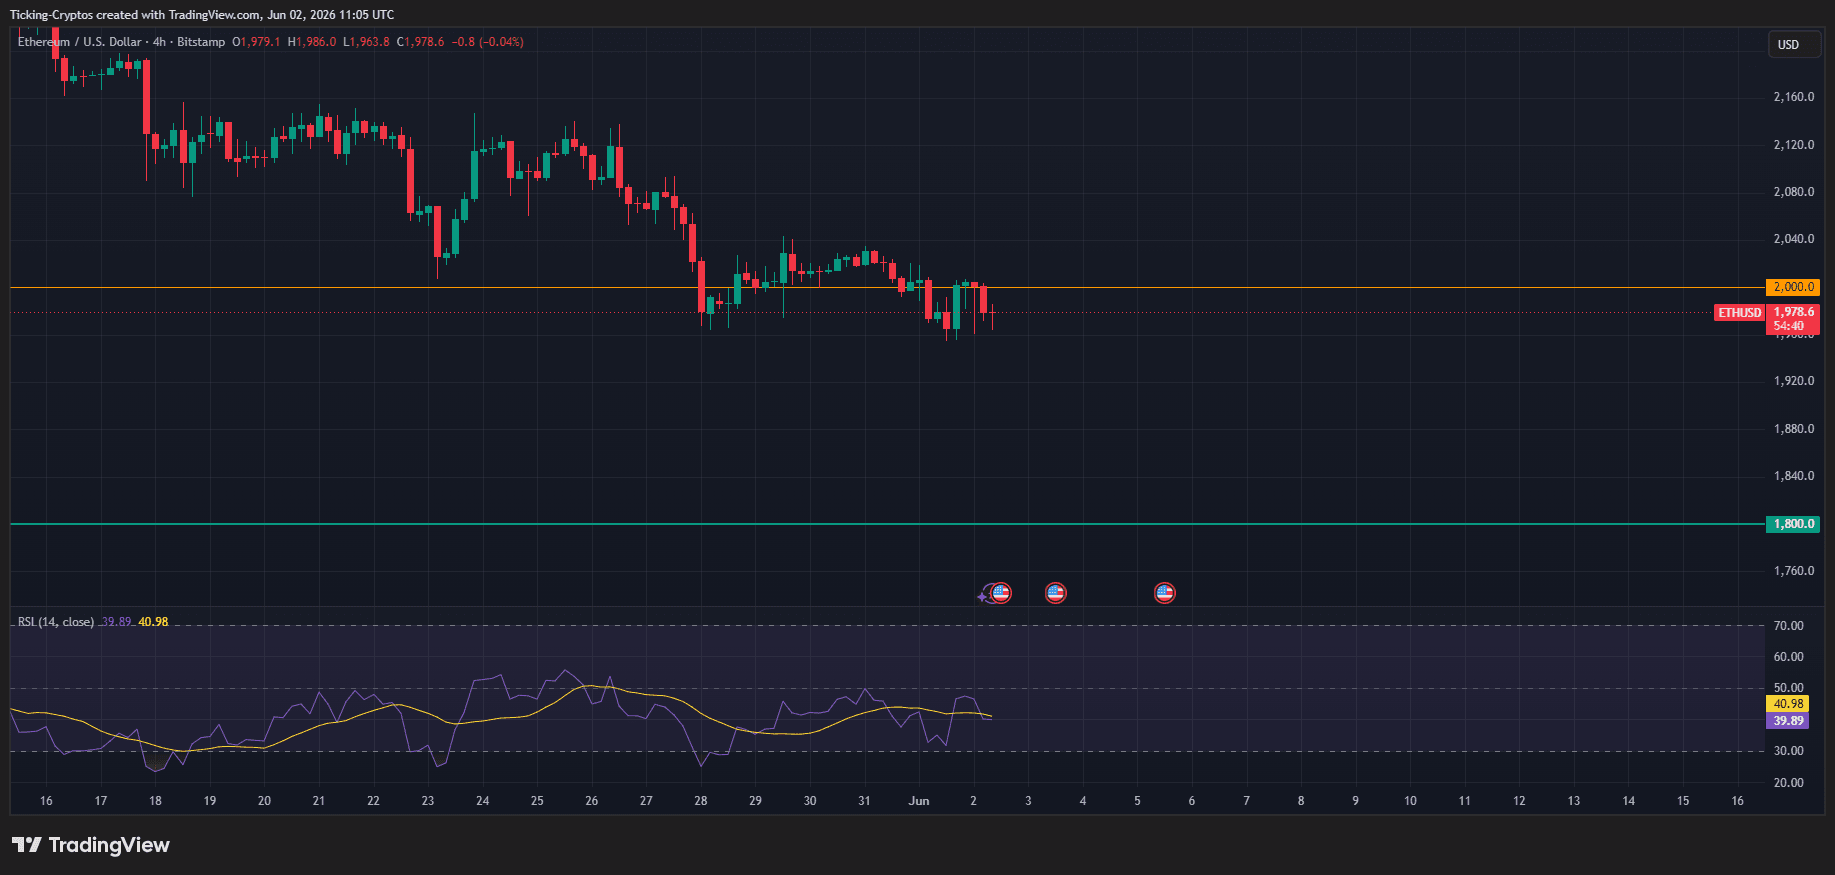
Key Technical Indicators to Watch:
- The $2,000 Pivot: The horizontal orange line represents the critical psychological barrier. By failing to sustain liquidity above $2,000, this zone has officially flipped from an active support floor into a major overhead resistance level.
- Relative Strength Index (RSI): The 14-period RSI has slid down to 39.89, signaling that while the market is approaching oversold conditions, there is still clear room for momentum-driven downside before a technical bounce can be sustained.
- The $1,800 Baseline: If the selling pressure intensifies, the primary macro support targeted by bears sits at the green horizontal line of $1,800.0. Traders should monitor daily and weekly closes closely; a structural failure to defend $1,800 could risk a deeper retest toward late 2024 macro lows.
Decrypt
A new study finds that leading AI models often encourage emotional attachment, portray themselves as human, and fail to maintain clear boundaries.
Founder Charles Hoskinson was brutally honest about the troubles the Cardano ecosystem could face as the market continues declining.
Holders will be able to do more with their gold, instantly spending Tether's tokenized version anywhere Visa is accepted.
Researchers found professors preferred AI-generated answers over those written by their peers, raising questions about the role of AI in professional education.
Until now, the only way to run Hermes was through a terminal—or one of several unofficial GUIs the community had cobbled together.
U.Today - IT, AI and Fintech Daily News for You Today
Canadian mining mogul and billionaire Frank Giustra has fiercely criticized Ark Invest CEO Cathie Wood over her remarkably high price targets for Bitcoin.
Mastercard has announced plans to expand its global network capabilities by introducing intraday, holiday, and weekend on-chain settlement with regulated stablecoins like Ripple's RLUSD.
A major digital asset policy push by the Blockchain Association is facing intense scrutiny after critics revealed that many of its "law enforcement" signatories are currently employed as industry insiders at major cryptocurrency firms.
An $18 million liquidation cascade flushes XRP to $1.22, exposing a 1,614% margin imbalance and putting the $0.95 floor in focus.
Michael Saylor defends Strategy's 843K BTC war chest with 'Back to Work' cry as Bitcoin flushes $792 million in leverage.
Blockonomi
Outpoll announced the global launch of its prediction market platform, a venue where users can trade on the outcomes of real-world events across politics, sports, crypto, and culture. The platform goes live as prediction markets have moved firmly into mainstream coverage, with the category reaching a multi-billion-dollar valuation tier and prices from these markets increasingly cited alongside polls and expert forecasts.
The Outpoll prediction market platform is built around a specific conviction: prediction markets have become a full trading category and deserve the same toolkit traders bring over from FX, crypto, and futures. Where the category historically optimized for casual participation, Outpoll’s prediction market platform treats the user as a trader from the first interaction.
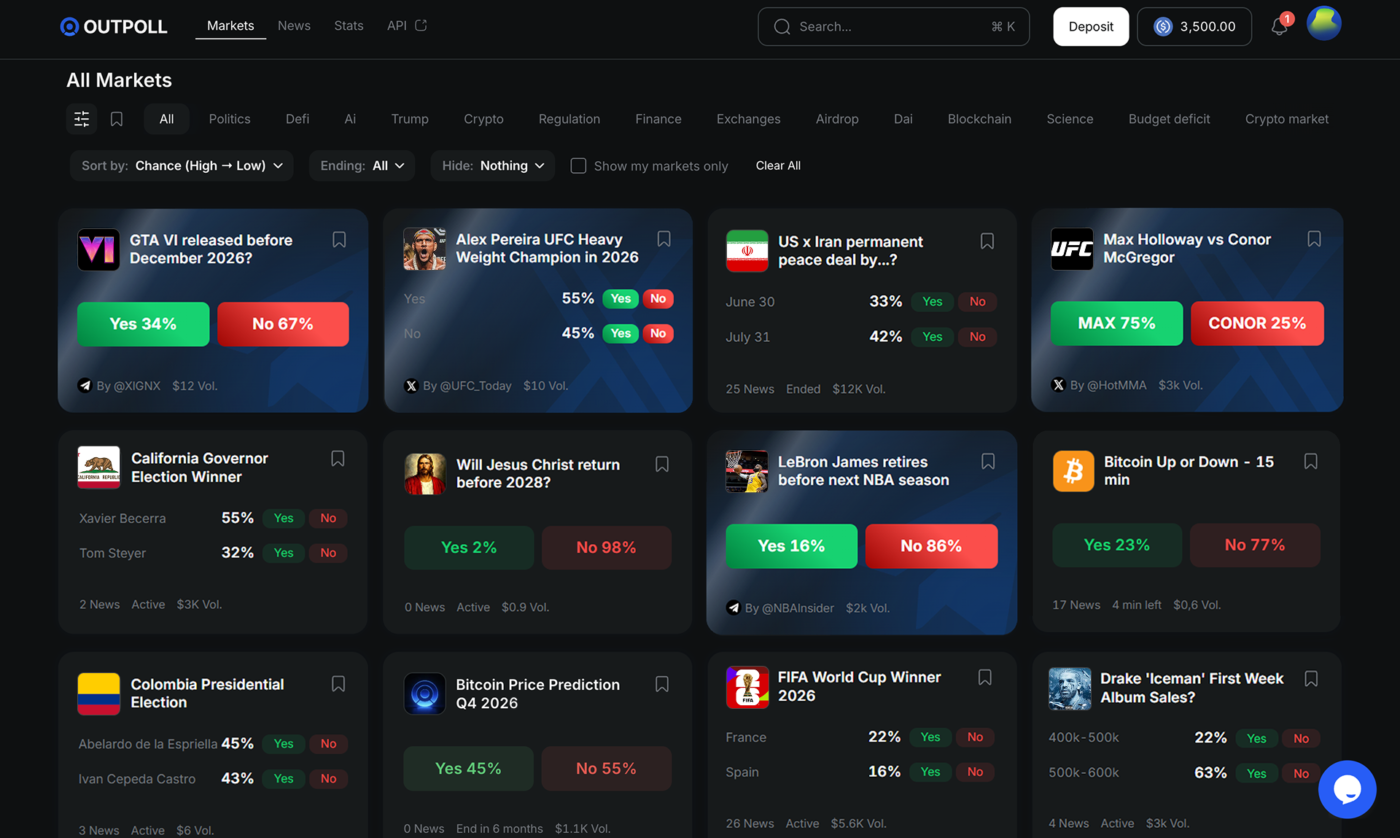
The launch product covers six pillars. Take-profit and stop-loss orders are available on open positions, alongside both limit and market order types – standard equipment on most trading venues, and overdue in the prediction market category. A full public REST and WebSocket API ships with the platform, with documented Python examples covering automation of protective orders, real-time price monitoring, and integration with external infrastructure. Creator-led markets allow approved community leaders and subject-matter experts to launch and curate their own markets with platform-level oversight on quality and resolution. An integrated news section sits directly inside the trading interface, removing the gap between consuming a relevant headline and acting on it. The platform launches with a native Android application available on Google Play, with an iOS version on the roadmap. Multi-currency deposits with in-app conversion to USDC remove first-time friction for users funding their accounts.
Markets on the Outpoll prediction market platform are fully collateralized at the contract level, with positions settled in USDC. Resolution rules and authoritative sources are published before each market opens, with platform-level oversight ensuring markets resolve as defined. Trading fees are approximately 0.1% per trade, in line with industry norms, with no additional charges in the order flow. Onboarding uses a risk-based, trigger-driven KYC approach managed by a dedicated compliance team. The platform also operates a cashback program in which active traders receive Outpoll Token rewards credited to their accounts.
Prediction markets earn their seat at the table by producing prices worth paying attention to. The Outpoll prediction market platform is built around the conviction that the more efficiently traders can express views, the more those prices are worth – and that the platforms which invest in serious tooling earliest will compound a structural advantage as the category matures.
About Outpoll
Outpoll is a global prediction market platform built for traders, forecasters, and audience-led communities. The platform is available globally with restrictions per Terms of Use. More information is available at outpoll.com, with full API reference at docs.outpoll.com/api and the Android application available on Google Play.
The post Outpoll Launches Global Prediction Market Platform Built Around Professional Trading Tools appeared first on Blockonomi.
TLDR:
- Variant Fund has closed a $222M fourth vehicle targeting early-stage crypto and AI startups globally.
- The firm’s thesis has evolved from digital ownership to a broader focus on user autonomy and agency.
- Recent portfolio bets include agentic memory, cryptographic location proofs, and AI artifact ownership.
- Crypto VC activity is rebounding, with a16z and Haun Ventures also closing large funds in 2026.
Variant Fund has raised a new $222 million vehicle targeting early-stage crypto and AI startups. The fund, announced on Wednesday, marks the firm’s fourth vehicle and reflects an evolved investment thesis centered on “autonomy.”
Founder Jesse Walden said the firm will lead at the earliest possible stage while participating in liquid and growth investments as projects mature.
The raise arrives amid a broader uptick in crypto venture activity, with The Block Pro data showing $1.63 billion in VC investments so far in Q2 2026.
Variant Reframes Its Thesis Around Autonomy
Variant’s updated thesis represents a natural extension of its founding principles. Since its inception, the firm has gravitated toward permissionless markets, open-source software, composability, and decentralization.
By 2020, those themes had coalesced into a focus on digital ownership — covering money, identity, data, and everyday products.
The firm now frames digital ownership as one pillar within a broader concept: autonomy. Walden described it as fundamentally about human agency — the degree to which users control their lives, assets, and identities.
“Autonomy is fundamentally about human agency: the degree to which users are in control of their lives, assets, and identities,” he wrote in an X post announcing the fund.
Walden was also careful to separate autonomy from mere automation. He noted that intelligent automation is a major technological frontier, but whether it enhances agency depends on who it ultimately serves.
“We distinguish autonomy from mere automation,” he wrote, adding that this distinction remains a guiding principle in evaluating which projects the firm pursues.
Past investments already reflect this principle. The portfolio has consistently backed projects where users hold meaningful control over the systems they participate in.
This includes category leaders in public blockchains, developer infrastructure, and consumer-facing applications such as Phantom and World Network.
Agentic and Permissionless Finance in Focus
Among the firm’s newest portfolio companies are several projects at the intersection of AI and blockchain. Walden outlined three in his announcement: “These include Honcho, a solution for self-custodial agentic memory; Octet, which lets applications cryptographically verify a user’s physical location as a building block of digital identity; and here.now, a ‘cloud for agents’ that enables ownership and composability of generated artifacts.”
Octet expands what users can verify about themselves on-chain, functioning as a building block for decentralized identity systems. here.now, meanwhile, targets the growing agentic computing space by giving users ownership over the outputs their AI agents generate.
Both projects align with Variant’s broader argument that the next phase of the internet will shift agency back toward users.
Walden summarized this outlook directly: “It’s likely that agentic intelligence and open, global financial rails will transform the structure of the internet: from one where users are often the product to one where they have unprecedented agency.”
The fundraise arrives alongside a broader resurgence in crypto venture capital. Competitor a16z recently announced a new $2.2 billion crypto fund, its fifth, while Haun Ventures closed a $1 billion vehicle targeting blockchain and AI projects.
Despite crypto VC activity remaining below the peak levels seen in 2022, recent quarters have shown a clear uptick in both deal volume and capital deployed.
The post Variant Fund Raises $222M to Back Crypto and AI Startups appeared first on Blockonomi.
The crypto market is moving through uneven momentum as different narratives compete for attention. Toncoin remains tied to its messaging-based ecosystem and steady network usage. Shiba Inu continues to rely on strong community participation and periodic meme-driven cycles across retail sentiment shifts. Bonk Coin tracks closely with Solana activity, often reacting quickly to broader ecosystem moves.
BlockDAG is drawing increased focus due to its now live Legacy Sale offering BDAG at a $0.00000044 price and a buyback program allowing holders to sell coins at $0.001 per coin. This is where the next big crypto discussion intensifies, as direction splits across utility, community, and sentiment-led assets. BlockDAG currently sits within a more active participation cycle compared to its peers.
1. BlockDAG: Live Legacy Sale Drives Buyback Program Access
The Legacy Sale is now live, allowing participants to access the Buyback Program through their dashboard after purchase by selecting “Sell Coins.”
There are two participation routes. Legacy Sale buyers can register their BDAG in the dashboard for the Buyback Program with no swap required. Existing holders may also participate by acquiring BDAG via BDAG SWAP at a discounted rate and sending tokens to the designated buyback wallet, subject to a daily submission cap per wallet.
Eligible BDAG submitted under the Buyback Program will be repurchased, with payments made in USDT to the registered wallet by November 1, 2026. Proof-of-funds wallets have also been added to the “Sell Your BDAG” page for added transparency.
The next big crypto discussion often centers on assets where timing and access shape participation more than passive holding. In this case, attention is focused on the narrowing buyback window and how quickly conditions are expected to change within a short timeframe.

Overall, BlockDAG is experiencing a moment where urgency is driven by a clearly defined buyback adjustment, making timing a critical variable for those engaging with the current participation opportunity.
2. Toncoin: Price Holds Near $2 Range Stability
Toncoin is a blockchain asset within The Open Network ecosystem, primarily used for payments, staking, and network-based transactions. It has maintained steady visibility due to ongoing ecosystem activity and integration with messaging-based applications.
Price movements have reflected broader market conditions, with periods of volatility followed by consolidation rather than sustained directional trends. Toncoin is currently trading in the approximate range of $2.00–$2.10, based on recent market data, with intraday fluctuations across exchanges.

In broader discussions around the next big crypto, Toncoin is often referenced due to its established position among large-cap assets and consistent network usage. Its price behavior continues to be shaped by market sentiment and overall crypto cycle movements rather than isolated momentum shifts.
3. Shiba Inu: Market Driven by Social Sentiment
Shiba Inu remains a widely recognized meme-based cryptocurrency, driven primarily by community participation, social sentiment, and periodic retail-driven interest. Within the next big crypto discussion, it is often referenced as an example of a sentiment-led asset that tends to move in short cycles rather than sustained trends.
Its ecosystem includes additional utility components, but price action continues to be influenced mainly by broader market mood and liquidity shifts across exchanges. Shiba Inu is currently trading around $0.0000055 USD, with minor fluctuations reflecting overall crypto market volatility. Despite cyclical movement patterns, it maintains consistent visibility due to its large holder base and active trading presence across major platforms.
4. Bonk Coin: Volatility Driven by Solana Sentiment
Bonk Coin operates within the Solana ecosystem as a meme-driven token influenced heavily by community activity and broader network sentiment. Price action tends to respond quickly to shifts in liquidity and trading interest across the ecosystem.
Bonk Coin is currently trading around $0.0000055 USD, with short-term movement driven largely by speculative flows and overall market conditions. Within the next big crypto discussion, it is often referenced as part of Solana’s meme segment that experiences sharp but sentiment-led price cycles rather than steady directional trends.

Its behavior remains closely tied to retail engagement patterns, where momentum builds and fades in line with broader crypto market risk appetite.
The Bottomline
Toncoin continues to trade near the $2 level as it tracks broader market cycles, while Shiba Inu remains around $0.0000055 with movement shaped by shifting sentiment. Bonk Coin also holds near $0.0000055, reflecting fast reactions to Solana-driven liquidity changes. These assets remain active, but their direction largely follows the overall market rhythm rather than setting it.
BlockDAG, however, is currently defined by timing sensitivity around its $0.001 buyback window, creating a clear focus on execution over waiting. At the same time, BDAG remains available at $0.00000044 with direct buyback program access and 30% off live swap access, adding another layer of participation interest.

This mix of structured timing and accessible entry points keeps BlockDAG in the next big crypto narrative as attention shifts toward assets where timing directly shapes opportunity. Momentum continues building as engagement tightens around its current window.
The post Next Big Crypto Alert: BlockDAG Builds Traction as Toncoin, Shiba Inu & Bonk Coin Show Uneven Market Signals appeared first on Blockonomi.
TLDR
- Marvell Technology stock soared following comments from Nvidia CEO Jensen Huang about the company’s potential to reach trillion-dollar valuation
- Alphabet’s announcement of an $80 billion AI infrastructure investment has created division among investors concerned about returns
- GameStop shares climbed after the company exceeded earnings forecasts and revealed a $2 billion share repurchase program
- Semiconductor and AI hardware companies like Broadcom, Nvidia, and Dell dominated trading volume on Wall Street
- Oil prices surged past $95 a barrel, driving energy sector gains while stoking inflation worries
Marvell Technology Rallies on CEO’s Trillion-Dollar Vision
Marvell Technology emerged as a standout performer in today’s trading session. The stock continued its upward trajectory after Nvidia’s CEO Jensen Huang reportedly indicated the semiconductor firm has the potential to reach a trillion-dollar market capitalization.
These remarks triggered renewed investor enthusiasm for Marvell shares. The firm specializes in networking semiconductors, customized AI processors, and data center equipment utilized by leading cloud service providers.
Market participants view Marvell as a prime beneficiary of the ongoing AI infrastructure buildout. The company’s technology forms a critical component of the backbone required to operate large-scale artificial intelligence deployments.
The stock’s surge rippled through the semiconductor sector, boosting confidence across AI-related equities. Market watchers increasingly anticipate sustained AI demand growth as enterprises and public institutions compete to develop cutting-edge systems.
Alphabet’s $80 Billion AI Investment Sparks Debate
Alphabet captured market attention following its disclosure of an $80 billion allocation toward AI infrastructure development and expansion. The magnitude of this capital commitment has generated mixed reactions from the investment community.
Proponents argue the expenditure is essential to remain competitive with rivals including Microsoft, Amazon, and OpenAI. Skeptics express concern that such aggressive capital deployment could compress profit margins if AI-generated revenues fail to materialize proportionally.
This discussion mirrors broader anxieties emerging throughout the technology industry. AI infrastructure development is emerging as one of the most capital-intensive technological competitions in modern business history.
Nevertheless, numerous investors maintain confidence in Alphabet’s long-term prospects. The company’s dominant search platform, expanding cloud services, and AI capabilities continue to represent formidable competitive advantages.
GameStop Rallies Following Strong Earnings and Buyback Announcement
GameStop captured headlines after delivering quarterly results that exceeded analyst projections. The video game retailer simultaneously unveiled a $2 billion stock repurchase initiative, propelling shares significantly higher.
The buyback announcement demonstrates management’s optimism regarding the company’s strategic trajectory. Share repurchases reduce outstanding equity, potentially providing price support through reduced supply.
While meme-stock fervor has subsided from previous heights, GameStop demonstrated its continued ability to generate momentum and capture retail investor interest. The move provided a temporary boost to other speculative equities.
Semiconductor Stocks Maintain Market Spotlight
Broadcom, Nvidia, Dell, HPE, and Super Micro Computer ranked among the day’s most heavily traded securities. Market participants continue positioning AI hardware companies as premier long-term growth opportunities.
Broadcom faces its upcoming earnings announcement later this week. Analysts are particularly focused on management commentary regarding custom AI semiconductor demand and cloud infrastructure spending trends.
A positive earnings report from Broadcom could provide additional momentum to the semiconductor sector rally. Chip stocks have delivered superior returns compared to most market segments in recent months.
The market continues favoring companies with direct exposure to AI hardware and infrastructure development. This trend has enabled semiconductor equities to outperform numerous other industry groups.
Crude Oil Breaks $95 Amid Escalating Geopolitical Concerns
Beyond technology, oil prices commanded significant attention. Crude oil advanced beyond $95 per barrel as Middle Eastern geopolitical tensions escalated.
Energy sector stocks posted substantial gains following the commodity price surge. Elevated oil prices simultaneously renewed concerns about inflation and potential implications for Federal Reserve monetary policy decisions.
Increasing energy costs introduce additional uncertainty into the market’s forward outlook. Heightened inflationary pressure could influence the central bank’s approach to interest rate adjustments.
Today’s market activity highlighted the dominant themes currently influencing investor sentiment. Artificial intelligence, semiconductor innovation, retail trading dynamics, and geopolitical uncertainty all contributed to shaping the session’s narrative.
The post Market Movers: Marvell’s AI Surge, Alphabet’s Massive Spend, GameStop’s Rally, and Oil’s Climb appeared first on Blockonomi.
Key Highlights
- META stock has declined approximately 10% year-to-date in 2026, trading about 25% below its August 2025 high of nearly $800, resulting in a market cap loss of roughly $500 billion.
- Morgan Stanley maintains META as a preferred investment with a $775 price target, representing approximately 30% potential upside from present levels.
- On Wednesday, Meta unveiled its AI-driven Business Agent, now available across WhatsApp, Messenger, and Instagram for businesses worldwide.
- Morgan Stanley estimates that if fewer than one-third of Meta’s 3.5 billion daily active users execute just one query daily, the AI chatbot could produce $10 billion in yearly revenue.
- Meta reported Q1 revenue of $56.3 billion, exceeding analyst projections, while providing Q2 revenue guidance ranging from $58 billion to $61 billion.
Meta Platforms experienced a significant Wednesday announcement. The social media giant introduced its Meta Business Agent — an artificial intelligence solution enabling businesses to streamline customer engagement across WhatsApp, Messenger, and Instagram. The platform can handle inquiries, schedule appointments, screen potential customers, and complete transactions in multiple languages.
Meta Platforms, Inc., META
Over one million businesses have already adopted early versions of this technology on WhatsApp and Messenger. The broader deployment begins with free access, with premium subscription options scheduled for introduction later this year.
During a London event on Wednesday, CEO Mark Zuckerberg stated that the new agent will “assume greater responsibilities and ultimately assist in managing your entire business.”
That’s an ambitious statement. Market acceptance remains uncertain.
META stock has fallen nearly 10% in 2026, positioning it as the poorest performer within the Magnificent Seven cohort. Currently trading around $596, the stock sits approximately 25% beneath the near-$800 high reached in August 2025. This downturn has eliminated roughly $500 billion in shareholder value.
The company is barely maintaining its position within the S&P 500’s top ten constituents, as Micron Technology and Berkshire Hathaway narrow the valuation gap.
Morgan Stanley’s Investment Thesis
Morgan Stanley analyst Brian Nowak remains undeterred by recent performance. He designates META as a premier investment opportunity and maintains a $775 price objective — suggesting potential gains of approximately 30% from current trading levels.
“Investor sentiment has reached its bottom,” Nowak stated in a Wednesday research note. He contends that the present valuation discount relative to megacap competitors overlooks the substantial strength of Meta’s user engagement and revenue generation capabilities.
Nowak highlights four emerging product categories he believes could drive share price appreciation. Meta AI leads his analysis.
He calculates that if merely one-third of Meta’s 3.5 billion daily active users submit a single search query daily, this could generate $10 billion in incremental annual revenue and boost his 2028 earnings projection of $35.79 per share by 8%. Increased usage patterns could elevate that impact to 20% upside.
Subscription services represent an additional growth driver. Nowak projects these could contribute $7 billion in revenue and $2 in earnings growth as Meta begins monetizing its user base through paid offerings.
Capital Expenditure Concerns
The primary investor concern centers on Meta’s capital investment strategy. The company has announced $600 billion in total capital expenditures, including $350 billion allocated over the upcoming two years. That represents substantial investment with limited clarity on return generation.
Reality Labs continues operating at a loss. Quest virtual reality headsets and AI-enabled eyewear haven’t produced material financial contributions.
Operational performance, however, remains solid. Q1 revenue totaled $56.3 billion, surpassing analyst expectations. Q2 guidance ranges between $58 billion and $61 billion.
Meta’s proprietary reasoning system, Muse Spark, generated a 10% increase in Instagram Reels engagement and an 8% boost for Facebook video — marking the strongest engagement metrics in four years.
The Business Agent Platform has also established integrations with Shopify, Zendesk, and Shopee, providing businesses with comprehensive tools to develop and implement agents across their operations.
The post Meta Platforms (META) Stock: Morgan Stanley Predicts 30% Rally Driven by AI Innovation appeared first on Blockonomi.
CryptoPotato
The US Department of the Treasury’s Office of Foreign Assets Control (OFAC) has sanctioned Nobitex, Iran’s largest digital asset exchange, along with three other Iranian crypto exchanges. The move is part of the Donald Trump administration’s Economic Fury campaign aimed at increasing economic pressure on Tehran.
The Treasury’s sanctions apply to Nobitex, Wallex, Bitpin, and Ramzinex. US officials allege that these exchanges helped users bypass sanctions, facilitated financial activity connected to Iran, and processed transactions linked to the Islamic Revolutionary Guard Corps (IRGC).
Terror Finance and Sanctions Evasion Risks
In an official statement this week, Treasury Secretary Scott Bessent claimed that Iran has increasingly used digital asset technologies to advance its “corrupt agenda,” including circumventing sanctions and transferring wealth outside the country. He added that Treasury would continue tracking financial activity through both traditional banking channels and digital assets as part of the administration’s broader effort to prevent Iran from developing a nuclear weapon.
According to Treasury, Nobitex processed more than 50% of all Iranian digital asset inflows in 2025 and played a central role in the country’s crypto ecosystem. The agency alleged that the exchange facilitated payments linked to Iran’s terrorist activities, sanctions evasion efforts, and IRGC-related transactions, including activity involving IRGC-affiliated ransomware actors. Treasury also accused Nobitex of helping the Central Bank of Iran access hundreds of millions of dollars in stablecoins used to support the Iranian rial and enabling regime insiders to access international crypto exchanges across multiple jurisdictions.
Treasury said Nobitex helped protect and move assets out of the country despite internet blackouts from the very start of the war. In addition to sanctioning the exchange, OFAC designated Amir Hossein Rad, Nobitex’s chairman, co-founder, and former CEO, along with several other company leaders and officials.
According to their findings, Rad helped restore Nobitex’s operations after the platform suffered a $90 million hack in June 2025.
The agency also sanctioned Nobitex co-founders Seyed Mohammad Ali Aghamir Mohammad Ali and Seyed Mohammad Aghamir Mohammad Ali, both members of the Kharrazi family, which Treasury described as part of Supreme Leader Mojtaba Khamenei’s inner circle. Current Nobitex CEO Seyed Ali Khoee was also designated.
Wallex, Bitpin, and Ramzinex Also Targeted
Meanwhile, Wallex, identified as Iran’s second-largest digital asset exchange by volume, was said to have received 12% of Iranian digital asset inflows in 2025 and allegedly facilitated transactions linked to the IRGC. Bitpin accounted for 10% of Iranian digital asset inflows in 2025 and processed millions of dollars in transactions, including transfers allegedly connected to the IRGC, while some of its investors have reportedly been linked to efforts to evade US sanctions.
Ramzinex, a Tehran-based exchange founded in 2018, has processed more than $2.45 billion in transactions and allegedly facilitated transactions linked to the IRGC and an Iranian government-backed financial institution.
The post US Sanctions Iran’s Largest Crypto Exchange Nobitex in Major ‘Economic Fury’ Crackdown appeared first on CryptoPotato.
Bitwise Chief Investment Officer Matt Hougan said the “brutal” cryptocurrency market is no longer the “belle of the ball,” as digital assets are increasingly becoming a contrarian investment.
In his latest memo, Hougan flagged three factors influencing the market, beginning with crypto’s struggle to attract investor enthusiasm as prices remain under pressure and momentum fades.
On Contrarian Bet and Clarity
Bitcoin is down 24% this year, while Ethereum has fallen 36%, Solana 40%, and XRP 32%. At the same time, exchange-traded funds have recorded outflows and spot trading volumes have dropped to their lowest levels in years. Hougan attributed part of the weakness to investors’ growing preference for artificial intelligence-related opportunities, including AI stocks, robotics companies, and private firms such as SpaceX, while noting that the Nasdaq-100 has gained 43% year-over-year.
According to the Bitwise exec, the dominance of the AI trade has forced crypto to evolve from a momentum investment fueled by excitement into a “contrarian” bet that requires patience, a long-term perspective, and a focus on fundamentals. He said this pivot helps explain why investors are paying greater attention to revenues and favoring projects with clear fundamentals, such as Hyperliquid.
Hougan said that crypto is not disappearing but is changing the types of investors and projects it rewards. The second factor weighing on the market, he said, is uncertainty surrounding the Clarity Act, a proposed market structure bill designed to establish a comprehensive regulatory framework for cryptocurrencies in the United States. Although the legislation recently cleared a hurdle in the Senate, the Bitwise exec noted that prediction market Polymarket currently assigns only a 55% probability that it will be approved before year-end.
The D.C. insiders he recently spoke to estimated the chances of passage between 5% and 30%. Hougan said this ambiguity is discouraging institutional investors, who can either allocate capital to rapidly rising AI-related assets or invest in crypto while facing the possibility of a major regulatory setback. He even argued that large-cap crypto assets are unlikely to experience a sustainable rally until this uncertainty is resolved, and added that the resolution itself is more important than the outcome because crypto can adapt whether the legislation passes or fails but struggles to thrive while uncertainty continues.
Crypto Winter Nearing an End?
Zooming out, Hougan also observed that the current downturn differs from previous crypto bear markets. Rather than rotating into Bitcoin, investors are moving toward smaller, less established cryptocurrencies with “credible fundamentals.” He pointed to one-month gains of 73% for Hyperliquid, 50% for Zcash, and 44% for Stellar, despite declines in larger assets.
Hougan said this rotation demonstrates that fundamentals are becoming more important as crypto moves away from momentum-driven trading and suggested that it may indicate that the market is “closer to the end of this winter than the beginning,” while acknowledging that the coming weeks could remain “painful.”
However, not all analysts share Hougan’s view. Analyst Doctor Profit has repeatedly warned that the worst could still lie ahead. He expects Bitcoin to enter a capitulation phase below $60,000 and ultimately bottom in the $40,000-$50,000 range between September and October 2026.
CryptoQuant CEO Ki Young Ju, on the other hand, cautioned that the current bear market could extend into early 2027.
The post Crypto Is No Longer the ‘Belle of the Ball,’ Warns Bitwise’s Matt Hougan appeared first on CryptoPotato.
Dogecoin (DOGE) suffered a fresh decline of over 5% on Wednesday amid continued selling pressure. However, the OG meme coin is trading at a level that has historically served as an accumulation zone, as flagged by a largely overlooked setup based on its CVDD (Cumulative Value Days Destroyed) Channel model.
According to Alphractal, the CVDD Channel is a thermodynamic floor model that estimates an asset’s structural cost basis by weighting each on-chain coin movement according to both its value and the number of days since it last moved. Historically, Dogecoin’s price approaching the lower CVDD bands has coincided with the deepest long-term accumulation zones, while touches of the upper Alpha CVDD band have aligned with every major DOGE market top over the past decade.
DOGE’s Next Structural Target At $0.85
Alphractal said Dogecoin is currently trading near the lower CVDD band at around $0.10-$0.11, a level that has previously appeared before major price rallies. Similar setups appeared in late 2014, mid-2020, and mid-2023, with the meme coin later posting gains of approximately 25,000%, 18,000%, and 500% after those periods.
According to Alphractal, the current lack of a strong narrative around DOGE is not unusual, as major narratives typically emerge after accumulation phases. The analytics firm also explained that DOGE’s year-long sideways trading indicates accumulation and a rebuilding of its cost basis rather than weakness.
It added that traditional volume metrics may not fully capture this activity because the CVDD model focuses on value-days rather than raw transaction volume, with the current chart showing what it described as “quiet absorption.”
Alphractal said its Alpha CVDD model, which it claims has successfully identified every major Dogecoin market top in previous cycles, currently places the upper target band at around $0.85. This means a potential 7.7-fold increase from its current price levels.
“DOGE is the largest, most liquid, most distributed memecoin in existence. It has the longest historical CVDD record of any meme asset by a decade. The current print is mechanically identical to every prior bottom – and the upper Alpha CVDD band has held as resistance every single cycle without exception. The market is reading DOGE as a dead meme. The chart is reading it as a coiled spring.”
Breakout Calls
Alphractal predicted that DOGE could deliver a 3x gain before AI-themed meme coin narratives become the market’s main focus.
Meanwhile, analyst Ali Martinez also noted that the TD Sequential indicator had flashed a buy signal on Dogecoin. Several other market observers suggested that the asset could be on the verge of a major breakout.
The post ‘Dead Meme’ or Major Opportunity? DOGE Is Flashing The Same Signal That Preceded Its Biggest Rallies appeared first on CryptoPotato.
For a few hours on Wednesday Asia time, the Zcash blockchain appeared to have stopped producing new blocks, raising concerns that the network may be experiencing downtime.
However, several observers clarified that the issue was not with the blockchain itself but with block explorers, which were failing to update correctly.
Zcash Outage Scare
Earlier in the day, block explorers showed no new blocks after block 3,364,603, recorded at 5:28 a.m. UTC, for more than four hours, fueling speculation that the chain had gone offline. Directly addressing confusion, Helius CEO Mert Mumtaz stated that reports of a network outage were incorrect.
He explained that the network was fully functional and that the apparent disruption was caused by some block explorer applications being connected to a faulty node, which led to incorrect displays of chain activity. As a result, users saw no new blocks being reported, even though the chain continued operating normally in the background.
The misleading appearance of inactivity followed a coordinated network upgrade within the Zcash ecosystem that had been carried out to address a vulnerability affecting Orchard, Zcash’s latest shielded pool. According to a statement from the Zcash Open Development Lab (ZODL), the upgrade was initiated on the evening of Monday, June 1, in response to an issue identified in Orchard. Developers, infrastructure operators, miners, exchanges, and other independent participants worked together to temporarily suspend Orchard-related transactions while a protocol upgrade was implemented.
The process occurred in two stages through network-wide consensus. First, a soft fork was activated to temporarily disable Orchard by preventing both new Orchard outputs and spending from existing Orchard funds, helping limit exposure of sensitive technical details. This was followed by a hard fork to fully remediate the vulnerability and restore Orchard functionality, which required updates to the zero-knowledge proof circuit.
Once the upgrade was completed, Orchard transactions were re-enabled. ZODL stated there is no evidence the vulnerability was exploited, no unauthorized creation of value, and no impact to the total ZEC supply. User funds remained safe throughout the process, and the issue did not affect Sapling or transparent transactions.
The vulnerability was discovered through security audits by Zcash researcher Taylor Hornby, and the remediation effort was coordinated by ZODL alongside the Zcash Foundation and other ecosystem participants.
ZEC Momentum Strengthens
Zcash’s native token ZEC has moved against the broader market trend as it continued posting strong gains over the past month. The privacy-focused asset has climbed nearly 45% in that period and is currently trading near $599 after rising another 4% in the past 24 hours.
According to crypto analyst Ali Martinez, the TD Sequential indicator on the 12-hour chart recently flashed a buy signal for ZEC, which means that the upward momentum could continue. As long as the token holds above the $500 level, a potential move toward $642 remains in play.
Santiment identified ZEC as the most dominant topic across crypto social media, with seven repeated spikes in social dominance and a peak score of 10.02 recorded on May 20.
The post Why Zcash (ZEC) Network Looked Offline for Hours – But Wasn’t appeared first on CryptoPotato.
Trying to spot a leading cryptocurrency whose price remains in green territory on a weekly scale is not an easy task given the major collapse that the broader market has experienced over the past several days.
Internet Computer (ICP) is one of the few gainers, while certain analysts believe its valuation could reach much higher levels soon.
What’s Next?
Despite Bitcoin’s 11% weekly plunge and Ethereum’s 10% drop, ICP is up 3% over the same period and currently trades just north of $3. Its market capitalization has risen to almost $1.7 billion, making it the 53rd-largest cryptocurrency.
Among the main reasons for the ascent is the advancement related to the Internet Computer ecosystem. The popular X account BSCN revealed that the protocol has processed 7.2 million transactions in the last month, more than any other chain. Solana comes in second with less than 3 million.
ICP’s positive performance has drawn the attention of traders and analysts, prompting a wave of optimistic predictions. X user Crypto Tony, for instance, argued that a reclaim of $3.15 could open the door to a long position up to $3.50 and $4, “while we hold above.”
JAVON MARKS noted ICP’s cross above $3, seeing a potential for a 220% explosion towards $10. Such a rise wouldn’t be unprecedented for the asset, since in its early days it briefly hovered beyond $400.
Prior to that, X user Nehal also gave their two cents. The analyst observed ICP’s price trajectory to estimate that a confirmed breakout above the descending resistance around $4.50-$5 could trigger a substantial rally toward $8-$12, with $16+ possible if momentum accelerates.
“Rejection at resistance could send price back toward the $2-$2.50 support zone,” they added.
Abandoning Exchanges
The recent shift from centralized trading venues toward self-custody methods reinforces the bullish forecasts mentioned above. According to CoinGlass, exchange outflows have outpaced inflows in recent days, indicating that investors are in no rush to sell their holdings.

Meanwhile, ICP’s Relative Strength Index (RSI) remains in neutral territory but has been gradually nearing overbought levels, which usually precede a price correction. The technical analysis tool measures the speed and magnitude of recent price changes, with values ranging from 0 to 100. Ratios above 70 signal that a correction could be on the way, while anything below 30 is considered a buying opportunity. As of press time, ICP’s RSI stands at around 62.

The post Internet Computer (ICP) Defies the Crypto Carnage: Can It Explode to $10? appeared first on CryptoPotato.


