Cryptocurrency Posts
Crypto Briefing
TRON's expansion into tokenized assets could revolutionize global market access, but regulatory challenges may impact its ambitious timeline.
The post Justin Sun outlines TRON’s plans beyond digital dollars appeared first on Crypto Briefing.
The end of Stargate v2 support signals a shift towards more efficient blockchain operations, urging users to adapt swiftly to avoid disruptions.
The post Stargate to end v2 support for Gravity, Camp, GOAT and Metis on October 23, 2026 appeared first on Crypto Briefing.
The new chip hub could boost regional economic growth and technological advancement but may strain US-South Korea diplomatic ties.
The post South Korea plans $520 billion Samsung and SK hynix chip hub in Gwangju appeared first on Crypto Briefing.
The dominance of AI stocks in the S&P 500 raises concerns about market vulnerability and diversification challenges for passive investors.
The post AI stocks now make up 49% of the S&P 500, the second-highest concentration on record appeared first on Crypto Briefing.
The lack of borrowing in Sentora's OUSD vault highlights challenges in generating organic yield, potentially impacting future DeFi adoption.
The post Sentora’s OUSD lending vault holds $43M on Tempo, but almost nobody is borrowing appeared first on Crypto Briefing.
Bitcoin Magazine
Bitcoin Magazine
The Architecture of Money: Mapping Financial Power in the Age of Bitcoin
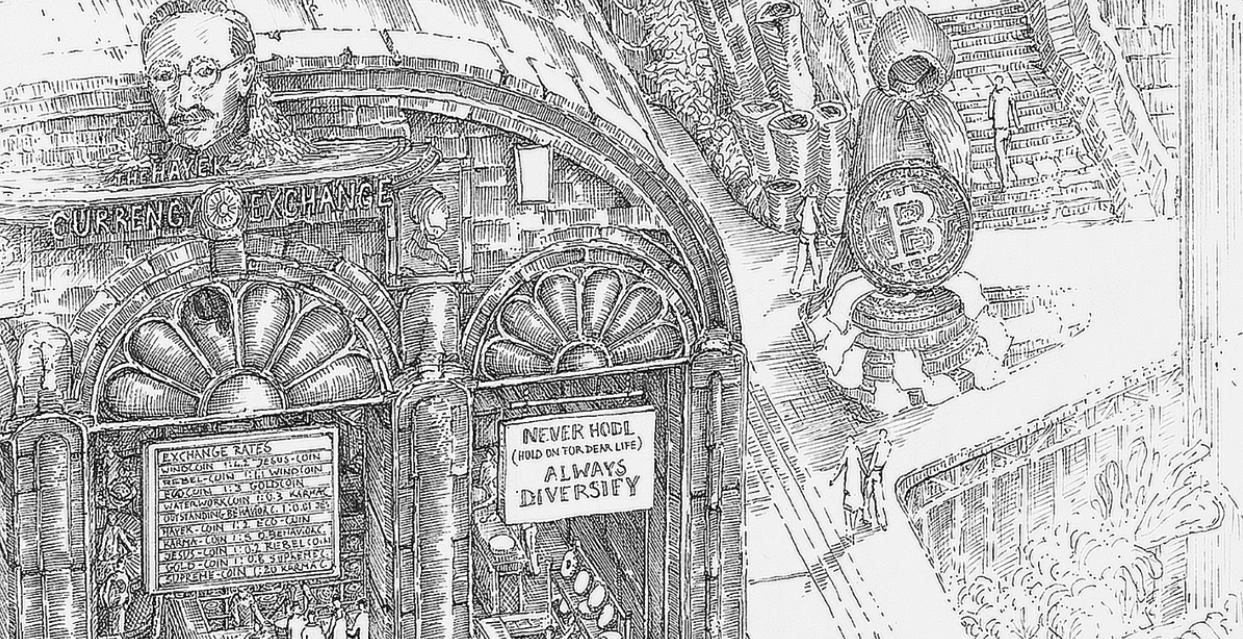
Money determines where we live, what we can afford, and how wealth accumulates across generations. Yet the mechanisms that create and distribute it remain largely occluded, even as their consequences become harder to unsee. For Dutch artist Carlijn Kingma, investigative financial journalist Thomas Bollen, and monetary researcher Martijn Jeroen van der Linden, that disconnect became the impetus for The Waterworks of Money. This ambitious project maps the hidden architecture of the financial system through drawing and animation, rendering it understandable to the people living within it without flattening its complexity.
The Waterworks of Money depicts the financial system as a vast network of reservoirs, channels, and pumps, revealing how money moves through banks, governments, businesses, and households. Some areas receive an abundance of liquidity, while others remain perpetually dry. The resulting drawing operates simultaneously as an artwork, an educational tool, and an examination of financial power.
The project emerged from two years of research, including interviews with more than 100 experts across banking, government, academia, and monetary reform movements. Kingma spent more than 2,200 hours translating that research into an intricate architectural landscape. Bollen, whose investigative journalism examines the workings of the financial system, and van der Linden, whose academic research explores money and monetary reform, helped develop the economic research and narratives behind the work.
One of the project’s scenarios explores a monetary future shaped by bitcoin. As bitcoin enters traditional finance, an alternative monetary system either challenges existing structures of financial power or eventually becomes part of them, and the project’s collaborators have watched both happen.
Ahead of Bitcoin Amsterdam, November 5-6, where Bollen joins two panels, I sat down with all three of the project’s collaborators to discuss making money visible, the relationship between monetary systems and inequality, and bitcoin’s place in Europe’s financial future.

BMAG: The Waterworks of Money illustrates the financial system as a network of reservoirs, pumps, and channels, with some parts of society receiving abundant liquidity while others remain dry. After two years of research and interviews with financial experts, what surprised you most about how money actually works? What do you think the public most fundamentally misunderstands about it?
Thomas Bollen: What surprised me most is that many people inside the system know a great deal about their own corner of it: interest rate derivatives, asset management or mortgage lending. Very few of them can oversee the larger system in which they operate.
What is clearly not well understood is that banks create new money when they make a loan. They are not just intermediaries that pass on the savings of their depositors.
But can you blame ordinary people for that? During the research phase we spoke to many bankers and even a CEO of a major bank who did not know they were working for a money creating institution.
If we want to improve understanding we should start at our schools and universities. Many textbooks still get it wrong, and economics education hardly pays any attention to it. In 2022 even the Riksbank’s prize in economics (the Nobel prize that is not really a Nobel prize) was awarded for research that presents banks as mere intermediaries.
BMAG: One of the central ideas in The Waterworks of Money is that money doesn’t flow evenly through society. Housing affordability has become a major issue in Europe and the United States, while asset prices and financial wealth have increasingly outpaced wages. How much of this inequality results from the design of our monetary system, rather than broader economic forces?
Thomas Bollen: It is impossible to capture that in a precise number, because so many factors play a role. But it is quite clear that the money system exacerbated inequality enormously during all those years when credit was extremely cheap.
Ray Dalio, founder of the hedge fund Bridgewater Associates, summed it up in 2019: “Money is free for those who are creditworthy.” For everyone without money or creditworthiness, it was out of reach.
Cheap credit for rich people and large multinationals (who used it for share buybacks and M&A deals) drove up the price of shares, and of houses. Bank money creation produced a specific kind of inflation: asset inflation. Wealthy households and large multinationals, who already owned those assets, profited far more from it than people without them or small businesses that did not have the same kind of access to cheap credit as their larger competitors.

BMAG: The Waterworks of Money is filled with details that help explain how the financial system works. What was the most difficult part of the monetary system to illustrate? Did anything you learned during the research change how you approached the drawing?
Carlijn Kingma: The biggest challenge was the way all the parts are connected. How do you show that clearly?
Water is the obvious metaphor for money, and it takes you a long way. Liquidity, cash flows, money drying up: they are already in the language of finance. It was also great for connecting the different parts of the system, because I could draw the pipes and canals that run between them.
But in some places you need more than that if you want to be completely accurate. Money comes in many forms: commodity money, public money, private credit money, and further out short-term debt and repo contracts can also serve as money or near-money. It was not possible to draw that many different kinds of water running through the system.
BMAG: The Waterworks of Money has been shown to both art audiences and people interested in economics, including at Bitcoin Amsterdam last year. Have you noticed differences in how these audiences respond to the work? Has their feedback influenced how you think about the role of art in explaining complex ideas?
Carlijn Kingma: The response depends on what people already know. Visitors with more financial knowledge usually laugh more, because they catch all the small jokes. We renamed Basel III to “Babel III”, for instance, because the bank rules written after the crisis add up to about three bibles.
In our bitcoin future scenario, The Republic of a Thousand Coins, we put in a lot of jokes about central bankers. You can see Alan Greenspan there as an inflatable doll. That works best if you know who he is, and the bitcoin crowd knows far more about monetary history than the general public.
Above all, we noticed that art opens doors. The drawing gives people a visual starting point for a conversation. Even without any prior knowledge, the metaphor lets you see the social outcomes of how money flows.

BMAG: Your research has examined how financial crises can reinforce the influence of institutions considered too important to fail. More recently, you’ve explored the growing power of asset managers such as BlackRock and Vanguard. Are we witnessing a genuine transformation in how financial power operates, or have the same underlying problems simply taken new forms since 2008?
Martijn Jeroen van der Linden: Following the crisis of 2008, there was a general consensus among mainstream policymakers, think tanks and many economists that the banking sector needed to be repaired. In Europe, the influential de Larosière Group concluded that the causes of the crisis were excessive leverage, opaque securitisation, shadow banking risks, and fragmented supervision in the EU, and argued that “repair is necessary and urgent.” The banking repair consisted of new and stricter regulations, stronger coordinated supervision and new crisis management procedures. The underlying architecture remained unaltered, meaning that fundamental change never occurred.
But the architecture remained fragile. Take, for example, 2023. When Silicon Valley Bank and Credit Suisse got into trouble, the crisis playbooks developed after 2008 stayed in the drawer. The US authorities guaranteed all SVB deposits, including the more than 90 percent above the insured limit. In Switzerland, the state backed the rescue of Credit Suisse by UBS.
Advocates of banking repair often claim to have made the system safer. But the inherent fragility of funding long-term loans with runnable bank deposits is still there. Even with all the regulation, you cannot prevent a bank run, and that fragility is precisely what they refuse to solve. The banking system only survives because of massive public safety nets and privileges given to banks.
Large powerful non-banks have indeed emerged but they do not play a pivotal role in money and payments. This is a key distinction between the two sectors.

BMAG: Bitcoin began as an attempt to create money outside the control of governments and banks. Today, it’s increasingly held through investment funds and traditional financial institutions, including some of the same powerful asset managers examined in your recent work. Does this integration strengthen bitcoin’s ability to change the financial system, or risk reproducing the concentration of power it originally sought to challenge?
Martijn Jeroen van der Linden: As a financial asset, bitcoin has benefited from investments from traditional financial institutions. But the increasing use of bitcoin as an investment has compromised its promise of an alternative payment system.
At the same time, bitcoin and the rise of stablecoins have challenged the banks on their payment infrastructure. The banks are now innovating too: look at Wero, the payment wallet that a group of European banks launched in 2024. That is a change. But it is something different from the structural reform of money and banking.
BMAG: Your project imagines bitcoin as an alternative to the existing monetary system. Amsterdam also has a remarkable history of monetary experimentation, from the development of modern financial institutions to David Chaum’s pioneering work on private digital cash decades before bitcoin. Given that history, how do you see bitcoin’s role in Europe’s financial future? Has your perspective changed since you began working on the project?
Thomas Bollen: What I appreciate about bitcoin’s design is that it resembles full reserve banking. A bitcoin is not a claim on something else, so it carries no risk of a bank run. Bank deposits are: they are a promise that you can withdraw your money at any moment, while the bank can never keep that promise to all its customers at once.
We can learn a lot from our history. The Amsterdamsche Wisselbank, founded in 1609 and often seen as the world’s first central bank, started out as a full reserve bank: every bank guilder was backed by coins in its vault. It went under only after it secretly began lending more and more to the Dutch East India Company.
That is the risk of every monetary experiment: it can go in the wrong direction. In the crypto world, all kinds of companies started copying the banks. They lent out their customers’ bitcoins, while those customers still saw their coin-balances in their accounts. Sam Bankman-Fried’s FTX shows how this practice can go horribly wrong.

Thomas Bollen will participate in two panel discussions at Bitcoin Amsterdam on November 6, 2026, on the Treasury Stage. Europe’s Monetary History & Future: Austrian Economics, Banks & Bitcoin (11:00–11:30 AM), alongside Rahim Taghizadegan and Willem Middelkoop, and Staat vs. de Markt: Hoeveel Overheid Hebben We Nodig in Geld? (1:55–2:25 PM), alongside Paul Buitink and Simon Lelieveldt.
Watch the full two-part animated exploration of The Waterworks of Money on YouTube and support the project by purchasing a signed, limited-edition print by Carlijn Kingma or making a donation toward its continued research at waterworksofmoney.com/buy.
The Bitcoin Museum & Art Gallery (BMAG) organizes international exhibitions, auctions, and artist collaborations exploring bitcoin and its cultural implications. Learn more at museum.b.tc.
Join us at Bitcoin Amsterdam, November 5–6, 2026. Get your tickets here and use code BA26-BMAG20 for discounted admission.
This post The Architecture of Money: Mapping Financial Power in the Age of Bitcoin first appeared on Bitcoin Magazine and is written by Dennis Koch.
Bitcoin Magazine
Super League Stockholders Approve Metaplanet’s 2,100 BTC Investment, Paving Way for ‘Superplanet’
Super League stockholders have approved all proposals tied to Metaplanet‘s 2,100 BTC investment, clearing the way for the Nasdaq-listed company to be renamed Superplanet and become the Japanese firm’s U.S. Bitcoin treasury vehicle.
The proposals passed at Super League Enterprise, Inc.’s 2026 annual meeting of stockholders, held Friday and were disclosed Monday morning. The transaction itself was first announced in August.
Under the definitive agreement, Metaplanet, Inc. will contribute 2,100 Bitcoin and $2.5 million in cash through its wholly owned U.S. subsidiary, Metaplanet Holdings, Inc.
JUST IN:
— Bitcoin Magazine (@BitcoinMagazine) October 19, 2026Japan's Metaplanet to buy Super League for 2,100 BTC and $2.5 million
This will give the 2nd-largest corporate BTC holder a U.S. listed Bitcoin treasury platform!pic.twitter.com/0gucAALjAX

In exchange, Metaplanet receives 44,859,400 shares of common stock at $3.00 per share, along with preferred stock and warrants.
At closing, Super League will be renamed “Superplanet, Inc.” and trade on Nasdaq under the ticker symbol “SUPA.” Its advertising and media activation business will continue as a distinct operating segment, and Matt Edelman will remain chief executive officer.
Among the measures stockholders approved were the issuance of common stock and warrants to Metaplanet and the corporate name change. The proposals also included an increase in authorized preferred shares from 10 million to 100 million, according to a summary of the meeting posted on X.
“Super League stockholders have voted to approve the proposed Metaplanet transaction, an important step in our transformation from a Bitcoin treasury company into a global Bitcoin-native financial platform,” Metaplanet CEO Simon Gerovich wrote on X.
“Upon close, Superplanet will be our U.S.-listed Bitcoin treasury platform, providing direct access to U.S. capital markets and greater flexibility to opportunistically raise capital.”
Edelman framed the vote similarly in the company’s announcement: “Their approval brings us one step closer to redefining what this company can become.”
Closing is anticipated in the fourth quarter of 2026, subject to customary closing conditions, including required filings with the Nasdaq Capital Market. The shareholder approvals represent a required step but not the final one.
Super League said the arrangement is intended to establish conditions governing Metaplanet’s ability to dispose of its equity holdings following the transaction. The company did not provide details of exceptions to those restrictions in its announcement.
Metaplanet held 43,000 BTC as of August 18, describing itself as the third-largest corporate Bitcoin treasury among publicly traded companies. The combined structure is intended to give the group two listed Bitcoin treasury platforms — one on the Tokyo Stock Exchange, one on Nasdaq — each with its own investor base and reporting currency.
Super League connects brands with what it describes as a 3.3 billion-person global gaming population through advertising and branded content programs across gaming and digital media platforms. Metaplanet is a Tokyo-listed company building Bitcoin-based financial products and infrastructure.
Shares of Super League moved higher on the news.
This post Super League Stockholders Approve Metaplanet’s 2,100 BTC Investment, Paving Way for ‘Superplanet’ first appeared on Bitcoin Magazine and is written by Mathew Di Salvo.
Bitcoin Magazine
No ‘Uptober’ Yet: Bitcoin Slips 2% in a Month That’s Historically Bullish
Bitcoin’s price retook $82,000 on Monday as choppy trading last week stunted the coin’s gains.
The biggest cryptocurrency by market cap was recently trading for close to $82,393 — up by close to 2% over the past day but still down over a seven-day period.
Bitcoin has gotten off to a slow start for so-called Uptober, a month when the cryptocurrency has typically surged: Since the beginning of October, bitcoin’s price has dropped by 2%.
U.S. investors last week cashed out of exchange-traded funds, with speculators redeeming $228.4 million in shares from the investment vehicles managed by BlackRock, Fidelity, and Grayscale, according to data from Farside Investors.
Bitcoin is often moved by investors buying shares of the U.S. ETFs. The funds give investors easy exposure to the asset via shares they can buy on their brokerage accounts.
Despite the slow October so far, analysts have said that bitcoin is now in a bull market after spending most of 2026 trading under $70,000 — well below its all-time high of $126,080.
Bitcoin’s price started rallying in August after the U.S. Treasury Department said it would more than double the size of its government debt repurchases. The coin had its best run in three years and third best August ever.
The coin’s price has recently benefited from the so-called debasement trade: when investors buy certain assets to hedge against currency being devalued. The dollar slid in value in August.
It continued to have a good September, rising nearly 6% over a 30-day period. Bitcoin in the third quarter of this year had its best three months since 2024.
After a record third quarter, will October keep the streak alive?
This post No ‘Uptober’ Yet: Bitcoin Slips 2% in a Month That’s Historically Bullish first appeared on Bitcoin Magazine and is written by Mathew Di Salvo.
Bitcoin Magazine
Strategy Keeps Buying: Third Purchase This Month Brings October Spending to $73 Million
The largest corporate holder of bitcoin, Strategy, bought another 267 BTC last week, bringing its holdings to 848,517 digital coins — worth $69.5 billion at today’s prices.
According to a Monday filing, the software company said it spent slightly more than $22 million on buying the new bitcoins.
The latest buy allowed Strategy to snap up slightly more coins than its transaction the previous week, when it spent again $22 million on 250 BTC. So far in October, Strategy has spent $73 million on buying bitcoin.
BREAKING:
— Bitcoin Magazine (@BitcoinMagazine) October 19, 2026Michael Saylor's Strategy buys 267 BTC worth $22 million
Strategy stock (NASDAQ: MSTR) was trading nearly 2% higher Monday morning New York time at about $139 per share. Over the past month, MSTR has dropped by 17%. Year-to-date, it’s down 11%.
Monday’s filing also shows that Strategy also repurchased $193.1 million of its STRC preferred stock.
Strategy has bought back its stock this year as its STRC preferred shares have traded below their $100 face value due to market volatility and index changes.
Strategy — formerly MicroStrategy — started buying Bitcoin in August 2020 as a way to generate better returns for its shareholders.
It has since spent around $64 billion on BTC, making it the largest corporate holder of the asset. Investors can buy its shares to gain exposure to the leading cryptocurrency without having to buy bitcoin themselves.
The company is now also focusing on products that pay investors yield via its STRF, STRC, STRK, and STRD preferred shares.
Strategy could face trouble soon though after Morgan Stanley Capital International last week said it was moving ahead with a proposal “to define and classify non-operating companies as ineligible for inclusion in the MSCI Global Investable Market Indexes.”
Such a move could eventually remove Strategy from the index, leading to fewer institutional investors holding the stock.
This post Strategy Keeps Buying: Third Purchase This Month Brings October Spending to $73 Million first appeared on Bitcoin Magazine and is written by Mathew Di Salvo.
Bitcoin Magazine

El Salvador’s National Bitcoin Office Hosts Five November Events Led by Herbert and Keiser
El Salvador’s National Bitcoin Office, led by Stacy Herbert and Max Keiser of Keiser Report fame, is hosting a series of Bitcoin events this November in El Salvador. Five main events will take place, with plenty of side events hosted by the local community.
The Bitcoin Capital Summit starts off the official schedule on November 10 at the downtown library and tech center, BINAES. Bitcoin Histórico runs November 11 and 12 at the National Palace and surrounding sites in Centro Histórico. The Renaissance Rodeo follows on November 13 at Lake Ilopango. EmTech AI LATAM is set for November 18 and 19 at the Escuela Superior de Economía y Negocios. The Global Bitcoin Circular Economies Summit closes the sequence on November 19 and 20 in El Zonte.
Bitcoin Capital Summit
The Bitcoin Capital Summit takes place on November 10 from 5:00 p.m. to 7:30 p.m. at BINAES in San Salvador. Hosted by Luca Esposito of Blockstream Capital Partners in collaboration with the Bitcoin Office, the evening is framed around Bitcoin’s institutional era from treasury to capital markets. The agenda includes a welcome by Luca Esposito, a keynote by Sean Bill, former CIO of BSTR at Blockstream, and a panel on the institutional Bitcoin stack featuring Pierre Rochard, CEO of The Bitcoin Company, and Juan Diego Sol, Regional Manager, Central America at IBEX. As well as a closing fireside with Max Keiser and Stacy Herbert, among other panels. Registration is free but approval-required through the official Luma page.
Bitcoin Histórico
Bitcoin Histórico runs November 11 and 12 across the Centro Histórico of San Salvador, with keynotes at the National Palace live-streamed to giant LED screens on Plaza Gerardo Barrios. Organized by the National Bitcoin Office, the conference focuses on Bitcoin, financial freedom, and El Salvador’s transformation. Tickets are sold exclusively in Bitcoin at bitcoinhistorico.com. The $350 Trailblazer Seat includes guaranteed seating, access to public sessions, tech demos, community meetups, and an invitation to the afterparty, while locals with Salvadorian ID can buy entry with the $21 Satoshi Chero ticket.
The $2,100 Genesis Crown Pass adds VIP seating inside the National Palace, fast-track entry, private lounge access with meals, an exclusive merch pack, and priority networking with keynote speakers.
All tiers include free admission to the Renaissance Rodeo the following day. Promo codes CROWN15 and Cowboy21 have been shared by organizers.
Renaissance Rodeo
The inaugural Renaissance Rodeo takes place on November 13 on the shore of Lake Ilopango. The event features bull riding, mutton busting, barrel racing, music, and barbecue, and is positioned as a celebration of Salvadoran cowboy culture and regenerative agriculture. Details and a waitlist are available at the official site renaissance.rodeo. Holders of any Bitcoin Histórico ticket receive free admission.
EmTech AI LATAM
EmTech AI LATAM runs November 18 and 19 at the Escuela Superior de Economía y Negocios. This is the first Latin American edition of the MIT Technology Review conference, organized with Opinno and local partner C² Labs and supported by the Agencia Nacional de Inteligencia Artificial. The agenda covers moving AI from pilots to production impact, governance, talent development, and technology trends. Coverage of the announcement is available via Diario El Salvador. Registration is available at emtechai-latam.com.
Global Bitcoin Circular Economies Summit
The Global Bitcoin Circular Economies Summit takes place November 19 and 20 in El Zonte. Organized by Bitcoin Beach and the Federation of Bitcoin Circular Economies, this is the first public edition of the gathering. Previous events have been invite-only and have gathered top international talent, focused on delivering the benefits of Bitcoin to the developing world.
Registration is free via the official Bitcoin Beach summit page. Confirmed speakers include Jeremy Almond, Co-Founder and CEO of Paystand, Alexandra Navarro of Paystand, Gerardo Linares, and Evelyn Lemus. The program focuses on Bitcoin as everyday money, merchant adoption, education, and lessons from circular economies across Latin America, Africa, and Asia.
This post El Salvador’s National Bitcoin Office Hosts Five November Events Led by Herbert and Keiser first appeared on Bitcoin Magazine and is written by Juan Galt.
CryptoSlate
Charles Hoskinson is developing a new programming language for Cardano as the blockchain approaches a pivotal test of commercial demand. The Cardano founder said he is working with developer Lucas Rosa, a software engineer at Input Output Global, on a language supporting intent-based transactions and proof-carrying data using Groth16 cryptographic proofs. The announcement follows Hoskinson's…
Read the full story on CryptoSlate
Understand the crypto stories that matter and what to watch next. Get The Catalyst in your inbox
After eligible EEA Kraken Pro users opt in, default cross margin can draw on their full eligible balance, including qualifying Earn holdings.
Read the full story on CryptoSlate
Understand the crypto stories that matter and what to watch next. Get The Catalyst in your inbox
Strategy's discretionary USD Cash fell to $447.3 million as the company spent another $193.1 million on STRC buybacks and raised its preferred-stock repurchase authorization to $3 billion. The Michael Saylor-led company disclosed on Oct. 19 that it bought Bitcoin for $22.1 million at an average price of $82,900 over the previous week. The acquisitions increased…
Read the full story on CryptoSlate
Understand the crypto stories that matter and what to watch next. Get The Catalyst in your inbox
CFTC data for Oct. 13 show rising spread legs lifted gross longs despite fewer outright longs, without establishing spot buying.
Read the full story on CryptoSlate
Understand the crypto stories that matter and what to watch next. Get The Catalyst in your inbox
Crystal’s selected cohort cut USDT balances in Q3, while Allium assigns it 84% of January–September 2026 classified payment value.
Read the full story on CryptoSlate
Understand the crypto stories that matter and what to watch next. Get The Catalyst in your inbox
CryptoTicker.io
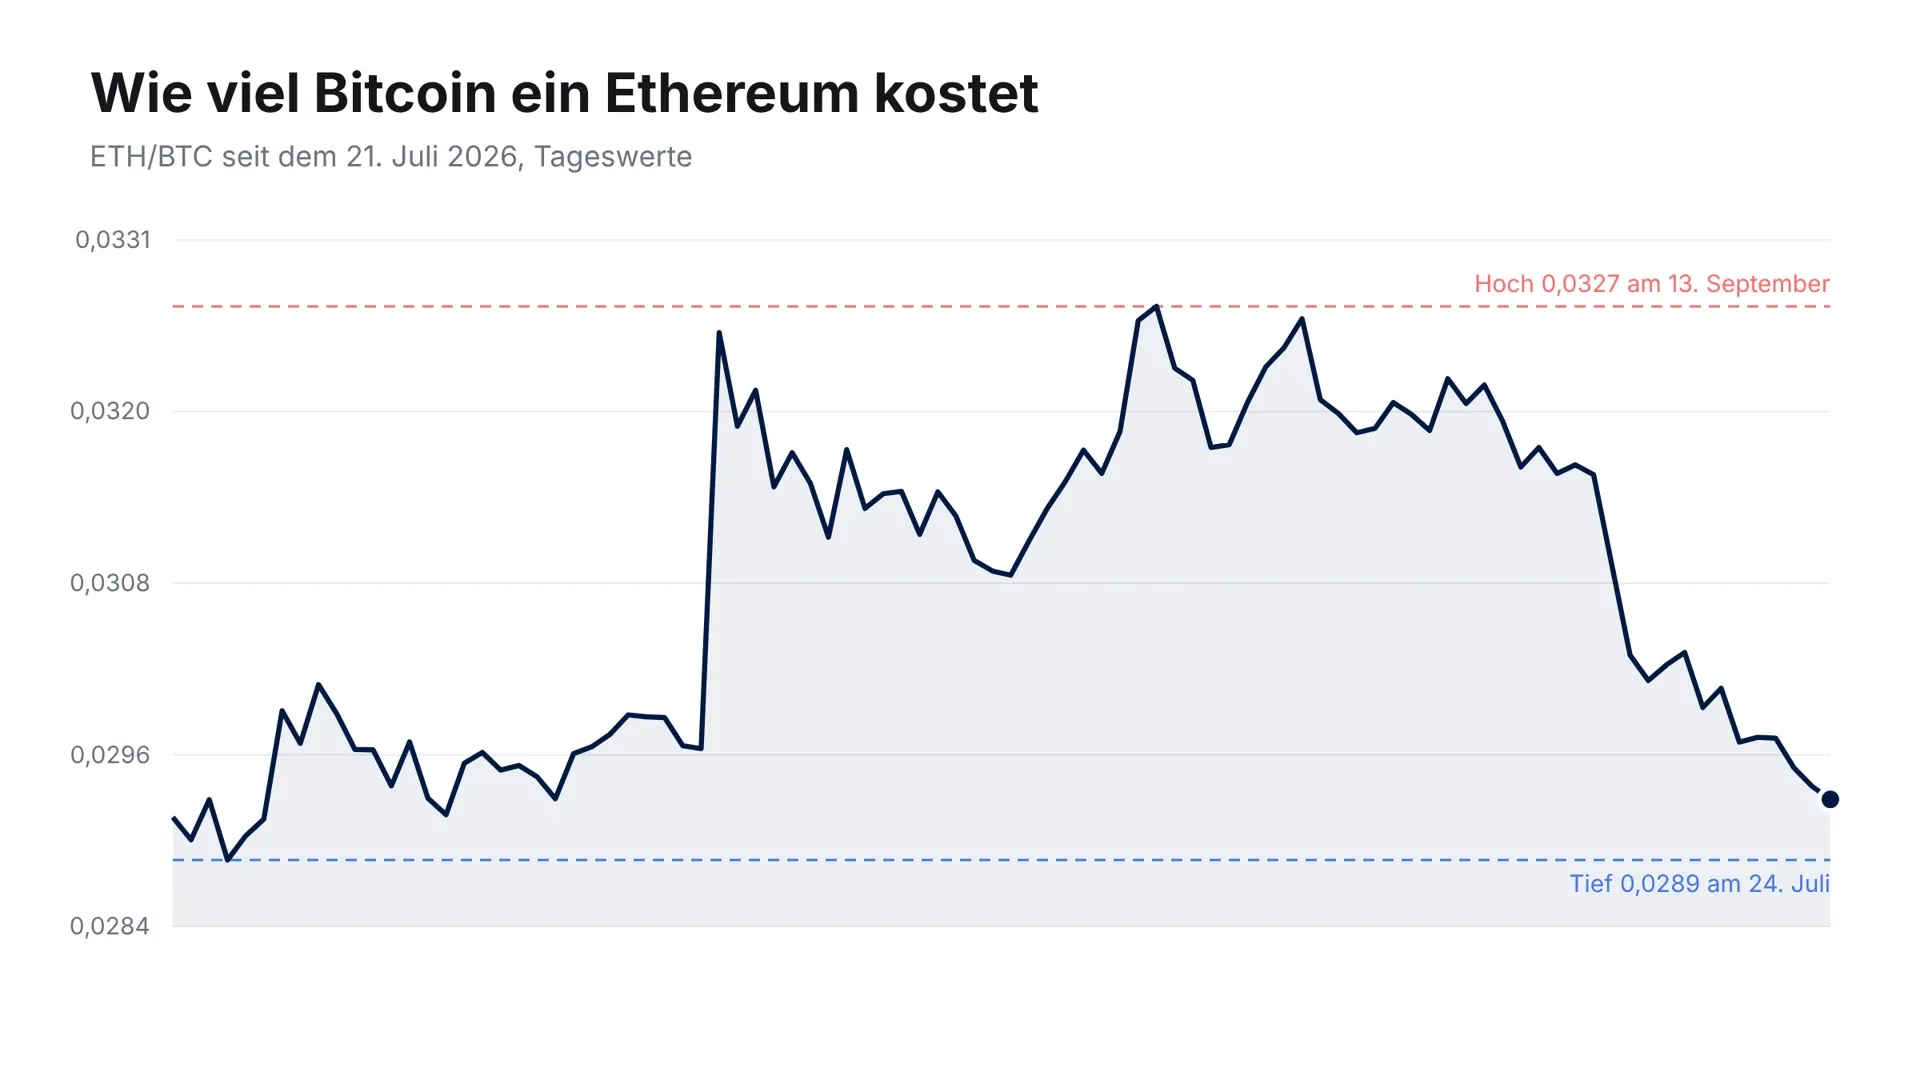
One Ethereum costs 0.0293 Bitcoin on Monday evening. That is the yardstick that decides whether holding ETH pays off against BTC, and for five weeks it has pointed one way: down. From the high of 0.0327 on September 13, 10.4 percent has gone, and only 1.5 percent now separates it from the three-month low of 0.0289.
The dollar price hides this. Ethereum trades at around $2,400 on October 19, practically where it stood yesterday, or €2,141. Look only at that and you see a quiet day. Count in Bitcoin and you see the twelfth day of a decline. Where the price can point on a horizon of months is something our Ethereum price prediction puts in context.
The ETH/BTC ratio: what the figure 0.0293 means
The ETH/BTC ratio is the price of one Ethereum expressed in Bitcoin rather than in dollars or euros. At 0.0293 you get 0.0293 Bitcoin for one Ethereum, and conversely one Bitcoin costs around 34.1 Ethereum. The figure exists as its own trading pair on every larger exchange. It is traded directly rather than derived.
The use of this calculation is that it strips out the common market wind. If the whole crypto market falls five percent, ETH and BTC usually both fall, and both dollar prices look bad. The ratio stays unchanged in that case. When it moves, the cause is a difference between the two blockchains and their buyers, not the weather over the market as a whole.
That is exactly what has happened over the past weeks. Over 30 days Ethereum has lost 8.9 percent while Bitcoin has gained 0.8 percent. That is 9.7 percentage points of distance between two assets that usually run closely together.
Where things stand on October 19: $2,400, but a weaker yardstick
Ethereum stood at around $2,400 on Monday evening, after a daily high of $2,443.80 and a daily low of $2,348.55. Over 24 hours that is a gain of 2.5 percent. Bitcoin added 1.5 percent over the same period, to $81,941.
On this one day, then, Ethereum was the stronger of the two. Over the week the picture turns around: ETH is down 4.7 percent on a seven-day view, BTC only 1.0 percent. On October 18 Ethereum stood at $2,400.31, today at around $2,400. In dollars, nothing has happened. Counted in Bitcoin, the ratio fell from 0.0295 to 0.0293 over the same stretch.
This difference is the reason the yardstick is kept at all. A sideways day in dollars can be a losing day against Bitcoin, and for anyone weighing the two coins against each other, the second figure is the one that decides.
Five weeks down: the path from September 13 to today
On September 13 the ratio reached 0.0327, its highest level in three months. It held just below that until the start of October, and on October 7 it still stood at 0.0315. From there it came down to 0.0293 in twelve days, a fall of 7.1 percent.
The sequence of daily values shows no single break but a chain of small losses: 0.0309 on October 8, 0.0303 on the 9th, 0.0301 on the 10th, 0.0299 on the 13th, 0.0297 on the 15th and 17th, 0.0295 on October 18. On no single day did anything collapse, and at the end of the series a three-month low is nevertheless within sight.
The range over the past twelve months
Over a year, the ratio moved between 0.0248 on June 7, 2026 and 0.0367 on October 21, 2025. Today's level of 0.0293 therefore sits 17.9 percent above the annual low and 20.2 percent below the annual high. The June low is a long way off, but the distance to the high is considerable.
0.0289 translated into dollars: $2,368 instead of $2,400
A ratio stays abstract until it is turned into a price. The calculation is simple: ratio times Bitcoin price gives the Ethereum price. With Bitcoin at $81,941, three points follow that are worth remembering as long as Bitcoin stays roughly there.
If the ratio falls to 0.0289 and therefore to the low of the past three months, that corresponds to an Ethereum price of around $2,368. That is a good $30 below today's level, and it sits close to the daily low of $2,348.55. If instead the ratio returns to the September high of 0.0327, Ethereum would be at around $2,679, which is 11.6 percent above today's level.
Both figures hold only if the Bitcoin price is unchanged. If Bitcoin rises, they shift upwards without the ratio having to move at all. This is the point where the two calculations part company and where it is decided which of them counts for you: if you think in euros, you need the dollar price; if you split your holdings between Bitcoin and Ethereum, you need the ratio.
Ethereum carries 17.8 percent of Bitcoin's market capitalisation
Behind the ratio sits a difference in size that shows up in the market data. Ethereum has a market capitalisation of $293.2 billion, Bitcoin one of $1,646.9 billion. Ethereum therefore carries 17.8 percent of Bitcoin's value.
The distance to the respective record highs also diverges. Ethereum stands 51.5 percent below its all-time high of $4,946.05 from August 24, 2025. Bitcoin is 35.0 percent below its high of $126,080 from October 6, 2025. Over twelve months Ethereum has lost 39.8 percent, Bitcoin 24.8 percent.
Daily turnover points the same way, if less clearly: $10.0 billion of Ethereum changed hands within 24 hours, against $27.9 billion of Bitcoin. Ethereum therefore accounts for 35.9 percent of Bitcoin's turnover while carrying 17.8 percent of its capitalisation. Measured against its size, Ethereum is traded more actively than Bitcoin.
Our view: the yardstick weighs more than the dollar price
In our editorial view, the more important figure of this day is not the Ethereum price of $2,400 but the ratio of 0.0293. The evidence above supports that: an identical dollar price against October 18, but a ratio down by two thousandths, plus 9.7 percentage points of distance over 30 days and a three-month low that lies 1.5 percent away. Anyone who held Ethereum rather than Bitcoin through these weeks is worse off, without the dollar price showing it.
Against that stands the length of the period. Five weeks are no trend in this market that could be extrapolated, and over twelve months the ratio still sits 17.9 percent above its June low. The move since September 13 also ran without a single break day, which points more to a slow drain of capital than to a reallocation on a specific trigger. This is an assessment and not a recommendation: both coins can lose considerably over a horizon of months.
Swapping Ethereum for Bitcoin: what the German holding period triggers
If you draw a conclusion from the ratio and swap Ethereum for Bitcoin, know first what that swap means for tax. In Germany, exchanging one cryptocurrency for another counts as a disposal of the first asset and an acquisition of the second. It is therefore not a mere reshuffle inside a portfolio but a transaction with tax consequences.
Two things follow. A gain on the Ethereum sold is realised at the moment you swap, even if not a single euro reaches your account. And the one-year holding period starts afresh for the Bitcoin received. If you have held your Ethereum for longer than a year and could therefore dispose of it tax-free, you lose that status for the swapped holding and have to earn it again over twelve months.
We have gathered the current state of the rules and what could change about them on our page on the crypto holding period. Which acquisition dates apply to your holdings is hard to answer without clean records; the common tools for that are in the comparison of crypto tax software. Neither replaces tax advice.
Where the trading pair is available at all
Not every platform available in Germany offers ETH/BTC as its own pair. Where it is missing, a switch runs through two transactions: Ethereum for euros, then euros for Bitcoin. That costs fees twice and the spread twice, and for tax purposes two transactions arise instead of one. Which providers carry the direct pair, and on what terms, is in the comparison of the best crypto exchanges. Check the fees with the provider before you trade, because the models change often.
The levels that count now
Below, the next documented level is 0.0289, the low of July 24 and the lowest level of the past three months. It is 1.5 percent away. Should the ratio break beneath it, the next stop is only the area around 0.0248, the annual low of June 7.
Above, the first area that counts is around 0.0315, where the ratio still stood on October 7 before the twelve losing days began. Beyond that follows the September high of 0.0327. Both levels come from the daily data of the past three months, not from a model.
For the dollar price itself, Monday's daily levels are the ones that matter: $2,443.80 as the high, $2,348.55 as the low. The daily low sits only $20 above the value that a ratio of 0.0289 would produce at an unchanged Bitcoin price. Both calculations therefore point to the same area, and that makes it the zone that decides the next few days.
To place the medium-term picture: on October 18 we set Ethereum's staking yield against the ECB rate in this space. The dollar price has not moved since, but the ratio to Bitcoin has given up another two thousandths. What the blockchain itself is delivering and what comes next is documented in the official Ethereum roadmap; the market data used here can be looked up at CoinMarketCap.
ETH/BTC at 0.0293: below 0.0289 the yardstick hits a three-month low
The ratio stands 1.5 percent above the low of July 24 and 10.4 percent below the high of September 13. Three steps follow from that for the coming days.
- Convert your holdings into Bitcoin once rather than into euros. Only that figure shows whether holding Ethereum has paid off against Bitcoin over the past five weeks. The levels for it are above.
- Look up how long you have held your Ethereum before you consider a swap. The rules are on our page on the crypto holding period, the record-keeping tools in the comparison of tax software.
- Check whether your platform carries ETH/BTC directly if you want to reallocate. Two transactions instead of one cost fees twice; the terms are in the exchange comparison.
(As of October 19, 2026. This article is not investment advice. Prices and fee structures change; check the terms with the provider before you buy.)
Ethereum trades at $2,396 on Monday evening. In euros that is €2,137, and the second figure is the one an investor in Germany works with when buying, selling or sorting paperwork for the tax office. Both numbers describe the same coin, yet they tell two different years: in dollars, Ethereum has lost 39.7 percent since October 20, 2025, in euros 37.5 percent. The gap of 2.2 percentage points comes from the exchange rate.
Ethereum price on Monday evening: $2,396 and €2,137
Against the previous day that is a gain of 1.3 percent in dollars and 1.5 percent in euros (market data from CoinGecko, as of Monday evening, October 19). The daily range ran from $2,329.53 to $2,443.80, a spread of $114 or almost five percent between low and high. Market capitalisation stands at $293 billion, with 122.15 million ETH in circulation.
The distance to the all-time high remains wide. On August 24, 2025, one ETH cost $4,946. From there to today, 51.6 percent is missing. Counted in euros the gap is slightly different, because the euro stood higher back then: €4,230 against €2,137 today, a fall of 49.5 percent.
The ECB reference rate: $1.1225 per euro
You do not have to estimate the conversion rate. The European Central Bank sets a reference rate on every bank working day at around 16:00 and publishes it free of charge. For Monday, October 19, 2026, it shows $1.1225 per euro. A week earlier, on October 13, it was 1.1188, and on October 16 it was 1.1253.
The reference rate is not a trading rate at which you can exchange money. It is a mid-market figure that the central banks of the Eurosystem set jointly, and it serves as a generally accepted yardstick for conversion. That is what makes it usable for records: it comes from a public body, it can be retrieved after the fact, and it is the same for everyone on any given day. The series is published on the ECB page on euro reference rates, and the Deutsche Bundesbank mirrors the same values.
Twelve months in two currencies: 39.7 against 37.5 percent
On October 20, 2025, ETH traded at $3,982 and €3,420. The conversion rate then stood at $1.1643 per euro. Since then the dollar has gained 3.7 percent against the euro, from 1.1643 to 1.1225. A loss in dollars therefore comes out slightly milder once it is converted into euros.
The same effect shows over thirty days, only weaker: in dollars the decline is 8.1 percent, in euros 6.0 percent. Over seven days the relationship even reverses. There ETH lost 5.3 percent in dollars and 5.5 in euros, because the euro firmed again over that single week. The currency effect runs in both directions, and over short periods it is small. Only over months does it grow into a figure you can see on a tax return.
Two annual lows on two different days
The annual low shows how far the two calculations can drift apart. In dollars it was $1,566.01 and fell on June 26, 2026. In euros it was €1,361.52, and that day was June 7, 2026. Nineteen days separate the two troughs.
That is the mechanism behind the whole calculation. A euro investor holds two positions at once, even if only one was bought: Ethereum, and, through the dollar pricing on crypto exchanges, a currency position. The two move independently. In June the euro was strong, so the lowest point reached the euro investor earlier than the one counting in dollars.

What has changed since Friday
On October 16 this space carried an article on the withdrawal of 430,000 ETH from Binance's reserves, at a price of $2,412 at the time. Little has happened since, and that is the real story: $2,440 on Friday, $2,396 on Monday evening, a fall of 1.8 percent over a weekend. In euros it is €2,176 against €2,137, also 1.8 percent, so here both calculations run in step.
The $2,400 level, which had held on Thursday and Friday, broke on Sunday and was won back during Monday's session. Against Bitcoin, ETH stands at 0.02933, with Bitcoin itself at $81,821.
The daily low met the 90-day average
The low of the day was $2,329.53. The average of the past ninety trading days is $2,330.24. Seventy-one cents separate the two values. A moving average is simply the mean of the most recent closing prices, and it becomes interesting where many market participants see the same line on the chart and place their orders accordingly. Today the line held.
In euros the same ninety-day average sits at €2,033. The current price of €2,137 stands 5.1 percent above it, while in dollars the distance is only 2.8 percent. For an investor who has noted entry prices in euros, the buffer to the line is therefore almost twice as far away as for one watching the dollar chart. If you set alerts, know which currency the threshold refers to. For an overview of which tools keep both currencies cleanly, see our comparison of tax software and portfolio trackers.
How to work out the euro value for Annex SO
Private disposals are governed by section 23 of the German Income Tax Act. The taxable gain is the difference between the sale price and the acquisition cost, less the related expenses. Both amounts belong in Annex SO in euros, even if the exchange settled in dollars or Tether.
Getting there takes three steps. First, note the date and the time of every purchase and sale, not just the month. Second, obtain the reference rate for that date and use it to convert the dollar amount into euros. Third, file the evidence of the rate together with the transaction statement, so the figure stays verifiable if it is ever questioned. If you bought in euros through a German account, you can skip the second step, because the euro amount is already on the statement.
A worked example from the figures in this article: buying one ETH on October 20, 2025 at $3,982 came to exactly €3,420 at a rate of 1.1643. Selling today at $2,396 brings around €2,134 at 1.1225. The loss is €1,286. Taking the dollar amounts at face value and converting only at the end would give €1,413, which is €127 too much.
The holding period runs to the day
Under section 23, a gain from a private disposal stays tax-free if more than a year lies between acquisition and sale. That period counts to the day and not by calendar year. If you bought ETH on October 20, 2025, you have been outside the period since October 21, 2026, which is the day after tomorrow. With a loss that is bad news: hold for longer than a year and the loss can no longer be offset against other disposal gains.
This is where the euro calculation becomes practical. Whether a sale inside the period produces a gain or a loss is decided by the euro amounts, not by the dollar figures on the trading screen. With an exchange-rate move of 3.7 percent over a year, a small dollar gain can turn into a loss in euros, and the other way round. How far the planned reform of the holding period has progressed is set out in our continuously updated status on the crypto holding period.

The levels above and below
Above, the first documented level is Friday's close at €2,176, or $2,440. Beyond it lies the daily high of $2,443.80, which was rejected twice today. Only above that does the way open into the range in which ETH traded in mid-October.
Below, the first level that counts is today's low at $2,329.53, because that is where the ninety-day average runs. In euros that is around €2,075. Should that line break, the next justified level is the average in euros at €2,033. The annual low of $1,566 is far away and plays no part on a daily view.
Our view on the euro calculation
In our editorial view, German investors systematically underestimate the currency effect, because practically every price display runs in dollars. The evidence is above: 2.2 percentage points of difference over twelve months, 2.1 over thirty days, two annual lows nineteen days apart, and a worked example in which €127 of difference appears. Against that, the effect stays small on a weekly view and even reverses, as the past seven days show. For short-term trades it is therefore secondary.
If you hold for months, run savings plans or prepare a tax return, count in euros from the start. That is not a recommendation for or against buying, but a question of bookkeeping. Where things can go on a horizon of months is something we assess regularly in our forecast.
Ethereum in euros: below €2,033 the 90-day average gives way
Three steps that follow from the figures in this article:
- Check which currency your entry prices are recorded in. If they are in dollars, convert them once with the reference rate for the respective purchase date. Then you know whether a position is actually down in euros.
- Compare the fees and the euro deposit options at your exchange. Trading directly in euros saves the conversion and puts the euro amount straight into the statement. Which providers show this cleanly is set out in our comparison of crypto exchanges.
- If you stake, those rewards are a separate item and are valued in euros at the time of receipt, not at the time of sale. The terms and the payout intervals of the providers are in our overview of staking platforms.
(As of October 19, 2026. This article is not investment advice. Prices and fee structures change; check the terms with the provider before you buy.)
Seventy-six minutes passed between the unauthorised mint and the freeze, and in that time the damage was already done. On Saturday, October 17, 2026, at 12:31:38 UTC, ten million CYS came into being on BNB Smart Chain without anyone having deposited a single token. The Cysic Foundation added the recipient address to the token contract's blacklist at 13:47:52 UTC. By then, 7.2 million of the new tokens had already left the address, around 72 percent of the mint.
The bridge the attack ran through has been switched off since, and the foundation has named no date for a restart. For holders that is the real point: what decides the fate of the rest of a position is not the price swing but the question of which blockchain your own tokens sit on and who is allowed to create them there.
What happened in the 76 minutes between mint and blacklist
The chronology can be read off the movements on the blockchain, and it is tightly timed. Five minutes after the mint, at 12:36 UTC, the first selling round began: 5.65 million CYS went out within five minutes for 588,315 USDT, at an average of about ten cents per token. At 12:44 UTC, 100,000 USDT left the setup through a bridging service, and a minute later 40.88 ETH arrived on Ethereum.
At 12:53 UTC, 488,315 USDT followed in six transfers through another service. Between 12:57 and 12:59 UTC the second selling round ran, with roughly 1.55 million CYS that brought in about 220 BNB. Shortly afterwards, between 13:05 and 13:06 UTC, 80 and 139 BNB were withdrawn by two different routes. At 13:11 UTC a second wallet received 306.52 ETH in five transfers. The industry service Cryptopolitan traced this sequence from the transactions on October 18.
By the time the blacklist took effect at 13:47:52 UTC, the address had sent no tokens for 48 minutes. The freeze therefore only bit once the outflow was long over; all it caught was the remainder left behind.
Unauthorised mint: how ten million CYS arose with no deposit
A mint is the creation of new tokens by a smart contract. On a cross-blockchain bridge, that process is normally tied to something given in return: anyone wanting to move tokens from one blockchain to another locks the original on the source blockchain, and only then does the contract create a representation on the destination blockchain. That representation is called a wrapped token and is nothing other than a voucher for the locked original.
It is precisely that coupling that broke here. According to the Cysic Foundation's report, published on October 18, 2026 on the @cysic_fdn account, the attacker gained unauthorised access to a database serving services around the bridge operation. They then used a weakness in the processing of messages to submit a forged mint instruction that bypassed the check. The foundation explicitly describes these findings as preliminary; the definitive cause has not yet been confirmed.
What arose in the process were not duplicates of existing tokens but ten million units with no backing whatsoever on the source blockchain. The voucher existed, the collateral behind it did not.
The cause according to the Cysic Foundation: access to a bridge database
The foundation draws a clear boundary around the incident in its report. Affected was solely the processing of bridge messages and the creation of tokens. Consensus, block production and smart contract execution on the Cysic mainnet remained untouched, it says, and existing user balances were not stolen.
That distinction matters, and reports on incidents often blur it. An attack on a bridge hits the accounting between two blockchains, not users' wallets. If your tokens sit under your own keys, nothing was taken from you. Hold wrapped tokens, by contrast, and you hold a claim whose backing has just deteriorated.

6.22 percent more in circulation: what the mint does to supply
The scale only becomes clear in relation to the existing stock. Around 160.8 million CYS are in circulation out of a maximum supply of one billion. Ten million additional tokens therefore amount to 6.22 percent of circulating supply, created on a Saturday lunchtime in a little over a minute. At the price of $0.1113 at which CYS stands on October 19, 2026, the mint has a value of roughly $1.11 million.
What is decisive here is the ratio to market depth. Total daily turnover in CYS runs to about $1.75 million. The 7.2 million tokens sold come to around $801,000 at today's price, close to half of a full trading day. Selling pressure of that size cannot be absorbed in a market of that depth without the price giving way.
The price itself shows how little cushion there is. CYS reached its high of $1.78 on August 15, 2026, and its low stands at $0.1063. At $0.1113 the token trades 4.7 percent above that low and 93.7 percent below the high.
Blacklist in the token contract: why 2.8 million CYS are stuck and 306 ETH are not
A blacklist is a function in the token contract with which the operator can bar individual addresses from sending and receiving. Here it froze around 2.8 million CYS, the 28 percent of the mint that still sat on the recipient address.
The reach of that freeze, however, ends exactly at the token. It applies to CYS on BNB Smart Chain and nowhere else. By that point the proceeds had already been swapped into USDT, BNB and finally a total of roughly 306.6 ETH and moved to Ethereum, which at an ether price of about $2,372 on October 18 corresponded to a value of around $727,000. The blacklist does not reach those funds.
For judging a token, that means two things. A blacklist function can save what has not yet been moved in the event of damage, and in this particular case it was useful. At the same time, its existence means a central party can decide at any time how freely your own tokens can move.
Wrapped tokens and bridge risk: what a bridged token really is
Move a token across a bridge to another blockchain and you exchange a property right for a claim. On the destination blockchain you hold a representation whose value depends on the original staying locked on the other side and on nobody being able to create further representations without backing. Both hang on the technology and on the bridge operator's keys.
A hardware wallet offers no protection against this kind of damage. The device keeps the private key such that nobody can take tokens out of your wallet. That does not help against a dilution of supply on the destination blockchain, because the attack does not go after your key at all. Which devices solve that task how, and where the differences in handling lie, is set out in our hardware wallet comparison.
The second way around this risk is to do without the bridge. Hold a token on its source blockchain, or leave it with a provider that takes on custody, and you carry other risks, but not this one.
CYS on 13 venues: not a single euro pair
For investors in Germany, where a token can be had at all is part of weighing the risk. cryptoticker.io compiled this survey itself on October 19, 2026. It is based on the 15 trading pairs CoinGecko lists for CYS, spread across 13 venues.
The result: not one of those 15 pairs is against the euro. Nine run against the dollar stablecoin USDT, one against Bitcoin, one against the South Korean won, and the remaining four against stablecoins directly on BNB Smart Chain. The largest single venue by turnover is in South Korea. The two decentralised venues on BNB Smart Chain account for 816,538 of the $3.01 million in total daily turnover, or 27.1 percent.
In practice that means: anyone wanting to buy CYS goes either through an exchange outside the European Union or through a decentralised venue on precisely the blockchain where the mint took place. Buying in euros from a provider that falls under the European MiCA regulation and uses its authorisation in Germany is currently not an option for this token. Which providers hold that authorisation and what it means for you is set out in the overview of regulated crypto exchanges.

$700 million through bridges: Cysic in the 2026 annual tally
The incident does not stand alone, and that can be quantified. cryptoticker.io compiled this survey itself on October 19, 2026, on the basis of the 299 incidents DefiLlama records for 2026. Together they account for $2.25 billion in damage.
Of those, 32 incidents involve bridges and cross-blockchain procedures, with damage of $700.1 million between them. Seventeen incidents concerned the unauthorised creation of tokens, the same mechanism as at Cysic, totalling $349.2 million. The largest single case of that kind hit Liquid Network in September with $320 million.
The Cysic case is a small one in that series. What makes it instructive is the speed: 35 minutes passed between the first forged message and the proceeds flowing out onto another blockchain. How hard such gaps are to find in advance was broken down in our piece on the scope of crypto audits. A similar case hit the routing of Bitcoin across another bridge in October, covered in our report on the Symbiosis exploit.
Mint rights, blacklist, backing: what can be read off the token contract
Three properties of a token contract determine how large this risk is for a particular position, and all three are publicly visible.
The first is the mint right. In any block explorer, the verified contract shows whether a mint function exists and which address may call it. If it hangs on a single address, that address's security determines the supply. If it hangs on a multi-signature contract, the bar is higher.
The second is the blacklist. Where it exists, the operator can immobilise addresses, to holders' benefit in the event of damage and to their detriment in a dispute. Both belong in the assessment.
The third is the backing. With a bridged token, the supply on the destination blockchain can be compared with the balance locked on the source blockchain. Where one diverges from the other, there are representations without collateral. That difference was precisely the damage on October 17.
Documenting losses: what to evidence in the event of a total loss
Anyone affected by an incident like this needs evidence first, regardless of how the case turns out. German tax law treats gains from the sale of crypto assets as a private disposal, in which the one-year holding period and the exemption threshold play a role. How a loss from a theft or from a token that has become worthless is to be classified in an individual case depends on the facts and belongs with a tax adviser; there is no blanket answer for it.
Independently of that, the evidence can be secured: transactions with timestamps and addresses, acquisition costs, the price level at the time of the incident, and the project's own publications. Tools that record such events across several exchanges and wallets are set out in the comparison of tax software and portfolio trackers. The later such documentation is put together, the more gaps it will have.
How things proceed at Cysic and which dates remain open
The foundation has announced a second report covering the verified scale of the damage, the tracing of the funds and the countermeasures. There is no date for it. Equally open is when the bridge will run again; the condition the foundation names is the completion of a security review, for which it has brought in an external firm.
Until then the route between the Cysic mainnet and BNB Smart Chain stays closed. Trading in CYS on BNB Smart Chain itself continues, as does trading on the exchanges that list the token. What remains open is how the 2.8 million frozen tokens and the supply that has grown by 6.22 percent will be handled. Whether and how the additional tokens will be taken out of circulation again, the foundation has not so far said.
Cysic bridge: without a restart the route to BNB Chain stays shut
Three steps make sense now, and in this order:
- Check which blockchain your tokens sit on. For every bridged balance the rule holds: the representation is worth only as much as its backing. A balance held under your own keys is protected against theft, not against dilution. Which device suits you is shown in the hardware wallet comparison.
- Look at the contract's mint rights before you buy more. A single address with a mint right is a risk that can be established in two minutes in a block explorer. For anything you want to buy in euros from an authorised provider, the overview of regulated crypto exchanges sets the frame.
- Document every position before the situation clears up. Acquisition costs, dates and price levels belong on record while they can still be retrieved. The tools for that are in the comparison of tax software.
(As of October 19, 2026. This article is not investment advice. Prices and fee structures change; check the terms with the provider before you buy.)
The stablecoin USD1 has shrunk by roughly $401 million in two weeks. Its market capitalisation fell from about $4.43 billion on October 6 to around $4.02 billion, a drop of 9.1 percent. The dollar price held steady throughout: the token traded consistently between $0.998 and $1.000. What shrank, then, was not the price but the number of tokens in circulation.
Who triggered that decline is the striking part. According to an analysis by the blockchain research outfit Onchain Benchmark, just under $200 million of the redemptions trace back to a single address whose owner is unknown. For holders in Germany, a practical question hangs on this: what rights do you have against the issuer when a stablecoin shrinks quickly?
What happened to USD1 between October 6 and October 19
USD1 is a dollar-pegged stablecoin issued by World Liberty Financial. A stablecoin of this design holds its price through deposited reserves rather than an algorithm: for every token issued, a dollar or a dollar-like asset is meant to sit with the issuer.
Between October 6 and October 19, 2026, market capitalisation fell by about $401 million according to CoinGecko data. World Liberty Financial's proof-of-reserves dashboard showed roughly $4.01 billion in reserves over the same period, a figure close to the reported market capitalisation. CoinGecko data put USD1 at $0.9990 on October 19, 2026, with a market capitalisation of $4.01 billion and daily turnover of around $958 million.
For a sense of scale: Tether (USDT) stood at roughly $183.5 billion the same day, USDC at about $72.3 billion. At four billion dollars, USD1 is a mid-sized stablecoin, where a single withdrawal of several hundred million dollars lands hard in percentage terms.
$184.60 million on Ethereum: 63 burns through the BitGo wallet
When a stablecoin is redeemed, the returned tokens are destroyed. That process is called a burn: the issuer takes the tokens out of circulation and pays out from the reserve in exchange. Every burn is visible on the blockchain, and that is precisely how a decline can be recalculated.
On Ethereum, Onchain Benchmark counted net redemptions of $184.60 million between October 6 and October 15, spread across 63 burns. USD1 circulation on Ethereum fell 11.45 percent over those nine days. More than 99 percent of the tokens submitted for redemption ran through a wallet labelled as BitGo, according to that analysis. BitGo is currently the issuer and custodian of USD1.
63 burns over nine days works out at an average of around $3 million per transaction. The picture on Ethereum is therefore one of a broader return by many participants, not of a single exit.
$200.43 million on BNB Chain: a single address behind nearly all of it
On BNB Chain the distribution looks entirely different. There, Onchain Benchmark recorded $200.43 million in redemptions over the same period, but only 12 burns. Just under $200 million of that came from a single address, which returned tokens in tranches of $30 million to $50 million.
Who controls that address, and why the tokens were returned, the research outfit says it could not establish. That is an important caveat: a large return could be a market maker reshuffling holdings, an exchange holding client money differently, or a fund getting out. Blockchain data alone cannot separate those cases.
Why circulation was not merely shifted between blockchains
With a token that exists on several blockchains, the first cross-check is always the same: has the balance really disappeared, or has it just moved? USD1 runs on Ethereum, BNB Chain and Solana, among others.
Onchain Benchmark puts cross-blockchain transfers between Ethereum and BNB Chain at less than $1 million over this period. On Solana, the USD1 balance stayed at around $1.42 billion across the nine days examined, so nothing new was issued there to offset the redemptions either. The decline is therefore a genuine reduction in circulation, not a relocation.

The dollar price held: $0.998 to $1.000 over nine days
The real stress test for a stablecoin is its price, not its size. When a token meant to be a dollar falls persistently below a dollar, that is called a depeg, and at that point a means of payment turns into a risk asset.
That did not happen here. Onchain Benchmark found no sustained depegging over the period studied; the price moved between $0.998 and $1.000. That a return of several hundred million dollars was processed with no visible price effect suggests the reserves were available at that scale.
USDC, USDT and USDe over the same period: the comparison on Ethereum
An 11.45 percent decline on Ethereum says little on its own. It only becomes interesting next to the other large dollar tokens over the same window. For October 6 to 15 on Ethereum, Onchain Benchmark reports the following changes: USDe lost 4.93 percent, USDC 2.18 percent, circulating USDT 0.76 percent.
October was therefore a month of outflows for several dollar tokens, but USD1 sat well clear of the field. Part of that is the arithmetic of the smaller number: for a token worth four billion dollars, a $200 million withdrawal weighs more than it does for one worth $183 billion.
Burn, redemption, proof of reserves: the terms in brief
Redemption means a holder submits tokens to the issuer and receives money for them. Burn is the technical part of that: destroying the submitted tokens on the blockchain. Proof of reserves is a disclosure by the issuer of which assets it holds as backing.
A proof-of-reserves dashboard is not, however, an audit by an independent accountant. It shows what the issuer reports as backing, and it says nothing about what liabilities sit alongside it or how quickly those assets would turn into cash. Anyone wanting to judge how robust a stablecoin is therefore reads both side by side: the reported backing and the conditions under which the issuer actually pays out.
MiCA and the redemption right under Article 49: what applies to USD1 in Germany
For holders in Germany it is the European MiCA regulation that decides, not US law. It treats stablecoins pegged to a single currency as e-money tokens. Article 49 of MiCA obliges the issuer of such a token to redeem it at any time, at par and free of charge. Article 50 also prohibits paying interest on e-money tokens.
That claim depends on authorisation. As the ESMA register stood on September 30, 2026, USDC and EURC are authorised as e-money tokens, issued by Circle Internet Financial Europe and supervised by France's ACPR. For USDT and USD1 there is no register entry. Which stablecoins are listed with which MiCA status is tracked continuously in our overview of stablecoins with MiCA status.
In practice that means: if you hold USD1, your redemption follows the issuer's terms and not the European claim to par value. What obligations authorisation brings with it, and how to recognise an authorised provider, is covered in our overview of MiCA licensing duties for crypto companies.

Concentration risk: when a few large holders carry the size
The finding on BNB Chain describes a pattern that appears more often with young stablecoins: a substantial share of circulation sits with a few addresses. Twelve burns for $200 million means a handful of large participants exited here, not a mass of retail holders.
For small holders no immediate loss follows from that, as long as price and reserves hold. A dependency does follow, though. When a large holder withdraws, the token's liquidity on trading venues falls, trading pairs thin out, and spreads can widen. Anyone using a stablecoin as a parking position between two purchases notices that first when selling.
The switch of issuer to the trust company: the next test
Onchain Benchmark points to a step ahead: "The next tests come with the change of issuer." World Liberty Financial has announced that a trust company of its own is to take over the issuance of USD1. The research outfit reads that as meaning this company would take on a token whose size depends on a few large holders, and do so under a charter whose legal basis is being litigated. The report gives no date for the opening.
A change of issuer is no marginal formality for holders. With it come a different counterparty, a different custodian and a different supervisor, and therefore a different address against which a redemption claim is directed at all. The background on the trust company and the open questions is set out in our piece on the World Liberty Financial US Trust Bank.
What is established and what remains open
Established is the order of magnitude: roughly $401 million less in circulation, $184.60 million of redemptions on Ethereum, $200.43 million on BNB Chain, a stable price between $0.998 and $1.000, reported reserves of around $4.01 billion.
Open is the cause. Neither who controls the large address on BNB Chain nor why tokens were returned there is known. No accusation against the issuer follows from a decline in circulation alone: redemptions are the intended way to leave a stablecoin, and that they worked without breaking the price is, for now, a sign that the mechanism held. Reading more into it would require information that nobody currently has in public.
USD1 in Germany: no MiCA entry, no claim under Article 49
Three steps make sense now if you hold dollar stablecoins:
- Check the authorisation status of your stablecoins. What matters is whether the token is listed in the register as an e-money token, because the claim to par value under Article 49 hangs on that. The status per token is in the stablecoin overview with MiCA status.
- Check which provider you hold through. A service provider authorised in the EU is subject to rules on segregating client funds and on custody. Which houses hold an authorisation is shown in the comparison of regulated crypto exchanges.
- Weigh holding period against risk. For brief parking between two purchases, liquidity counts; for longer holding, the legal framework counts. Anyone holding larger balances over longer periods should factor in custody away from the exchange; the differences are set out in the hardware wallet comparison.
The figures in this report come from the Onchain Benchmark analysis published on October 19, 2026, and from CoinGecko market data of the same day. They can be read in the Cointelegraph report and at Onchain Benchmark.
(As of October 19, 2026. This article is not investment advice. Prices and fee structures change; check the terms with the provider before you buy.)
The XRP Ledger reported transfers worth $49.66 billion on Monday. That is 60.4 percent of XRP's entire market value, moved in a single day. On exchanges, $1.47 billion changed hands over the same 24 hours, one thirty-third of that figure. The fees the network withheld and destroyed for the whole movement come to roughly $664.
XRP traded at $1.30, or 1.16 euros, on Monday evening, after a daily low of $1.26 and a high of $1.32. Which ranges are in play at all over a horizon of months is set out in our XRP price prediction. This piece takes on the number that ran through Monday's market reports and works out what it says about demand. The answer is a sober one.
$49.66 billion in a day: what Santiment measured
The figure comes from the data service Santiment and was circulated on Monday morning by the analyst account Ali Charts. What it measures is the dollar value of all coins that moved from one address to another on the blockchain within 24 hours. Santiment itself calls the spike anomalous.
What matters is what this metric is not. It is not a trading volume. It does not count purchases or sales. What is added up are amounts that changed their place on the blockchain, regardless of whether an owner changed with them. An exchange moving 2 billion XRP from a hot to a cold custody address generates a billion-dollar figure in this statistic without a single investor having bought anything.
For a sense of the orders of magnitude: XRP's market value stood at $82.16 billion on Monday evening, with 63.13 billion XRP in circulation out of 99.99 billion in total. A transfer volume of $49.66 billion therefore claims that a good three fifths of all existing XRP changed place within a single day.
$664 in fees: what the movement cost the network
This is where a cross-check is possible, using numbers that come straight from the blockchain. Every transaction on the XRP Ledger carries a fee, and that fee goes to no one: it disappears from the total supply. The total supply appears in every closed ledger in the total_coins field. The difference between two ledgers is therefore the sum of all fees paid between them.
In ledger number 107,765,823, closed on Monday evening, the value reads 99,985,589,187.52 XRP. In ledger 107,739,858 from Sunday afternoon it still stood at 99,985,589,698.40 XRP. Between the two lie 25,965 closed ledgers and a difference of 510.88 XRP. At Monday's price of $1.30, that is $664.
Measured against the claimed transfer volume, that means the network collected $13.37 in fees for every $1 billion the statistic says was moved. That is precisely why transfer volume grows so easily on this blockchain. Shift $10 billion between two addresses you own and you pay fractions of a cent for it. It is not expensive, and for that very reason it is not meaningful either.
The network's base fee is 0.00001 XRP per transaction. In practice more is due, because the fee rises under load. The 510.88 XRP across 25,965 ledgers works out at an average of 0.0197 XRP per ledger. Every one of these values can be looked up in the public XRP Ledger explorer.
Why a high transfer volume says nothing about demand
The mechanism behind it takes three sentences. A purchase happens on an exchange, in the order book, and it shows up in spot turnover. Nothing of it appears on the blockchain at first, because the exchange rebooks internally. Only when someone withdraws their XRP does a transfer arise, and that then says something about custody, not about demand.
The reverse holds too. The largest items in a transfer statistic typically come from four sources: exchanges reshuffling between their own addresses, market makers balancing their holdings across several venues, custodians consolidating client balances, and individual large holders redistributing their positions. None of those four movements is a buy order.
Spot turnover, by contrast, is the number that counts when demand is the question. It stood at $1.47 billion on Monday, 68 percent above Sunday's $872 million. That is a genuine increase, and it is the real news of the day. It is simply 33.8 times smaller than the figure that ran through the reports.
How to look up the total supply on the XRP Ledger yourself
Anyone with a spare minute can follow the calculation above. In the XRP Ledger explorer, pick a confirmed ledger and find the total_coins field in the data set. The value is given in drops, that is millionths of an XRP. Separate six digits from the end and you have the amount in XRP.
Take the same value again 24 hours later. The difference is the amount of XRP destroyed by fees over that period. Nothing more is needed to place a volume report: if a supposedly enormous movement is matched by a fee total in the tens or hundreds of dollars, the movement was cheap and therefore no evidence of demand.
Two further values are worth a look, because they determine the cost of running your own address. The base reserve is 1 XRP, currently around $1.30. Every additional entry in an address, such as a trust line for a token, ties up a further 0.2 XRP. These amounts are not lost, but for as long as the address exists they are locked and cannot be transferred.
Hold through an exchange instead and you pay no network reserve but trading and withdrawal fees, and those differ widely. What each provider charges in Germany is set out in our crypto exchange comparison.
11.81 billion XRP sit on exchanges
Against Monday's friendly reading stands a second number. XRP reserves held on exchanges reached a local high of 11.81 billion XRP, according to the day's market reports. Measured against the 63.13 billion XRP in circulation, that is 18.7 percent.
That amount sits where selling happens. It is not a sell signal, because holdings on exchanges can equally sit there for years. It is, however, the ceiling on what can hit the market at short notice, and it has just risen rather than fallen.
One caveat belongs with it, because it is often missing. Exchange reserves are estimates. They are arrived at by data services assigning addresses to particular venues. If an address is assigned wrongly or not at all, the figure shifts. As a direction it is reliable; as an exact balance it is not.

ETF inflows break after 13 weeks
The third number comes from the fund side, and it is the most uncomfortable. In the week to October 16, US spot ETFs on XRP recorded a net outflow of $1.84 million, according to SoSoValue data. That ends a run of 13 inflow weeks that had been going since the start of July.
A single day accounts for most of it. Canary Capital's XRPC fund saw $2.47 million leave on October 16. Without that session the week would have stayed positive on the same reports. The funds' net assets stand at roughly $1.47 billion, down from about $1.57 billion a week earlier, a decline of 6.4 percent.
The outflow is small compared with a market value of $82 billion. Its significance lies in the sign. For 13 weeks the fund side was the reliable buyer, taking up material regardless of the daily news. That reliability is gone for now, and it is missing in precisely the week in which exchange reserves are rising.
$1.26 and $1.32: Monday's levels
Two documented levels emerge from the daily data. The daily low of $1.26 sits 3.1 percent below Monday's price and marks the point where buyers stepped in during the morning. The daily high of $1.32 is the other side. For as long as the price stays between the two, Monday is a recovery day within a weak week and nothing more.
The longer lines support that reading. Over seven days XRP is down 5.5 percent, over 30 days 9.8 percent, and it remains 64.4 percent short of its record of $3.65. Monday's jump changed none of those figures.
A third level appears in the day's market reports, and it is explicitly not ours. The chart analysis there sees a target of $1.80 to $2.00, but only above $1.56. That is 20 percent away, and for as long as the gap exists, the target is a condition rather than an expectation.
What has changed in the numbers since Sunday
On Sunday this space worked through the supply side, namely the fee burn against the escrow release. XRP stood at $1.29 then, and $1.28 was named as the decisive level. That level held. The price now sits 0.6 percent higher.
Two things have been added since. First, the 510.88 XRP the network destroyed across the 25,965 ledgers since Sunday afternoon, which puts the total supply at 99,985,589,187.52 XRP. Second, Monday's volume report, which bears no relation in scale to the fee total, and which is exactly why it has been recalculated here.
Unchanged is the date that governs the supply side in November. On November 1 the escrow contracts open and release 1 billion XRP. Against that amount the burn since Sunday is negligible, and Monday's transfer volume changes nothing about it either.

What German investors can actually buy
The ETF figures in the section above refer to spot funds listed in the US. For retail investors in Germany these funds are not the route in, because they are not approved for distribution here. Read those numbers and you are reading demand you are not part of. As a sentiment gauge they remain useful nonetheless.
In practice two routes remain in Germany. The first is buying the coin directly from a provider with a MiCA licence, with the option of taking the holdings into your own custody afterwards. The second is exchange-traded notes on XRP, which run through a securities account. The two routes differ on three points, and those are worth laying side by side before you buy.
First, the legal nature. A spot purchase makes you the owner of the coin. A note is a claim against an issuer, even when it is collateralised, and it therefore carries that issuer's default risk. Second, the running costs: trading fees and spread against the paper's annual management fee. Third, custody: with the coin you can choose between exchange custody and your own keys, with the paper you cannot.
The editorial team's assessment
Our assessment: Monday's transfer volume is not a buy signal, and anyone selling it as one has not done the arithmetic. The evidence is above and can be checked: $664 in fees for a supposed $49.66 billion of movement, spot turnover of $1.47 billion, exchange reserves at a local high of 11.81 billion XRP, and a fund week that comes out negative for the first time after 13 positive ones.
What argues against our reading belongs here too. Spot turnover rose 68 percent against Sunday, and liquidations in the futures market stayed small at $5.75 million according to the day's reports. That combination suggests Monday's recovery really did come from the cash market rather than from forced position closures. It is a genuine argument. It only supports the $1.47 billion, not the $49.66 billion.
XRP at $1.30: $664 in fees does not carry a rally
Monday evening's picture can be worked through in three steps:
- Recalculate the number itself. Before a volume report justifies a buying decision, compare it with the same day's spot turnover. Which tools report such data is shown in the comparison of analytics platforms.
- Settle the custody question. When 18.7 percent of the circulating supply sits on exchanges, whether your holdings need to sit there too is not a theoretical question. The devices and how they differ are set out in the hardware wallet comparison.
- Document the purchases. Purchase date, amount and price per tranche belong on record before the number of tranches gets out of hand. What automates that is covered in the comparison of crypto tax software.
(As of October 19, 2026. This article is not investment advice. Prices and fee structures change; check the terms with the provider before you buy.)
Decrypt
Anthropic committed 5% of its shares to a public benefit fund, and within hours Elon Musk promised a SpaceX share to every American child.
XRP developers published a second amendment to repair the ledger’s new uncollateralized lending feature while the original still awaits validator approval.
Hobbyists are booting iOS 16 on Xiaomi and Nothing phones and posting the proof. It barely works, but it suggests Apple's software is no longer welded to Apple's hardware.
Unveiled at Money20/20, the API-based tool combines payment and blockchain intelligence to flag fraud, scams and sanctions exposure before funds move on-chain.
Nine companies, including Verizon, Broadcom and UnitedHealth, have objected to having their shares traded on the planned OKX-ICE tokenized stock venue.
U.Today - IT, AI and Fintech Daily News for You Today
Solana has recorded a massive 104% increase in non-vote transactions, processing a staggering 8.92 billion transactions in Q3 2026 compared to Q4 2025.
Hyperliquid claims the SEC’s new crypto framework contains critical flaws that trap Web3 developers, demanding five immediate fixes.
XRP has finally launched its official X account after more than a decade, drawing a warm welcome from Ripple CEO Brad Garlinghouse and quickly attracting over 21,000 followers.
Solana clinches a landmark 1.4 million equity holders milestone, exposing a massive new divide on the RWA market $SOL.
XRP exchange reserves have surged to 11.81 billion tokens, nearing the highest level this year as Binance traders reduce leverage and whale activity weakens.
Blockonomi
TLDR
- Alphabet (GOOG) stock closes 0.96% higher at $340.16, then adds 0.13% after hours.
- AIBotics acquires NovaCore assets to expand its AI mapping operations in Jamaica.
- NovaCore’s assets include 10 service robots, six drones and Google mapping tools.
- AIBotics outlines a $3 million earn-out tied to four revenue growth milestones.
- NovaCore plans wider LiDAR mapping, drone services and technical skills training.
Alphabet (GOOG) stock gained 0.96% to close at $340.16 on Monday, October 19, before rising 0.13% to $340.60 after hours. Meanwhile, AIBotics completed its acquisition of NovaCore Labs assets, expanding its AI mapping and robotics operations in Jamaica. The transaction includes equipment previously used in Google Street View mapping projects and supports broader Caribbean technology expansion.
Alphabet Inc., GOOG
AIBotics Acquires NovaCore Assets to Expand Caribbean Operations
AIBotics acquired NovaCore Labs operating assets from PlayJamaica Limited through an asset purchase agreement. The acquisition strengthens its presence in Jamaica and establishes a platform for regional technology services. Furthermore, the company plans to expand operations across the Caribbean Community, known as CARICOM.
The acquired assets include 10 service robots, six commercial drones, and three field generators. AIBotics also obtained Google Street View mapping equipment, a dedicated mapping vehicle, and proprietary operating methods. These resources support commercial mapping, robotics, drone services, and digital infrastructure projects.
The Caribbean Economic Outlook 2026 estimates regional economic output at approximately $420 billion. It also projects average real GDP growth of 3.4% across major regional economies. Consequently, AIBotics plans to pursue commercial opportunities across public institutions, private businesses, and technology services.
NovaCore Targets AI Mapping and Drone Service Growth
NovaCore previously participated in Jamaica’s Google Street View mapping initiative through its geospatial technology operations. The company now plans to expand those capabilities using artificial intelligence and LiDAR technology. Its proposed services include infrastructure analysis, surface classification, and digital asset management.
NovaCore intends to expand commercial drone services across selected industries and institutional markets. The acquired equipment and software will support field operations, automation projects, and customer deployments. Additionally, the company plans to develop its technical laboratories for demonstrations and operational support.
NovaCore also maintains relationships with the University of Technology and the University of the West Indies Global Campus. These partnerships support technical training, demonstrations, apprenticeships, and workforce development programs. The company plans to strengthen these initiatives while expanding regional expertise in robotics and mapping technology.
AIBotics Outlines Acquisition Terms and Revenue Targets
AIBotics issued 22,500 Series B preferred shares with an aggregate stated value of $225,000 for the acquired assets. The agreement also includes potential additional consideration worth up to $3 million over four years. However, NovaCore must achieve specified cumulative revenue milestones to qualify for those payments.
The revenue targets stand at $500,000, $1.5 million, $3 million, and $5 million. Each achieved milestone triggers $750,000 in additional preferred-stock consideration under the agreement. Meanwhile, Gregory Moore will lead the acquired operations as president of the operating subsidiary.
AIBotics and Moore also plan a budget targeting $1 million in capital deployment over 12 months. The spending plan will support operational expansion, technical infrastructure, and commercial service development. Although NovaCore’s mapping history involves Google Street View, the announcement does not establish a new Alphabet partnership.
The post Alphabet (GOOG) Stock: Gains as AIBotics Expands AI Mapping Operations in Jamaica appeared first on Blockonomi.
TLDR
- HPE stock climbs 1.29% to $55.84 following a new Miami HEAT networking deal.
- Miami HEAT taps HPE to bring faster Wi-Fi 7 connectivity to Kaseya Center fans.
- HPE Aruba access points and Juniper switches will modernize arena connectivity.
- HPE will test and optimize arena network performance across five live events.
- AT&T and CSPi will support the network rollout ahead of the 2026–27 NBA season.
Hewlett Packard Enterprise (HPE) stock gained 1.29% to close at $55.84 on Monday, October 19. Shares added 0.05% to $55.87 after hours, despite afternoon selling pressure. HPE also announced a Miami HEAT project to upgrade Kaseya Center’s connectivity.
Hewlett Packard Enterprise Company, HPE
HPE Stock Advances as Arena Upgrades Expand
HPE will overhaul wireless access and supporting wired systems ahead of the 2026–27 NBA season. For the Miami HEAT, the project forms part of broader improvements to the venue’s digital infrastructure. These improvements target fan access, staff communication, and systems that support daily arena operations.
Kaseya Center hosts basketball games, concerts, and other events that attract large crowds. Heavy device use can strain wireless networks, especially where spectators sit close together. The HEAT initially focused on improving coverage in crowded seating sections, including the lower bowl.
However, a technical review showed that faster wireless access also required upgrades to existing wired equipment. As a result, the project expanded to address network switching and power delivery. The broader scope will help the venue handle modern access points and future digital services.
Wi-Fi 7 Upgrade Targets High-Density Connectivity
Under the plan, HPE will install Aruba indoor and outdoor wireless access points across the site. Campus gateways will manage traffic, while HPE Juniper switches will supply the required bandwidth and capacity. Together, the equipment will establish Wi-Fi 7 connectivity for fans and staff.
Wi-Fi 7 supports greater network capacity in busy locations with large numbers of connected devices. At Kaseya Center, the upgrade targets reliable performance during games and other major events. It also aims to limit connection problems in critical seating areas and operational spaces.
HPE will provide specialized network monitoring support during five live events. Those sessions will test network behavior under real crowds and changing traffic conditions. Engineers can then tune performance using event data rather than relying only on initial tests.
HPE Adds Automated Network Management
HPE plans to use AI-assisted network tools to identify faults and improve performance. Its automation can simplify troubleshooting and reduce manual work for arena technology teams. This approach will support network operations as demand changes across different event schedules.
AT&T will provide communication services for the updated network environment. CSPi Technology Solutions will supply implementation support and ongoing managed IT services. These roles will connect the hardware deployment with its practical operation after installation.
HPE expects to finish the wireless rollout before the new NBA season starts. The company will continue switching upgrades across the arena in phases. For HPE, the agreement extends its networking work into another high-traffic entertainment setting.
The post Hewlett Packard Enterprise (HPE) Stock: Rises as Miami HEAT Taps HPE for Wi-Fi 7 Upgrade appeared first on Blockonomi.
TLDR
- RELL stock climbs 3.60% to $18.99 following LaserSlat SAVER sales expansion.
- Richardson Electronics brings LaserSlat SAVER to more markets across Europe.
- U.S. customers can now order select LaserSlat SAVER products directly online.
- LaserSlat SAVER targets slag buildup to reduce maintenance and machine downtime.
- Richardson will highlight its laser consumables at EuroBLECH and FABTECH 2026.
Richardson Electronics expanded LaserSlat SAVER distribution across Europe and introduced online purchasing for selected products in the United States. Meanwhile, RELL stock rose 3.60% to $18.99, gaining $0.66 during Monday’s trading session. The rollout broadens customer access as the company develops its recurring industrial consumables business.
Richardson Electronics, Ltd., RELL
Richardson Electronics expands digital sales capabilities
Richardson Electronics added e-commerce capabilities to rellaser.com, allowing U.S. customers to order selected LaserSlat SAVER products. Customers can now research eligible products and complete purchases through the company’s website. The service adds a digital option alongside Richardson Electronics’ existing direct sales and technical support.
The company serves industrial customers that use laser systems for metal cutting and fabrication. These businesses regularly replace consumables and maintain machinery to keep production lines operating. Online purchasing gives them another way to obtain maintenance supplies without contacting a sales representative.
Richardson Electronics expects the new channel to extend its reach in the laser-cutting market. The company also continues to support customers through its established sales teams. Together, these channels cover online orders and purchases requiring direct technical assistance.
European expansion supports Richardson Electronics’ consumables business
Richardson Electronics also extended LaserSlat SAVER availability into a broad range of European markets. The company will use its existing European infrastructure to supply manufacturers and fabricators. That expansion supports its efforts to grow repeat purchases of parts and maintenance products.
LaserSlat SAVER helps prevent slag buildup on the slats that support material during laser cutting. Cleaner slats can support steady cutting performance and reduce routine cleaning requirements. The product also aims to limit downtime and extend the useful life of cutting table components.
Richardson Electronics markets LaserSlat SAVER as an environmentally friendly maintenance solution. The company says the product works with all laser cutting machines, including high-power fiber lasers rated up to 100 kilowatts. This compatibility gives equipment operators across different production settings another maintenance option.
Richardson Electronics prepares for EuroBLECH and FABTECH 2026
Richardson Electronics will present LaserSlat SAVER at EuroBLECH 2026 in Hanover, Germany, from October 20 to 23. Visitors can find the company at booth 11-F166 at the Hanover Exhibition Grounds. The trade show brings together suppliers and manufacturers involved in sheet metal processing.
The company will also exhibit at FABTECH 2026 in Las Vegas from October 21 to 23. Its team will meet visitors at booth C2422 at the Las Vegas Convention Center. FABTECH focuses on metal forming, fabrication, welding, and finishing across North America.
Alongside LaserSlat SAVER, Richardson Electronics will showcase additional parts and consumables for industrial laser systems. Its lineup includes power grid tubes, optics, nozzles, dust collection filters, bellows, and service parts. Both events offer opportunities to connect with manufacturers seeking less downtime and longer equipment life.
The post Richardson Electronics (RELL) Stock: Surges as Company Expands LaserSlat SAVER Sales Across Europe appeared first on Blockonomi.
TLDR
- CTSH stock rises 0.66% to $66.46 following an expanded Google Cloud alliance.
- Cognizant assigns over 18,000 employees to its new Gemini engineering group.
- The partnership targets AI automation across retail, healthcare, and manufacturing.
- A retail project reports 40% higher productivity and 35% lower costs using Gemini.
- Over 55,000 Cognizant employees complete Gemini training as deployment expands.
Cognizant Technology Solutions (CTSH) stock gained 0.66% to $66.46 on Monday, adding $0.43 as afternoon buying strengthened. The increase followed Cognizant’s announcement of an expanded Google Cloud partnership focused on enterprise AI adoption. The companies introduced a new Gemini Frontier Capability Group to support businesses deploying advanced automation systems.
Cognizant Technology Solutions Corporation, CTSH
Cognizant and Google Cloud Expand Enterprise AI Partnership
The new partnership brings together Google’s enterprise AI technology and Cognizant’s engineering expertise to develop business automation solutions. Cognizant will support the initiative with more than 18,000 dedicated employees across its global operations. The group will help companies move AI projects from early testing into full commercial deployment.
Furthermore, the initiative builds on Cognizant’s Gemini practice, which launched in April 2026. The companies aim to simplify enterprise adoption through specialized engineering services and structured deployment methods. Their expanded collaboration targets businesses seeking greater efficiency across software development, operations, and cybersecurity.
Meanwhile, Cognizant plans to focus its engineering resources on modernizing older technology systems and improving developer productivity. The company will also develop autonomous business processes and strengthen enterprise cybersecurity capabilities. These services will combine Google’s cloud infrastructure with Cognizant’s experience across several major industries.
New Gemini Initiative Targets Retail, Healthcare, and Manufacturing
Cognizant plans to introduce enterprise applications that automate specific tasks across retail, healthcare, and manufacturing operations. Its retail support agent will help businesses manage product catalogs and related customer service processes. Its healthcare marketplace will coordinate specialized digital agents across different operational functions.
The manufacturing initiative will focus on automating order processing, billing, and payment collection through connected systems. Cognizant will also use standardized architecture to support secure communication between enterprise applications. Google Cloud’s Model Armor will help protect these systems from security threats.
The partnership has already produced measurable improvements through an earlier retail software development project. Cognizant reported a 40% increase in developer productivity after integrating Gemini models into development workflows. The same project reduced delivery times by 30% and generated cost savings of 35%.
Cognizant Expands Workforce Training and Internal AI Deployment
Cognizant continues to expand employee training as enterprise demand for advanced AI services increases. More than 55,000 employees completed its recent Build with Gemini workshop alongside Google Cloud. Participants developed applications and automation agents while earning credentials related to Gemini technology.
The training initiative supports Cognizant’s broader effort to develop engineers with specialized AI deployment skills. These employees will help enterprise clients integrate new technology into existing business systems. Consequently, the company expects its trained workforce to support larger and more complex customer projects.
Cognizant is also expanding Gemini adoption across its internal workforce throughout 2026. The company plans to provide the technology to 100,000 employees this year, with a longer-term target of 200,000. This expansion strengthens its existing Google Cloud partnership and extends AI capabilities across its global business operations.
The post Cognizant Technology Solutions (CTSH) Stock: Gains as Google Cloud Unveils New Gemini AI Initiative appeared first on Blockonomi.
TLDR
- NVIDIA (NVDA) stock gains 1.54% to $217.43 following a European quantum milestone.
- NVIDIA completes a 104-qubit simulation using Europe’s JUPITER supercomputer.
- New magic-state cultivation method could cut required quantum qubits by 90%.
- Researchers scaled testing to 8,192 GPUs and reduced weekslong work to days.
- NVIDIA’s cuQuantum and CUDA-Q software powered the fault-tolerant simulation.
NVIDIA (NVDA) stock rose 1.54% to $217.43 on Monday as the company reported a major quantum computing simulation in Europe. Shares gained $3.30, although intraday selling trimmed earlier advances. The announcement highlighted a 104-qubit test aimed at improving fault-tolerant quantum computing.
NVIDIA Corporation, NVDA
NVIDIA Completes Record 104-Qubit Simulation
NVIDIA researchers ran the simulation on JUPITER, Europe’s first exascale supercomputer, at Germany’s Jülich Supercomputing Centre. The project used NVIDIA GH200 processors to model complex quantum operations under realistic hardware noise. According to NVIDIA, the work represents the largest comprehensive simulation of a fault-tolerant quantum processor.
The researchers examined magic-state cultivation, a method that helps quantum systems carry out reliable calculations. Quantum computers face errors because their qubits respond to noise during processing. Consequently, scientists need methods that limit these errors without requiring excessive hardware.
Earlier research at Jülich modeled 50 qubits under ideal conditions without noise. The new project extended that work by examining 104 qubits in a more realistic setting. This approach helps researchers assess how proposed quantum machines might perform outside controlled simulations.
Quantum Method Targets Lower Hardware Requirements
NVIDIA said the cultivation approach could require 90% fewer qubits than previous methods. That reduction matters because useful quantum computers need substantial resources to correct processing errors. Lower hardware requirements could simplify future designs and reduce the cost of scaling them.
Magic states support calculations that ordinary error-correction methods cannot complete alone. However, quantum processors continually consume these states during fault-tolerant operations. Researchers therefore study faster and more efficient ways to produce them.
The team tested how noise affects cultivation and identified ways to evaluate future improvements. Its findings could guide hardware developers before they commit resources to physical prototypes. Such testing also supports research involving drug discovery, financial modeling and advanced materials.
NVIDIA Expands GPU Simulation Capacity
The team first developed its methods using NVIDIA’s GB200 NVL72 system at its Accelerated Quantum Research Center. Researchers expanded testing from four GPUs to hundreds before moving to JUPITER. They eventually used 8,192 GPUs to perform the larger simulation.
This process helped the team check accuracy and compare overall performance across computing environments. It also shortened work that previously required weeks into a process lasting days. The development stage prepared the software for JUPITER’s much larger computing resources.
NVIDIA used its cuQuantum software to improve simulation performance across the entire system. Meanwhile, its CUDA-Q platform provided tools for describing fault-tolerant quantum circuits. Together, the systems showed how conventional GPU supercomputers can support quantum research before engineers build larger physical processors.
The post NVIDIA (NVDA) Stock: Rises as Company Achieves Quantum Computing Breakthrough in Europe appeared first on Blockonomi.
CryptoPotato
Qubic has confirmed that an attacker drained 1,404 wallets, stealing around 2.94 trillion QU during a security incident between October 17 and 18.
The network said the problem came from weak wallet seed generation, not a flaw in the Qubic protocol itself.
Weak Wallet Seeds
According to the update, some wallet seeds were created with insufficient randomness, making them easier to compromise. The affected seeds were generated on iPhones and iPads using any browser before October 18, on Macs using Safari before that date, or through the Qubic iOS app before July 2025.
Qubic’s validators, known as Computors, coordinated a halt at tick 85,371,949 to prevent further movement of the stolen funds. With transactions paused, 87.1% of the drained funds remain on the network and frozen. The other 12.9% was sent to MEXC, which froze the receiving account within about an hour. Exchanges have also been notified and have suspended QUBIC deposits and withdrawals.
The team asserted that the seed generation issue has been fixed in version 4.26.4. No new weak seeds can be created under the corrected system. The next steps will depend on the Computor quorum, which will decide how the incident is resolved under the network’s rules. The Core team is identifying affected identities and preparing options for the quorum. A community poll is also open on Discord to gather feedback.
The layer-1 blockchain network has urged affected users to report the incident to local police or cybercrime authorities. Reports should include the wallet ID, the amount lost, and the transaction link from the Qubic explorer.
September Nightmare
The Qubic incident comes after a costly September for the crypto industry. As reported by CryptoPotato, PeckShield counted 55 major crypto hacks during the month, as losses reached almost $766.5 million. That was around 462% higher than August’s $136.3 million.
Two incidents accounted for most of the damage. The Bitget breach involved around $387 million, while the Liquid Network theft totaled roughly $320 million. Liquid later recovered $285 million. Bitget CEO Gracy Chen said an attacker exploited a backend system to manipulate transaction data and bypass authorization checks. The exchange plans to cover the loss through its User Protection Fund, which holds more than $464 million.
The Liquid Network theft, on the other hand, involved roughly 4,000 BTC withdrawn from its federation wallet. The attacker promised to return the funds after network nodes were patched, though Ledger CTO Charles Guillemet questioned whether the attacker was a legitimate security researcher.
The post Qubic Pushes Back on Hack Claims: Weak Wallet Seeds Were to Blame appeared first on CryptoPotato.
The cryptocurrency market has been anything but stable lately and is still far from the bullish conditions some anticipated this month.
Despite the overall uncertainty, optimism continues to build around select tokens like Hyperliquid’s HYPE. Here’s why it rose to the top of a notable ranking and what it could indicate.
HYPE Overtakes BTC and ETH
Ki Young Ju (founder and CEO of CryptoQuant) recently said HYPE has become the most bullish cryptocurrency in analyst sentiment. He said the optimism stems primarily from its tokenomics, specifically fee-driven buybacks.
Hyperliquid uses a portion of the fees generated on its platform to repurchase HYPE coins from the open market. In theory, this creates a constant source of demand tied directly to the protocol’s activity and could support a potential price appreciation.
According to Ju’s analysis, BNB is the second-most bullish cryptocurrency, while Solana’s SOL comes in third. The sector’s undisputed leader, Bitcoin (BTC), ranks fourth, followed by Cardano (ADA), Ripple (XRP), Ethereum (ETH), and Uniswap (UNI).
Being the “most bullish” cryptocurrency in analyst sentiment essentially means market observers see HYPE as having one of the strongest upside cases based on its fundamentals, tokenomics, and other factors. This may sound like good news, but keep in mind that when sentiment becomes overwhelmingly positive, it can sometimes serve as a contrarian indicator, signaling that the asset may be overheating and becoming vulnerable to a short-term pullback. Commenting on the post was Ali Martinez, who said:
“From a counter-sentiment perspective, that’s bearish!”
HYPE Price Outlook and Predictions
As of press time, the asset trades just north of $80, down 18% from the all-time high of nearly $100 earlier this year. Late last week, Martinez spotted a fresh TD Sequential buy signal on the asset, noting that the previous signal preceded a rebound of around 11%.
“If this one gets similar follow-through, Hyperliquid could test $86, then resistance near $93,” he suggested.
For their part, Jelle said HYPE is testing the 100-day EMA and has bounced off it so far. The analyst revealed the price has plunged more than they initially expected, but added that the long-term picture remains unchanged as long as the June highs of around $76 hold.
Meanwhile, an anonymous investor supposedly made significant profits after trading HYPE. As CryptoPotato reported, the whale bought 257,928 HYPE toward the end of 2024, when the price of one token was around $3.50. Recently, the investor transferred more than 230,000 coins to Kraken, potentially locking in a profit of almost $20 million if an actual sale took place.
The post HYPE Beats BTC and ETH in a Surprising Category: But Is This Really Good News? appeared first on CryptoPotato.
Ripple’s cross-border token, which is perhaps one of the most popular crypto assets with a vast community behind it, finally received a dedicated account on X.
It almost feels unreal that more than a decade after its launch, XRP didn’t have an official account on the largest social media platform for the crypto industry. The celebratory posts and comments were quick to join the movement, led by Ripple’s CEO, Brad Garlinghouse.
This one has been a long time coming… Welcome @XRP! https://t.co/UYRYIHDGGl
— Brad Garlinghouse (@bgarlinghouse) October 19, 2026
There’s only one post on the account as of press time, which reads “hello, world,” perhaps referencing the 52-year-old tradition that started with Brian Kernighan, who first used it in a Bell Laboratories internal memorandum for a programming language.
Although the post is just a few hours old, the attention has been quite impressive since the account already has over 47,000 followers.
Moreover, some of the comments below came from major accounts, such as Gemini, Uphold, Moonpay, Flare, and others. Naturally, prominent members of the XRP community, such as EGRAG CRYPTO and the XRP Ledger account, also welcomed the new Ripple member on X.
The establishment of an XRP-dedicated account follows a highly successful week for Ripple, in which it announced a few major partnerships and expanded its reach on Wall Street.
The same cannot be said about the native token itself, which has struggled to stage a notable recovery. XRP was rejected at $1.40 last week, and tumbled to $1.25 just days later, where it finally found support.
Popular analyst Ali Martinez, who also commented on the new account’s post, believes XRP’s successful rebound from that area means that it has bottomed out, especially since the network activity on the XRP Ledger skyrocketed at that price level.
The post Major XRP Adoption News Sparks Excitement Across Ripple’s Community: Details appeared first on CryptoPotato.
It would be difficult to describe crypto venture capital as being in a funding drought. Investors deployed approximately $5.7 billion into crypto and blockchain companies during the second quarter of 2026, according to Galaxy Research, an increase of 31% from the previous quarter.
What has changed is where that money is going and what founders increasingly have to demonstrate to get it. Nearly 80% of the capital invested during the quarter went to later-stage companies. Crypto startup valuations have also fallen sharply from their highs in the final quarter of 2025, while raising new crypto venture funds remains difficult. Galaxy recorded only five new funds during Q2, the lowest quarterly number for several years.
September continued the mixed picture. FinDaS recorded $1.05 billion across 48 Web3 funding rounds, compared with a preceding 12-month monthly average of $2.01 billion and almost 67 rounds. Capital is clearly still available, but what appears to be disappearing is the assumption that a promising Web3 company should be able to raise it easily. I think that could ultimately produce better companies.
Varun Datta, venture capitalist and CEO of Truth Ventures, explores why tougher fundraising conditions may be forcing Web3 companies to build stronger businesses.

What investors now expect
There have been periods in Web3 when the strength of a market narrative could compensate for weaknesses elsewhere in a business. A compelling technology, experienced founders and a convincing token model could attract significant capital before there was much evidence of who the eventual customer would be or whether that customer was willing to pay.
Some excellent companies were funded during those periods, so I would not dismiss what abundant capital made possible. It allowed founders to experiment with technologies and business models that conventional investors may not have financed, and some of today’s infrastructure emerged from exactly that environment. But easy money also allowed companies to postpone difficult questions around who needed the product, why the technology was better than the existing alternative, how the company would make money and whether the business would still work if token prices fell and incentives became less attractive.
Those are questions I think investors are increasingly asking earlier. I have argued previously that crypto VC risks mistaking consensus for discipline when investors retreat towards companies and categories that have already been validated. Selectivity should not mean waiting until somebody else has proved that an opportunity exists.
At Truth Ventures, our focus is early-stage Web3 infrastructure, so there will often be limited revenue and sometimes a product that is still being developed when we first meet a founder. It would be unreasonable to expect an early-stage company to have everything proven.
What I do expect is a founder who understands the problem extremely well. There is a meaningful difference between uncertainty because something has not yet been built and uncertainty because nobody has worked out why it needs to exist. That distinction becomes much more important when capital is selective.
A difficult market changes how companies build
The most obvious effect of a tougher fundraising environment is that companies have to make their existing capital last longer. That can mean smaller teams and slower expansion, but it also changes the order in which decisions are made.
When a company cannot assume another large funding round will arrive in 12 or 18 months, revenue matters earlier. Customer retention matters more. Founders have to understand which parts of the product people genuinely value rather than trying to build everything at once.
I think Web3 can particularly benefit from that discipline because token incentives have sometimes made it difficult to distinguish between adoption and subsidised activity. Tokens can be extremely effective at coordinating decentralised networks. They can encourage early participation, align incentives and distribute ownership in ways that conventional technology companies cannot easily reproduce. The difficulty comes when financial incentives are mistaken for product-market fit.
A protocol can have rapidly increasing activity because people are being rewarded to use it. That does not necessarily tell an investor what happens when those rewards decline. For me, the more useful question is whether the underlying product becomes more valuable as the network matures.
This is one reason infrastructure remains attractive. When I recently looked at AI agents and the infrastructure behind the emerging machine economy, the more interesting investment question was not necessarily which agent or wallet would win, but which settlement, metering and identity layers would be required if autonomous transactions became widespread.
The same principle applies more broadly. If a product solves a fundamental problem around scalability, privacy, settlement, identity, liquidity or interoperability, its utility does not necessarily depend on the market being excited about Web3 at that particular moment. In many cases, the opposite should be true: if adoption increases, the problem it solves becomes larger.
Follow where the capital is going
Recent investment activity also tells us something about what the market is beginning to value. Galaxy’s Q2 data shows that trading, exchanges, investing and lending attracted the largest amount of capital, but there was also meaningful investment across DeFi, privacy and security, tokenisation, AI and infrastructure.
More recently, S&P Global led a strategic investment in digital asset data company Kaiko, extending a relationship that already includes bringing financial benchmarks onchain. Kaiko now works with more than 250 financial firms, institutions and regulators.
I find investments like this interesting because the value proposition is relatively easy to understand. If financial markets move further onchain, institutions need reliable data, analytics, benchmarks and infrastructure. Whether a particular token rises or falls next month does not substantially change that requirement.
This does not mean every founder should pivot towards institutional infrastructure. Venture capital has its own cycles, and building whatever investors currently find fashionable is rarely a good foundation for a company. Founders should build around a problem they understand better than most people, rather than around the current preferences of venture funds. What has changed is that investors have more reason to test how real that understanding is.
What I look for in founders
At an early stage, numbers only tell you so much. A founder may not yet have meaningful revenue and the addressable market may itself still be developing. In Web3, we are often investing in infrastructure for markets that do not fully exist yet, which makes judgement particularly important.
I want to understand why a founder has chosen this problem, what they have learned that is not obvious from the outside and whether they understand where their own assumptions could be wrong. Regulatory awareness has also become much more important. A founder does not need to predict every regulatory development, but if the business model depends on regulators permanently ignoring a particular activity, that is something an investor needs to understand.
The same applies to defensibility. Having impressive technology is valuable, but technology alone does not always create a durable business. Distribution, network effects, proprietary data, developer adoption, integrations and the difficulty of replacing infrastructure once customers depend on it can all become more important over time.
These considerations are not unique to Web3 and, in some ways, that is the point. As the sector matures, I think good Web3 investing increasingly looks less like betting on crypto narratives and more like evaluating technology companies.
There will still be opportunities that are genuinely unique to decentralised networks, and there will still be periods when capital flows rapidly into a particular part of the market. That is the nature of venture investing. But founders should not assume those conditions will finance them indefinitely.
The current market is not preventing Web3 companies from raising money; the latest figures make that clear. It is becoming more discriminating about which companies receive it and at what stage. For strong founders, that is not necessarily bad news.
A company that can demonstrate real demand, sensible economics and a reason for customers to keep using its product when market sentiment changes is more likely to survive the next downturn. It is also more likely to be around when the infrastructure it has spent years building finally becomes essential.
Web3 does not need less ambition from its founders. It needs more evidence that the ambition is attached to a business that can last.
About Varun Datta
Varun Datta is the founder and CEO of Truth Ventures, an early-stage venture capital firm investing across Web3 infrastructure and emerging decentralised technologies. He focuses on founders tackling fundamental problems in areas including developer infrastructure, decentralised AI, DePIN, privacy and scalability, and writes regularly about how venture capital can identify durable value as the Web3 market matures.
Disclaimer: The above article is sponsored content; it’s written by a third party. CryptoPotato doesn’t endorse or assume responsibility for the content, advertising, products, quality, accuracy, or other materials on this page. Nothing in it should be construed as financial advice. Readers are strongly advised to verify the information independently and carefully before engaging with any company or project mentioned and to do their own research. Investing in cryptocurrencies carries a risk of capital loss, and readers are also advised to consult a professional before making any decisions that may or may not be based on the above-sponsored content.
Readers are also advised to read CryptoPotato’s full disclaimer.
The post Varun Datta, Truth Ventures CEO – Web3’s Funding Boom Is Over. That Could Be Good News for Founders appeared first on CryptoPotato.
Exchanging or swapping cryptocurrencies anonymously isn’t always as simple as it should be. This is because some platforms require users to complete several steps, such as creating an account, completing Know Your Customer (KYC) verification, or even connecting their wallets before they can proceed with the transaction. Although these steps may serve different purposes, they can be inconvenient for users who prefer to swap their digital currencies without having to reveal their identity.
However, there are platforms that allow users to swap digital currencies without going through the usual registration and KYC processes.
This is where HiddenSwap comes in. The platform offers crypto swaps without requiring users to create accounts, connect their wallets, or complete Know Your Customer (KYC) verification. It also offers a simple interface designed to make the swapping process straightforward. This article takes a closer look at HiddenSwap, how it works, and its key features.

How Does HiddenSwap Work?
HiddenSwap makes crypto swaps as similar as they are with decentralized applications (dApps), such as Uniswap, PancakeSwap, and Jupiter. The difference is, you’re not connecting any wallet, creating any account, or undergoing KYC.
To execute a crypto swap, users will choose the cryptocurrencies they want to send and receive. They would also choose their preferred networks when necessary. Next, they would input the amount they intend to send. The equivalent amount to receive will appear automatically. Note that the rate displayed already accounts for the applicable fees.
Users would then paste the wallet addresses for the account they are sending from (Sending address) and the one they are sending to (Destination address). For instance, if a user is sending Bitcoin (BTC) to receive Monero (XMR), they paste both addresses on HiddenSwap’s swap page and hit the “Start Swap” tab.
HiddenSwap automatically provides an address for the user to send the crypto to. Following the example provided, the user will be provided with a BTC address to send the exact amount they want to swap.
The platform provides users with an Order ID, which serves as a way of identifying their swap. Users must save the order ID throughout the swap process, as it is what they would present in the case of a complaint or refund. They also use the order ID to track their swap.
Once the swap is complete, users can head to their destination wallet to view their account balance.
HiddenSwap requires users to provide their sending address so that, in a situation where the wrong amount is sent or a swap cannot be completed, the crypto gets moved back to the address it came from.

Key Features of HiddenSwap
Here are various features that make HiddenSwap a top choice among crypto users:
Privacy
HiddenSwap’s privacy is undoubtedly its most prominent feature. It allows users to execute crypto-to-crypto swaps without providing an ID, email, or creating an account. According to the project, one’s wallet address is the only thing needed for a crypto swap to be successful.
To bolster its privacy, HiddenSwap works in the Tor browser. This means that it cannot access users’ web traffic, such as their IP address, location, and Internet Service Provider (ISP). This sets the platform apart from competitors that quietly record users’ IP addresses or even sell this data to analytics firms.
HiddenSwap also disables JavaScript to enforce its privacy policy. Traditionally, JavaScript can be used to collect data like users’ screen resolution, device type, and other private data without cookies. Disabling JavaScript prevents HiddenSwap from harvesting users’ information.
Because HiddenSwap prioritizes privacy, it urges users whose funds are in centralized exchanges to first send them to non-custodial wallets before swapping via HiddenSwap. The platform also encourages using privacy cryptocurrencies like XMR or Zcash’s shielded addresses as destination addresses. This guarantees users’ privacy.
Flexible Fees
As mentioned earlier, HiddenSwap includes its fees in the rates. So, there are no additional costs. Note, though, that this does not include fees when sending crypto from the Sending Address.
The platform allows users to choose between floating and fixed rates before executing a swap. Floating rates are those that fluctuate with the market until the network confirms the user’s deposit. In the end, the user may get more or less than they ought to.
Fixed rates keep the rates locked at a specific amount as long as the exact deposit amount arrives in a single transaction before the timer on the order page ends. Not every trading pair offers fixed rates at the time of writing. If the market moves by 3% or more before the transaction is completed, users may be asked to choose either the new rate or a refund.
Supported Crypto Assets and Chains
HiddenSwap supports over 1,170 cryptocurrencies. This includes popular assets like BTC, ETH, SOL, and XRP. It also offers privacy coins, such as Monero (XMR) and Zcash (ZEC). Stablecoins like USDT and USDC are also available on the platform.
Adding to its diversity, the platform enables cross-chain swaps. This allows users to access tokens on various blockchains. For instance, users can decide to receive ETH via a layer-2 network that offers speed and cheap fees, such as Optimism. This way, they ditch Ethereum’s slow and expensive network.
Refunds
HiddenSwap allows refunds when the crypto swap fails or cannot be completed. Refunds also come into play when fixed-rate trades arrive late or with a different amount. Also, if the market moves significantly under the fixed rate, users may refund their assets if they do not want to go for the new rate.
Refunds are sent to the addresses the crypto came from, that is, the sending address. In the case of some privacy coins like Monero, where sending addresses are not displayed, users will write to HiddenSwap’s customer support with their order ID to request a refund by providing the address where the funds should go.
Users are wholly responsible for the network fees involved in refunded amounts. This means that the fees will be deducted from the amount to be reimbursed.
In some cases, users may deposit crypto the wrong way or fail to include a needed memo. During such occurrences, a recovery fee of $50 plus network fees is charged to facilitate the refund.
Customer Support
HiddenSwap has a dedicated live chat customer support that typically responds within an hour. This allows those with complaints to reach out with their order ID or transaction hash (if they misplace their order ID) to rectify issues with the crypto swap.
Pros and Cons of HiddenSwap
While HiddenSwap has multiple perks, it also has its downsides. Here’s an unbiased breakdown of its pros and cons:
Pros
- Provides customer support.
- Enables crypto refunds.
- Supports multiple crypto assets and blockchains.
- User-friendly interface.
Cons
- Limited social presence. (Only Telegram)
- Floating rate makes it impossible to predict the final amount.
- Recovery fee is high ($50).
- Services limited to crypto swaps.
Conclusion
HiddenSwap offers a simple way to exchange one digital asset for another without having to create an account, connect a wallet, or undergo KYC verification. This makes it an option worth considering for users who value convenience and privacy when swapping cryptocurrencies.
The platform also supports a long list of crypto assets while offering a flexible fee structure. Its simple interface, refund process, and customer support further contribute to the overall swapping experience.
Disclaimer: The above article is sponsored content; it’s written by a third party. CryptoPotato doesn’t endorse or assume responsibility for the content, advertising, products, quality, accuracy, or other materials on this page. Nothing in it should be construed as financial advice. Readers are strongly advised to verify the information independently and carefully before engaging with any company or project mentioned and to do their own research. Investing in cryptocurrencies carries a risk of capital loss, and readers are also advised to consult a professional before making any decisions that may or may not be based on the above-sponsored content.
Readers are also advised to read CryptoPotato’s full disclaimer.
The post HiddenSwap Review 2026: Enabling Crypto Swaps Without KYC appeared first on CryptoPotato.