Cryptocurrency Posts
Crypto Briefing
The security warnings may lead to increased travel hesitancy, impacting tourism and economic stability in France amid ongoing unrest.
The post European governments warn citizens over security in France amid riots appeared first on Crypto Briefing.
Increased merger speculation could impact investor strategies and market dynamics, despite the absence of official confirmation from Tesla or SpaceX.
The post Barclays analysis fuels Tesla-SpaceX merger speculation appeared first on Crypto Briefing.
Anthropic's AI advancements could reshape industry standards, influencing competitive dynamics and market expectations in AI technology.
The post Anthropic readies model that reads users’ intentions better – The Information appeared first on Crypto Briefing.
Strive's aggressive Bitcoin acquisition strategy highlights the growing trend of corporations hedging against monetary debasement, impacting market dynamics.
The post Strive adds $335 million in Bitcoin ahead of SATS IPO proceeds settlement appeared first on Crypto Briefing.
The escalation in Yemen's conflict could destabilize the region further, impacting market perceptions and increasing the risk of broader hostilities.
The post Houthi missile strike kills 53 at Yemen training camp, escalating conflict appeared first on Crypto Briefing.
Bitcoin Magazine
Bitcoin Magazine
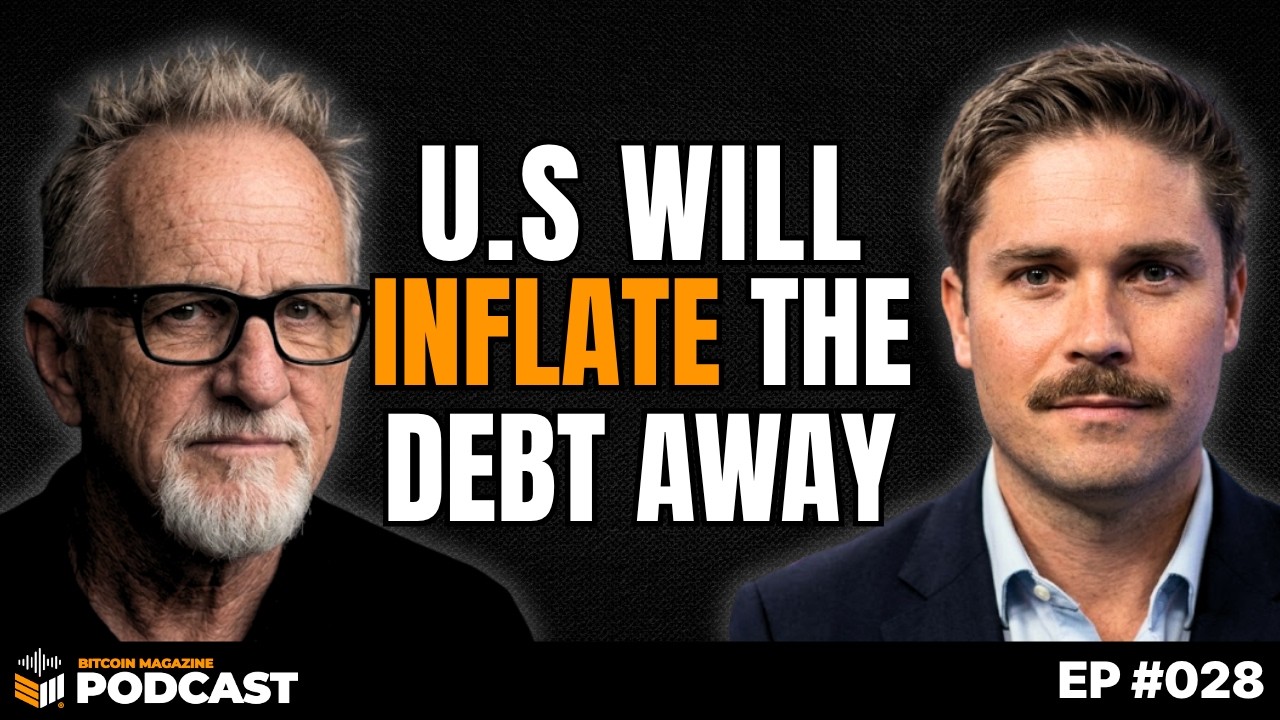
Financial Repression in the Age of AI
America can’t build its own defense equipment, robots, or AI hardware anymore, and Craig Tindale says that’s a national security crisis. Drawing on Alexander Hamilton and Dwight Eisenhower, he explains why decades of offshoring left the U.S. dependent on its rivals for critical metals. He also explains why he sees AI as a race to automate the world and build an impenetrable defense network.
 Host: Spencer Nichols — Bitcoin Magazine Craig Tindale — Independent Investor
Chapters:
0:00 – Craig Tindale: Financial Repression in the Age of Superintelligence
2:17 – Why Yields Are Rising Everywhere and Countries Don’t Go Broke
5:22 – Operation Twist and a New Treasury–Fed Accord
8:40 – Hong Kong’s Gold Vault and Why Nations Need Hard Assets
10:44 – Who Pays? Why Domestic Savers Bear the Cost of Financial Repression
14:39 – Stablecoins, the GENIUS Act and a Fragmenting Multipolar World
19:53 – Protectionism, Hamilton and the Case for Reindustrializing America
27:27 – AI as a Weapon: Automation, Code and State Capitalism
32:35 – Protecting Capital: Gold, Silver, Copper, Bitcoin and Diversification
37:20 – Resilience, Self-Sufficiency and the Fourth Turning
DISCLAIMER: The views and opinions expressed in this show are those of the participants and do not necessarily reflect the official policy or position of BTC Inc., Bitcoin Magazine, or any affiliated entities. This content is provided for informational and educational purposes only and should not be construed as investment, legal, tax, or accounting advice. Nothing contained in this show constitutes a solicitation, recommendation, endorsement, or offer to buy or sell any securities or financial instruments. Viewers should consult their own advisors before making financial or business decisions.
This post Financial Repression in the Age of AI first appeared on Bitcoin Magazine and is written by Mark Mason.
Bitcoin Magazine

Richard Byworth: Bitcoin’s Next Run “Just a Mater of Time” thanks to Seller Exhaustion
How do you earn yield on Bitcoin without risking your stack? Richard Byworth, who spent his career structuring for hedge funds, explains why Bitcoin is the hurdle rate for everyone, and why covered-call overwriting can cost you a significant portion of your Bitcoin in a rally. He walks through how basis trades collateralized by Bitcoin can deliver low-volatility, market-neutral returns.
Chapters:
0:00 – Richard Byworth on Leaving Syz Capital Over Bitcoin Treasuries
1:43 – Earning Yield in Bitcoin and Why Covered Calls Are Risky
3:51 – Basis Trading: Earning Dollars Collateralized by Bitcoin
4:47 – Inflation, AI Borrowing and How Digital Credit Pressures the Treasury
8:39 – Record Seller Exhaustion: Is the Bitcoin Bottom In?
9:55 – Why SATA Reached Par Before STRC
13:51 – Digital Credit Funds in Swiss Francs
15:51 – MSCI’s “Attack” on Bitcoin Treasury Companies
17:20 – Bitcoin Bonds for Nations: Working With JAN3
20:06 – El Salvador’s Bitcoin Bond and Bitcoin in the Mortgage Market
DISCLAIMER: The views and opinions expressed in this show are those of the participants and do not necessarily reflect the official policy or position of BTC Inc., Bitcoin Magazine, or any affiliated entities. This content is provided for informational and educational purposes only and should not be construed as investment, legal, tax, or accounting advice. Nothing contained in this show constitutes a solicitation, recommendation, endorsement, or offer to buy or sell any securities or financial instruments. Viewers should consult their own advisors before making financial or business decisions.
This post Richard Byworth: Bitcoin’s Next Run “Just a Mater of Time” thanks to Seller Exhaustion first appeared on Bitcoin Magazine and is written by Patrick Green.
Bitcoin Magazine
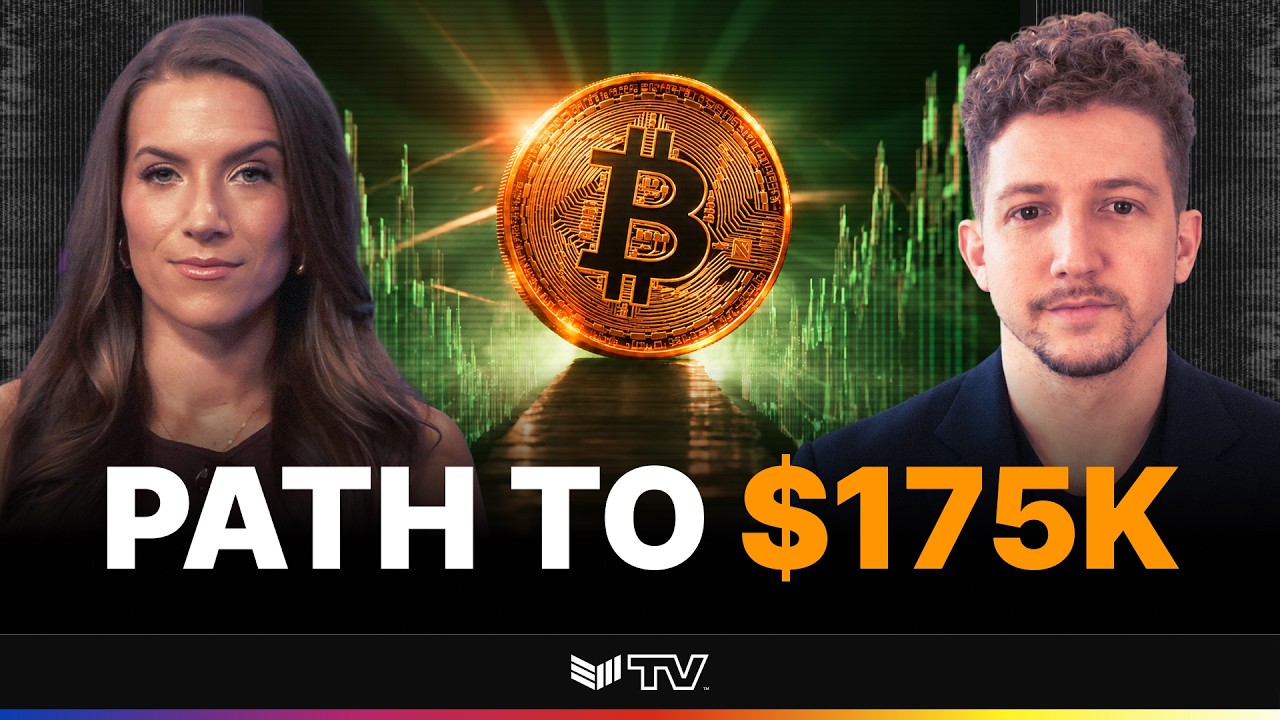
$20B AUM Siebert Analyst: Bitcoin to $175K in 2027
Siebert Financial sees Bitcoin reaching $175K within the next 12 months, and Strategy hitting $350 a share along with it. Brian Vieten, head of digital assets research at Siebert Financial, joins Grace Remington and Sean Hagan to explain his path to $175K, starting with the June low near $58K that he says marked exhaustion across miners, exchanges, treasury companies, and lenders. He then breaks down Siebert’s Buy rating on Strategy and its $350 price target, which is based on that $175K Bitcoin forecast and doesn’t assume any mNAV expansion. He also explains why Strategy’s digital credit engine, sticky ETF demand, and the GENIUS Act give Bitcoin “a clean runway” from here
Chapters:
0:00 – Siebert’s Brian Vieten on His $175K Bitcoin Price Target
0:27 – Why the $58K June Low Marked Seller Exhaustion
3:04 – How Big Banks Changed the Bitcoin Lending Complex
4:22 – ETFs: Sticky Capital and Bitcoin’s Biggest Market Structure Shift
5:10 – Strategy at 1x mNAV and the Digital Credit Tax Advantage
6:36 – The GENIUS Act, Stablecoins and Tokenization as New Demand
8:42 – Does the Four-Year Cycle Still Matter?
10:21 – What Institutions Need Before Increasing Bitcoin Allocations
12:12 – How the GENIUS Act Could Spark Institutional FOMO
16:11 – Strategy’s $350 Price Target and How It Compares With Younger Treasury Companies
DISCLAIMER: The views and opinions expressed in this show are those of the participants and do not necessarily reflect the official policy or position of BTC Inc., Bitcoin Magazine, or any affiliated entities. This content is provided for informational and educational purposes only and should not be construed as investment, legal, tax, or accounting advice. Nothing contained in this show constitutes a solicitation, recommendation, endorsement, or offer to buy or sell any securities or financial instruments. Viewers should consult their own advisors before making financial or business decisions.
This post $20B AUM Siebert Analyst: Bitcoin to $175K in 2027 first appeared on Bitcoin Magazine and is written by Patrick Green.
Bitcoin Magazine

Jeff Park: What The AI Pain Trade Means For Bitcoin
From Strategy and Strive to Google and Super Micro, companies are turning to preferred securities to fund their growth. Jeff Park explains why digital credit is set to become a main fixture of investors accessing income. He also weighs in on Anthropic’s IPO, why liquidity is at a premium, and why knowing value, not just price, is the hardest skill in investing.
Chapters:
0:00 – Jeff Park on Record Stock Volatility and Market Dispersion
1:53 – Why Owning Zero Bitcoin Could Be the Bigger Risk
3:05 – Bitcoin Rising With 10-Year Yields Above 5%
3:43 – Rethinking the 60/40 Portfolio and the Risk-Free Rate
5:02 – Bitcoin as Collateral and the Rise of Bitcoin Income
6:02 – The GENIUS Act Becomes an Implementation Story
7:37 – Where Stablecoin Demand Will Come From
9:18 – Tokenization, Collateral Mobility and the BNY–Citadel Repo
12:11 – MSCI, Strategy and Booming Demand for Bitcoin Preferreds
15:19 – Anthropic’s IPO and Why Liquidity Is at a Premium
DISCLAIMER: The views and opinions expressed in this show are those of the participants and do not necessarily reflect the official policy or position of BTC Inc., Bitcoin Magazine, or any affiliated entities. This content is provided for informational and educational purposes only and should not be construed as investment, legal, tax, or accounting advice. Nothing contained in this show constitutes a solicitation, recommendation, endorsement, or offer to buy or sell any securities or financial instruments. Viewers should consult their own advisors before making financial or business decisions.
This post Jeff Park: What The AI Pain Trade Means For Bitcoin first appeared on Bitcoin Magazine and is written by Patrick Green.
Bitcoin Magazine

Fundstrat Analyst Sean Farrell: Bitcoin to $100k by Year End + MSTR MSCI Exclusion
Where is Bitcoin headed by year-end? Fundstrat’s head of digital asset strategy, Sean Farrell, says he’s constructive. He doesn’t expect new all-time highs this year, but he sees 95K–100K as possible before year-end. He explains how bond volatility is spilling into equities, why the near term is murky, and why the bigger regime shift still favors Bitcoin.
Chapters:
0:00 – MSCI’s Decision on Excluding Bitcoin Treasury Companies
0:36 – Why Sean Farrell Expects Exclusion but Sees Limited Impact on Strategy
1:43 – Exclusion vs. Inclusion: Upside Catalyst or Nothing Burger?
2:28 – Why the Downside Is Priced In and What Could Spark Upside
3:17 – How MSCI Exclusion Could Affect STRC’s Return to Par
4:09 – Strategy’s $1.5B STRC Buyback and the Daily Dividend Vote
5:40 – Reading Today’s Selloff and Reversal in Bitcoin Treasury Stocks
6:20 – Why the Macro Regime Is “Heads I Win, Tails You Lose” for Bitcoin
7:16 – Treasury Buying, Financial Repression and Rising Liquidity
8:43 – Sean Farrell’s Bitcoin Outlook: $95K to $100K by Year-End
DISCLAIMER: The views and opinions expressed in this show are those of the participants and do not necessarily reflect the official policy or position of BTC Inc., Bitcoin Magazine, or any affiliated entities. This content is provided for informational and educational purposes only and should not be construed as investment, legal, tax, or accounting advice. Nothing contained in this show constitutes a solicitation, recommendation, endorsement, or offer to buy or sell any securities or financial instruments. Viewers should consult their own advisors before making financial or business decisions.
This post Fundstrat Analyst Sean Farrell: Bitcoin to $100k by Year End + MSTR MSCI Exclusion first appeared on Bitcoin Magazine and is written by Patrick Green.
CryptoSlate
A moving weekend index helps explain how a 5.9% opening-to-low mark decline coexisted with minute-close mark/index gaps below 3%.
Read the full story on CryptoSlate
Understand the crypto stories that matter and what to watch next. Get The Catalyst in your inbox
Fast sampled blocks do not establish the maximum proving burden, while Ethereum’s CPU gas analysis excludes proof generation.
Read the full story on CryptoSlate
Understand the crypto stories that matter and what to watch next. Get The Catalyst in your inbox
Existing Mint customers switch at their next billing period on or after that date; Express still costs 0.05% before conditional credits.
Read the full story on CryptoSlate
Understand the crypto stories that matter and what to watch next. Get The Catalyst in your inbox
Sentora’s Firelight coverage pays premiums from vault yield, while FXRP providers’ shared backing can absorb validated losses after a stablecoin buffer.
Read the full story on CryptoSlate
Understand the crypto stories that matter and what to watch next. Get The Catalyst in your inbox
US-listed XRP exchange-traded funds ended a 13-week inflow streak as investors withdrew nearly $576 million from four major cryptocurrency ETF categories. Data from SoSoValue showed that XRP funds recorded $1.84 million in net outflows during the week ended Oct. 16, reversing the $11.31 million inflows registered a week earlier. The withdrawal ended the longest active…
Read the full story on CryptoSlate
Understand the crypto stories that matter and what to watch next. Get The Catalyst in your inbox
CryptoTicker.io
Dogecoin trades at $0.0791, or €0.0705, on Monday midday, and that is despite a wave of buying by large addresses. Between October 12 and October 16, around 600 million DOGE moved onto addresses with large holdings, according to data from the analytics house Santiment. Over the same period the price did not gain: it lost 8.6 percent on a seven-day view. The explanation lies not in the buying but on the other side of the order book. Daily turnover has fallen to around $590 million, a drop of 49 percent within a day according to CoinMarketCap figures, which U.Today put down on Monday to quiet weekend trading. If you buy or sell Dogecoin today, you meet a thinner book than two weeks ago, and that changes the arithmetic of every order.
Where Dogecoin stands on Monday midday
The price sits at $0.0791, 0.36 percent below where it stood 24 hours earlier. The daily range runs from $0.0761 to $0.0801, which is 5.3 percent between low and high in a single day. Over 30 days there is a loss of 8.6 percent, over 200 days one of 12.5 percent, over a year one of 58.4 percent. Only the two-month view is up, by 3.2 percent. Market capitalisation comes to $12.37 billion, which means 12th place among all cryptocurrencies. The all-time high of $0.7316 from May 7, 2021 is 89.2 percent away. All figures come from CoinGecko, as of October 19.
600 million DOGE in five days: what Santiment measured
Santiment evaluates holdings by address class and thereby captures whether balances are shifting from small to large addresses. For the period of October 12 to 16 the firm reports an increase of around 600 million DOGE at the large addresses, as Brave New Coin reported. At Monday's price that is about $47.5 million. Measured against the circulating supply of 156.379 billion DOGE, the sum amounts to 0.38 percent of all tokens.
Those 0.38 percent are the reason the figure is smaller than it sounds. For comparison: at today's issuance of around 13.82 million new DOGE a day, which we broke down on October 18 in the article on miner revenue and the fee share, the network needs a good 43 days to pay out the same amount afresh. Five days of buying therefore absorbs less than six weeks of running supply.
One important caveat belongs with that: an address class is not an owner. Exchanges, custodians and funds hold client balances on omnibus addresses that land in the same class. An increase there can be a transfer between custodians rather than a buying decision. The shift is documented, its motive is not.
Turnover halves, and that is the real finding
Daily turnover of $590 million stands against a market capitalisation of $12.37 billion. The ratio of those two figures is called the turnover rate, and it comes to 4.8 percent: in a single day barely one dollar of market value in twenty changes hands. On October 4 daily turnover still stood at $854 million, as our article on the ETF channel recorded that day. The fall to $590 million is a drop of 31 percent in two weeks.
Turnover is the counterparty to every order. When it falls, there is less selling volume at a nearby price behind every bid, and the reverse holds too. The same order then moves the price further. That explains the 5.3 percent daily range on a day without news: it is not the news flow that is restless, it is the book that is thin.

How buying works in a thin market
The mechanism shows up in two numbers. The $47.5 million that large addresses took on over five days equals eight percent of one of today's daily turnovers. Spread across five days it is around 1.6 percent of turnover per day. An order of that size, sliced over several days, runs along with the book and does not lift the price.
The same holds in reverse. On October 15 Whale Alert reported a transfer of 300 million DOGE worth about $24.1 million to an exchange. An inflow to an exchange is not a sale, but it makes the tokens sellable. If $24 million hit the book on a day with $590 million of turnover, that would be four percent of the day's volume on the supply side. In a book with $854 million of turnover it would be barely three. The difference sounds small and decides whether a level holds.
For you that matters more at execution than at the price: with turnover halved, an instant buy costs more distance from the mid price than it did two weeks ago. We measured how large the gap between instant buy and order book is for DOGE on October 11; the direction has not changed since then, the amount has. Choosing an exchange with a deep DOGE order book and working with limits costs noticeably less in a thin market than a market order does.
What has changed since October 18
Our last Dogecoin article, on October 18, had the supply side in view: 13.82 million new DOGE a day, a fee share of 0.05 percent of miner revenue. Since then the price has moved from around $0.0795 to $0.0791, practically unchanged, but the daily range has widened to 5.3 percent and turnover has fallen by almost half. Issuance remains unchanged at 10,000 DOGE per block. The only new element is the demand side: the Santiment figures for October 12 to 16 were not yet available on October 18.
Set both sides against each other and this Monday's picture emerges. At today's price, 13.82 million new DOGE a day are around $1.09 million of fresh supply, every day, without a break. The $47.5 million of buying covers 43 days of that. It is more than a footnote and less than a turning point.
The levels: $0.0761 below, $0.0878 as a line
Monday's daily low sits at $0.0761. Below that begins the area we described on October 14 in the article on the February low as the next zone of support. That level has held since, but Monday morning tested it at $0.0761, considerably closer than five days ago, when the low stood at $0.0845.
On the upside the first hurdle is the daily high of $0.0801, the round eight-cent mark. Above it follows the 200-day line, which on October 4 ran at $0.0878 by our own calculation. From Monday's price that is 11 percent away. As long as turnover stands at $590 million, the counterparty for that path is missing: a rise of 11 percent needs buyers who buy into a thin book, and that is exactly what drives the price against the buyer.
The counter-calculation: $1.09 million of new supply a day
Dogecoin has no cap on supply. The protocol pays out a fixed 10,000 DOGE per block, and at a block time of roughly one minute that gives about 5.04 billion DOGE a year. Measured against today's circulating supply of 156.379 billion, that is 3.2 percent supply growth a year. The share falls every year, because the absolute amount stays fixed while the circulating supply grows. Holding DOGE and doing nothing therefore costs around three percent of your share of the total stock each year, even if the price stays unchanged.
Alongside that stands a second figure describing the institutional part of demand. The American Dogecoin ETFs hold around $14.4 million according to SoSoValue data and have booked almost no inflows or outflows in October. Against a market capitalisation of $12.37 billion that is 0.12 percent. For investors in Germany the figure is a sentiment gauge and nothing more: these funds cannot be bought in Germany because they carry no European authorisation.
Our assessment: the buying by large addresses is a real signal, but it does not carry far in this market. The numbers above speak for that, $47.5 million of buying against $1.09 million of daily new supply and turnover halved to $590 million. Equally documented is the argument against: the same thinness amplifies every move, upwards as well as downwards. If real demand sets in, a book like this needs less capital than usual to take the eight-cent mark and the 200-day line. Betting on a recovery therefore means betting not on the buying but on turnover coming back. That is an assessment of the situation, not a recommendation to buy.

FIFO per exchange: what the wallet-by-wallet view means for DOGE holdings
FIFO stands for first in, first out and means that on a sale the tokens bought first count as the ones sold first. What matters is which pool the calculation runs over. On the question of whether several exchanges are pooled together, there is guidance pointing to a wallet-by-wallet view, which we set out on the morning of October 19. Wallet-by-wallet means that each exchange and each wallet is calculated on its own, not all of them jointly.
For Dogecoin this point is more practical than for most large coins, because DOGE is traded more often and in smaller pieces. Buying the same coin on two exchanges and selling on one leaves a separate order per exchange and therefore a separate holding period. An export per exchange is not a convenience, then, but the basis of the calculation. Without a purchase record, tax advisers warn, an estimated assessment to your disadvantage is the likely outcome.
The holding period hangs on that. After a year of holding, a gain from a private sale is tax-free, and the clock runs per acquisition. Abolishing it has been weighed several times and so far not decided; we track the current state, including voting outcomes, on our page on the crypto holding period. As long as the rule stands, it is the strongest lever a private investor in Germany has at all, and it costs nothing but patience and records.
The three routes into Dogecoin and their consequences
Investors in Germany have three routes to a position in Dogecoin, and they differ markedly in tax terms. A direct purchase on an exchange with self-custody falls under private disposal: a one-year holding period, tax-free thereafter. An exchange-traded product on DOGE, in Europe an ETN or ETP, is depending on its structure a security and is then subject to flat-rate withholding tax with no holding-period benefit. The American Dogecoin ETFs are the third case and cannot be bought in Germany.
The difference is not a detail. On a gain of €1,000 after more than a year, a direct purchase leaves €1,000; a security leaves around €736 after withholding tax and the solidarity surcharge. That is the price of convenience, and it can be read for every product in the key information document before you buy.
Custody belongs to the decision. Holding the tokens yourself means carrying the risk of key management and keeping full control over the timing of a sale. Leaving them on the exchange saves the effort and makes you dependent on its solvency. Both routes are defensible; the difference belongs before the purchase and not after it.
Dogecoin at $0.0791: without turnover the buying stays ineffective
The purchase of 600 million DOGE is documented; its effect remains tied to a turnover that has halved. Three concrete steps follow from that:
- Place the order differently. At $590 million of daily turnover and a 5.3 percent daily range, a market order costs measurably more than a limit. Check the order book depth for your pair before buying and set the limit where volume actually sits in the book, rather than taking the market price.
- Document per exchange. Because the calculation runs wallet by wallet, pull the transaction export for each exchange separately and keep it. A tax tool with a portfolio tracker takes over the ordering per wallet and saves the manual work at year-end.
- Keep the deadlines in your calendar. Note the date for every acquisition so you know the anniversary instead of estimating it. You can follow the state of the reform debate through our running page on the holding period.
(As of October 19, 2026. This article is not investment advice. Prices and fee structures change; check the terms with the provider before you buy. Cryptocurrencies are highly volatile and a total loss of the capital employed is possible.)
Overnight into October 17, the Cronos network released around 1.17 billion CRO. That is about 2.33 percent of the circulating supply, and depending on the data provider the tranche is worth between $69.5 million and $73 million. It was the largest scheduled token unlock of the week across the entire crypto market. The tokens did not go to the team or to early backers: they went in full to the network's Strategic Reserve.
If you hold CRO in Germany, the size itself matters less than the ratio. CRO turns over only around $6.2 million a day, so the released tranche is roughly eleven to twelve times the entire daily turnover. This article sets out what that means in practice, where the price stands after the release, and which points to settle on access route, custody and tax.
What was released on October 17: 1.17 billion CRO from the Strategic Reserve
The release followed a fixed schedule rather than any event. Several market watchers had it on their radar days in advance: the trade publication Crypto Times listed CRO as the single largest position as early as October 12, in a week when unlocks across all tokens came to roughly $155 million. The news service run by KuCoin also named the tranche in advance at 1.17 billion CRO and flagged the overnight timing.
Estimates of the dollar value differ because the services use different prices at the moment of the estimate. The range runs from about $69.5 million based on Token Unlocks data up to roughly $73 million in other tallies. Leave that range as it stands rather than narrowing it to a single figure: it shows how strongly the value of a release swings with the daily price.
What matters for context is where the tokens went. An unlock to a founding team or to venture backers is read by the market as immediate selling pressure, because those groups typically take profits. The Strategic Reserve, by contrast, is a network treasury. Among other things it funds validator rewards and growth programmes. Whether selling pressure comes out of this tranche therefore depends on how quickly the reserve spends the money and who receives it.
Cronos price at $0.0572: the weekly picture after the release
CRO trades at $0.0572 on Monday morning, around €0.0510, after a gain of roughly 1.0 percent in 24 hours. Over seven days it is down 8.3 percent, over 30 days down 2.7 percent. Market capitalisation stands at $2.90 billion, which puts CRO 38th among all crypto assets. These figures come from CoinGecko's public market data, as of Monday, 8:54 a.m.
The weekly path says more than the snapshot. CRO reached its weekly high of $0.0626 on October 12, five days before the release. The weekly low followed on the evening of October 18 at $0.0550, a day after it. Between high and low lie 12.2 percent.
Even so, no causal chain follows from that. The broader market gave way on October 18, and market watchers attributed the decline in CRO explicitly to that general risk aversion rather than to network news. The release fell into a weak market phase; it did not cause one. CRO remains 93.6 percent below its record of $0.8915 from November 2021.

Daily turnover of $6.2 million: why the supply weighs more heavily at CRO
This is the point that sets this release apart from many others. CRO's trading turnover over the past 24 hours came to around $6.2 million. Against a market capitalisation of $2.90 billion, that is 0.214 percent. For comparison we took two crypto assets of a similar size: TRON comes to 0.978 percent, Litecoin to 5.97 percent. Relative to its size, CRO therefore changes hands four to almost thirty times less often than those two.
cryptoticker.io compiled this analysis itself on October 19, 2026. It is based on CoinGecko's public market data for three verified crypto assets: Cronos, TRON and Litecoin, in each case price, market capitalisation and trading turnover over the past 24 hours.
Market depth describes a market's ability to absorb larger orders without the price swinging sharply. A thin market reacts more violently to the same volume of selling than a deep one. That is precisely why the ratio of turnover to market capitalisation is more useful to you in practice than the absolute size of the release: if even a tenth of the 1.17 billion CRO reached the market in short order, it would exceed a full day's turnover.
Two things follow for practice. First, expect price slippage on larger buy or sell orders and avoid market orders wherever a limit is possible. Second, it pays to look at where liquidity actually sits. A venue with a thin order book costs more on entry and exit than any trading fee; which venues are accessible in Germany and how their spreads compare is set out in our crypto exchange comparison.
Strategic Reserve: what sets it apart from a team unlock
The Strategic Reserve is a token holding managed by the network, released on a fixed schedule to fund network tasks, above all validator rewards. It is not an escrow account for investors and not a revenue pot for the company behind the network.
The difference from a team or investor unlock matters considerably for price formation. An investor unlock marks the end of a lock-up after which a clearly identified group is allowed to sell, and often does. A reserve release initially changes only the status of the holding: from that moment it counts towards circulating supply, yet it still sits in the network's treasury. Only when it is passed on to validators or programme participants do the tokens reach private hands.
What to take from that for your own observation: the release itself is an accounting step. The question that moves the price is how briskly the reserve pays out. The release schedule gives no answer to that, and none of the available sources names a binding payout rhythm for this tranche.
51.2 percent in circulation: how many CRO are still outstanding
A look at the supply ratios shows why this topic will stay with CRO for some time. Circulating supply currently stands at 50.73 billion CRO. Total supply comes to 98.99 billion, the hard cap to 100 billion. That puts 51.2 percent of total supply in circulation, and around 50.7 percent measured against the cap.
Put differently, almost half of all CRO that will ever exist is still outstanding. Roughly 49.3 billion tokens can still enter circulation in the years ahead. At 1.17 billion, the October 17 tranche was therefore neither an exception nor an end point, but one step in a long series.
A side glance at other crypto assets helps with the comparison: Shiba Inu had 99.96 percent of its tokens in circulation as counted on October 18, XRP only 63.1 percent. At a good 51 percent, CRO sits nearer the bottom of that range. The smaller the circulating share, the longer supply growth acts as a counterweight to demand.
228 million burned CRO against the running releases
On the other side of the ledger stands the reduction in supply. In early October the Cronos community voted to burn 228 million CRO from the community pot, permanently removing them from circulation. As we reported on October 9, that burn stood against the monthly release from the reserve (our analysis of the burn and the reserve).
The orders of magnitude stand in a clear relation. The gap between the hard cap and today's total supply comes to roughly 1.01 billion CRO; that is the amount removed from total supply over the years as a whole. The single tranche of October 17, at 1.17 billion CRO, was larger than that entire reduction. A burn of this size therefore does not offset one monthly release.
That is not a verdict on the network but a statement about supply. Supply-reduction programmes work when they are permanent and large enough relative to issuance. At CRO the issuance side is currently the stronger one. For holders, that means a single burn resolution is no argument that neutralises the release side.

Buying CRO in Germany: licensing, venue and spread
Since the EU regulation on markets in crypto-assets took full effect, only authorised providers may trade crypto assets for retail clients in Germany. MiCA is that regulation; it requires trading platforms to hold authorisation as a crypto-asset service provider and sets out, among other things, how client funds must be held. Before you buy CRO, it is worth checking whether your provider holds that EU authorisation and whether it lists CRO at all.
The second point is the price of access. With a crypto asset that turns over only 0.214 percent of its market capitalisation a day, the spread, meaning the gap between bid and ask, often weighs more heavily than the headline trading fee. Spread-based providers quote no fee at all and earn precisely on that gap. Check both items together, not just the percentage in the advertising.
Third, the question of the access route. CRO is reachable through centralised venues; an exchange-traded product on CRO that would let you buy the asset in a regular securities account is not established in Germany. If you prefer the route via a brokerage account, there is currently no reliable equivalent for CRO.
Holding period and tax on CRO: what to settle by year-end
For private investors in Germany the one-year holding period under Section 23 of the Income Tax Act still applies to crypto assets: hold for longer than a year and the gain is tax-free on sale; within the year the gain is taxed at your personal rate, above an exemption threshold of €1,000 per calendar year.
That framework is up for debate, however. The Federal Ministry of Finance has put forward a draft bill that would classify gains from crypto assets as investment income and tax them at a flat 25 percent regardless of holding period. No cabinet decision has been taken, and the draft provides for grandfathering of holdings acquired before 2027. So rely on the law as it stands today, but document your purchase dates cleanly.
In practice that means keeping a record of the date, quantity and value of every CRO purchase. With a crypto asset that often arrives through programmes and rewards, many small additions build up quickly, each with its own acquisition date. Which tools keep that history and prepare it for a tax return is shown in our overview of crypto tax tools and portfolio trackers.
Custody and staking: where the rewards come from
Part of the reserve releases funds rewards for those who secure the network. If you put CRO to work and receive yield for it, that yield comes to a considerable extent from newly issued tokens rather than from a profit earned by the network. A nominal return is therefore not income in the sense of an interest payment: supply growth can consume it entirely or in part.
Custody risk has to be judged separately. Leave CRO sitting on a trading venue and you carry that venue's counterparty risk. Move the tokens into your own custody and you take on responsibility for securing your access credentials yourself. Both are legitimate; you just want to know which risk you have chosen. To compare platforms that offer yield, weigh their terms and lock-up periods against each other first; our comparison of staking platforms gives an overview.
With lock-ups, bear in mind the link to price risk as well: tokens tied up for a fixed term cannot be moved in a weak market phase. With a thinly traded crypto asset that weighs more heavily, because the exit after the lock-up ends also costs you slippage.
Levels above and below: $0.0550 and $0.0626
Two reference points emerge from the weekly path, to be understood as observation rather than price target. On the downside lies the weekly low of October 18 at $0.0550. Below that, the area around $0.0500 would be the next round number. On the upside the weekly high of October 12 at $0.0626 marks where the price stood before the release; $0.0600 sits in front of it as a round level.
The distance from the current price to both edges is modest: around 4.0 percent to the low and about 9.5 percent to the high. Given CRO's thin market depth, both stretches can be covered in a single day, in either direction. A running assessment of the price trend is available on our Cronos price prediction.
The available sources name no dated event for CRO in the next two weeks. The next scheduled reserve release follows the monthly rhythm; no binding date and no binding amount for the next tranche have been published.
What the situation changes for CRO holders in Germany
In sum, the release of October 17 changes nothing about how the network works, but it makes visible a supply ratio that was easy to overlook before. A thinly traded crypto asset receives scheduled supply in a size that exceeds daily turnover many times over. That is no reason to hurry in either direction; it is a reason to choose the access route and your own holding period deliberately.
Two things remain open and are worth a second look: how briskly the reserve actually passes on the released tokens, and whether further burn resolutions follow that go beyond the order of 228 million CRO. Both decide whether the supply growth reaches the market or stays in the network treasury.
CRO unlock: the key points for your decision
- Settle the access route and the costs. Check whether your provider holds an EU authorisation, lists CRO, and how spread and trading fee add up together. With a thin order book the spread is the larger item; the terms at the accessible venues are in our crypto exchange comparison.
- Place the source of the yield and the lock-up. If you put CRO to work for rewards, establish where that yield comes from and how long your tokens are tied up. Our overview of staking platforms compares providers' terms and periods.
- Document your acquisition dates. Record the date, quantity and value of every addition, including small rewards, so the one-year holding period stays verifiable. Which tools take that over is shown by the crypto tax tools.
(As of October 19, 2026. This article is not investment advice. Prices and fee structures change; check the terms with the provider before you buy.)
On Thursday, October 29, 2026, the Governing Council of the European Central Bank decides on euro area interest rates. The decision falls on the second day of the meeting, after which ECB President Christine Lagarde steps in front of the press. For your crypto portfolio this ECB rate decision matters for a reason that has little to do with the price on the day: the risk-free rate in euros now sits above the yield Ethereum staking delivers. Hold crypto and from this autumn you are no longer comparing against zero but against 2.5 percent.
This piece sets the date in context: where the rates stand today, why the central bank raised them at all, what a further step would mean for the price, for staking yields and for leveraged positions, and which points can be settled calmly in the ten days before the meeting. You will not find price forecasts for October 29 here. Anyone telling you how Bitcoin reacts to a decision nobody yet knows is guessing.
The Governing Council of the European Central Bank meets on October 28 and 29
The meeting calendar of the European Central Bank lists October 28 as day one of the monetary policy meeting in Frankfurt and October 29 as day two, followed by the press conference. That is the usual sequence: deliberation starts on Wednesday, the decisions and their reasoning come on Thursday. The decision is published in the early afternoon Central European Time, with the press conference following a good half hour later.
What matters for planning is the date after it. The next monetary policy meeting of the Governing Council is not in the calendar until December 16 and 17, 2026. Whatever is decided on October 29 therefore holds for around seven weeks. There is normally no interim decision; the central bank departs from that only in severe market disruption.
Deposit rate 2.5 percent: where the policy rates have stood since September 16
The ECB steers the money market through three rates. The most important is the deposit facility rate, the rate banks receive for overnight deposits with the Eurosystem. Since the decision of September 10, 2026, effective from September 16, the central bank's official rate table carries these values:
- Deposit facility: 2.50 percent. The rate that overnight money and short-term euro deposits take their bearings from.
- Main refinancing operations: 2.65 percent. The rate at which banks borrow weekly against collateral.
- Marginal lending facility: 2.90 percent. The overnight credit rate, the ceiling of the corridor.
The path to those levels explains why the subject counts right now. In June 2025 the deposit rate stood at 2.00 percent, the trough of the easing cycle. On June 17, 2026 the ECB lifted it to 2.25 percent, and on September 16 to 2.50 percent. Two increases in one year, after years of falling rates: since the summer of 2026 the euro area has been in a tightening cycle again, not in a phase of cuts.
Inflation at 3.8 percent: the reason for September's rate step
Price developments supply the reasoning. On October 16 Eurostat confirmed the annual euro area inflation rate for September 2026 at 3.8 percent, after 3.2 percent in August. That is the highest reading since September 2023 and sits well above the two percent target the central bank has set itself.
The rise comes almost entirely from one direction. Energy grew 18.9 percent more expensive within a year and so accounted for the bulk of the jump; without that rise in energy prices the rate would sit close to target. Core inflation excluding energy, food, alcohol and tobacco, by contrast, edged up only slightly to 2.5 percent. For Germany, Eurostat reports 3.3 percent.
That breakdown is decisive for assessing the date. A central bank can treat inflation driven mostly by energy prices differently from inflation that has settled into wages and services. Energy prices act with a lag and can fall back just as quickly. Whether the Governing Council adds another step on October 29 or waits hangs on precisely that question.

Fed on the 28th, ECB on October 29: two rate decisions in 24 hours
The week carries a peculiarity that often gets lost in European calendars. The US Federal Reserve meets on October 27 and 28 according to its own meeting calendar, the ECB on October 28 and 29. About a day lies between the two decisions.
For the crypto market the order carries weight. The Fed decides first, and the crypto market trades in US dollars: Bitcoin dominance stood at 60.2 percent on October 19, with total market capitalisation at around $2.77 trillion. If a marked move runs through the market on the evening of October 28, it very probably originates in Washington rather than Frankfurt. The ECB decision lands the following day on a market that has already priced the Fed in.
In practice that means anyone planning an order or a savings plan execution around those days should reckon with two jolts rather than one. And anyone seeing a large move on Thursday should check first whether it has anything to do with the ECB at all.
ECB rate decision and crypto: the three channels the policy rate works through
The link between monetary policy and cryptocurrencies runs through three channels, and none of them is magic.
The price of money
A higher policy rate makes credit more expensive. Companies and households have less free money, and some of it would otherwise have flowed into risky assets. Crypto sits well down that order of preference, behind equities and bonds. It shows up in inflows from companies and funds, not in a single day's price.
The alternative without price risk
As long as overnight money paid nothing, holding Bitcoin cost no forgone interest. At a deposit rate of 2.50 percent that changes. Any asset delivering no running income now competes with a rate you receive without price risk. The same applies to Bitcoin and to gold. Specialists call it opportunity cost.
The euro-dollar exchange rate
If euro area rates rise faster than US rates, the euro tends to firm against the dollar. Bitcoin is quoted in US dollars. A firmer euro lowers the euro price of a coin even when the dollar quote does not move. On October 19 Bitcoin stood at around $82,700 and around €73,700; Ethereum at about $2,428 and €2,164. Count in euros, then, and you never see exactly the same move as an observer watching the dollar quote.
Staking yield against the risk-free rate: 2.20 against 2.50 percent
This is where the rate decision gets concrete for crypto investors. The yield from Ethereum staking currently sits below the ECB deposit rate. DefiLlama data show an annual yield of around 2.20 percent for Lido, the largest liquid staking provider, on roughly $23.4 billion of deposited capital, and around 1.98 percent for Rocket Pool. Our own measurement of October 18 came to 2.21 percent and set it against the ECB rate of 2.50 percent; the assessment is in our analysis of the staking yield below the ECB rate.
The comparison limps in one place by design, and that belongs in the picture. A staking yield accrues in ether and carries the cryptocurrency's full price risk, plus smart contract risk and, at some providers, a withdrawal period. The central bank's deposit rate, by contrast, is interest on euro balances. Two yields in two different currencies with two different risks cannot be set cleanly against each other.
Something shifts nonetheless. Hold ether solely for the staking yield and above a certain rate level the argument weakens. If the ECB raises again on October 29, that gap widens. Which platform pays out how much and which lock-up periods apply is shown in our comparison of staking platforms; a look at the actual net yield after fees pays off before any renewal.
Bitcoin on rate days: leverage and liquidation in a thin order book
Dates with a fixed time create a pattern of their own. Ahead of publication many traders pull their orders out of the book, because nobody wants to stand on the wrong side of a surprise. The order book thins out, and in a thin book the same order size moves the price further than usual.
For leveraged positions that is the dangerous part. A liquidation is the forced closing of a position when the margin no longer suffices. It is triggered by the brief spike in between, not by the closing price. Trade with leverage and you check the distance between the current price and your own liquidation price before days like these, then decide deliberately whether that buffer is enough for a rate decision.
Without leverage the subject is calmer. A spot holding survives a swing of a few percent without consequence, as long as you do not have to sell.

Euro balances, stablecoins and overnight deposits between the dates
A rising deposit rate also affects the money sitting on an exchange between two purchases. Three routes are open, and they differ in one point that is easily overlooked.
A euro balance in a German overnight deposit account earns interest, and the level follows the central bank's deposit rate at some remove. A euro balance on a crypto exchange as a rule earns nothing; it sits there ready as a means of payment. Euro stablecoins, in turn, are tokenised euro claims; the interest income from the backing reserves accrues to the issuer, not to the holder.
At a deposit rate near zero that difference was immaterial. At 2.50 percent, a larger balance sitting unremunerated on a trading platform for months costs noticeable money. Leave longer gaps between purchases and you move the part you do not need back to the bank account. Which venues offer a euro deposit without the detour through a stablecoin is set out in our crypto exchange comparison.
Analysts' expectations point to December, not to October
A rate decision cannot be predicted, but it is possible to show what professional observers reckon with. In its Kapitalmärkte Weekly of October 2, 2026, LBBW writes that it expects two further increases of 25 basis points each in the euro area by the end of the first quarter of 2027; the bank sees the peak at a deposit rate of 3.00 percent. It names the Governing Council's December meeting as the most likely date for the next step.
Against an increase as early as October 29 stands the composition of the inflation: the jump to 3.8 percent came from energy prices, while the core rate stayed comparatively calm at 2.5 percent. For it stands the fact that the headline rate sits as far above target as it last did in 2023, and that the central bank has already acted twice this year. Both readings are defensible, and the Council takes the decision with data that will be fresher on October 29 than it is today.
For your own planning, then, a different question is more useful than the one about the outcome: what changes in the portfolio if the deposit rate stays at 2.50 percent, and what if it rises to 2.75 percent? Think both cases through once beforehand and there is nothing to decide on the day.
Rate rise or rate cut: why both directions count for assets without interest
The effect of monetary policy on crypto fits into one sentence: rising rates raise the price of parking money in an asset with no running income, falling rates lower it. The crypto market shares that role with gold, which also pays no interest and whose course is routinely watched on rate days.
So for assets without interest a cut usually works in the opposite direction from a rise, and through the same mechanism. Financial markets trade the deviation from expectations, not the decision itself: a rate that comes in exactly as priced moves little. What counts is the tone of the reasoning, that is, whether the central bank signals further measures or hints at the end of the cycle.
For investors in Europe a second factor comes on top that does not apply in the United States. The rate decisions of the ECB and the Fed have not moved in step since 2026, and the gap between the two rate levels helps set the euro-dollar rate. Live in the EU and pay in euros, and you carry that exchange rate influence with every purchase, regardless of how the dollar quotes of the cryptocurrencies develop.
The position in the autumn of 2026 is therefore unusual: two large central banks are tightening at the same time, and the ECB deposit rate sits above the yield of the largest staking market for the first time in years. What effect that has on inflows into crypto products can only be measured credibly over several quarters, not on a decision day.
The US Federal Reserve moves the crypto market more than the ECB
A look at coverage over past years shows a stable pattern: European crypto media mostly pick up ECB rate decisions the day after, and the market reactions come out weaker than after Fed dates. There are two sober reasons for that.
First, the crypto market trades predominantly in US dollars and is moved by US capital. Second, the greater part of institutional demand flows through US products such as the spot ETFs. Fed monetary policy therefore acts more directly on liquidity and risk appetite in the crypto market than the ECB's does.
It does not follow that the ECB rate decision is irrelevant to you. It acts less through the daily price and more through your own arithmetic: through the interest on your euro account, through the yield your crypto holding has to deliver against it, and through the cost of a loan if you have one running. That effect is slower and more durable than any price swing on a Thursday afternoon.
The tax view before year-end belongs in the same planning
Two months lie between October 29 and the end of the year, and in exactly that window more is decided for German investors than on the rate date itself. Under current German tax law, gains from selling cryptocurrencies are tax-free as a private disposal after a holding period of one year; within the period the personal income tax rate applies, provided the exemption threshold is exceeded. What governs in each case is the acquisition date of the individual position.
Anyone wanting to shift part of a holding into euros because rates have risen therefore looks at the purchase date first, not at the price. A sale eleven months after the purchase can cost more than the same sale four weeks later, and no rate decision makes up for that. The evidence sits in the transaction data of your trading venues; tools that bring that data together we have set side by side in our comparison of tax tools. These lines do not replace tax advice.
ECB rate decision: ten days of lead time remain until October 29
The date is fixed, the decision is not. Three steps can be dealt with calmly in the days beforehand, and none of them calls for an opinion on how the meeting turns out.
- Set your holding's yield against the euro rate. Note what your staking or lending positions actually deliver after fees, and put the deposit rate of 2.50 percent beside it. What the platforms currently pay out and which lock-up periods apply is shown by the comparison of staking platforms.
- Go through the euro balance on the trading platform. Amounts you will not need over the coming weeks sit better in an interest-bearing account than unremunerated on the exchange. Which venues allow direct euro deposits and withdrawals is in the exchange comparison.
- Sort purchase dates and holding periods before you sell anything. For every position its own acquisition date counts. A portfolio tracker gives you that overview; the selection is in the comparison of tax tools and trackers.
On October 29 itself little then remains to be done: read the decision, add the reasoning from the press conference, and run your own arithmetic through once with the new rate. The next date is not until December 17.
(As of October 19, 2026. This article is not investment advice. Prices and fee structures change; check the terms with the provider before you buy.)
In the 24 hours to Monday morning, tokens worth $1.57 billion changed hands on Solana's decentralised exchanges. On Ethereum the same period brought $706 million. Solana therefore turns over more than twice as much, even though its applications hold only an eighth of the capital. That divergence is the real finding of the week's opening, and it says more about the state of play than the price itself: SOL stood at $105.80 on Monday morning, 2.7 percent above the previous day but still 6.0 percent below its level a week ago (CoinGecko, as of October 19, 8:45 UTC).
Over a monthly view the question is not how much gets traded but whose money is being moved. Where the price can point over a span of months is set out in our Solana price prediction. This article works out the metric that connects the two, and shows what it means for your tax position and your buying route in Germany.
Solana turns over $1.57 billion in a single day
The figures come from the data at DefiLlama, queried on Monday morning. Across all decentralised exchanges on Solana combined, volume over the preceding 24 hours came to $1.566 billion. That is 25.0 percent more than the day before. Over seven days trading adds up to $14.03 billion, a rise of 22.6 percent on the previous week.
A Sunday is not a strong trading day. That turnover picked up anyway, while the price slipped on a weekly view, is the first sign that positions were being rotated rather than added. Solana's market capitalisation stood at $62.4 billion on Monday morning, with 589.4 million SOL in circulation out of a total of 636.0 million.
Ethereum reaches $706 million on eight times the capital
The same query for Ethereum returns $705.9 million over 24 hours, up 20.5 percent, and $8.07 billion over seven days, here only 1.2 percent more than the week before. Solana traded 2.22 times Ethereum's volume on Sunday, and on a weekly comparison the gap is widening.
It is the second figure that makes the comparison meaningful. In total value locked, the capital committed to a blockchain's applications, Ethereum stands at $49.86 billion and Solana at $5.89 billion. That is a ratio of 8.5 to 1 in Ethereum's favour. Two networks whose committed capital differs by a factor of eight come out in reverse order on trading volume.
The turnover: 26.6 against 1.4 percent of committed capital
Those two figures yield a metric that the usual dashboards do not carry: daily turnover. It sets a day's trading volume against committed capital and answers the question of how often the same dollar is moved in a day.
For Solana the sum is $1.566 billion divided by $5.89 billion, so 26.6 percent. Every day a good quarter of all committed capital is pushed through trading once. For Ethereum the same sum reads $706 million divided by $49.86 billion, so 1.4 percent. Turnover on Solana is therefore around 19 times as high. Both values are our own calculations from the DefiLlama figures cited above for October 19; the platform itself does not publish this ratio.
As a metric, turnover is neither good nor bad; it describes the design. High turnover means a network serves a lot of trading on little capital. Low turnover means capital sits and works there rather than being moved.
Why bots move the same capital several times a day
The explanation lies in the costs. A transaction on Solana costs fractions of a cent, and a block closes in under a second. Under those conditions a trade pays off at tiny price differences. Trading bots and aggregators buy the same token several times a day on one exchange and sell it on the next, each time for a spread of a few tenths of a percent. Every one of those passes shows up in the statistics as volume, even though no new money has entered the network.
A second data point supports that reading. The stablecoin base on Solana, the money standing ready in dollar-pegged tokens such as USDC, came to $15.49 billion on Monday (DefiLlama, October 19). That base is therefore around two and a half times the size of the committed capital of $5.89 billion. On Ethereum, $144.04 billion sits in stablecoins against $49.86 billion of committed capital, a ratio of just under 3 to 1. On Solana, then, an above-average share of money is parked in trading liquidity and a below-average share is tied up in lending and yield applications.
Total value locked describes the sum of all deposits held in a blockchain's financial applications, for instance in lending markets, liquidity pools and staking derivatives. When that figure rises, investors have brought capital into the network and committed it there. When it falls, they have withdrawn it, or the price of the deposited tokens has dropped.
Counted in SOL, the network holds less capital than in June
A TVL measured in dollars mixes two things: how many tokens are deposited and what those tokens cost. If the price falls, the dollar figure drops even when nobody has withdrawn anything. So the counter-calculation in SOL is worth doing. For that, DefiLlama's daily TVL was divided by CoinGecko's respective daily closing price, over the past 120 days.
The result: on October 19 the committed capital corresponded to 55.68 million SOL. On October 18 it was still 57.04 million, on October 10 it was 56.47 million. Ninety days ago, on July 21, 63.75 million SOL sat in the network, and the window's high dates from June 25 at 69.08 million. From that high, 19.4 percent of the deposited tokens have gone in not quite four months, and that is independent of the price. On only 20 of 120 days was the figure lower than today; the window's low falls on September 29 at 54.09 million SOL.
This calculation is not someone else's analysis but our own work from two freely available series. The counter-calculation separates the price problem from the quantity problem and shows that the decline in committed capital does not hang on the fallen price alone.

What has changed since Sunday's emission article
On Sunday evening we worked through Solana's emission here: 22.88 million new SOL a year and $1.56 billion sitting in the funds, as set out in our piece on the emission of 22.9 million SOL a year. Three things have shifted since.
First the price: on Sunday SOL averaged $103.36 over the day, on Monday morning $105.80, a rise of 2.4 percent. Second the committed capital: it fell from $5.896 billion to $5.890 billion, and counted in SOL from 57.04 million to 55.68 million. The decline in the token quantity is therefore much larger than the one in the dollar sum, because the higher price masks the difference. Third the trading: daily volume picked up by a quarter.
Taken together that means the price rise from Sunday to Monday came with more trading but less deposited capital. Sunday's emission question remains open, because no vote has been held on proposal SIMD-0550 since.
The levels: $100.48 below, $106.05 above
On October 14 we named the $100 level here as a test. The level has held since, but without much room. In the 24 hours to Monday morning the low was $100.48 and the high $106.05 (CoinGecko). The current price therefore sits 5.3 percent above the daily low and 0.2 percent below the daily high.
What justifies those two values is that they were actually traded this weekend, not a chart pattern. To the upside the next marker is the level of October 12, when SOL averaged $111.25 over the day; the figure $109.07 dates from October 10. To the downside the round $100 stands, and its defence has now been running for five days. SOL is 63.9 percent away from its all-time high of $293.31 on January 19, 2025.
$9.71 million in fees in one day, and who gets them
High turnover is not without consequence; it generates income. Fees accruing on the Solana blockchain added up to $9.71 million in the 24 hours to Monday morning and to $79.76 million over seven days (DefiLlama, October 19). Measured against committed capital of $5.89 billion, the daily figure amounts to a rate of 0.16 percent, which annualised puts it in the order of 60 percent of the capital committed today.
That extrapolation is an arithmetic check, not a forecast, because fees swing with trading. The check does show what the turnover ratio means in economic terms: a network with little committed capital and a lot of trading earns from movement, not from sitting still. Part of that income flows through the block reward to the validators and hence to the stakers, the rest to the applications the trading went through.
How to work out the turnover yourself
The metric needs no paid data source. Two values are enough, and both are freely available online.
- Open the blockchain's page at DefiLlama, for instance the overview page for Solana. It carries the current TVL and the 24-hour trading volume of the decentralised exchanges.
- Divide the volume by the TVL and convert the result into percent. For Solana on October 19: 1.566 divided by 5.89 gives 0.266, so 26.6 percent.
- Repeat that for a second blockchain and compare. The important thing is to read both values on the same day and at the same time, because the 24-hour volume shifts continuously.
Anyone recording the series over several weeks will see whether a network is drawing in capital or only trading. If volume rises while TVL falls, turnover grows and the network lives more off short-term trading. If both rise, new money is arriving. For judging a coin that is the more honest series than the volume figure alone, which projects like to advertise with.
Every swap starts the one-year period again
High turnover in the network has a tax counterpart in the portfolio, and in Germany that hits everyone who swaps actively. Gains from selling cryptocurrencies are a private disposal under section 23 of the Income Tax Act. If more than twelve months lie between purchase and sale, the gain stays tax-free. Below that it is taxed at your personal income tax rate as soon as the sum of all private disposal gains for a year reaches the exemption threshold of €1,000.
What counts as a disposal is decisive here. Swapping SOL into a stablecoin or into another token is also a disposal, and for the newly acquired holding the one-year period starts from scratch. Take part in the turnover and swap back and forth several times within a few weeks, and at the end of the year you hold not one position with one holding period but many, each with a fresh one. We track the current state of the political debate about that period on our page on the crypto holding period.
In practice that means you need a record of every swap with the date, the amount and the euro value, because the tax office assesses the holding period per acquisition. Which programs build that allocation out of exchange data is shown in our comparison of crypto tax software and portfolio trackers. A separate rule applies to staking income: staking rewards count on receipt as other income under section 22 number 3 of the Income Tax Act, with its own exemption threshold of €256 a year.

Buying route and custody: where the paths differ
Since the EU regulation MiCA came into full effect, anyone wanting to buy SOL in Germany has essentially two routes. The first runs through an authorised service provider that holds the tokens for you. There the key sits with the provider, access is simple, and losing your login details can usually be remedied. Which providers charge what and which authorisation they hold is set out in our overview of the best crypto exchanges.
The second route is self-custody on a hardware wallet. You then hold the private key yourself, nobody can freeze your holding, and you carry the risk of losing the key alone. For staking SOL the difference is concrete: with self-custody you delegate to a validator yourself and pick its commission, whereas with a custodian the custodian decides on the offer and keeps part of the income. The range of terms is shown in the comparison of staking providers.
To put the yield in context: the reward for staking SOL comes out of the emission of new tokens and out of part of the network fees. Since emission keeps falling under the schedule described on Sunday, the future yield hangs more heavily on the fees, and therefore on precisely the turnover this article is about.
Our assessment: trading without new money
From the newsroom's point of view the turnover carries the story of Solana as the fastest trading venue, but it does not carry the story of capital inflows. The evidence sits above: volume rose 22.6 percent over seven days, while committed capital counted in SOL fell from 56.47 to 55.68 million and the price lost 6.0 percent. More trading on fewer deposited tokens with a falling price is the pattern of rotation within the network.
Against that stands the fee side. $79.76 million over seven days is real income, not a bookkeeping entry, and part of it flows to the stakers. A network that earns from movement does not strictly need growing committed capital to work economically. Anyone holding SOL should therefore follow both series and not the volume figure alone, because on its own it does not answer the question of new money. This is explicitly not a recommendation to buy or sell.
Solana at $105.80: the turnover carries, the inflow is missing
Monday morning's position can be worked through in three steps.
- Work out the turnover ratio for Solana and a comparison blockchain yourself once and note it with the date, so that in two weeks you have a series of your own. The instructions are above.
- Check the purchase date for every SOL holding in your portfolio, and with it when the one-year period expires. Which programs build that out of exchange data is shown by the comparison of crypto tax software.
- Decide deliberately between custody at a provider and your own wallet, because the staking terms hang on it. Provider terms are in the overview of staking platforms.
(As of October 19, 2026. This article is not investment advice. Prices and fee structures change; check the terms with the provider before you buy.)
A token unlock is the date on which a project's locked tokens become tradable. Nothing is created in the process: the supply has existed all along, it was simply held in a contract that would not release it before a given date. What matters, then, is how that figure compares with circulating supply and the schedule under which it comes free, not the headline with the big number. Two patterns shape that schedule: the cliff, a single large release after a lock-up, and linear vesting, where the same supply trickles out in instalments over months.
The difference is not a technicality. With a cliff, the entire supply hits the order book on one day. With linear vesting, the same supply spreads across twelve or twenty-four dates, none of which stands out on its own. Tell the two patterns apart and a vesting schedule shows you when selling pressure builds and when it has already been priced in.
What a token unlock is, and why nothing new is created
When a token is issued, a project sets out how total supply is divided: to the team, to early investors, to a foundation, to reward programmes, to the open market. Only part of that is tradable on day one. The rest sits in a vesting contract, program code on the blockchain that will not hand the tokens over before a set point in time. An unlock is the moment that contract releases part of the supply.
That is why the phrase "new tokens are coming to market" misleads. Total supply does not change, only the tradable share does. Two terms keep the distinction clear. Circulating supply is the number of freely tradable tokens. Total supply covers every token in existence, locked ones included. Total supply times the price gives the fully diluted valuation, or FDV. When FDV sits far above market capitalisation, a lot of supply is still inside the contract. Why freshly listed tokens with that gap often collapse is worked through with examples in our analysis of FDV and circulating supply.
Cliff: a lock-up, then a single large release
A cliff is a lock-up at the end of which a large amount comes free in one step. Six or twelve months after trading starts is typical. The original purpose is a sound one: team and early investors should not be able to sell on day one. The price for that is a fixed date on which supply jumps.
How big that jump can get shows up in individual cases in our own coverage. At Kite a one-year lock ends in early November, and on our count of October 17, 2026 that frees 1.11 billion tokens, equal to 43 to 46 percent of circulating supply there — set out in our assessment of the Kite unlock in early November. A cliff on that scale is a different animal from a monthly tranche of two percent.
What counts is not the absolute figure but the share of circulating supply. A billion tokens sounds large, yet against a circulating supply of a hundred billion it is one percent. That same billion against a circulating supply of two billion is half. The number alone says nothing; the ratio says everything.
Linear vesting: the same supply, spread across many dates
Under linear vesting the contract releases equal portions at equal intervals, usually monthly, sometimes weekly or block by block. The total at the end is the same as under a cliff, but the effect on the price differs sharply: recurring small releases work like a steady stream of supply the market can adjust to, not like a single blow.
Many projects combine the two: a cliff first, then linear tranches. At Plasma, as we reported on October 15, 2026, a cliff became a schedule of 24 monthly tranches in which the first tranche amounts to around five percent of circulating supply — the details are in our piece on the XPL unlock on October 25. At Arbitrum, on our count of September 30, 2026, 92.6 million ARB leave the lock every month, a pattern we broke down under Arbitrum and the end of the lock-up.
For assessment purposes that means a single date in a linear schedule is rarely an event. The schedule as a whole is one, because it tells you how much supply is still to come over the next twelve months.
Who receives the tokens, and why that decides the effect
The same supply acts entirely differently depending on whose hands it lands in. Four recipient groups are typical, and each behaves in its own way.
Early investors and venture capital
These backers bought in an early round at a fraction of today's price. Even a sale well below the current level remains a profit for them, and many funds owe their own investors a duty to realise gains. This group generates the hardest selling pressure.
Team and founders
For team and founders the tokens are compensation. A partial sale is routine and no warning sign in itself. It becomes notable when the entire allocation starts moving shortly after the cliff, because that can be traced on the blockchain.
Foundation and project treasury
These tokens go into grants, partnerships and developer programmes, and reach the market with a delay, by many small routes. Effect on the price: real, but dispersed.
Rewards for users, staking and liquidity
Here tokens flow to many recipients in small amounts. Some are sold at once, some are left alone. Whether the supply can be sold at once at all hangs on a second lock that is often overlooked: the waiting period for unstaking. How long that runs at the large networks is set out in our piece on the staking lock-up period and the duration of unstaking.
Locked, incidentally, does not always mean nobody can sell. Anyone expecting locked tokens can hedge them in advance through futures or hand them on at a discount in the over-the-counter market. The selling pressure then builds before the date rather than on it. That a large locked amount shifts expectations on its own we described using the case of 700 million HYPE outside circulation.

Four numbers that make a vesting schedule readable
A vesting schedule consists of a handful of figures, and four of them are enough for an assessment.
First, the share of circulating supply. Divide the amount coming free by current circulating supply. Below two percent is a routine date, above ten percent an event, above thirty percent a doubling of supply within reach.
Second, the ratio to daily turnover. Set the cash value of the amount coming free against average daily trading turnover. If the release equals twenty times daily turnover, the market cannot absorb it in a day even if everyone wanted to sell. If it equals a fraction of it, the figure is a headline without consequences.
Third, the recipient group. Does the schedule say what share goes to early investors, to the team, to the foundation and to rewards? Without that breakdown, half the information is missing.
Fourth, what remains in the contract. How much is still locked after this date, and until when? A project with 90 percent of total supply still inside the contract has an unlock ahead of it every month.
These four numbers sit in a project's tokenomics documentation and in the unlock calendars of the analytics providers. Which tools show such calendars, circulating supply and on-chain movements together is covered in our comparison of analytics platforms.
Why the price often falls before the date rather than on it
An unlock date is public, often years in advance. So it behaves differently from a piece of news: the market can price it in. In practice a decline often shows up in the days or weeks before the date, as traders cut positions or bet against it through futures, followed by calm afterwards when the expected wave of selling fails to arrive.
No trading recipe follows from that, only a reading aid: a decline before a large unlock is no proof of a problem at the project, and a quiet unlock day is no proof that nobody sold — the sales may have happened earlier. The assessment only becomes solid once you track the movement of the released addresses on the blockchain, and at most projects that can be done a few days after the date.
Tax in Germany: when a released token starts a holding period
This is where a market topic becomes a topic for your tax return, in two distinct cases.
If you already hold a token and are merely watching a project's unlock, nothing changes for you in tax terms. What governs is section 23 of the Income Tax Act: gains from private disposals stay tax-free when more than a year lies between purchase and sale. Within that period they are taxed at your personal rate as soon as total gains for the year exceed the exemption threshold. Sell out of worry about an unlock shortly before your year is up, then, and the tax can cost more than the price decline you are trying to avoid.
If you receive released tokens yourself — from a reward programme, from staking, from an airdrop or as compensation — the case is different. What then counts is the value at which the tokens arrive and when the holding period begins. That classification depends on the type of inflow and is a matter for tax advice in the individual case; the only certainty is that you have to document the time of the inflow and the price at that moment, because you cannot reconstruct them later. A tool from our comparison of crypto tax software records that data automatically.

Tradability in Germany: an unlock is no help without a venue
A practical point that unlock reports regularly leave out: a supply being technically released does not mean you can buy or sell it from Germany. Many of the projects with large vesting schedules are young tokens listed at only a few venues, and under Regulation (EU) 2023/1114 providers may only supply crypto services in the EU with authorisation. In practice that means checking first whether the token is tradable at an authorised provider, and only then what an unlock date means for it. An overview of venues and their costs is in our exchange comparison; anyone trading mainly in large names such as Bitcoin will rarely meet the unlock question anyway, because no vesting contracts are still running out there.
The second practical point is market depth. A token traded for a few million dollars a day cannot take a release in the tens of millions without individual sales moving the price. Sell into a market like that with a large market order and you pay the discount yourself.
Our assessment of how to handle unlock dates
From the newsroom's point of view, large unlock figures are regularly overvalued in coverage and the schedules behind them undervalued. The evidence comes from the cases in our own coverage: a cliff covering 43 to 46 percent of circulating supply, as at Kite on our count of October 17, 2026, is categorically different from the first of 24 monthly tranches at Plasma at around five percent on our report of October 15, 2026 — yet both appear in reports as an "unlock" with a big number in the title. What follows is this: the two figures that carry an assessment are the share of circulating supply and the ratio to daily turnover, and neither appears in the headline. Against that stands the fact that even a perfectly read schedule says nothing about recipients' intentions; whether a fund sells only shows on the blockchain after the date. No recommendation to buy or sell follows from any of it, and with young tokens carrying large locked amounts a total loss is possible.
Token unlock: the date sits in the vesting schedule, not in the chart
An unlock creates no new money and no new tokens; it only shifts the boundary between locked and tradable. Whether that step means selling pressure comes down to three figures you can gather in a few minutes:
- Calculate the share and daily turnover. Divide the amount coming free by circulating supply and set its cash value against daily turnover. Both values come from the tools in our comparison of analytics platforms.
- Look up the remainder in the contract. Check in the tokenomics documentation how much stays locked after this date and until when. A project with a schedule running for years has a date ahead of it every month; which exchanges list the token at all is shown by the exchange comparison.
- Document your own inflows. If you receive released tokens yourself, record the date and price of the inflow, because valuation and holding period hang on them. A tool from the tax software comparison takes over the bookkeeping.
(As of October 18, 2026. This article is not investment advice. Prices and fee structures change; check the terms with the provider before you buy.)
Decrypt
The Bitcoin treasury firm raised its preferred stock buyback cap to $3 billion and now holds 848,517 BTC, bought at an average of $75,446.
The original “Black Monday” occurred 39 years ago today. Is history about to repeat itself?
Police seized the Autistici/Inventati server under a 1981 treaty after the U.S. designated the Italian activist group “global terrorists.”
Bain Capital, VanEck and Pantera Capital are among design partners for the offering, which also lets users delegate proofs to AI agents.
The victim was hit over the head before his teenage sister alerted police, who arrested all three men at the scene in May.
U.Today - IT, AI and Fintech Daily News for You Today
The discussion highlights a growing focus across the crypto industry on ensuring that major blockchains remain secure as quantum technology advances.
Crypto news this morning, Oct 19: Wall Street's $50 billion AI debt crisis triggers a historic liquidity flight straight into Bitcoin and XRP.
BNB's 37th quarterly burn has permanently removed 1,646,196 tokens, worth about $1.197 billion, from circulation.
Ripple's David Schwartz issues a scam warning to the XRP community, reporting that the official X account of a major XRP-focused self-custody wallet has been compromised.
This has historically been where Ripple makes its most significant product and partnership announcements, with expectations rising for this key event.
Blockonomi
TLDR
- MSTR rebounds 2.09% in premarket trading after Friday’s steep 9.56% decline.
- Strategy raises its preferred securities repurchase authorization to $3 billion.
- Strategy buys 267 BTC for $22.1 million, taking holdings to 848,517 bitcoin.
- The company repurchases 1.94 million STRC shares for $193.1 million in a week.
- Strategy reports $5.28 billion in reserves and cash to support capital needs.
Strategy shares rebounded in Monday’s premarket session after the company raised its preferred securities buyback program to $3 billion. The rise followed a sharp Friday selloff and coincided with another bitcoin purchase disclosed by the company. An October 19 regulatory filing detailed share sales, bitcoin purchases, preferred stock repurchases, and remaining cash resources.
MSTR Stock Rebounds After Friday Selloff
Strategy Inc (MSTR) rose 2.09% to $139.69 in Monday’s premarket trading, reversing some of Friday’s heavy losses. The stock had closed at $136.83 on October 16 after falling 9.56%. The early recovery followed new disclosures about the company’s capital management and bitcoin purchases.
Strategy Inc, MSTR
The board increased its digital credit securities repurchase authorization from $2 billion to $3 billion. By October 18, Strategy had $1.16 billion still available under that expanded authorization. The program covers preferred securities, separate from common stock repurchases.
During October 12–18, Strategy repurchased 1,938,780 STRC preferred shares for $193.1 million. It repurchased no STRF, STRK, STRD, or MSTR common shares during the same week. Meanwhile, Strategy retained $1 billion under its separate MSTR common stock repurchase program.
Bitcoin Purchases Lift Strategy Holdings to 848,517 BTC
Strategy bought 267 additional bitcoin for $22.1 million that week, including transaction fees. The company paid an average of $82,900 per bitcoin for the purchase. Consequently, its holdings reached 848,517 BTC as of October 18.
Strategy funded the purchase mainly through its at-the-market common stock offering. It sold 140,872 MSTR common shares, raising $22 million after sales commissions. Another $100,000 came from cash to cover the remaining purchase cost.
Strategy spent $64.02 billion assembling its current bitcoin holdings, including fees and transaction expenses. Across its total position, the average purchase price stood at $75,446 per coin. Common stock sales and other financing have supported the company’s bitcoin treasury strategy.
Cash Reserve Supports Dividends and Repurchases
Strategy held $4.83 billion in its dollar reserve at the reporting period’s end. It also held $447.3 million in separate cash for corporate purposes. Together, these two balances reached roughly $5.28 billion and supported the company’s wider capital management.
The STRC repurchases drew on general cash holdings rather than the company’s designated dollar reserve. The reserve supplied $45.5 million for preferred stock dividends during the week. Meanwhile, proceeds from new MSTR share sales funded nearly all bitcoin purchases.
Strategy retained $18.79 billion in MSTR stock issuance capacity under its offering program. It sold no preferred shares through the program during October 12–18. These financing options give Strategy several ways to manage securities obligations and fund additional bitcoin purchases.
The post Strategy Inc (MSTR) Stock: Eyes Recovery as Buyback Program Hits $3B appeared first on Blockonomi.
TLDR
- CLF stock rallies 12.39% to $13.65 in premarket trading after strong Q3 results.
- Third-quarter revenue hits $5.6 billion as net income rebounds to $165 million.
- Adjusted EBITDA climbs to $612 million, beating management’s $575 million target.
- Steel shipments reach 4.2 million tons as average selling prices rise to $1,177.
- Cleveland-Cliffs forecasts $715 million in Q4 EBITDA and over $4 billion in 2027.
Cleveland-Cliffs stock surged 12.39% to $13.65 in premarket trading Monday, October 19, after the steelmaker reported strong third-quarter results. The company returned to profit as revenue and steel prices increased. Its outlook for further growth also supported the rally.
Cleveland-Cliffs Inc., CLF
Cleveland-Cliffs Reports Stronger Quarterly Earnings
Cleveland-Cliffs reported $5.6 billion in third-quarter revenue, up from $5.2 billion in the preceding second quarter. It earned $165 million after losing $134 million in the second quarter. Earnings reached $0.26 per diluted share, reversing a $0.25 loss.
Adjusted earnings reached $0.28 per share, versus a second-quarter loss of $0.20. Adjusted EBITDA climbed to $612 million from $286 million during the same three-month reporting period. The result beat management’s $575 million forecast and marked its strongest quarter in three years.
CLF shares closed Friday at $12.12, down 0.25% for the session. Monday’s premarket advance followed improvements in steel shipments, selling prices, and operating performance. The vertically integrated steelmaker supplies automotive, manufacturing, infrastructure, and distribution customers across North America.
Higher Steel Prices Support Revenue Growth
The company shipped approximately 4.2 million net tons of steel during the latest reporting quarter. Steel product sales reached 4.15 million net tons, up from 4.03 million in the second quarter. Average selling prices increased to $1,177 per ton from $1,124 previously.
Within its steelmaking business, quarterly revenue increased to $5.45 billion, generating a $454 million gross margin. That margin exceeded the second quarter’s $113 million as prices and shipments improved. Hot-rolled products comprised 46% of sales volume, while coated products accounted for 31%.
Distributors and converters accounted for 34% of segment sales, while automotive customers represented 28%. Infrastructure and manufacturing contributed 28%, and steel producers supplied the remaining 10%. Stelco improved its operating performance in Canada, although Cleveland-Cliffs plans to idle its galvanizing lines indefinitely.
Cleveland-Cliffs Projects Further EBITDA Growth
Cleveland-Cliffs forecasts approximately $715 million in fourth-quarter adjusted EBITDA despite seasonal weakness and planned maintenance. Higher selling prices should help, although rising costs and compensation expenses will offset some gains. The company ended the third quarter in September with $3.2 billion in liquidity.
Management expects increased cash flow and proceeds from planned property sales to support significant debt reduction. It targets net debt below 2.5 times EBITDA by mid-2027. Meanwhile, limited imports and stronger domestic market conditions have improved its outlook.
Cleveland-Cliffs now expects adjusted EBITDA to exceed $4 billion in 2027. Signed customer contracts and prevailing steel price forecasts underpin that longer-term projection. However, actual earnings will depend on market prices, demand, operating costs, and execution.
The post Cleveland-Cliffs (CLF) Stock: Soars on Strong Q3 Profit and Revenue Growth appeared first on Blockonomi.
TLDR:
- BNB Chain completed its 37th quarterly Auto-Burn, removing 1,646,196.44 BNB from circulation.
- The burned BNB was worth about $1.197 billion and moved to the 0x…dEaD blackhole address.
- The Auto-Burn formula uses BNB’s price and BSC block production, and it is independently auditable.
- Lorentz and Maxwell Upgrades speed up BSC blocks, so the burn formula parameters were adjusted.
The BNB burn for the 37th quarter is complete, with BNB Chain removing 1,646,196.44 BNB from circulation. The tokens were worth about $1.197 billion at the time of the burn.
The BNB Foundation announced the completion of the quarterly event on 19 October 2026. After the burn, the remaining total supply stands at 131,512,085 BNB. The Auto-Burn mechanism aims to reduce the total supply to 100 million BNB over time.
Details of the 37th BNB Burn
The BNB Foundation published the data for the latest BNB burn alongside a transaction ID. Anyone can review the transaction on-chain through the provided link.
The figures were recorded at 10:05 AM UTC on 19 October 2026. Furthermore, the Foundation links a real-time data page showing the amount still to be burned.
This quarter’s BNB burn took place directly on BNB Smart Chain. The change follows the BNB Chain Fusion. Future burns will also occur on BSC.
The burned BNB moves to the blackhole address, 0x000000000000000000000000000000000000dEaD. Tokens sent to this address leave circulation.
The 37th quarterly $BNB token burn has been completed directly on BNB Smart Chain (BSC).
~1.64M $BNB has been burned, worth approximately $1.197B USD
View the details of the burn below
https://t.co/sIm4wp4R1Y pic.twitter.com/062alfYcoM
— BNB Chain (@BNBCHAIN) October 19, 2026

BNB is the native coin of the BNB Chain ecosystem. It powers transactions on BNB Smart Chain, the opBNB L2s, and BNB Greenfield.
Besides transaction fees, BNB serves as a governance token. Holders can therefore take part in the on-chain governance of BNB Chain.
BNB also functions as a strategic reserve asset. Mainstream financial institutions have started to take notice of the coin. The coin is also described as essential for powering its Web3 environment. BNB moved from the Ethereum network to BNB Chain after its mainnet launch on April 18, 2019.
How the BNB Auto-Burn Mechanism Works
The BNB Auto-Burn follows a formula built on two inputs. These are the price of BNB and the number of blocks BSC produces in a quarter.
This approach keeps the process transparent and predictable. The formula also adjusts the burn amount each quarter. Its long-term goal is to reduce the total supply to 100 million BNB.
The Auto-Burn is an independently auditable and objective process. Figures are reported quarterly to the public. In addition, the mechanism operates separately from the Binance centralized exchange. The philosophy behind BNB, known as “Build and Build,” reflects its role in ecosystem development.
Recent network upgrades changed the formula’s context. Following the Lorentz and Maxwell Upgrades, BSC produces blocks more frequently than before.
This pace differs from the period when the formula was first defined. As a result, the parameters were adjusted to keep the original idea consistent.
BNB also has a separate real-time burning mechanism through BEP-95. A portion of the gas fees in each BSC block is burned. Validator governance determines the burn ratio.
Consequently, this real-time BNB burn links ongoing burning directly to network activity. The two mechanisms therefore operate side by side.
The post BNB Chain Completes 37th BNB Burn, Removing 1.65M BNB From Supply appeared first on Blockonomi.
TLDR
- Cross River Bank announced on October 15 that it is adding Ripple’s RLUSD stablecoin to its Core Operating System.
- The integration includes support for the XRP Ledger, where transactions are designed to settle in about three to five seconds.
- Fintech customers could use stablecoin rails alongside ACH, wire transfers and other bank payment services.
- Compliance checks, currency conversion and off-ramps can still add time before money reaches the final recipient.
- Neither company called the deal a replacement for existing payment networks.
Cross River Bank is adding Ripple’s stablecoin to the system it uses to move money for fintech customers. The bank announced the move on October 15.
The stablecoin is called Ripple USD, or RLUSD. Cross River said it is integrating RLUSD into its own Core Operating System, with support for the XRP Ledger.
A stablecoin is a digital token built to hold a steady value. RLUSD is designed to track the US dollar.
How the RLUSD Integration Works
Cross River is a US bank that provides financial infrastructure to other businesses. Many of its customers are fintech companies that rely on the bank to handle payments.
The bank said the goal is to give fintech customers access to blockchain settlement alongside conventional payment rails. It is not meant to be a separate payment product.
Businesses that connect through Cross River could use stablecoin rails next to the systems they already know. These include ACH transfers, wire transfers and other bank payment services.
For Cross River, adding stablecoin support is part of a wider effort. The bank wants to give customers access to different payment methods through a single integration.
For Ripple, the deal gives RLUSD another way into regulated banking. It places the stablecoin inside the daily workflows of a US bank.
Speed and Cost on the XRP Ledger
The XRP Ledger is a public blockchain network. Transactions on it are designed to settle in about three to five seconds, and each one can cost a fraction of a cent.
These features are part of why Ripple is pitching RLUSD for certain uses. They include cross-border payments, merchant settlement and treasury transfers.
Many of these payments do not fit well into normal banking hours. A blockchain network can process transactions at any time of day.
However, blockchain speed is not the same as the total time it takes to deliver money. Several steps can add time before funds reach the person or business receiving them.
Compliance reviews are one of those steps. Currency conversion and moving funds back into a bank account, known as the off-ramp, can also slow things down.
Neither Cross River nor Ripple described the deal as a replacement for current payment networks. Neither company said existing systems would be phased out.
For now, the integration means a bank is adding another settlement tool for its customers. Fintech companies will decide for themselves whether to use it.
Actual use of RLUSD on the platform will depend on which fintechs find it useful enough to build into their operations. The bank announced the integration on October 15.
The post Cross River Bank Integrates Ripple’s RLUSD Stablecoin Into Payment System appeared first on Blockonomi.
TLDR
- Fidelity Digital Assets agreed to pay California $500,000 to settle claims over past crypto withdrawal limits.
- Fidelity must give written notice if it stops letting retail customers transfer crypto to outside wallets.
- Crypto IRAs are excluded from the transfer terms and are still not offered in California or Oregon.
- Fidelity denies wrongdoing, and the deal does not create a customer compensation fund.
- California customers have been able to move crypto off the platform since June 2025.
Fidelity Digital Assets has agreed to pay $500,000 to settle a California investigation into past limits on crypto withdrawals. The deal also adds a promise to warn customers before ending crypto transfers.
California Attorney General Rob Bonta announced the settlement on Oct. 16. It centers on claims about withdrawal restrictions at Fidelity Digital Asset Services.
The settling company, Fidelity Digital Assets, National Association, is the successor to that entity. Fidelity denies any wrongdoing and did not admit to breaking any law.
What the Settlement Requires
The $500,000 payment goes to the attorney general’s office. It covers fees and costs tied to the investigation and settles the potential claims released in the deal.
The agreement does not set up a fund to pay back customers.
The settlement describes a period from November 2022 through April 2025. During that time, California retail customers could buy and sell crypto on Fidelity but could not send it directly off the platform.
Fidelity received regulatory permission in April 2025. The transfer feature then reached all California customers by June 2025.
The agreement recognizes that customers can now move crypto to outside wallets, subject to applicable law. If Fidelity decides to stop offering this feature to retail customers, it must give California customers reasonable written notice.
Fidelity still keeps the right to restrict or block transfers. It can do this to protect its platform or individual account holders.
Crypto IRAs Follow Separate Rules
Tax-advantaged accounts are not covered by the transfer terms. This includes individual retirement accounts, also known as IRAs.
The deal also excludes accounts subject to federal rules on tax-free transfers between retirement accounts.
The agreement says Fidelity plans to launch Fidelity Crypto IRA accounts in California. It does not give a launch date.
Fidelity’s current IRA help page says the product is still not available in California or Oregon.
In states where the Crypto IRA is offered, customers cannot transfer crypto. They also cannot withdraw money or crypto directly from the account.
Instead, they can move money from the account’s U.S. dollar position to a linked Fidelity brokerage IRA. From there, they can use that account’s withdrawal options.
Fidelity’s state availability page, checked on Oct. 18, still lists crypto deposits and withdrawals for regular Fidelity Crypto accounts in California.
The post Fidelity Pays $500,000 to Settle California Crypto Withdrawal Probe appeared first on Blockonomi.
CryptoPotato
The past week has been quite turbulent for Bitcoin (BTC), Ethereum (ETH), and Ripple (XRP), as they all ultimately posted losses during that period.
Analyst Ali Martinez believes these digital assets have reached pivotal points, where their next major move will likely depend on key technical structures and crucial levels. Here’s what market participants need to monitor.
BTC and ETH
The primary cryptocurrency currently trades around $82,500 (per CoinGecko) after briefly tumbling below $80K last week. Martinez said the important level now is $81,000, which marks the lower boundary of the asset’s daily rising channel.
He maintained that if buyers defend it, BTC could rebound to the structure’s mid-range at $84,000 and then to the upper barrier at $86,500. At the same time, Martinez warned that a break below $81,000 could result in a deeper decline toward $76,000.
The analyst then shifted his attention toward ETH, arguing that it has a similar test at $2,350 (the support line of a right-angled ascending broadening pattern).
Martinez thinks that a bounce from that mark could push the asset’s price toward $2,700 or even the $3,000 psychological zone. On the other hand, he added that a daily close below $2,350 could open the door to a crash to about $2,000. As of this writing, ETH is worth roughly $2,440, which supports the bullish scenario.
XRP’s Potential
Ripple’s cross-border token has lagged the market’s leaders over the past week, down 7% and currently trading near $1.32. Martinez said he is now monitoring the $1.25 level, as holding above it could complete the right shoulder of a potential inverse head-and-shoulders pattern on the 3-day chart.
However, that’s not all XRP would need to do to post a decisive breakout. The analyst maintained that the resurgence should be combined with a sustained close above $1.56, which could set the stage toward a move to $2. From the bearish perspective, losing $1.25 might result in a drop to $1.
Shortly after, the analyst assumed XRP had bottomed out. He based his theory on the fact that transaction volume on the XRP Ledger exploded several hours ago as the token’s price hovered around the $1.25 support.
“The total dollar value of coins transferred on-chain skyrocketed to $49.70 billion, coinciding with the rebound that is now taking place. This surge in on-chain activity around such a critical support level suggests that $1.25 could mark the bottom,” Martinez explained.
In conclusion, the analyst doubled down on his thesis that as long as this support holds, XRP could be on track for a rally toward $2.
The post BTC, ETH, and XRP at Turning Points: Major Breakout or Deep Correction Coming Next? appeared first on CryptoPotato.
JPMorgan has expanded its JPM Coin deposit token to Ethereum to give institutional clients another way to move money onchain. The latest move takes it beyond Base, where the dollar-denominated token first launched in November 2025.
JPM Coin, also known as JPMD, represents deposits held at JPMorgan on a public blockchain.
JPM Coin Is Not a Stablecoin
The token allows institutional clients to make on-chain payments with greater speed and efficiency. It now supports peer-to-peer transfers across the Ethereum Virtual Machine ecosystem, including Ethereum and Base. The expansion is part of the bank’s wider effort to bring traditional financial instruments onto blockchain networks.
Commenting on the development, Emma Landriault, global head of Kinexys Labs at JPMorgan, said,
“We’ve clearly been in a year of further convergence between Wall Street and crypto. It’s not just Wall Street going to public chains, but the institutional web3 players getting more embedded and partnering with traditional financial institutions.”
The banking giant has been building its presence on Ethereum beyond JPMD. JPMorgan launched its first tokenized money-market fund on the network in December 2025, followed by a second in May 2026.
JPMorgan has also made an important distinction that JPM Coin is a deposit token, not a cryptocurrency or a stablecoin. While it uses blockchain technology, the funds remain within the bank’s regulated infrastructure. On its official website, the bank explained,
“Your funds never leave the firm’s regulated banking infrastructure. JPM Coin℠ is a new way to move and settle value using the same institutional safeguards your business already relies on.”
Expansion on Canton
The expansion of the token to the Canton Network, a privacy-focused blockchain built for financial markets, was announced in January this year. The proposed integration would let institutions issue, transfer, and redeem JPMD almost instantly within Canton.
The rollout is planned in phases throughout 2026.
The post JPMorgan’s JPM Coin Lands on Ethereum With Support for Transfers Across Two Networks appeared first on CryptoPotato.
Strive CEO Matt Cole took to X to highlight the latest purchase completed by the company he runs, which accumulated another 1,223 BTC at an average price of $81,734 per unit.
Consequently, Strive’s total holdings have hit 36,818 BTC, which, given the cryptocurrency’s price as of press time of just over $82,000, puts the USD value at more than $3 billion.
Last Wed-Fri, Strive acquired 1,223 BTC at an average cost of $81,734 per bitcoin, bringing holdings to ₿36,818.
– SATS IPO proceeds settle this Tuesday
– Strive plans to maintain current 18-month dividend reserve
– Traditional warrants are expired$ASST $SATA $SATS https://t.co/FwzPfCJ5Tq
— Matt Cole (@ColeMacro) October 19, 2026
The company has really accelerated its BTC accumulation efforts in recent weeks. In the past eight days alone, it has announced three major purchases.
This streak began with the second-largest single bitcoin buy in its history, in which it scooped 3,311 BTC. A day later, Cole outlined another one for 2,822 BTC, completed for $235 million.
Interestingly, Strive’s accumulation spree has far outperformed Strategy’s attempts by a substantial margin. Despite its more modest acquisitions as of late, the Saylor-led company remains the undisputed leader in the BTC accumulation game.
The post Strive’s Bitcoin Stash Hits Major Milestone as Buying Spree Continues appeared first on CryptoPotato.
The macro landscape and the building tension in different sectors, as well as growing inflation, have not deterred the world’s largest corporate holder of BTC from continuing to add more units to its stash.
Co-founder and former CEO Michael Saylor highlighted the latest purchase, noting the accumulation of 267 BTC. This puts the company’s total holdings at a new all-time high of 848,517 units.
Strategy has also repurchased $193 million worth of STRC, whose price neared its par level of $100 last week only to be rejected and close on Friday at under $98.
Strategy has repurchased $193M of $STRC and acquired 267 $BTC. As of 10/18/26, we hold 848,517 BTC and $5.3B of USD Assets. We have also increased the size of our Digital Credit Securities Repurchase Program from $2.0B to $3.0B. $MSTR https://t.co/ea29gd1OO5
— Michael Saylor (@saylor) October 19, 2026
Strategy recently experienced a major hit after MSCI finalized the new rules that targeted it, classifying it as “non-operating,” which includes crypto treasury firms. Although the final list of affected entities is due in three weeks, JPMorgan previously estimated that removing Strategy from it could lead to $2.8 billion in passive outflows from MSTR.
Nevertheless, Saylor shrugged off the bearish news, indicating that what MSCI is doing is “disappointing.” Meanwhile, CryptoQuant’s CEO, Ki Young Ju, argued that Wall Street has remained bullish on MSTR as the potential removal of MSCI has been priced in.
The post Strategy’s Bitcoin Holdings Hit New ATH After Another 267 BTC Buy appeared first on CryptoPotato.
[PRESS RELEASE – Zug, Switzerland, October 19th, 2026]
StakerX’s AI Agent Surpasses Passes $40M Staked Assets on Solana Within Three Months of Launch
StakerGPT trades crypto markets around the clock and publishes every trade it makes, as more than 8,200 users join the platform
 StakerX.ai, an agentic trading platform built by Switzerland-based StakerX Strategies AG, has passed $40 million in assets staked on Solana less than three months after its public launch on July 13, 2026. Users fund their stakes with more than 40 cryptocurrencies from most major blockchains, and StakerGPT, the platform’s agentic trading agent, puts that capital to work in crypto perpetual futures markets every day.
An AI agent that shows its work
An agentic system is AI software that carries out a multi-step task on its own. StakerGPT is built on rare-access Claude Mythos: it monitors crypto markets around the clock, reasons over potential trade setups, filters them through risk controls and routes the approved trades for execution, without a human placing each order.
Every trade is public. StakerX publishes the full record daily at stakerx.ai/trades, with the market, direction, entry and exit prices and return of each position, including both live-executed and signal-derived trades. As of October 18, 2026, the record holds 804 trades across 139 trading days since June 1, 2026, so anyone can check what the agent did on any given day instead of relying on summary figures.
 Fund it with almost any coin
Users can deposit USDC, USDT, BTC, ETH, SOL, BNB, TRX and more than 30 other cryptocurrencies from Solana, Ethereum, Bitcoin, BNB Chain, Base, Arbitrum, Polygon, Tron and other networks. Each deposit is converted and credited as USDC, a dollar-backed stablecoin, on Solana, so users do not need to bridge or swap anything themselves. Stakes start at $10 and run for 30 days.
Three months of growth
As of October 18, 2026, StakerX.ai reports:
- $40 million currently staked on the platform
- More than 8,200 registered users, of whom more than 3,000 have funded an account
- 804 trades published across 139 trading days
- More than 27,700 completed withdrawals, totalling $10+ million
- Nearly $12 million in yield credited to users since launch
Coming to the App Store and Google Play
StakerX is preparing native mobile apps for iOS and Android, expected in December 2026, which will bring the dashboard, deposits and the live StakerGPT trade record to the Apple App Store and Google Play. The platform is available today on the web at stakerx.ai.
About StakerX
StakerX is an agentic trading platform built and operated by StakerX Strategies AG, a quantitative trading and investment firm based in Switzerland. Its AI trading agent, StakerGPT, is built on rare-access Claude Mythos and evaluates crypto markets, applies risk filters and routes trades, and the platform publishes every trade in its record daily. Its goal is to make agentic trading accessible to anyone who holds crypto, from any chain, with every trade on the record. StakerX launched publicly on July 13, 2026. More information is available at stakerx.ai.
Media contact
Rimma S. – StakerX Strategies AG | Media Relations
support@stakerx.ai
The post StakerX’s AI Agent Surpasses Passes $40M Staked Assets on Solana Within Three Months of Launch appeared first on CryptoPotato.