Cryptocurrency Posts
Crypto Briefing
The emergence of efficient AI models could reshape memory chip pricing and market dynamics, challenging South Korean chipmakers' dominance.
The post South Korean stocks slide as DeepSeek model stokes memory chip demand fears appeared first on Crypto Briefing.
AI-driven errors in social media moderation can disrupt crucial civic engagement efforts, highlighting the need for transparent oversight.
The post Meta blames AI tool for mistakenly suspending No Kings Coalition Instagram account appeared first on Crypto Briefing.
The establishment of the Super Intelligence Force could reshape AI policy, balancing innovation with regulation and impacting global AI leadership.
The post Trump names Jay Clayton AI czar to lead new Super Intelligence Force appeared first on Crypto Briefing.
Anthropic's share allocation to address AI job disruption may enhance corporate social responsibility and influence investor confidence.
The post Anthropic commits 5% of shares to fund addressing AI job disruption appeared first on Crypto Briefing.
Broader retail access to AI investments could democratize profits, potentially easing public resistance and fostering wider acceptance of AI.
The post Robinhood CEO Vlad Tenev says AI backlash comes down to who owns the companies appeared first on Crypto Briefing.
Bitcoin Magazine
Bitcoin Magazine

Poetic Justice: Scammer Lost $5M in Bitcoin After Being Targeted by Ledger Thieves
Call it poetic justice: one of the biggest victims of last week’s Ledger theft happened to be a scammer themself, according to blockchain analysts, and lost nearly $5 million in bitcoin.
In a post Thursday, Chainalysis wrote that a crook lost 60 bitcoins worth about $4.8 million they’d stolen via a so-called task scam.
According to Chainalysis, the address was linked with a con where people were paid to fake sales and reviews of real items. They were told to add their own money in order to get paid — and then stolen from.
But the mastermind behind the task scam moved the stolen money to Ledger addresses which were then targeted by different scammers last week.
“On Sep 22, the person behind the scam moved the proceeds into three separate Ledger addresses,” Chainalysis said. “On Oct 9, thieves emptied all three. One transfer each, into the same wallet. The wallet is reported as stolen funds.”
Paris-based Ledger last week said it had started an investigation after customers in South East Asia reported they’d lost funds after buying from Malaysia-based reseller, CryptoBilis.
Ledger has since said that the scam was a massive organized crime operation where a group installed implants into devices and put them back on the market. The implants could read users’ seed phrases so criminals could then drain wallets.
Calling it one the most “sophisticated attacks” the digital asset industry has experienced, Ledger is yet to reveal how much money has been lost — but blockchain investigator Specter said $86 million had been drained.
And the task scam conman, according to Chainalysis, was one of the victims.
Ledger has said that it is working with law enforcement to “follow the funds and dismantle the attackers’ infrastructure” and has made sure no other vendors have been targeted by scammers.
CryptoBilis has stopped selling Ledger products, the company said.
Criminals have targeted bitcoin hardware sellers this year, with a huge attack taking place in July on the popular Coldcard products.
Crooks were able to steal close to $120 million in bitcoin from Coldcard users because the devices had a firmware bug which led to faulty seed generation, allowing hackers to guess investor seedphrases.
This post Poetic Justice: Scammer Lost $5M in Bitcoin After Being Targeted by Ledger Thieves first appeared on Bitcoin Magazine and is written by Mathew Di Salvo.
Bitcoin Magazine

BFFS26 Denver: Joseph Kelly on Bitcoin Custody and Credit; Alan Lane on Banking Lessons
The Bitcoin for Financial Services Summit (BFFS26) returns to Denver October 20–22, 2026, bringing together CPAs, wealth advisors, attorneys, lenders, and finance leaders who are building Bitcoin into their practices. Now in its second year, the summit has grown to more than 30 sessions across two full program days, with a speaker lineup drawn from the firms defining Bitcoin custody, credit, and advisory.
Headlining the program are Joseph Kelly, CEO and co-founder of Unchained, who opens the summit with a keynote on custody, credit, and trust at scale; Alan Lane, former CEO of Silvergate Bank, on lessons for Bitcoin and banking; Patrick Lowry, CEO of Samara Asset Group, on holding Bitcoin as a public-company treasury reserve; and Colin Crossman, Wyoming’s Deputy Secretary of State, on the regulatory outlook for banks, exchanges, and advisors. Additional speakers include Kate Goldman of Anchorage Digital, Sam Baker of River, Eric Yakes of Epoch Ventures, Daniel Hillery of UTXO Management, Moish Peltz of Falcon Rappaport & Berkman, and CJ Konstantinos of Peoples Reserve.
Sessions focus on practical application: bringing Bitcoin into wealth planning and family offices, Bitcoin-backed lending and mortgages, treasury accounting and valuation, retirement and income planning, charitable giving strategies, mining as an asset class, and fiduciary duty when clients hold Bitcoin. Dedicated workshops will offer continuing education credit for financial advisors and CPAs.
“Last year proved that financial professionals want more than a Bitcoin primer. They want to know how to serve clients who already own it,” said Jordan Guess, CPA, co-host of the summit in a press release shared with Bitcoin Magazine. “This year’s program is built around the questions advisors and accountants are actually getting from clients, answered by the people building the infrastructure.”
The summit opens Tuesday, October 20, with the Better Money Invitational golf tournament at City Park Golf Course, hosted with Bitcoin Sports Network, followed by a welcome party at The Space sponsored by Falcon Rappaport & Berkman. Evening programming includes wine and whiskey tastings, and Thursday begins with an optional sunrise hike in the Rocky Mountains.
BFFS26 is co-hosted by Jordan Guess and Wyatt O’Rourke of BFFS Media, producers of the Bitcoin for Financial Services podcast. Sponsors include Unchained, Anchorage Digital, UTXO Management, River, SOUND HSA, SustainHash, and Stormrake.
Registration is open now at https://www.bffs.media/summit.
Media contact: Wyatt O’Rourke, wyatt@bffs.media
This post BFFS26 Denver: Joseph Kelly on Bitcoin Custody and Credit; Alan Lane on Banking Lessons first appeared on Bitcoin Magazine and is written by Juan Galt.
Bitcoin Magazine
Sazmining Now Sells Jack Dorsey’s Proto Immersion Hashboards
Bitcoin mining just got a lower barrier to entry.
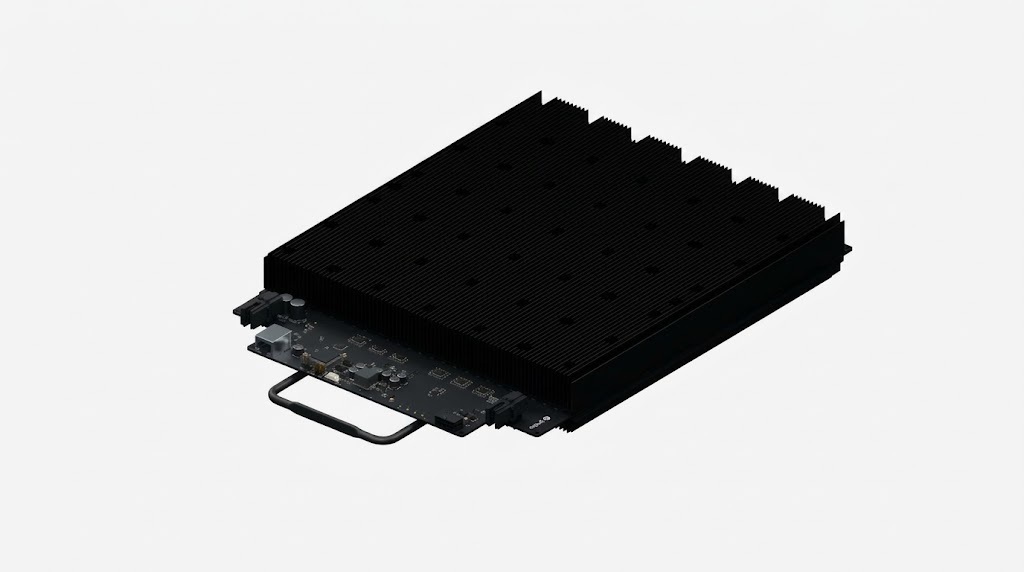
Sazmining announced Thursday that it is now selling Proto’s immersion hashboards directly to individual and institutional buyers through its mining-as-a-service platform. Previously, the hardware was mostly in the hands of large-scale operators.
Each hashboard delivers roughly 200 TH at around 15 J/TH, and buyers own them outright while Sazmining handles deployment, monitoring and maintenance at a US facility. Mining rewards go straight to the owner’s wallet.
The move follows a multi-megawatt supply deal between Sazmining and Proto — the bitcoin mining arm of Jack Dorsey’s Block (NYSE: XYZ) — which both companies expect to expand as demand grows.
“Because of our aligned-incentive model, Sazmining only earns when we produce bitcoin for our clients,” said Kent Halliburton, CEO and co-founder of Sazmining.
He also pitched mining as a form of bitcoin acquisition diversification: rather than paying the market price on the day of purchase, a miner’s costs are spread across the machine’s working life.
Wyoming-based Sazmining, founded in 2018, operates renewable-powered facilities across the US, Paraguay, and Norway. It says its fleet runs more than 20 percentage points ahead of the Bitcoin network’s carbon-free share.
Proto is Jack Dorsey’s Block’s bitcoin mining play. The Twitter founder has spent years arguing bitcoin is the foundation of “a more open financial system,” funding everything from Cash App’s buy-and-send rails to the Bitkey self-custody wallet, and he framed mining as the obvious missing piece back in 2021: “Bitcoin mining should be as easy as plugging a rig into a power source.”
Block formally announced it was building an open bitcoin mining system in January 2022, with the stated aim of making mining “more distributed and efficient.”
This post Sazmining Now Sells Jack Dorsey’s Proto Immersion Hashboards first appeared on Bitcoin Magazine and is written by Mathew Di Salvo.
Bitcoin Magazine
Hot Inflation Data Puts Bitcoin Under Pressure, but ‘Difficult’ Isn’t ‘Bearish’: CoinShares
Bitcoin’s price has dropped this week as new inflation data has come in hot.
But while the largest cryptocurrency’s near-term setup is difficult, it’s not “fundamentally bearish,” according to European asset manager CoinShares’ Head of Research, James Butterfill.
In a report Friday, the analyst said that bitcoin’s near-term challenge stems from a macro environment that’s caught in an awkward middle ground: inflation is too elevated for the Fed to ease up, while the economy is too resilient to force a policy pivot.
“Bitcoin and the broader digital asset market have moved lower on the resulting hawkish repricing, a reminder of how sensitive Bitcoin remains to monetary policy over short horizons,” he wrote.
Bitcoin’s price recently stood at $81,473, down 2% over a seven-day period.
The price of the leading cryptocurrency dropped Wednesday after data showed that U.S. consumer prices shot up more than expected in September.
Then, on Thursday, the Labor Department’s Bureau of Labor Statistics said that U.S. producer prices rose in September at the fastest pace in more than four years.
This has weighed on bitcoin’s price because higher inflation means the Federal Reserve may hike interest rates. Higher borrowing costs can restrict the liquidity the digital coin needs to rally.
The Federal Reserve hiked rates in September and will meet at the end of this month.
But Butterfill added that investors should be patient and advised investors to instead think in the long-term and not react to any single weekly data point.
“For investors, that argues for reading the coming weeks as a data-driven range rather than a trend, and for sizing digital asset exposure against a strategic allocation rather than against this week’s print,” he wrote.
Bitcoin spent the first half of 2026 in a bear market but had its best quarter in years after surging in August and September. Analysts have now said the leading cryptocurrency is now back in a bull market after trading above its 365-day moving average.
This post Hot Inflation Data Puts Bitcoin Under Pressure, but ‘Difficult’ Isn’t ‘Bearish’: CoinShares first appeared on Bitcoin Magazine and is written by Mathew Di Salvo.
Bitcoin Magazine

Deutsche Bank To Debut Bitcoin Custody Within Weeks: Report
German multinational Deutsche Bank is just weeks away from its crypto custody service, according to reports.
The lender — which is Germany’s biggest — also plans to expand the custody platform into Asia next year, according to a Friday Reuters report, which quoted its corporate banking chief.
Top banks worldwide are debuting or planning to debut crypto custody services, with BNY Mellon, State Street, Standard Chartered, U.S. Bank, and Citigroup all committing to direct crypto custody over the past 18 months.
JUST IN:
— Bitcoin Magazine (@BitcoinMagazine) October 16, 2026€732 billion Deutsche Bank to launch Bitcoin custody to its 28 million clients
pic.twitter.com/TAh9EwLkIX
Deutsche Bank first officially announced plans to debut a bitcoin custody service for European corporate and institutional clients in September, with the German multinational at the time saying service was subject to the completion of the applicable regulatory timeline.
Friday’s report added that the service will support custody of major cryptocurrencies such as bitcoin before moving to services that help clients move money into and out of stablecoins.
Gerald Podobnik, co-head of the corporate bank, was quoted by Reuters saying that the financial system will need to “offer tokenized or blockchain solutions.”
A number of top banks have started using the technology that powers bitcoin, the blockchain, for their own products in recent years.
Stablecoins and tokenization in particular have become a hot topic as traditional financial firms aim to accelerate certain services.
Crypto custody is often a starting point for banks moving into the digital asset space. BNY Mellon in 2022 became the first major U.S. bank to offer digital asset custody services.
Banks like Citi and Standard Chartered have this year debuted or announced plans for bitcoin custody around the world.
This post Deutsche Bank To Debut Bitcoin Custody Within Weeks: Report first appeared on Bitcoin Magazine and is written by Mathew Di Salvo.
CryptoSlate
NU7 would leave legacy funds issued but unspendable, even with intact keys, while the mainnet activation decision remains pending.
Read the full story on CryptoSlate
Understand the crypto stories that matter and what to watch next. Get The Catalyst in your inbox
The California agreement requires notice if Fidelity ends its retail transfer feature, while preserving security restrictions and IRA exclusions.
Read the full story on CryptoSlate
Understand the crypto stories that matter and what to watch next. Get The Catalyst in your inbox
The crypto industry has finally found a way to participate in America's partisan warfare without committing to either of the (only) two available parties: help elect people who agree with it about crypto, then let them argue about everything else. Fairshake's latest House spending plans cover 32 candidates, with 19 Republicans and 13 Democrats on…
Read the full story on CryptoSlate
Understand the crypto stories that matter and what to watch next. Get The Catalyst in your inbox
Two tracked Ethereum V3 Umbrella stakes fell 9.7%, while their implied annualized reward run rate stayed near $2 million.
Read the full story on CryptoSlate
Understand the crypto stories that matter and what to watch next. Get The Catalyst in your inbox
On October 17, JUST, the leading DeFi infrastructure in the TRON ecosystem, announced the completion of its fifth buyback and burn of its native token JST as scheduled. Over 170M JST were burned in this round (approx. 1.72% of total supply), backed by nearly $23.53M in capital deployed—all funded directly by JustLend DAO's net operating…
Read the full story on CryptoSlate
Understand the crypto stories that matter and what to watch next. Get The Catalyst in your inbox
CryptoTicker.io
An audit badge on the website of an exchange or a protocol reads like a guarantee. The security firm Hacken has now set out how little it covers when it matters: in the third quarter of 2026, attacks on the crypto market cost $1.18 billion across 107 incidents, and $906.8 million of that fell on components that were never on the table at the last security audit. That is 77 percent of the quarter's losses. Co-founder Andrii Matiukhin summed it up to CoinDesk: “The problem is always scope”.
For investors, that does not mean audits are worthless. It means a badge answers a different question from the one you are asking. You want to know whether your balance is safe. What was usually examined is whether one particular smart contract was clean at one particular moment. This article shows where the gap sits in figures, which cases tore it open over the summer, and how to tell a meaningful audit report from a decorative one.
$1.18 billion across 107 incidents: what Hacken counts for the third quarter
The figure appears in the quarterly report of the audit firm Hacken, which CoinDesk reported on October 18, 2026. $1.18 billion in damage spread across 107 separate incidents, 55 percent more than in the second quarter. The rise does not come from a larger number of small attacks but from a few very large ones.
An audit here means a security review of program code by an outside firm. Auditors read the source, look for errors in the logic, test edge cases and write a report listing findings by severity. What ends up in that report depends entirely on what the client had examined. That is exactly where the criticism bites.
77 percent of the losses sat outside the last audit
Hacken assigns the $906.8 million to three causes: compromised suppliers and developer tools, security fixes already disclosed that nobody had installed, and components that simply were not in scope at the last security pass.
None of these three routes runs through the audited contract. An attacker who takes over a developer's account at a tooling provider does not have to break the smart contract. They gain access by the route the audit never looked at. Matiukhin also gave CoinDesk the reason why scopes stay small: “It’s expensive to have enormous scopes of all components that interact with funds”. And the company under review pays for the audit itself.
Supply chain and developer tools: the attack route behind $906.8 million
The single largest case of the quarter shows the pattern. According to the Hacken report, users of the exchange Bitget lost at least $352 million after attackers exploited a weakness in a third-party security product and gained access to the withdrawal infrastructure through it. The product attacked was, of all things, a security component.
At Liquid Network the report puts the damage at $319 million, at Tectonic at a minimum of $75 million. Around $114 million fell on Coldcard's wallet software. In July, three bridges and cross-blockchain protocols together lost more than $35 million in a six-hour attack; $24 million of that fell on AFX Trade, after attackers gained control of its validator keys.
In the same week the report appeared, a further case became public: around $93 million in damage from an unauthorised hardware implant connected to Ledger and CryptoBilis. CoinDesk keeps that case separate from the quarterly total, because it only came to light after the cut-off date.

What a smart contract audit covers and what stays outside
A typical audit looks at the smart contract, meaning the program on the blockchain that governs deposits, swaps or withdrawals. What is examined is one particular state of the source code, pinned down by a commit ID.
Regularly not included are the browser interface, the servers behind it, the custody solution with its keys, signing procedures, price oracles, bridges to other blockchains, and any bought-in third-party software. Hacken expressly recommends in the report that scopes be widened to oracles, bridges, custody systems and signing permissions. That the recommendation is needed already says what the normal case looks like.
Then there is the time factor. An audit describes a state on one day. Every later code change lies outside it. A badge without a date is therefore hard to assess at all.
Four keys, three signatures: Hacken reviewed twelve derivatives venues
For the report, Hacken looked at twelve derivatives exchanges and prediction markets. The finding concerns the structure of custody: at two large venues, on the report's figures, more than $700 million in secured value hung either on a setup with four keys of which three must sign, or on administrative keys whose holders are not publicly known.
Matiukhin was explicit on one point: “We are not aware of a live bug in the systems of any reviewed venue”. The finding concerns the concentration of control, not a specific flaw. Leave your balance on an exchange and you are relying on a small, partly unknown group of key holders acting correctly and not being attacked themselves.
Severity downgrade: when a critical flaw is classed as low
An audit report is a recommendation, not an instruction. Matiukhin describes to CoinDesk what happens in practice: “Sometimes a critical vulnerability is classified as low by the team, and fix implementation is delayed or even declined”.
The move is known in the trade as a severity downgrade. It explains why fixes that had already been disclosed and were available count among the three main causes in Hacken's breakdown. The gap was known, the auditor had named it, and it was not installed.
What separates a meaningful audit report from a decorative one
An audit report worth something names four things. First, a date and a version ID for the code examined. Second, a written-out scope listing which components were included and which were not. Third, the findings by severity, including the points the client did not fix. Fourth, a follow-up review confirming that the critical points were actually closed.
Take one of those away and a logo is what remains. “Audited by” and “secure” are not the same thing, and in Hacken's accounting close to a billion dollars lies between them. Look as well at whether the report's date still matches the current version: a report from two years ago describes software that no longer exists in that form.
Custody in Germany: an exchange balance against your own keys
The practical consequence of the report concerns where your coins sit. A balance on an exchange is a claim against that company; the venue holds the keys. If its infrastructure fails or comes under attack, getting your coins back depends on the provider's solvency and crisis management. That infrastructure is exactly what sat outside the audit scope in the quarter's cases.
The counterpart is self-custody. With a hardware wallet, meaning a device that stores your private keys offline and signs transactions itself, the key never leaves the device. Which models suit which holdings, and how they differ in handling and recovery, is set out in our hardware wallet comparison. The Ledger case from the same week shows that this route demands care too: a device should be bought only direct from the manufacturer or from a dealer it has named, never second hand and never through a marketplace reseller.
For amounts you move regularly, an exchange stays practical. The question then shifts to the choice of venue. A licence under the EU's MiCA regulation means supervision of capital, segregation of client assets and complaint channels; which providers hold one in Germany is shown in the overview of regulated crypto exchanges. A licence is no substitute for a security audit, but it gives you an address if something goes wrong.

Three checks that cost little time before your next purchase
The effort stays small. Look for the audit report on your provider's site and see whether it carries a date and a scope. Compare that date with the platform's last major update. And see whether the provider discloses how custody is organised, how many keys exist and who holds them.
Find nothing on one of those three points and that is information in itself. It does not mean the provider works insecurely. It means you cannot verify it, and you should size the balance you leave there accordingly. For Bitcoin and other holdings you keep for months, there is little case for leaving them on a trading venue.
What sets the direction in the fourth quarter
Whether the figure falls in the fourth quarter hangs on two developments. The first is scope: as long as audits cover the contract and leave custody outside, the route that carried 77 percent of the losses stays open. The second is how known gaps are handled. Part of the damage arose at points for which a fix already existed.
Both can be watched from outside. If a provider publishes a widened scope, that is a solid signal. If it stays with the old report and the old date, nothing about the situation has changed, whatever the badge looks like.
Crypto audits: a badge without a date or a scope tells you nothing
Three steps for applying the lesson of the Hacken report to your own portfolio:
- Split the holdings. Decide what amount you need on an exchange for day-to-day trading and move the rest into self-custody. The devices and their differences are in the hardware wallet comparison.
- Review the venue. For the part that stays put, look up your provider's licence and audit date. The overview of regulated crypto exchanges shows who is under MiCA supervision in Germany.
- Secure the supply route. Buy a custody device only from the manufacturer or a named dealer, and set it up yourself. For weighing a device against an app, the software wallet comparison helps.
(As of October 18, 2026. This article is not investment advice. Prices and fee structures change; check the terms with the provider before you buy.)
Impermanent loss is the gap between two portfolios: the one that would simply have held your coins, and the one that put them into a liquidity pool. If the price of one half of the pool doubles while the other stands still, that gap comes to 5.72 percent. €150 from holding turns into €141.42 in the pool. The effect is no more than that, and it hangs on a single quantity: the ratio of the two prices to each other.
Providing liquidity earns you a share of the pool's trading fees. Whether it pays off turns on one question: whether those fees close the gap. This piece works both sides against each other, with figures you can check yourself.
What impermanent loss in a liquidity pool really is
Liquidity pool: a pot of two tokens that anyone can swap against without needing a counterparty. Instead of an order book with buyers and sellers, a formula sets the price. Anyone who deposits tokens becomes a liquidity provider and no longer holds two coins, but a share of the pot.
Impermanent loss: the difference between the value of that share and the value of the coins had you not deposited them. The gap arises from price moves alone, not from fees, not from a hack and not from a flaw in the protocol.
The name misleads, because nothing is lost at first. As long as the price ratio of the two tokens returns to where it stood at entry, the gap disappears entirely. That is why it is called impermanent. Withdraw while the ratio is displaced, though, and you make it permanent.
Only the ratio matters here, not the direction and not the absolute size. If one half of the pool rises 50 percent while the other stands still, the cost is the same as in the reverse case. If both rise 50 percent, it costs nothing at all, because the ratio has not changed.
How an automated market maker tracks the ratio inside the pool
Automated market maker (AMM): the program that derives the price in the pool from the two balances. In the classic case, as used by Uniswap v2 and most of its imitators, the rule is that the product of the two balances stays constant. Put token A in, take token B out, and the price shifts until the product holds again.
When the outside price of a pool token rises, it is briefly too cheap inside the pool. Traders then step in, buy it out of the pool and sell it dearer elsewhere. This tracking from outside is not a side effect but the mechanism itself: the pool only follows the market because somebody exploits the gap. Whatever value walks out of the pool in the process is carried by the liquidity provider.
In practice that means the pool always sells you whatever is rising and buys whatever is falling. At the end of a strong price rise you hold less of the token that rose and more of the other one. That reshuffling is exactly what costs the gap against simply holding. Anyone who places a market order on a centralised exchange knows the related effect from a different angle: the price gap between the order expected and the order filled.
Pools run on decentralised trading venues, which work without an intermediary. How these differ from a classic exchange is set out in our explainer on decentralised crypto exchanges. The best known pairs contain ether; where the price currently stands is shown on the Ethereum price prediction page.
The formula behind impermanent loss in one sentence
Call the price ratio at the end divided by the price ratio at the start k. The value of your pool share then equals the holding value multiplied by twice the square root of k, divided by the sum of one and k. The gap against holding is that factor minus one.
The same result appears in a paper on the quality of centralised and decentralised trading venues, written there as the difference between two returns: half the sum of the price ratio and one, minus the square root of the price ratio. The authors note that this expression turns to zero at a single point only, namely at an unchanged ratio, and is otherwise always positive. It can be read in the study on centralised and decentralised trading venues.
What counts in it for you: there is no parameter for duration, pool size or trading volume. Two weeks and two years in the pool cost exactly the same at the same closing ratio. The gap is a function of the price, nothing else.

Our own calculation: how the price ratio drives the loss
The values below are calculated from the formula, for a pair with equal halves at entry. The second column gives the price change of one half while the other stays unchanged. The third column shows what percentage of the holding value is missing at the end.
| Price ratio | Price change of one half | Gap against holding |
|---|---|---|
| 1.00 | unchanged | 0.00 percent |
| 1.10 | up 10 percent | 0.11 percent |
| 1.25 | up 25 percent | 0.62 percent |
| 1.50 | up 50 percent | 2.02 percent |
| 2.00 | up 100 percent | 5.72 percent |
| 3.00 | up 200 percent | 13.40 percent |
| 4.00 | up 300 percent | 20.00 percent |
| 5.00 | up 400 percent | 25.46 percent |
| 10.00 | up 900 percent | 42.50 percent |
The lower end stands out. Up to a price gain of 25 percent the gap stays below one percent, and at a price move of ten percent it sits at a thousandth of the stake. In that zone impermanent loss is barely an issue, and any halfway active fee rate covers it several times over.
Above that the curve turns steep. Between up 100 and up 400 percent the gap quadruples, from 5.72 to 25.46 percent. Put a young token with large price potential into a pool, and you pay for that token's success with a noticeable slice of the gain.
€100 in an ETH pair: €8.58 behind simply holding
A worked example makes the percentage tangible. You put €100 into a pair of ether and a dollar stablecoin, so €50 in each half. The ether price then doubles while the stablecoin stays at one dollar.
Had you only held, the €50 of ether would have become €100, which together with the unchanged €50 makes €150.00. In the pool, €141.42 stands at the end. The gap is €8.58, or precisely those 5.72 percent. Those €8.58 have not vanished; they sit in the pockets of the traders who kept levelling the pool out along the way.
The counter-calculation belongs with it: over the same period the pool collected trading fees, and your share of them is yours. In a pool throwing off a 25 percent fee yield on an annual basis, €8.58 would be earned after roughly 83 days. Whether your pool carries that rate shows only in its actual trading volume, not in a marketing figure.
Why the weighting at entry shifts the calculation
The values in the table hold for a pair with two equally large halves. Pools with a different weighting, 80 to 20 for instance, spread the effect differently: the smaller half is reshuffled more heavily, the larger one barely at all. A pool made up 80 percent of one token behaves closer to simply holding that token, and brings in fewer fees for it.
Trading fees and fee yield set against the loss
Fee yield: the share of trading fees attributable to the capital you deposited, extrapolated to a year. It comes out of the pool's trading volume, the fee tier and the share you hold of the pool. It is not a promise but a look back: if volume falls, it falls with it.
From the formula and an assumed fee yield you can read off how long a pool has to run for the fees to cover the gap. The values below are derived from the same calculation, with capital active throughout:
- Price up 50 percent, gap 2.02 percent: at a 10 percent fee yield, around 74 days; at 25 percent, around 29 days.
- Price doubled, gap 5.72 percent: at 10 percent, around 209 days; at 25 percent, around 83 days; at 50 percent, around 42 days.
- Price tripled, gap 13.40 percent: at a 25 percent fee yield, around 196 days.
- Price up tenfold, gap 42.50 percent: even a 50 percent fee yield needs more than 300 days.
- Price unchanged: no gap, and every bit of fee yield stays as profit.
This calculation is deliberately generous, because it assumes a fee yield that holds steady across the whole period, and that is the least likely part of it. High rates mostly arise in a pool's first weeks, when volume is large and the liquidity deposited is still small. After that they fall, often sharply.
Then there are costs that appear in no rate at all: the network fee on depositing, on harvesting the rewards and on the way out. On small amounts they eat a double-digit percentage of the yield. If you would rather look for a platform with stated terms, the comparison of staking and yield platforms lists the usual providers with their conditions.
Doubling and halving cost exactly the same share
This point surprises most people and sits directly in the formula: a price ratio of 2 and a price ratio of 0.5 produce the same gap. Worked through for several values:
- Up 25 percent and down 20 percent: both 0.62 percent.
- Up 50 percent and down 33 percent: both 2.02 percent.
- Up 100 percent and down 50 percent: both 5.72 percent.
- Up 300 percent and down 75 percent: both 20.00 percent.
Something uncomfortable follows for practice: a pool does not protect you against falling prices. On the way down, the gap against holding is added to the price loss. If you deposit into a pair because you expect a quiet sideways phase, you have read the formula correctly. If you deposit because you want to cushion a slump, you have read it wrongly.

Concentrated liquidity on Uniswap v3 sharpens the effect
Concentrated liquidity: liquidity that works only within a price range you choose yourself, instead of being spread across the whole curve. Uniswap's developer documentation describes the core as liquidity allocated within a custom price range, and cites as an example an older dollar pool that used only around half a percent of its capital for trading between $0.99 and $1.01. Draw the range tightly and you get far more depth at that point out of the same capital, earning correspondingly more in fees.
The price for that stands in the same documentation: once the price leaves the range, the liquidity is no longer active and earns no more fees. The position then consists entirely of one of the two tokens. If the price returns into the range, it becomes active again. The details are in the documentation on concentrated liquidity; where the protocol token currently stands is shown on the Uniswap price prediction page.
For the calculation that means the narrow range leverages both sides. Inside the range the fee yield is a multiple, but so is the gap against holding. A position with half the range width behaves, at the same price move, like a far larger stake in a classic pool. And as soon as the price breaks out, it earns nothing more while the gap remains.
Stablecoin pairs and correlated pairs lower the risk
The table shows directly which pairs are quiet. Two dollar stablecoins such as USDC and USDT normally move by fractions of a percent against each other; the price ratio stays close to one, and so the gap stays close to zero. The same holds for a pair of ether and an ether sitting in a staking protocol, or for a pair of BTC and a wrapped version of the same coin.
The catch: these very pairs carry the lowest fees, because there is little room between them. Quiet and lucrative do not come in the same pool. On top of that, stablecoin pairs keep a risk of their own that the formula does not capture: if one of the two tokens loses its peg to the dollar, the ratio shifts suddenly and sharply, and the effect then bites with full force.
Rewards from liquidity programmes can turn the equation around, though with deadlines of their own. That such entitlements can lapse is shown by the case of a programme in which every claim below a minimum amount expired on a fixed date.
Why the loss is called impermanent and when it turns permanent
As long as your share sits in the pool, the gap is an arithmetical figure. If the price ratio returns to its entry value, it dissolves completely, however far it had run up in the meantime. A pair that goes from one to four and back to one costs nothing at the end.
It turns permanent the moment you close the position. You then receive the two tokens paid out in the displaced ratio, and what is missing is missing. The same happens with a position on a narrow range if you close it outside that range.
A plain consequence for the moment of exit follows: close immediately after a strong move and you realise the largest gap. Wait until the ratio has calmed and you pay less, but you carry the price risk of both tokens, and the risk of the protocol itself, for longer.
Tax in Germany: the deposit, the rewards and the exit
The tax treatment does not follow the economic logic of the pool but German income tax law, and it breaks into three separate events: the deposit, the running inflow and the exit. Each is assessed on its own, and none of them knows the term impermanent loss.
The order is particularly awkward: a gap against holding is not a loss for tax purposes as long as no event realises it, while rewards from the pool are valued at the moment they arrive. A taxable inflow can therefore arise while the position as a whole sits at a loss. Which event is classified how in Germany, and what records the tax office wants to see, we set out in our piece on liquidity pools and tax of July 10, 2026.
In practice the documentation matters most of all. A pool position produces many small events that no exchange itemises for you: the deposit, the reshuffling by the pool, rewards in small tranches, network fees, the exit. Without a complete record, neither a gain nor a loss can be evidenced at the end of the year.
What an impermanent loss calculator does and where it goes wrong
Calculators on the web take two prices and output the gap as a percentage. That part they handle reliably, because it is exactly the formula above. For a quick sense of scale it is enough.
Three things these tools typically do not deliver. First, the actual fee yield of your pool over the period you held it, because that hangs on volume and on your share. Second, the network fees for entry, harvest and exit. Third, the time a position on a narrow range spent outside that range and therefore earned nothing. A result of “minus 5.72 percent” says nothing, then, about whether your trade won or lost.
The interface terms you will meet in the apps
Protocol interfaces are almost entirely in English, and the terms there do not map onto everyday language. These six come up most often. An impermanent loss calculator works out the gap from two prices. Fee APR is the fee yield on an annual basis; APY is the same number with reinvestment assumed, and therefore always the larger of the two. The fee tier is the pool's fee level, meaning the rate every swap there costs. The range is the price range of a position with concentrated liquidity. The LP token is the receipt for your share of the pool, which you hand back on the way out. And the price ratio is precisely that ratio of prices which appears in the formula above as k.
Know that mapping and you can read a pool's interface in half a minute: the fee tier and fee APR say what comes in, the range says how long the capital stays active, and the price ratio says what it costs.
The calculation only becomes solid once you assemble the four quantities: the gap from the formula, the fees collected, the network costs and the time with capital active. Only then is it settled whether the pool brought in more than simply holding.
Our assessment of liquidity provision for private investors
In this newsroom's view, providing liquidity is arithmetically attractive for private investors in exactly one case: pairs whose price ratio stays stable. The evidence is in the table above. Below a price move of 25 percent the gap stays under one percent, and there a double-digit fee yield covers the effect within a few weeks. At a price ratio of four, by contrast, 20 percent is missing, and hardly any pool brings that back.
Against it stands the fact that the most lucrative part of the market is precisely the volatile one. High fee rates arise with young, sharply swinging tokens, meaning exactly where the price ratio runs furthest. Seek out those rates and you buy the gap along with them. Add to that the risk of a flaw in the protocol, and the fact that decentralised trading venues hold no BaFin licence and offer no investor protection: if something goes wrong there is no counterparty and no compensation. A total loss of the amount deposited is possible.
Impermanent loss: it only costs more than 5 percent once the price doubles
- Before depositing, work through the formula to see what gap you are accepting at a doubling and at a halving. The table above gives the yardstick: 2.02 percent at up 50, 5.72 percent at up 100, 20.00 percent at up 300 percent. If the expected fee yield sits below that, the trade cannot be won on the arithmetic. If you are looking instead for a yield without a price ratio, the providers are listed in the comparison of lending providers.
- Record four values for every position: the entry prices of both tokens, the date, the fees collected and all network costs. Those four values later carry the tax return and the answer to whether the trade was worth it. The tools for that are in the comparison of tax software.
- Before entering, compare a plain purchase on a licensed exchange with the pool. If you want to hold the coin anyway, buying without a pool is the route with no gap and no protocol risk; an overview of licensed trading venues is in the exchange comparison.
(As of October 18, 2026. This article is not investment advice. Prices and fee structures change; check the terms with the provider before you buy.)
On the night of October 18, 2026, the Qubic network shut down its own operations. An attacker had drained 1,404 wallets before that, roughly 2.94 trillion QU worth about $1.3 million. According to the project, the cause lies outside the Qubic protocol: some wallets generated their recovery phrase in a way that made it predictable. If you hold QU and ever created your wallet in a browser on an iPhone or iPad, or in Safari on a Mac, you have to assume your seed is on the published list.
The case does not end with Qubic. A seed that a random number generator produces inside a browser depends on the quality of that generator. That applies to every wallet created in a browser, whatever the coin.
What happened in the Qubic network on the night of October 18
The window is narrow and well documented. After the project's disclosure, reported in the same terms by Crypto Briefing and Bitcoin.com News, the outflows began on October 17 at 23:42 UTC and ended on October 18 at 01:26 UTC. That is one hour and 44 minutes, in which 1,404 accounts were emptied.
Both reports put the amount at roughly 2.94 trillion QU. QU is a token with a very large number of units and a correspondingly low unit price, which is why the count sounds larger than the value behind it: about $1.3 million at the time of the theft.
The validators then intervened. They halted the blockchain at tick 85,371,949. A tick is Qubic's unit of count for one processing step of the network, comparable to a block on Bitcoin. A halted network processes nothing at all, further outflows included.
The flaw sat in seed generation, not in the Qubic protocol
A seed is the character string from which a wallet derives all of its private keys. On Qubic it is a sequence of 55 lower-case letters. Whoever knows it has full access to the balance, with no password and no device.
The developers state that the blockchain's own program code was not attacked. The vulnerable point lay one step earlier: the generation of those 55 characters. If software does not draw the characters at genuine random but follows a pattern that can be reproduced, an attacker can work through the sequence. That is what happened, according to the Qubic announcement that the on-chain service Lookonchain passed on during the night.
What “insufficient randomness” means in practice
A seed of 55 characters has so many possible combinations on paper that no computer on earth could work through them. That protection rests entirely on each of the 55 positions being truly unpredictable. If the number of actually possible starting values shrinks to a few million, the 55 characters are no more than a facade. The attacker does not calculate one seed, he calculates every seed the software could ever have produced, then checks which of them hold a balance.
Seeds from iPhone browsers, Mac Safari and the early iOS app are affected
Qubic has named the affected routes. On that list, the following count as vulnerable:
- seeds created before October 18, 2026 in any browser on an iPhone or iPad,
- seeds created before the same date in Safari on a Mac,
- seeds created before July 2025 through the Qubic app for iOS.
The line therefore runs along the Apple platform. That is no coincidence: on the iPhone and iPad every browser has to use Safari's rendering engine, even when the label on the front says Chrome or Firefox. A flaw in that single engine hits every browser on the device at once.
If you set up your Qubic wallet on Windows, Android or Linux instead, or used the desktop application, this list does not put you on the risk side. That is not a guarantee: the list comes from the project itself and may grow as the post-mortem continues.
Entropy: why a random number generator in a browser can be weaker
Entropy is the measure of how much genuine unpredictability sits inside a number. An operating system collects that unpredictability from many sources, among them the intervals between keystrokes, sensor noise, or a dedicated unit inside the processor.
A web page inside a browser reaches those sources only indirectly. It asks an interface for random numbers and gets whatever the browser hands over. If that interface is poorly supplied with entropy, shortly after the device starts for instance, the result is weaker than the length of the string suggests. The user sees none of it. Their seed looks just as jumbled as any other.
That gives a rule of thumb which reaches beyond this case: the fewer layers between the source of randomness and your seed, the better. A device that does nothing but hold keys has the shortest path here. Which devices are available in Germany and what they cost is set out in the hardware wallet comparison.

87.1 percent of the haul is stuck in the network, 12.9 percent reached MEXC
This is where the case turns unusual. The attacker never got most of the stolen amount out of the Qubic network at all. On the matching figures in both reports, 87.1 percent of the QU remains on the blockchain, where it can neither be moved nor sold while the network is halted.
The remaining 12.9 percent reached the exchange MEXC. The inflow was noticed there: the venue says it froze the receiving account within an hour because it suspected a connection to the attack. At that speed this is not a given, and it stopped that share from draining into the market as well.
The network halt at tick 85,371,949 and what it means for holders
A halted network protects the haul from being sold on, but it also pins down everyone else. If you hold QU and are not affected at all, you cannot reach your balance either until the restart. That is the price of the measure, and the project paid it deliberately.
QEARN, the network's staking function, is not affected according to the developers. Nothing has been decided yet about compensating the victims. Responsibility lies with the Computor cluster, the operators who carry the network and vote on its direction. So far there is no commitment, only the statement that the decision will be taken there.
Bitget pauses QUBIC deposits and withdrawals, client 4.26.4 closes the flaw
While the network stands still, two trading venues have acted. MEXC froze the account where the haul landed. The exchange Bitget suspended deposits and withdrawals for QUBIC for as long as the situation remains unresolved. Both steps prevent stolen tokens from being passed on through regulated trading.
On the software side, the Crypto Briefing report names client version 4.26.4 as the release that fixes the weakness in seed generation. The developers also say they moved further endangered balances to safety ahead of the attacker. A new program version, however, only repairs the generation of future seeds. A seed that was already created weakly stays weak, whatever version runs on top of it.
QU trades at $0.0000004268 with a market value of $61 million
For a sense of scale: QU was quoted at $0.0000004268 on Sunday evening, with a market value of around $61.4 million and rank 385 in the overall market. Against the previous day that is a loss of 13.6 percent. cryptoticker.io collected these figures itself on October 18, 2026.
The stolen amount therefore corresponds to roughly two percent of the entire market value. For a project of this size that is noticeable; for the crypto market as a whole it is a small number. If you want to follow the price from here, you will find it in the Qubic price prediction.
The case concerns more than Qubic holders
Three things make this incident interesting beyond the project. First, it hit the software in front of the blockchain while the blockchain itself remained untouched. Second, the weakness persisted unnoticed for years, without any user being able to spot it. Third, it struck the route that feels most convenient of all: the wallet in the browser, set up in seconds, with nothing to install.
A similar lesson sat behind the case in which an OpenAI agent used known seed phrases to reach 362 wallets. There, too, no blockchain was broken, only an assumption about where the keys came from. The debate about quantum risk for Bitcoin addresses turns on the same question at its core: how good is the procedure that produced your key?

Hardware wallet, software wallet, exchange: where the seed is created in Germany
In practice what counts is who generates the key for you. There are three routes, and they differ at exactly that point.
The hardware wallet creates the seed inside the device
A device of that kind draws its randomness from a dedicated unit and never passes the seed on to a computer. The browser does not appear in the process at all. In exchange you pay a three-figure sum and carry responsibility for the backup yourself.
The software wallet depends on the device's source of randomness
This is where the Qubic case sits. An application on a phone or a computer can use a good generator or a weak one, and from the outside that cannot be seen. What matters is whether the software takes the operating system's generator and whether its code is open. Both can be read up before setup, and neither can be changed afterwards.
With an exchange there is no seed for you at all
If you buy through an exchange and leave the coins there, the provider holds the keys. A weak seed on your side then cannot arise in the first place. In exchange everything hangs on the provider, and with a provider that holds no licence it hangs on nothing. That such providers exist was shown by BaFin with several warnings this October.
Moving coins between your own wallets is not a sale
If you transfer your coins to a new wallet because of a questionable seed, you are not selling them. A transfer between two addresses that both belong to you is not a disposal, and it does not restart the one-year holding period under German tax law.
The only thing that matters is that you carry the acquisition data over. Your tax software or portfolio tracker has to recognise both addresses as yours, otherwise the incoming amount at the new address shows up as a deposit without an acquisition, and the gain is calculated wrongly later. Record the move in your files with the date, both addresses and the transaction ID before you delete the old wallet.
Filing a police report: what Qubic asks of those affected
The project calls on victims to file a report. That sounds like a formality, and yet it is the point at which the frozen funds may later become movable again: an exchange that freezes an account on suspicion needs an official basis at some stage in order to release the balance or return it.
In Germany you file the report at any police station, and in most federal states online through the Internetwache as well. Take what you have: your Qubic address, the attacker's address, the time and size of the outflow, and proof that the wallet belongs to you. Compensation does not follow from it. Qubic has promised none, and the Computor cluster has yet to decide.
Qubic theft: a seed created in a browser belongs in the bin
The numbers are small, the lesson is not. If your recovery phrase came into being inside a browser window, you do not know how much randomness actually sits in it. Three steps take you out of that uncertainty:
- Establish the origin. Go through every wallet holding a meaningful amount and write down what you created it with: browser, app, hardware device, operating system. Anything created in a browser on an Apple device belongs on the risk list for Qubic and at least on the review list for any other coin. Which application fits your case is shown in the software wallet comparison.
- Generate a new seed by the shortest route. Set up a fresh wallet where the randomness comes from: on a device that exists for nothing else. Then transfer the balance in full and leave the old address empty. The devices and their prices are listed in the hardware wallet comparison.
- Keep the rest at a supervised trading venue. For amounts where self-custody is too much effort, custody with a provider remains. Its licence then decides your risk. Which houses hold a MiCA licence in the EU is set out in the overview of regulated crypto exchanges.
The Qubic network is not running at the moment. When it will start again and what happens to the frozen QU then is open. Until it does, the most useful part of this night remains the question anyone can answer for their own wallets: where did the randomness come from?
(As of October 18, 2026. This article is not investment advice. Prices and fee structures change; check the terms with the provider before you buy.)
The Solana blockchain pays out around 22.88 million new SOL a year. At $100.91 per token that is a good $2.31 billion of new supply, and it arises whether or not anybody buys. On the other side stand all the American Solana funds together, with cumulative net inflows of $1.56 billion since they launched. In twelve months the blockchain therefore delivers one and a half times what the ETFs have gathered in their entire history.
That calculation is the frame around every Solana forecast. Where the price can point over a horizon of months is set out in our Solana price prediction. The figures for this article come from our own query of the Solana mainnet nodes on Sunday evening, October 18, and they can be recalculated.
The emission in numbers: 62,677 new SOL every day
A query of the getInflationRate method at a mainnet node returns an inflation rate of 3.5969 percent for the current epoch, 1061. The getSupply method gives a total supply of 636,028,735 SOL, of which 589,437,970 SOL are in circulation and 46,590,765 SOL sit in non-circulating accounts. The inflation rate applies to the total supply, not to the float.
From that follows an annual emission of 22,877,199 SOL. Spread over 365 days that is 62,677 new SOL a day, or $6.32 million daily at Sunday evening's price. Measured against the market value of $59.47 billion, the annual emission amounts to 3.88 percent.
For comparison, the demand side as far as it can be quantified: according to figures compiled at 24/7 Wall St. on October 18, the American Solana spot ETFs carry cumulative net inflows of $1.56 billion. Their net assets stood at $1.62 billion on October 16, down from $1.96 billion on September 25. That is a decline of 17.6 percent in three weeks.
How Solana's inflation formula works
Solana has no fixed cap on the token supply the way Bitcoin does. Instead a fixed schedule runs: the emission started in 2021 at 8 percent a year and has since fallen annually by 15 percent of its own value, until it reaches a terminal rate of 1.5 percent. That mechanism is called disinflation. It is set out in the inflation schedule in the Solana documentation and has been unchanged since launch.
Disinflation means the quantity of new tokens keeps growing, only more slowly. At today's 3.5969 percent it will take until roughly 2032 under the current schedule for the 1.5 percent to be reached. Over that period the schedule produces more than 100 million further SOL.
The new tokens go entirely to the validators and to the depositors who stake with them. The foundation field of the query reads 0.0, so the foundation no longer receives a share. For holders who do not stake their SOL, that amounts to a quiet dilution at the full emission rate.
$1.56 billion across all ETFs, $449 million of it from the issuers
The cumulative inflows are not a pure measure of demand. An analysis of the launch phase identifies around $449.3 million as seed capital from the issuers themselves, that is money the fund providers put into their own products at launch so that the products are tradable. Subtract that and around $1.11 billion remains that came from investors.
Measured against that amount, the blockchain delivers 2.08 times as much in a single year. The funds would therefore have to more than double their investor demand to date just to absorb one year of emission.
Since October 5 the funds have recorded outflows in every trading session, $54.9 million in total through October 16. The largest single day was October 16 at $12.7 million. The last day of inflows was October 2.
The price on Sunday evening: $100.91, just above the daily low
SOL traded at $100.91 on Sunday evening, 3.03 percent below its level 24 hours earlier. The daily high was $104.60 and the daily low $100.49. The record of $293.31 is 65.6 percent away from the price.
The round $100 level is therefore within reach for the third time this week. In our Solana forecast of October 17 it was named, at a price of $103, as the level that decides; the price has given up 2.1 percent since then and the daily low was 42 cents above the level. It has held so far, but the distance has grown smaller.
What else has changed since October 17: the stablecoin supply on the Solana blockchain stood at $15.5 billion according to DeFiLlama figures from October 17, down from $17.45 billion at the September 25 high. That base is the fuel for trading on the blockchain, and it continues to shrink.

SIMD-0550 would double the disinflation
The SIMD-0550 proposal takes aim at exactly this emission. SIMD stands for Solana Improvement Document and is the procedure through which changes to the protocol are proposed and voted on. SIMD-0550 was submitted in early June 2026 by a developer at the infrastructure provider Helius who goes by the name lostintime101; Solana co-founder Anatoly Yakovenko has publicly backed the proposal. The discussion is running on the Solana Forum.
The core of it: the annual disinflation rate would be doubled from 15 to 30 percent. The terminal rate of 1.5 percent stays unchanged, it would simply be reached considerably earlier. According to the applicants' model, the path there shortens from about 5.7 years to 2.8. On the same calculation that removes around $1.5 billion of future emission at today's prices.
The price for it is stated in the submission itself: a model shown on the foundation's conference call in June estimates that around 30 validators would tip from profitable or break-even to unprofitable in the second or third year. Anyone running a small validator may therefore lose their basis.
Two failed attempts lie behind the proposal
SIMD-0550 is the third attempt. SIMD-0228 came to a vote in March 2025 and fell short with 61.4 percent approval; two thirds are required, that is 66.67 percent. SIMD-0411, also from Helius developers and submitted in November 2025, would have achieved the same goal and was withdrawn, according to the analysis by Chainflow, while the tooling for the vote was still missing.
Voting goes by stake weight. That means the validators with the most delegated SOL decide, and they decide on their own revenue. A proposal that cuts the emission also cuts the earnings of those voting. The failure of two attempts therefore has an obvious explanation, and it is the reason a third attempt is no formality. No date has been set for the vote on SIMD-0550.
5.23 percent nominal yield on 437 million SOL staked
The getVoteAccounts query at a mainnet node shows 668 active validators and 12 delinquent ones. Together they carry 437,350,803 SOL of activated stake. That is 74.20 percent of the float and 68.76 percent of the total supply.
Those three numbers give the nominal staking yield: the emission of 22,877,199 SOL is spread across 437,350,803 staked SOL, which is 5.23 percent a year before commission and before tax. That figure is nominal, not real. Anyone staking receives 5.23 percent more tokens and afterwards holds roughly the same share of the network as before. Anyone not staking loses share.
If SIMD-0550 passes, that yield falls correspondingly faster. With doubled disinflation it would be at around 2.2 percent within a few years, calculated with today's staking rate. Which providers in the German market offer staking and on what terms is shown in our comparison of staking platforms.
668 validators, 65 of them on full commission
The commission is the share of staking earnings the validator keeps for itself. The value is public in every validator's vote account and can be read out with the same query that returns the stake distribution.
The median commission among the 668 active validators is 5 percent. 65 of them, close to one in ten, take 100 percent: anyone delegating there receives nothing of the 5.23 percent. This is not fraud and sits openly in the data, but nobody sees it in the interfaces of many wallets, because the commission is not displayed there.
A second value from the same query: the five largest validators together hold 15.11 percent of the stake, and 18 validators are enough to make up one third of it. This Nakamoto coefficient of 18 is the number that counts when the question is how distributed the vote on SIMD-0550 actually is.
The tax on staking earnings and the holding period
For investors in Germany the position is this: on the tax authorities' line, staking earnings are other income and are taxable in the year they are received at the personal income tax rate, once the €256 annual threshold is exceeded. The market value at the moment of receipt is the value the tax office applies. At a nominal yield of 5.23 percent that threshold is already reached on a holding of around $5,700.
Separate from that stands the one-year holding period on the disposal gain on the SOL themselves. Where the announced reform of that period stands is something we track continuously on our page on the status of the crypto holding period reform. For documenting individual receipts with date and market value a tax tool makes sense, because the receipts arrive daily.
This paragraph is no substitute for tax advice. The treatment of staking earnings is in parts not yet conclusively settled, and it depends on your personal situation.
Our assessment of the emission
In the view of this desk, the emission is the underrated part of every Solana forecast. The evidence: $2.31 billion of new supply a year against $1.11 billion of investor money in all the ETFs across their entire life, plus outflows in every session since October 5 and a stablecoin base that has shrunk by $1.95 billion since September 25. As long as that is the position, a price rise needs demand from somewhere else, not from the funds.
What argues against it: the emission has been known and priced in since 2021, it is not news. Three quarters of the new tokens land with depositors who staked their tokens and therefore tend to hold rather than sell, and the staking rate of 74.20 percent is high. And the consensus switch to Alpenglow on October 21 lowers validators' costs, which could keep smaller operators viable even at a lower emission. This is an assessment of the situation, not a recommendation to buy or sell.
Solana emission: without SIMD-0550 it stays 22.9 million SOL a year
Three steps that can be dealt with today:
- Check your validator's commission. If it is 100 percent, you receive nothing of the 5.23 percent. The commission sits in the vote account and is not displayed in many wallets. Anyone staking through a provider will find the terms in the comparison of staking platforms.
- Record receipts with date and market value. Income tax applies from €256 of staking earnings a year, and what counts is the value on the day of receipt. The appropriate tools are listed in the comparison of tax tools.
- Weigh the fees when buying more. At an annual emission of 3.88 percent of market value, a purchase fee of one percent carries noticeable weight. The terms at the trading venues are set out in the exchange comparison.
(As of October 18, 2026. This article is not investment advice. Prices and fee structures change; check the terms with the provider before you buy.)
Monero costs around $592 on October 18, a good 8 percent above yesterday's level. What makes the day stand out is not the number on its own: while Monero gains, Zcash loses 3.7 percent, Dash is flat and Bitcoin and Ether slip slightly. The privacy coins that traded as one block for weeks are coming apart, and for holders in Germany more hangs on that than a single day's balance, because access to XMR at regulated venues is narrowing at the same time.
A privacy coin is a cryptocurrency that hides the sender, the recipient and the amount of a payment by default, instead of writing them openly into the blockchain as Bitcoin does. Monero has done this by default for years; Zcash offers it as an option. That technical difference is the lever European supervisors are pulling.
Monero at $592: the gap to Zcash in numbers
According to CoinGecko data, Monero stands at $592.46, up 8.14 percent within 24 hours. Over a week that is a gain of 10.48 percent, over 30 days 3.76 percent. Zcash sits at $1,084.23, 3.70 percent lower than the day before, down 13.86 percent over the week and 26.99 percent over the month. Dash, the third name the market likes to file in the same drawer, is down 18.53 percent over the month.
The comparison with the wider market looks similar. Bitcoin trades just under $81,000 and is down 3.33 percent over the week, Ether at $2,364 with minus 6.69 percent over seven days. Monero is the only one of the three well-known privacy names in positive territory on the day, and it manages that against a market that is giving ground.
One figure puts the proportions in place: Monero reaches a market value of $11.15 billion, which puts it 13th, while Zcash stands at $18.41 billion and 10th. Despite the weaker month, Zcash is therefore the larger asset; Monero's higher unit price says nothing about that. On trading volume the picture reverses: roughly $195 million changed hands in Monero within a day, against roughly $668 million in Zcash. The asset that is falling trades far more often than the one that is rising.
What has changed since the $558 high of October 17
On October 17 we reported on Monero after the software update to version 0.18.5.4 and named the $558 weekly high as the level on which the move would be decided. That level has since been cleared. During the day XMR stood at $607.68, and the daily low was $555.13: what was resistance then is the lower edge of the daily range today.
What has not happened in the same period: there is no protocol change and no mainnet date that would explain the jump. The mid-October update was a maintenance release. The rebuild of transaction verification that runs under the label FCMP++ has so far only been run on test networks; the developers have not named an activation date for the mainnet. Anyone explaining the rise with a technical event is explaining it with something that has not yet taken place.
The second difference from October 17 is Zcash. Back then both assets were moving in the same direction. Since that date ZEC has lost 13.86 percent and XMR has gained 10.48 percent. That is almost 24 percentage points of distance in seven days between two assets assigned to the same category.

Why Zcash and Monero are diverging: liquidity, not a shared narrative
There is a sober explanation for the spread, and it lies in tradability. Zcash remains widely available at large regulated exchanges and, since October, reachable through exchange-traded products. That ties the price to money which arrives quickly and leaves quickly: anyone entering through a fund or with leverage also exits, and that amplifies moves in both directions. Zcash's 26.99 percent monthly loss is the reverse side of the inflows that carried the asset before.
With Monero the opposite applies. It looks like strength but arises as a side effect. The fewer regulated venues that list XMR, the smaller the share of the holdings that can be sold at short notice. A small freely tradable float moves further upward on the same buying interest, and just as far downward under selling pressure. The gap to Zcash is therefore first of all a statement about market mechanics, not about the quality of the two protocols.
What a narrow market means for you in practice
A narrow market shows up in two places you can see directly in your portfolio. The spread between the buying and the selling price widens, and larger orders move the price themselves. At a daily turnover of $195 million that goes unnoticed on small amounts, but not on four-figure sums. Anyone selling into a market like that gets the price they saw on screen less often.
Anonymity coins in the EU anti-money-laundering regulation: Article 79 applies from July 10, 2027
The framework narrowing access to Monero in Europe is the EU anti-money-laundering regulation, Regulation (EU) 2024/1624. Its Article 79 prohibits credit institutions, financial institutions and crypto service providers from keeping accounts that allow holders to be anonymised; crypto assets with built-in anonymisation functions are named explicitly. Under Article 90 of the regulation, the provision applies from July 10, 2027.
What the rule covers, and what it does not
The addressee is the service provider, not the investor. The regulation bars a supervised company from holding or trading such assets for customers. It does not bar you from owning Monero privately, nor from self-custody in your own wallet. Anyone holding XMR therefore does not have to sell because a deadline expires in 2027. What falls away is the convenient route: custody with a provider authorised in the EU.
The effect sets in well before the cut-off date, and that is exactly what can be observed in 2026. Trading venues do not clear such assets from their offering on the day the rule takes effect, but long beforehand, because authorisation, review and product approval all need lead time. According to our own analysis of October 6, six large trading venues no longer list XMR for customers in Germany.
KuCoin closed XMR deposits on October 10
A current example of the friction in day-to-day use comes from KuCoin. In a notice dated October 10 the exchange closed Monero deposits for wallet maintenance. The notice states explicitly that withdrawals are not affected. It names no date for resumption.
This is neither expropriation nor a delisting, and the distinction matters: anyone with XMR sitting there can still withdraw it. But it is an example of the kind of disruption that becomes more frequent with an asset whose infrastructure is shrinking. Maintenance windows without an end date have occurred several times at Monero in recent years, and they always hit whoever wants to trade right now.
Where you can still trade XMR in Germany at all
For practical purposes that means the trading venue now decides more about whether your position is reachable than the price does. Three points count now. First, whether your provider still lists XMR for customers in Germany in spot trading at all, rather than merely showing it on a chart. Second, whether deposits and withdrawals in XMR are open, because the two are switched separately. Third, whether the provider holds authorisation under MiCA, because how it has to handle Article 79 depends on that. Which firms hold that authorisation is set out in our comparison of the best regulated crypto exchanges.

Self-custody of XMR: what a hardware wallet does and what it does not
Because the route through service providers is narrowing, the weight shifts towards custody of your own. A hardware wallet is a device that generates the private key and never releases it; a transaction is signed on the device and the computer never sees the key. For Monero it is the only route that stays independent of a provider's authorisation questions. Supported devices and the differences between them are set out in our hardware wallet comparison.
Two limits come with it. Self-custody shifts the risk, it does not remove it: anyone who loses the recovery phrase loses the holding for good, and nobody can retrieve it. And it does not solve the trading problem. In the end you have to sell where a buyer sits, which means at a trading venue again: your own wallet secures ownership, not the exit.
Holding period: when the tax office leaves XMR gains untaxed
For tax purposes Monero counts in Germany as another asset within the meaning of section 23 of the Income Tax Act, like other crypto assets. From that follows the rule that moves the most money on a day with an 8 percent gain: anyone who holds for more than a year and then sells pays no income tax on the gain. Anyone selling inside the year pays tax on the gain at their personal rate, provided the total of all private disposal gains for the year reaches the €1,000 threshold.
The practical catch with an asset like Monero lies in the documentation. The holding period is measured per acquisition, and anyone who bought across several years and several trading venues, some of which no longer list XMR today, has to produce the acquisition data themselves. Export your history while you still have access to the account, not once the provider has withdrawn the offering.
Our assessment: the gap holds as long as Zcash lacks inflows
In the view of this desk, Monero's lead on the day is real but poorly secured. The numbers support it: plus 10.48 percent over seven days against minus 13.86 percent at Zcash, and that in a market where Bitcoin and Ether are giving ground. What argues against it is where the lead comes from. It does not rest on a documented event at Monero, no protocol date, no authorisation decision, no new infrastructure, but substantially on the freely tradable float having grown smaller. That is the same mechanism which amplifies a move downward just as much.
What follows from that: a narrow market is not a verdict on quality. The $607.68 of the daily high is around 24 percent away from the record Monero reached on January 14, 2026 at $797.73. Reachability in 2027 will be decided by Article 79 in any case, not by a chart level. No buy recommendation can be derived from this, and a total loss is possible with any crypto asset.
What would close the gap again
Two developments would be solid signals, and both are verifiable rather than merely plausible. The first is a return of inflows at Zcash through the exchange-traded products that launched in October; ZEC would then have the buyer base Monero lacks. The second is a decision by a trading venue authorised in the EU to keep listing XMR before 2027, or to list it again: that would be the only piece of news that would actually widen the narrow market at Monero. An activation date for FCMP++ on the mainnet would come as a further signal, but the developers have not named one to this day.
Monero at $592: without inflows it stays an interim reading
- Check today whether your trading venue still lists XMR in spot trading for customers in Germany and whether deposits and withdrawals are open. Anyone who has to switch will find the authorised firms in our comparison of the best regulated crypto exchanges.
- Decide which part of your holding belongs in your own custody before access closes at a provider. The differences between devices are set out in the hardware wallet comparison.
- Export your purchase history for every acquisition while the account is still open, so that the one-year period under section 23 of the Income Tax Act remains documented. Tools for that are shown in our overview of crypto tax software.
(As of October 18, 2026. This article is not investment advice. Prices and fee structures change; check the terms with the provider before you buy.)
Decrypt
MapQuest’s app now offers an optional map layer that plots known license plate readers from Flock Safety and other vendors, as backlash against the cameras grows.
Bitcoin ETFs lost a net $228.6 million this week, following a $681.1 million drain the week before and pushing October deep into the red.
A Bank for International Settlements working paper found that stablecoin growth slows when U.S. banks raise deposit rates, with Circle’s USDC most sensitive.
An FEC filing shows the Fairshake affiliate Defend American Jobs disclosed roughly $7 million more in ads against the Ohio Democrat, pushing its total past $46 million—days after the PAC expanded its map to 32 House races.
The nine-member group, modeled on the Internet Engineering Task Force, aims to set open standards for testing quantum-resistance claims as forecasts place the first practical attack in the late 2020s.
U.Today - IT, AI and Fintech Daily News for You Today
The market's response to the Uptober is certainly disappointing with most assets struggling to beat September's highs.
Former Mt. Gox CEO Mark Karpelès has stepped in to address Ledger's security woes, developing an affordable device capable of detecting hidden spy implants in hardware wallets without opening them.
October continues to be a busy month for the XRP Ledger and the Ripple ecosystem.
As Ripple tests RLUSD with banks, fraud networks are spoofing brand names to steal XRP.
Shibarium, the layer-2 network associated with Shiba Inu, sees a slowdown in transaction activity, with daily transactions hitting a monthly low.
Blockonomi
TLDR:
- White House crypto leadership has no publicly named successor after Patrick Witt announced his departure and return to the private sector.
- The departures of Witt, Bo Hines and Harry Jung leave questions about who will coordinate presidential priorities with lawmakers.
- A White House official said cryptocurrency and the Digital Asset Market Clarity Act remain priorities for President Donald Trump.
- Federal agencies continue digital asset rulemaking as the midterm elections approach and Congress faces further legislative work in 2027.
White House crypto leadership faces a vacancy after Patrick Witt announced his departure from government service last week. Witt, executive director of the President’s Council of Advisors for Digital Assets, said he would return to the private sector. No successor had been publicly named as of October 18.
His exit follows earlier departures by Bo Hines and Harry Jung. The staffing gap comes before the November midterm elections, while federal agencies continue developing digital asset rules. A White House official said that cryptocurrency and the Digital Asset Market CLARITY Act remain priorities for President Donald Trump.
White House Crypto Vacancy Follows Several adviser Departures
Witt took over the council after serving as deputy to Hines, its first executive director. He subsequently became a prominent administration representative during negotiations over the CLARITY Act. CLARITY Act talks sought to establish a federal framework for cryptocurrency markets.
Witt reportedly confirmed his departure in a Wednesday night post on X. He thanked lawmakers and agency leaders involved in the legislative effort. His announcement pointed to a move into private business without naming his next employer.
Witt disclosed Georgia National Guard commitments in July but remained involved as negotiations over market structure legislation continued.
Hines had previously left government after helping advance the GENIUS Act, which established rules for stablecoin issuers. Jung also departed, adding to turnover among officials responsible for the administration’s digital asset agenda.
The White House crypto opening leaves an unanswered staffing question as legislative discussions continue. The administration has maintained its stated support for the sector. However, officials have not publicly identified who will take over Witt’s responsibilities.
The role involves more than appearances or industry meetings. It also provides a connection between presidential priorities, agency work and negotiations with lawmakers. That coordination could become particularly relevant when the next Congress begins work in 2027.
The broader policy structure already includes officials across multiple departments. A January 2025 executive order established the President’s Working Group on Digital Asset Markets. Its membership includes Treasury leadership and the heads of the two principal federal market regulators.
That order assigned an executive director responsibility for coordinating the working group’s daily functions. It also required recommendations covering both regulatory changes and legislation.
Congress and Regulators Face a Crowded Digital Asset Agenda
White House crypto policy will face a different congressional setting after the midterm elections. Reportedly, that renewed legislative efforts in 2027 could address cryptocurrency taxes before returning to market structure reform. That sequence remains an expectation rather than an announced legislative timetable.
The election outcome will also influence negotiations. Democrats could gain control of the House of Representatives, creating a potentially less receptive chamber for administration proposals. The result remains undecided, and the staffing vacancy does not establish how lawmakers will vote.
A White House crypto liaison would provide legislators with a designated administration contact during those discussions. Without a publicly named replacement, the immediate question concerns who will represent presidential priorities in future negotiations.
Meanwhile, federal regulatory work continues across several agencies. The Securities and Exchange Commission and Commodity Futures Trading Commission remain involved in digital asset policymaking. The Office of the Comptroller of the Currency and Treasury Department also have ongoing work affecting the sector.
These separate responsibilities mean congressional legislation represents only one part of the policy calendar. Agency rulemaking can proceed while lawmakers debate proposals, although regulators operate within their existing legal authority.
For White House crypto officials, the coming workload therefore spans personnel decisions, congressional outreach and coordination with financial regulators. The administration has not publicly set out a replacement process or appointment date.
The post White House Crypto Leadership Gap Grows as Patrick Witt Exits appeared first on Blockonomi.
TLDR:
- Prediction markets traded $102.4 billion in contracts over 30 days, with about $25.7 billion paid.
- Stablecoins hold a $302.34 billion market cap, while DeFi total value locked sits at $88.49 billion.
- Tokenized real-world assets stand near $34.61 billion onchain, with $4.12 billion active in DeFi.
- Four areas could drive DeFi’s next phase: stablecoin payments, lending, tokenization, and consumer apps.
DeFi is evolving, and attention is turning to what comes after betting and prediction markets. Prediction markets recorded $102.4 billion in contracts traded over 30 days, with about $25.7 billion actually paid.
Stablecoins hold a market capitalization of $302.34 billion. DeFi total value locked stands at $88.49 billion. Real-world assets represent roughly $34.61 billion onchain, with $4.12 billion used actively in DeFi. Prediction-market figures include centralized venues. Snapshots date from October 17 to 18, 2026.
From Token Swaps to Betting on Real-World Events
Deadline framed the question in a recent post. A few years ago, DeFi centered mainly on token swaps, yield farming, and staking. Memecoins and perpetual trading followed. Prediction markets such as Polymarket then gained traction. Today, DeFi is evolving again.
DeFi is evolving. But what comes after betting and prediction markets?
A few years ago, DeFi was mainly about token swaps, yield farming and staking.
Then came memecoins, perpetual trading and the explosive rise of prediction markets like @Polymarket.
Today, people aren't… pic.twitter.com/YgEIrSvtNn
— Deadline
| ETHGas
(@cryptodeadline) October 18, 2026


Under this model, people are not only trading crypto prices. They are trading expectations about real-world events. The post treats this change as a sign that financial innovation can expand beyond crypto tokens. Meanwhile, the post says other parts of DeFi offer something more practical.
Stablecoins, lending protocols, and tokenized assets are creating opportunities for more practical uses, according to the post.
These products connect onchain infrastructure with everyday financial needs. As a result, Deadline presents them as the direction after betting and prediction markets.
The first wave of DeFi was about making finance decentralized. The next wave, according to Deadline, could be about making decentralized finance genuinely useful. Prediction markets, in this view, are not the end of DeFi’s evolution. They are one part of a much bigger financial transformation.
How DeFi Is Evolving Toward Practical Use
Deadline outlined four areas that could shape the next phase. Stablecoin payments would move money across borders more efficiently. Onchain lending would expand access to borrowing and liquidity.
Real-world asset tokenization would bring traditional financial products onto blockchain infrastructure. In each case, DeFi is evolving toward use cases outside crypto trading.
The fourth area is consumer-friendly financial apps. These apps would let people use DeFi without understanding wallets, gas fees, or smart contracts.
For example, a user could receive payments, borrow money, or access investments through an app. The user would not need to know DeFi powers it. Deadline called that kind of adoption worth watching.
However, the post acknowledges obstacles. Security, regulation, and liquidity remain serious challenges for the sector. These issues remain alongside the growth in stablecoins, lending, and tokenized assets. Even so, Deadline says the bigger picture is becoming clearer, as DeFi is evolving beyond its first wave.
Deadline ended the post with a question for its audience. It asked whether stablecoins, tokenized assets, or onchain lending will lead the next growth phase. It also asked whether another sector is being overlooked. Readers were invited to share their views.
The post DeFi Is Evolving: What Comes After Betting and Prediction Markets? appeared first on Blockonomi.
TLDR:
- NEAR trades near 4.895 after falling about 17% this week, with a low of 4.527 and the candle still open.
- The 4.30 region acted as a recurring pivot during 2024 and anchors the long scenario in the chart.
- The trade drawing sets entry at 4.316 and a stop at 3.928, about 9% below the planned entry.
- A break above 6.00 would point to 7.847, a 2024 resistance level and 81.8% above the entry.
NEAR price is testing a former resistance zone after a sharp weekly pullback from 6.00. The token trades near 4.895 on the weekly chart. The current candle shows a decline of about 17%, with a low at 4.527.
That candle remains open. Price still sits above the 4.30 region, which now serves as the main support level for buyers. The move follows an advance through earlier resistance at 3.133 and roughly 4.30.
NEAR Price Breakout Faces First Major Test
Analyst Giannis Andreou shared the weekly chart on X and labeled the setup a breakout retest. He placed the next major objective at 7.85. The post describes a sharp advance through former resistance levels. Price then reached 6.00 before pulling back.
$NEAR: A BREAKOUT RETEST WITH 7.85 AS THE NEXT MAJOR OBJECTIVE
NEAR is trading around 4.895 on this weekly chart after a sharp advance through the former resistance levels at 3.133 and approximately 4.30. Price reached 6.00 before pulling back, placing the focus on whether… pic.twitter.com/pTtto5nCdZ
— Giannis Andreou (@gandreou007) October 18, 2026
The 4.30 region acted as a recurring pivot during 2024. Reclaiming it marks a change from the earlier bearish structure. The weekly chart marks it as the foundation of the long scenario. A successful retest requires buyers to defend the area and form a higher low.
The trade drawing sets entry at 4.316 with a stop at 3.928. That stop sits about 9% below the planned entry. A move through it would invalidate the setup. A sustained loss of the breakout region could raise the risk of a retracement toward 3.133.
The current weekly candle remains open, so the 17% decline may still change. The low at 4.527 stays above the marked support. Price therefore holds the breakout area for now. The 4.30 level remains the marked reference for buyers.
Upside Targets Near 6.00 and 7.85
The immediate hurdle is the recent high around 5.90–6.00. The yellow projection expects a bounce from support into that area. A pullback would follow, forming another higher low. Holding above the first retest low would show steady buyer support. The projection ends with a move back above that range.
A break above 6.00 would strengthen the case for continuation. The projected path then points toward 7.847. That area matches major historical resistance from 2024. Sellers previously defended the zone during that year, and the analyst treats it as a potential profit-taking zone.
From the 4.316 entry, the target represents about 81.8% upside. The target sits above the entry by roughly 3.53. The chart displays a risk/reward ratio of 9.1. That ratio compares the 3.928 stop against the 7.847 target.
The technical case rests on two conditions. The 4.30 region must become support. Then price must confirm a break of 6.00. Each condition depends on buyer participation at those levels. Until both occur, the NEAR price remains in a retest phase.
The post NEAR Price Retests Breakout Zone as Analyst Eyes 7.85 Target appeared first on Blockonomi.
TLDR:
- Monero price prediction centers on $558 resistance after XMR traded near $555, with a daily close above the barrier putting $575 in view.
- Spot volume rose 171% to $13.13 million, while futures volume advanced 70% to $200 million in the reported trading period.
- Open interest climbed 11% to $261 million, and about 63% of traders in the tracked positioning sample held long exposure.
- The $500 level and broader $475 to $500 demand zone remain support references, while $650 marks a more distant swing high.
Monero price prediction shifted into focus after XMR climbed 10% in October 18. The token traded near $555, placing $558 immediately ahead of buyers. That level matters because it acts as resistance before a move toward $575. Derivatives activity also accelerated. Open interest rose 11% to roughly $261 million, while spot and futures volumes increased.
Monero Price Prediction Weighs Spot Demand Against Futures
Spot volume rose 171% to $13.13 million, while futures volume advanced 70% to $200 million in the reported period. Spot trading grew faster by percentage, but futures activity remained far larger in dollar terms. That gap makes cash market participation especially relevant to the Monero price prediction. Rising futures turnover can accompany a strong advance without showing whether traders will hold their positions.
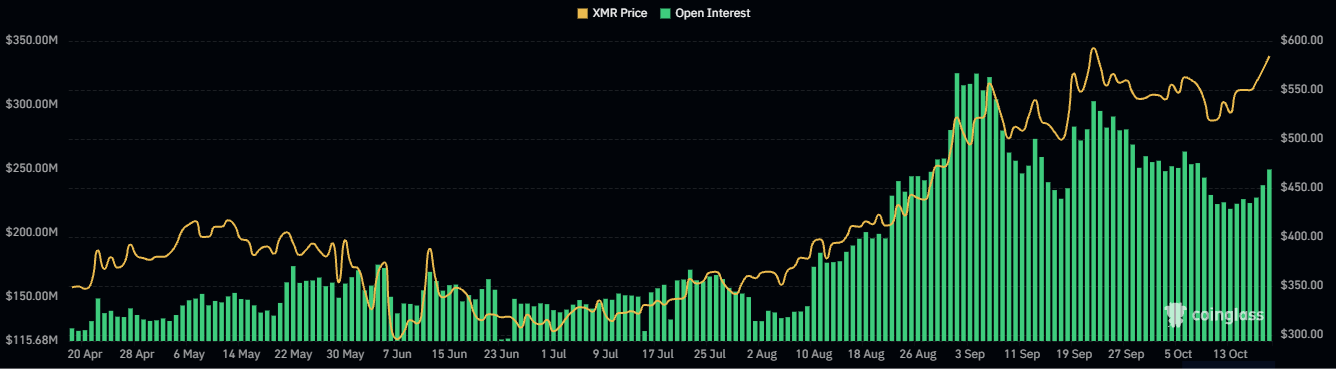
Another volume measure nearly doubled to $147 million. These figures track different markets and methods, so they should not be added together. Higher volume means more XMR changed hands during the period. It does not, on its own, show sustained net buying or confirm a breakout.
Monero open interest provides a clearer view of positions left outstanding. Its 11% increase indicates that traders expanded derivatives exposure during the recovery. Open interest can rise when new long and short contracts enter the market. It cannot show that all new exposure favors higher prices. That makes the price reaction around $558 more useful than the headline figure alone.

Positioning data in the report placed long traders near 63% within the sample tracked by Coinalyze. The measure suggests a bullish tilt among those accounts, though it does not cover every Monero trader. For the Monero price prediction to strengthen, XMR would need to clear $558 and hold the move. A daily close above that level would bring the $575 area into view. Failure there could leave recent long positions exposed to a pullback.
Crowded XMR Longs Face the $558 Resistance and $500 Support Test
XMR price had already reclaimed $500 during its earlier advance, turning that mark into a nearby support reference. The XMR price analysis also identified a broader demand area between $475 and $500. Several rebounds had occurred around that range, while the daily chart showed XMR above key exponential moving averages. These are observed chart conditions, not guarantees that the range will hold again.
A retreat below $500 would put the wider demand zone under pressure. If buyers defend it, they may have another chance to challenge $558. The $650 swing high remains a more distant reference. For the Monero price prediction to reach that level, XMR must clear nearer barriers and sustain demand after the initial breakout.
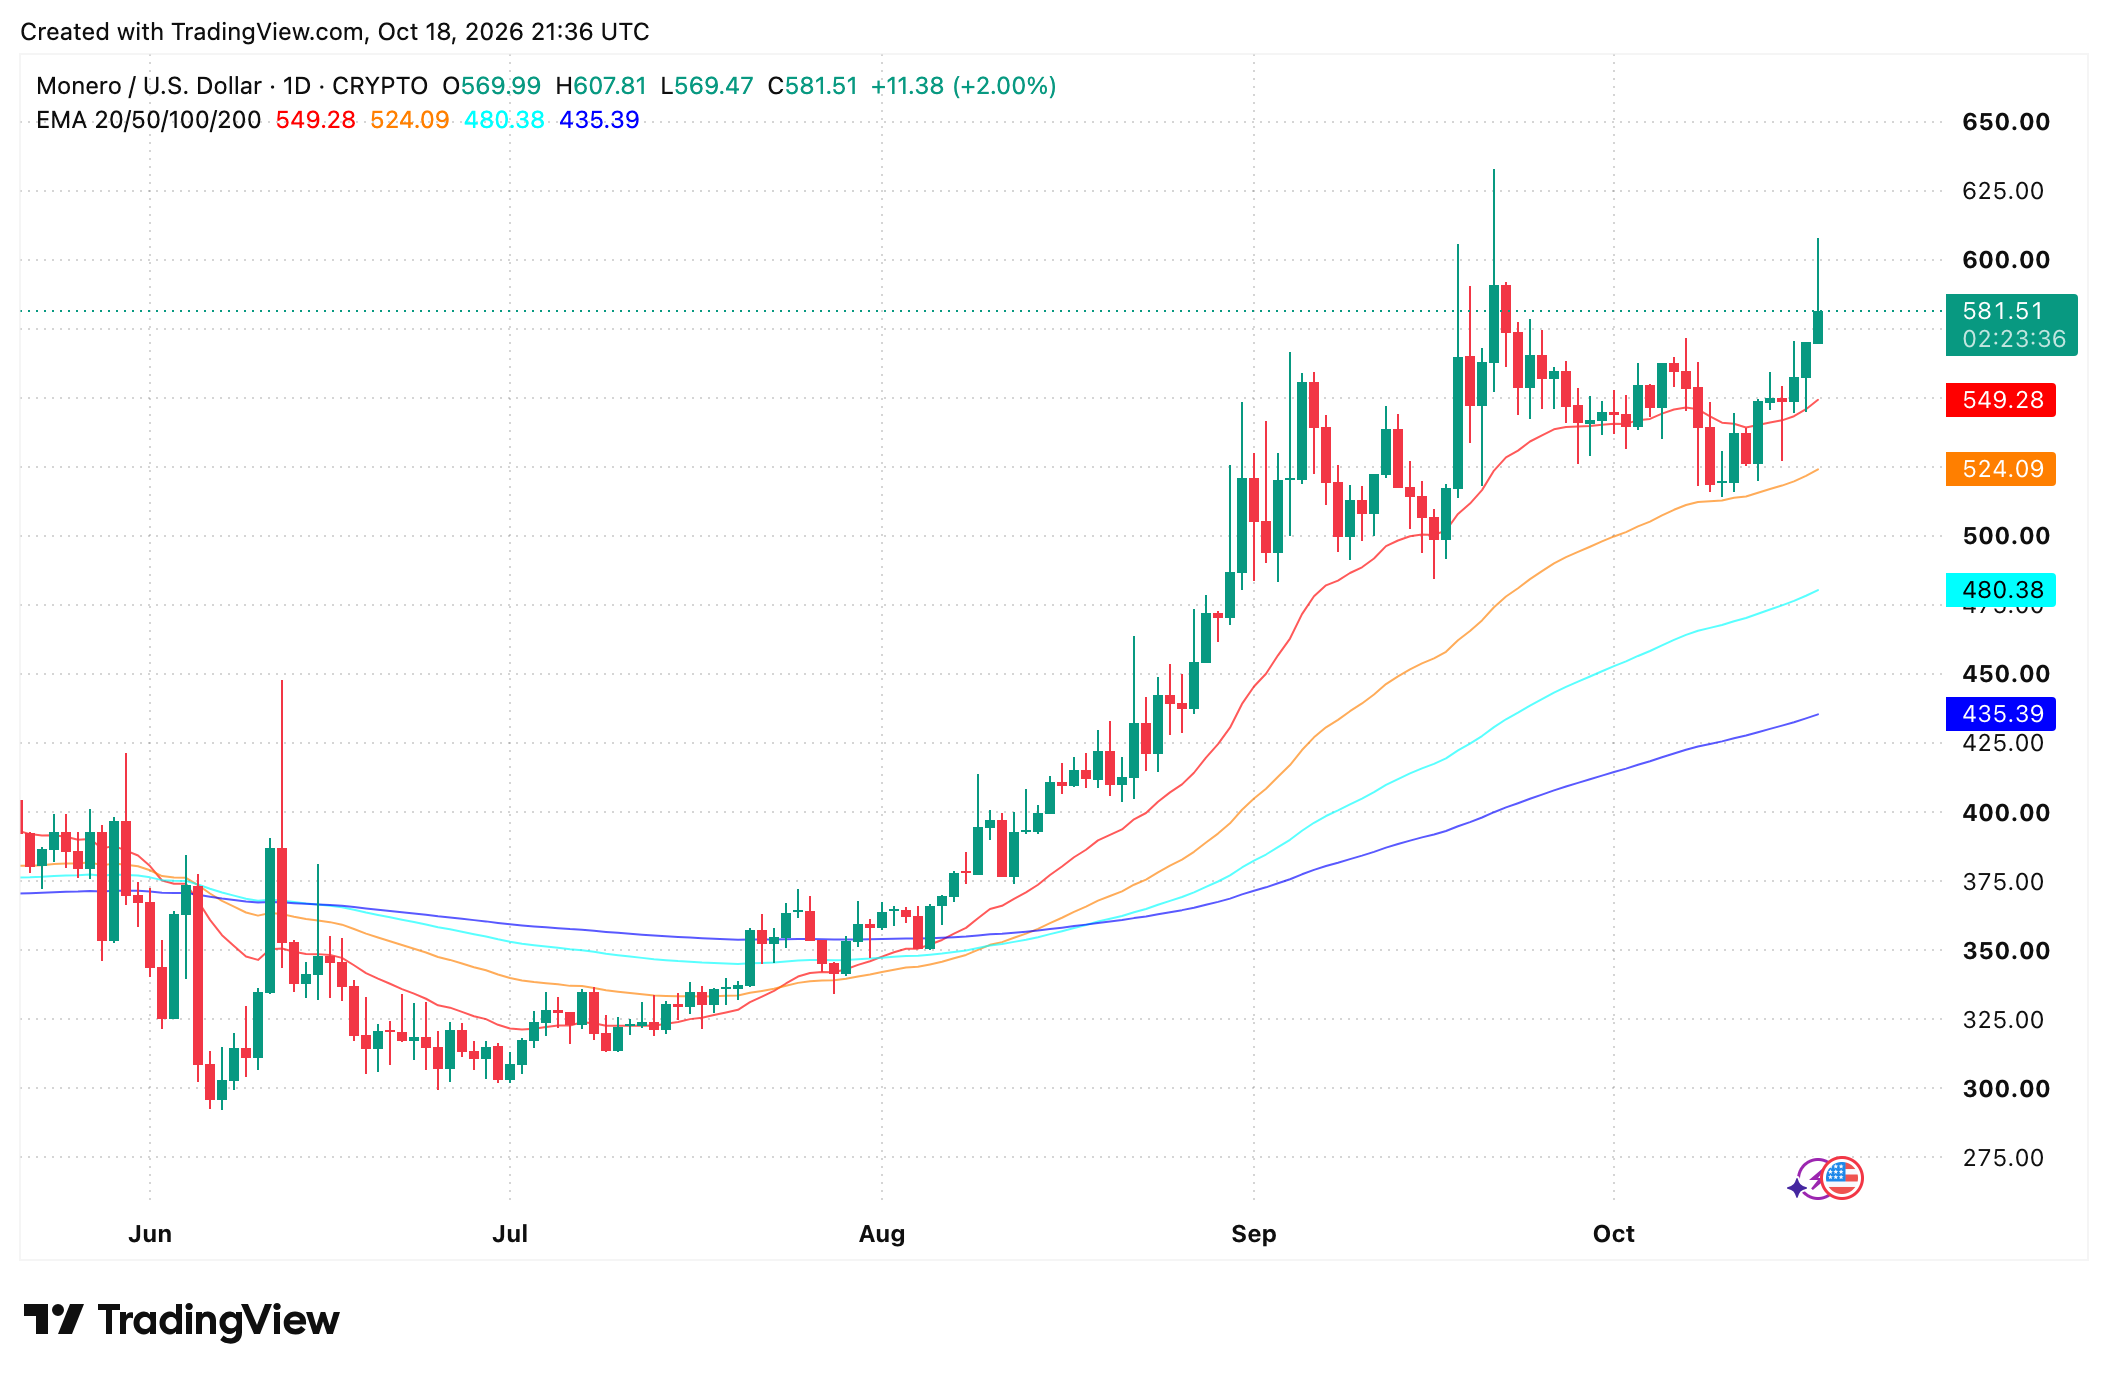
The Monero price prediction also depends on how leverage responds to a reversal. When crowded longs close voluntarily or face liquidation, their exits can add selling into a falling market. The reported 63% long share cuts both ways. It reflects bullish positioning, but it also identifies a group sensitive to a failed rally.
THORChain’s protocol upgrade adds a separate development for Monero. Its published update discussed work toward Monero activation, including swap and node improvements. That work could eventually widen self-custodial trading routes. The update does not establish that native Monero swaps were fully available on the main network during this market snapshot.
According to onchain data, its number of XMR swaps rose 1.43% in August, compared with Monero’s 43% price gain that month. That measure covers one platform and an earlier period than the October trading figures.
The post Monero Rally Tests $558 as XMR Open Interest Reaches $261M appeared first on Blockonomi.
TLDR:
- ONDO is described by the Ondo Foundation as a governance token for the Ondo DAO and Flux Finance.
- Published risk disclosures say ONDO holders have no shareholder rights or claim to company dividends.
- Andreou asks for a clear mechanism, enforceable scope and measurable benefit linking products to holders.
- Ondo’s Solana tokenized assets passed $500M, and Ondo Stocks reached $1B TVL and $18B in volume.
The ONDO token faces a fresh debate over what its holders actually own as Ondo expands its tokenized finance business. Questions have emerged over how product growth translates into value for token holders.
Meanwhile, tokenized assets tied to Ondo on Solana reportedly crossed $500 million. The two views reflect a wider discussion about the link between platform adoption and governance token demand. Both positions depend on how the token is defined in Ondo’s published documents.
What the ONDO Token Represents
The Ondo Foundation describes ONDO as a governance token for the Ondo DAO and Flux Finance. Holders therefore take part in decisions tied to those two areas. The ONDO token is not presented as a claim on company revenue.
Giannis Andreou raised the question in a post on X. He asked how the success of Ondo’s products reaches someone holding the token.
$ONDO BULLS: WHAT EXACTLY DOES THE TOKEN HOLDER OWN?
Ondo could become an important business in tokenized finance.
Institutions could adopt its products. Assets under management could grow. Distribution could expand across wallets, exchanges and financial platforms.
My… pic.twitter.com/F8tbhdRGjE
— Giannis Andreou (@gandreou007) October 18, 2026
He pointed to the Foundation’s token-sale risk disclosures. Those disclosures state that holding the token provides no shareholder rights. They also exclude rights to company dividends and distributions.
Andreou added that a customer buying a tokenized financial product acquires something different from an ONDO buyer.
The yield or economic rights attached to a product do not automatically belong to the governance token holder. Governance rights and product economics therefore sit in separate categories.
What Would Support a Bullish Case
Andreou acknowledged that governance can carry value. He also noted that future changes could strengthen the token’s role. Market demand may rise as the ecosystem grows. However, he asked that each of those arguments be evaluated separately.
He wants supporters to identify the existing mechanism, its enforceable scope, and the measurable economic benefit for holders.
If a thesis relies on a future governance decision, he asked that the dependency be explained. He also asked who holds the power to deliver that decision.
According to Andreou, a documented link between product success and durable demand for the ONDO token would change his view. He said numbers should show why that link matters. This standard applies to any claim that product growth benefits holders.
Solana Milestone Adds Another Angle
Niels offered a separate view in a post on X. He reported that ONDO crossed $500 million in tokenized assets on Solana. Ondo brought its tokenized stocks to the network only in January. The launch started with more than 200 U.S. stocks and ETFs.
Since then, Ondo has expanded 24/7 minting and redemption on Solana. Niels added that the wider Ondo Stocks platform has passed $1 billion in TVL. Cumulative volume has reached $18 billion in under eight months.
Niels described the pace of cross-chain expansion as hard to ignore. His post centers on platform scale. Andreou’s post centers on how the ONDO token captures benefits from that scale. Both posts therefore frame the same debate from different sides.
The post What Does the ONDO Token Holder Own? Debate Grows as Solana Assets Pass $500M appeared first on Blockonomi.
CryptoPotato
The total crypto market cap increased by $840 billion, or 39.6%, to close the third quarter at $3 trillion, per data from CoinGecko, ending three straight quarters of declines.
It was the largest quarterly rise since the fourth quarter of 2024, but prices outpaced participation with trading volumes still falling.
August Delivered More Than Half the Quarter’s Gain
Market cap peaked near $3 trillion on September 21 before closing the quarter at $2.96 trillion, which is still 4% lower year to date.
August did the heavy lifting, with a 21.8% jump worth $490 billion that followed a US Treasury announcement to at least double its planned buybacks of long-dated bonds, plus steady net inflows into spot Bitcoin ETFs. A Senate procedural vote on the CLARITY Act failed on September 15 and barely slowed the climb.
Ethereum, meanwhile, gained 71% to $2,684, beating Bitcoin and every other major coin, helped by net inflows of $3.1 billion into US spot ETH funds that erased all the outflows from the first half of the year.
However, its trading volume still fell 23.2% to $11.5 billion, and Glamsterdam, the network upgrade already delayed in the second quarter, missed mainnet again and is still reaching test networks, with Sepolia activated on October 6.
Average daily volume fell 8.6% from Q2 to $73.3 billion, a third consecutive quarterly decline, while spot volume at the top ten centralized exchanges slid 14.2% to $1.65 trillion. But leverage came back faster than buyers did, since open interest on perpetual futures, which counts the value of contracts still open, rose 40.6% and closed above $100 billion for the first time since the third quarter of 2025.
Binance Gains Share While Newer Platforms Draw Traders
Binance extended its spot share to 42.7% from 38.7% in the second quarter, and it was the only exchange in double digits. It also added $12.7 billion to open interest, while KuCoin and Deribit lost 41.2% and 18.9%, a split CoinGecko called uneven rather than broad-based.
Bitget, for its part, fell to #11 after a hack in September, having already dropped from $37.8 billion in monthly volume in June to $15.7 billion in July.
CoinGecko also tracked Robinhood Chain, which launched July 1, and recorded more than $88.9 billion in trading volume during the quarter. Although the network was built with tokenized stocks and real-world assets in mind, meme coin traders took over, becoming a major source of activity that saw transactions per day hit an average of 9.5 million in Q3, even though most newly deployed tokens failed to gain traction.
The market has since then given back some ground, with BTC falling to a monthly low of $80,200 on October 15 amid pressure from Asian stock markets and September inflation data that came in slightly above forecasts.
The post Crypto Ends Three-Quarter Losing Streak With 39% Q3 Gain: Report appeared first on CryptoPotato.
A recent report by Chainalysis claimed that the United States has become a net importer of bitcoin this year while continuing to export dollar-backed stablecoins around the world.
The trend highlights an increasingly unusual dynamic: institutions are pulling BTC into the US, while the rest of the world is becoming more dependent on tokenized dollars.
Institutions Bring BTC Into the US
The report found that the US became a net importer of BTC this year for the first time since 2022. The distinction between retail and institutional activity is particularly notable, as transfers below $10,000 remained net outbound, but larger transactions moved strongly in the opposite direction. The $10 million-plus bracket alone accounted for 53,200 BTC flowing into the country.
In other words, retail users are sending BTC out, while US-based institutions are bringing it in. Chainalysis links the shift partly to the rise of spot Bitcoin ETFs, which have steadily increased the US share of global crypto activity since their launch in early 2024.
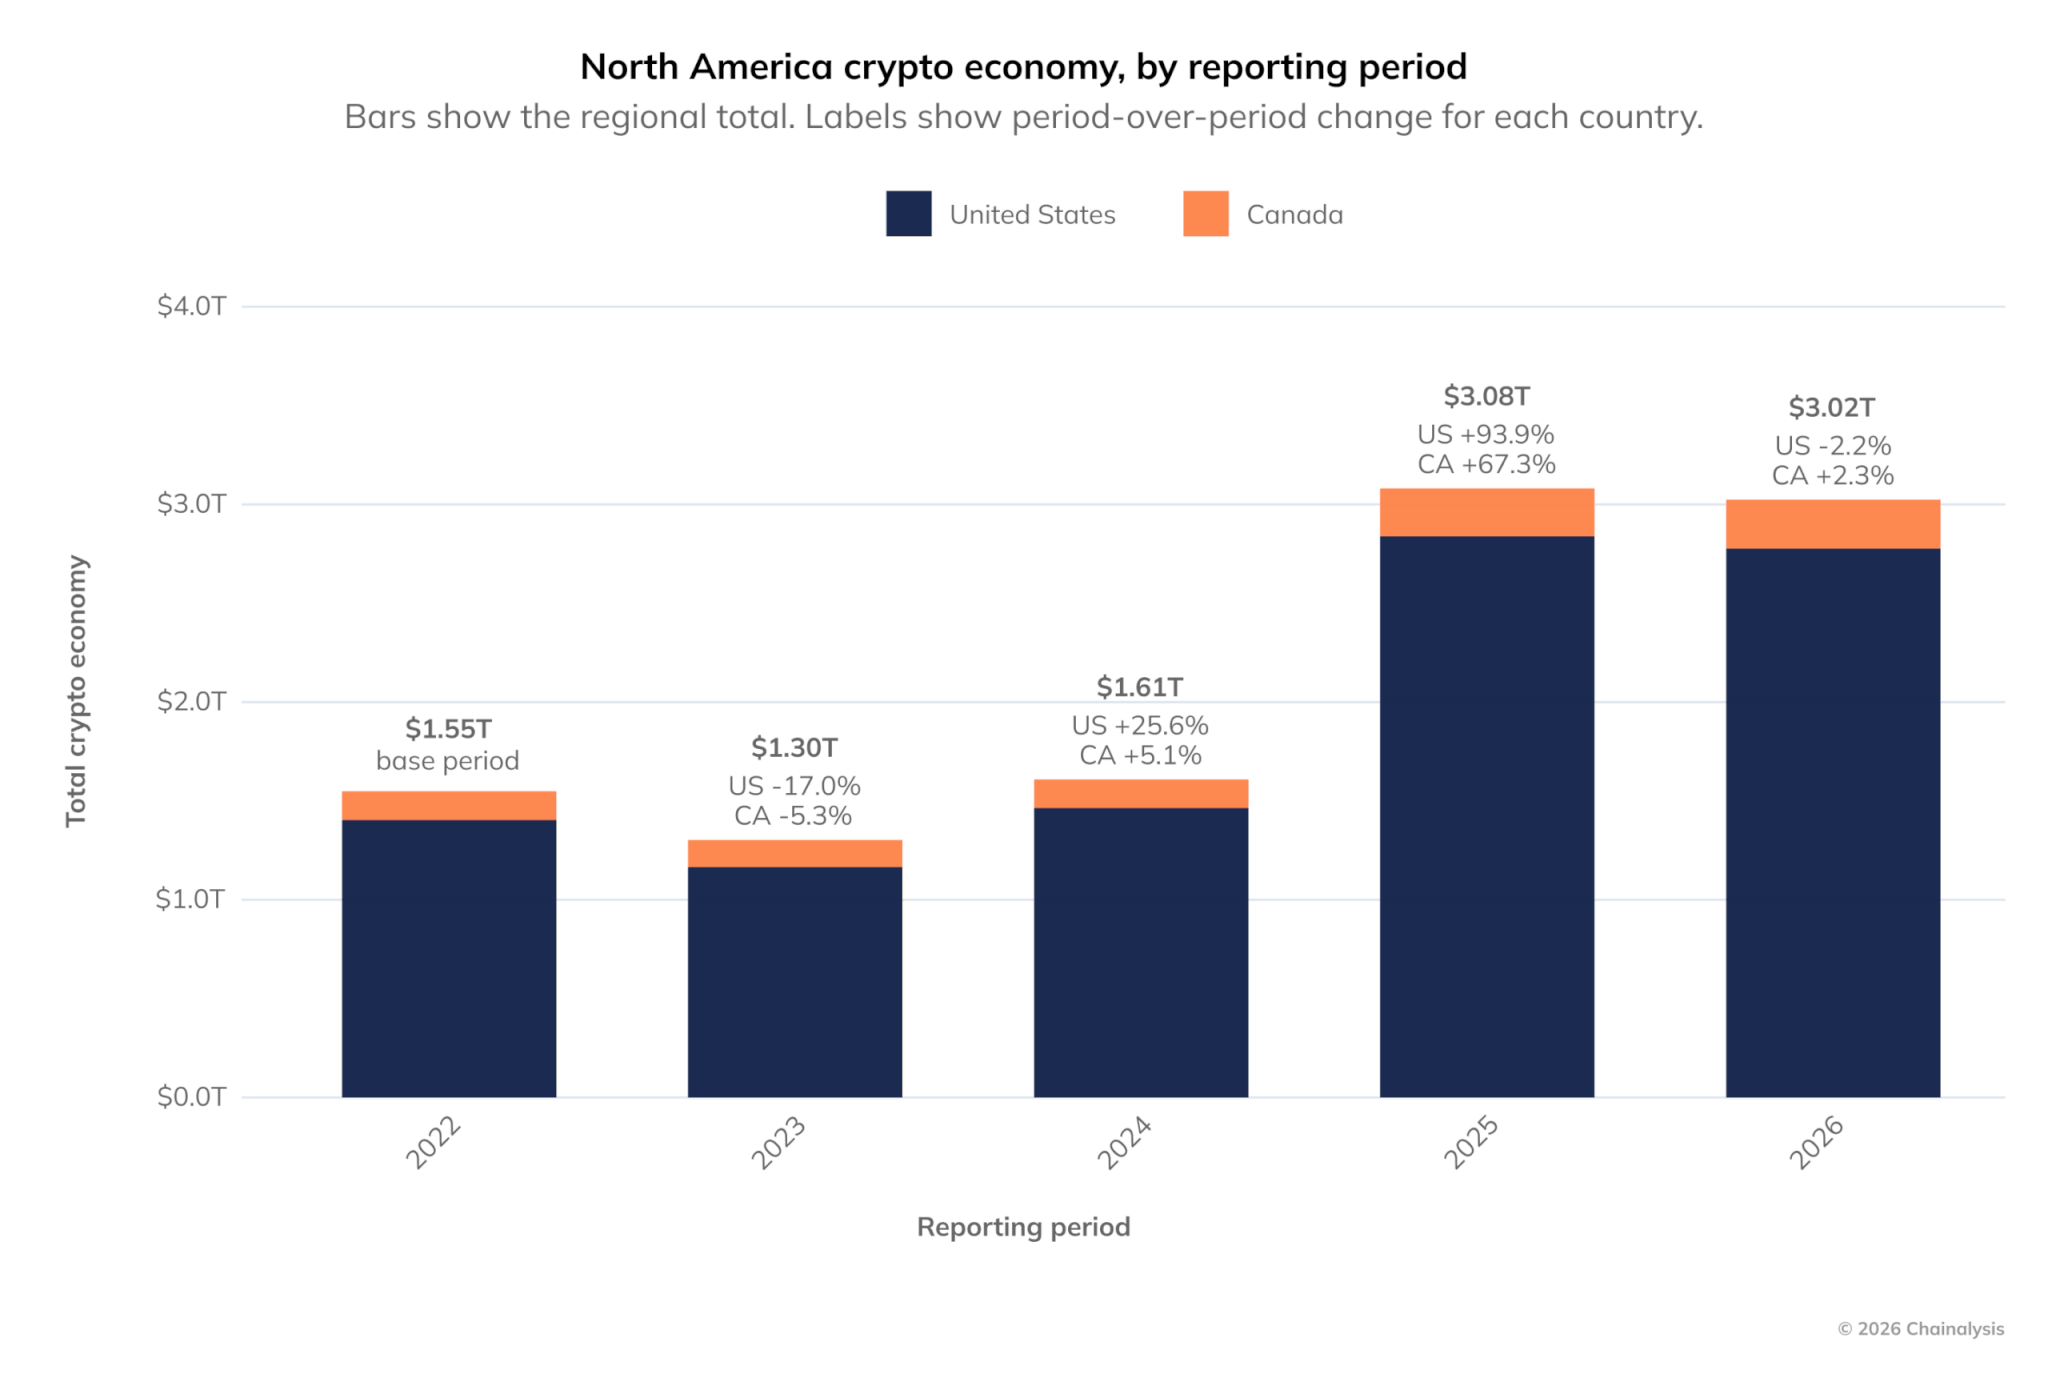
That fits a broader trend we previously covered, suggesting BTC has increasingly migrated from exchange balances to institutional structures such as ETFs and corporate treasuries. This reduces the amount of units readily available on trading platforms.
Chainalysis also noted that the US Strategic Bitcoin Reserve has added another layer of implicit sovereign demand, despite there being no standing federal purchasing program yet.
Everyone Else Wants Digital USD
The report further indicated that 99.1% of stablecoin order-book volume is tied to the greenback. It argued that users outside the US increasingly rely on such assets because they offer access to dollars without requiring an American bank account. That dynamic ultimately feeds back into US financial markets because stablecoin issuers typically hold reserves in short-dated US government debt.
The growing RWA sector reinforces the same trend, as the global market exceeded $36 billion in Q2 this year. It’s up 135% from the previous period, while tokenized US Treasuries alone accounted for $15.42 billion, or almost 43% of the total.
We have previously highlighted the rapid expansion of the sector, with tokenized Treasuries emerging as one of the largest and fastest-growing niches.
Taken together, the picture is quite straightforward: foreign users are increasingly demanding tokenized dollars and US debt, while American institutions are accumulating BTC.
The post US Is Importing Bitcoin and Exporting Digital Dollars: What Does it Mean? appeared first on CryptoPotato.
Chainalysis has revealed that one of the biggest victims of the Ledger implant thefts was a task scam operator who lost more than 60 Bitcoin (BTC).
The blockchain analytics firm put that loss at about $4.8 million. It seems the operator moved the scam’s proceeds into three Ledger addresses on September 22, and then emptied all three into the same wallet on October 9.
A flow chart Chainalysis posted traces the money back to a consolidation wallet, and it labels three of the wallets feeding it as reported scams. Likewise, the largest scam wallet sent it $1.36 million across 106 transfers. Each Ledger address was then drained of about $1.64 million in a single transfer.
Fake Reviews Led to Deposits
The report said the scam paid people to fake sales and reviews of real products, who then saw a negative balance appear in their accounts. They were told to add their own money before they could be paid.
One of the biggest victims of the Ledger theft was a scammer themselves. They lost more than 60BTC, about $4.8M. The funds were from a task scam.
In this task scam, people were paid to fake sales and reviews of real items. Then a “negative balance” appeared, and they were told to add their own money in order to get paid.
On Sep 22, the person behind the scam moved the proceeds into three separate Ledger addresses. On Oct 9, thieves emptied all three. One transfer each, into the same wallet. The wallet is reported as stolen funds.
— Chainalysis (@chainalysis) October 15, 2026
The US Federal Trade Commission (FTC) described the same pattern in a December 2024 report on task scams. The agency estimated that task scams made up nearly 40% of job scam reports in 2024.
“Cryptocurrency is the payment of choice for these scams,” the FTC said. Reported crypto losses to job scams hit $41 million in the first half of 2024, the agency added.
Ledger Ties Losses to CryptoBilis
Chainalysis didn’t disclose where the operator bought the Ledger signers, but Ledger has tied every confirmed loss from the incident it disclosed on October 9 to signers sold through CryptoBilis, a Southeast Asian reseller.
On October 10, Ledger found an unauthorized hardware implant inside one victim’s signer. Its Donjon security team said the implant reads the screen during setup and captures the 24-word recovery phrase. The implant then sends those words out over LTE through a provisioned eSIM.
On-chain analyst Specter has estimated losses from the CryptoBilis drain at more than $86 million, across Bitcoin, Ethereum (ETH) and TRON (TRX).
“We have not confirmed the total number of affected users or the total value lost,” Ledger said on Tuesday. The company has told anyone who set up a signer bought from CryptoBilis to move their assets to a new signer with a new recovery phrase.
The post Scammer Gets Scammed: Ledger Implant Thieves Steal $4.8M in Bitcoin appeared first on CryptoPotato.
Ethereum is testing a critical support confluence below $2.4K as its correction continues. Buyers have defended the area with several sharp reactions, but persistent lower highs suggest that selling pressure has yet to ease.
Ethereum Price Analysis: The Daily Chart
On the daily timeframe, ETH has declined into the highlighted $2.36K–$2.44K demand zone, where the lower boundary of the broader ascending channel provides additional support. The asset is currently near $2.36K, with recent lower wicks indicating buying interest beneath the consolidation.
However, these reactions have not produced a sustained recovery. Since losing the channel’s midpoint, ETH has continued to form lower highs, keeping the immediate outlook fragile. Buyers need to reclaim the $2.44K demand boundary and then overcome the recent $2.5K–$2.56K resistance area to demonstrate improving strength.
Holding the current confluence could support a recovery toward the former consolidation around $2.67K–$2.74K. Conversely, a decisive daily close beneath $2.36K and the ascending channel boundary would weaken the broader recovery structure, increasing the risk of a deeper correction toward $2.2K.
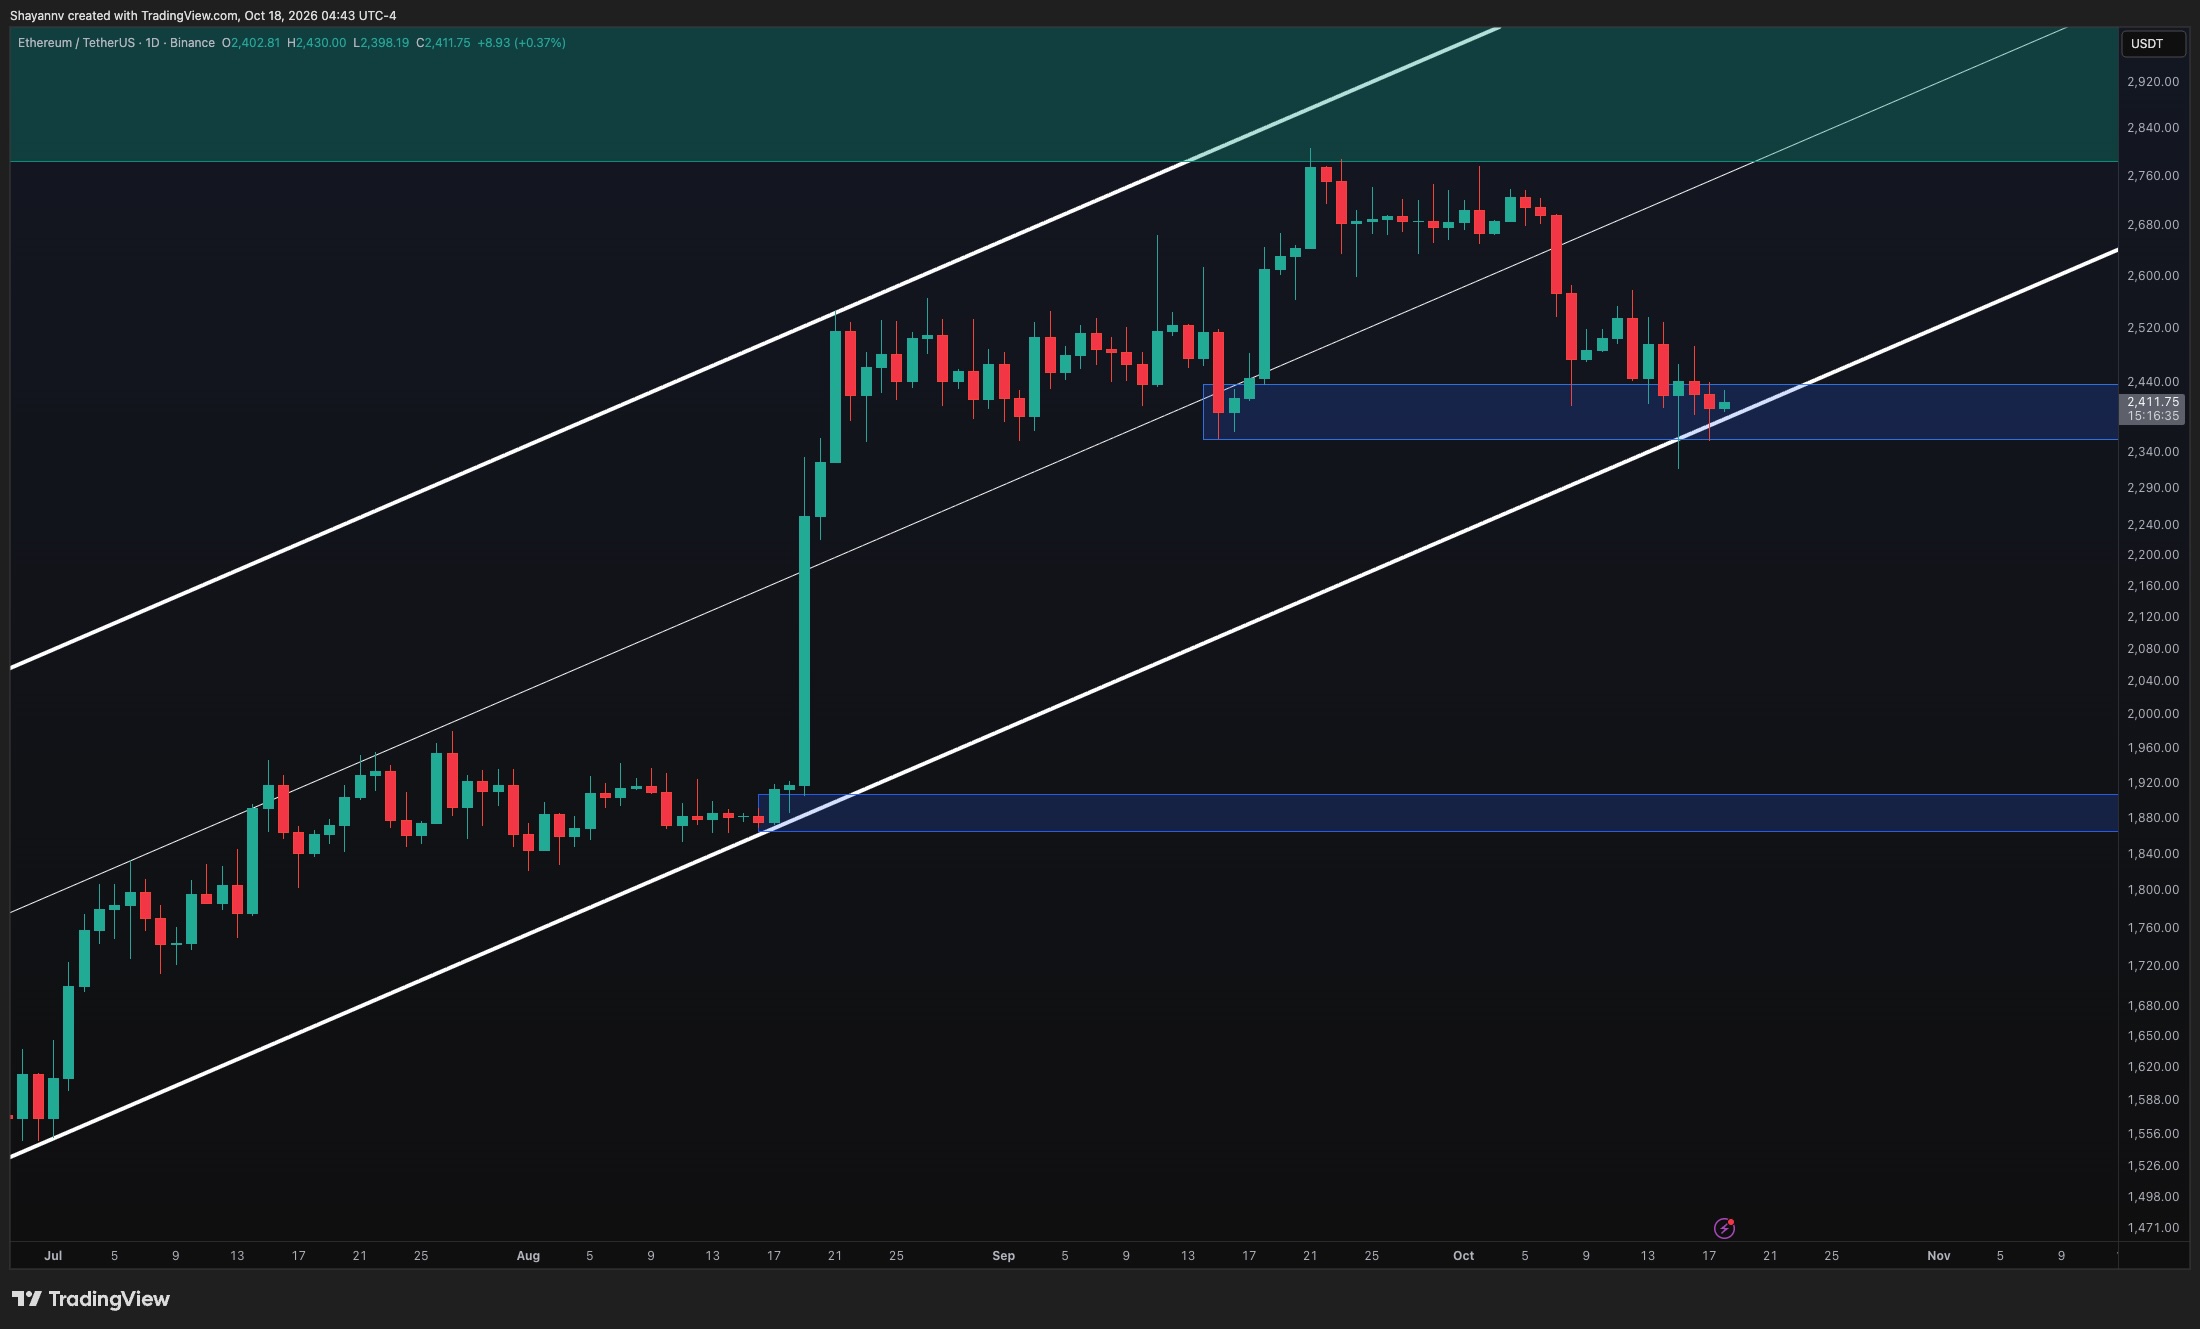
ETH/USDT 4-Hour Chart
The 4-hour chart shows Ethereum trading within a descending channel following the sharp early-October selloff. Repeated rebounds have failed to break the upper trendline, while the latest candles are consolidating inside the $2.36K–$2.44K demand zone.
The descending resistance currently approaches $2.45K–$2.47K, making this the first important obstacle to a recovery. A sustained breakout above both the demand zone’s upper boundary and this trendline would interrupt the immediate bearish structure and could allow a move toward $2.5K–$2.58K.
Until that occurs, another test of $2.35K remains possible. Losing this support would expose the recent wick lows around $2.32K, followed by the highlighted $2.2K–$2.27K demand zone. The descending channel’s lower boundary also approaches that deeper region, reinforcing its relevance if the correction extends.
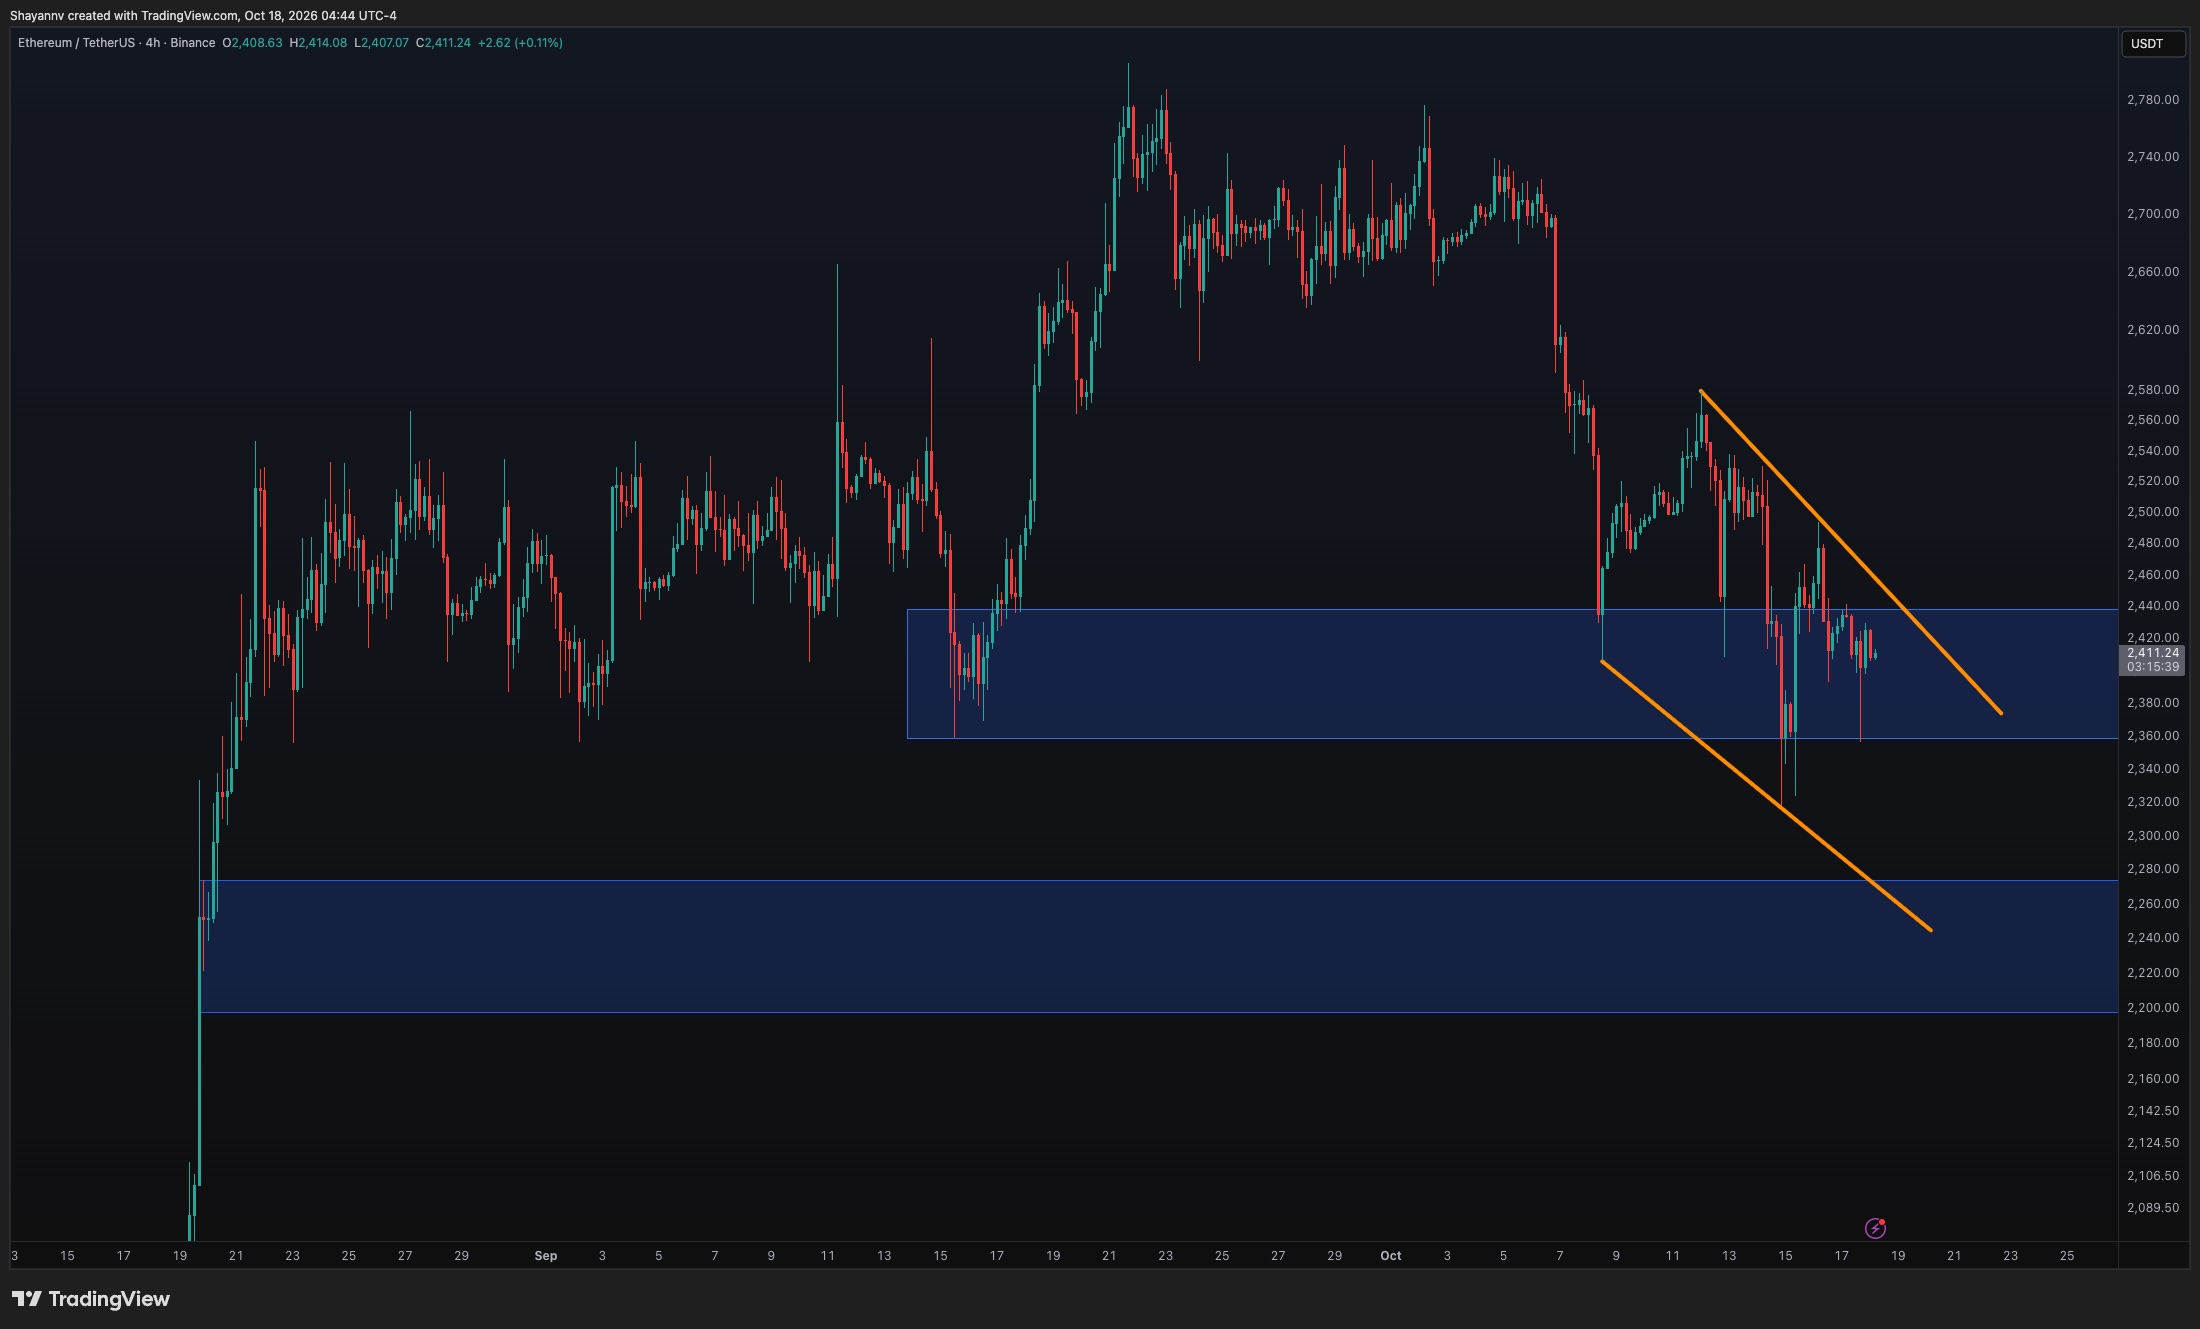
Sentiment Analysis
The one-month ETH liquidation heatmap highlights a substantial estimated liquidation cluster around $2.15K–$2.2K, above the psychological $2K threshold. The band has remained visible across multiple sessions and is particularly bright near the chart’s latest readings, indicating a significant concentration of potential liquidation exposure below the current price.
This cluster becomes especially relevant if Ethereum loses the $2.36K support zone and its broader ascending structure. Under that scenario, further declines could trigger long liquidations as the price approaches $2.2K, potentially accelerating the move into this liquidity pool.
Its proximity to the $2.2K–$2.27K technical demand zone adds significance to that broader area. However, the cluster represents potential forced-selling exposure rather than guaranteed support or an inevitable price target. A sustained recovery above nearby resistance would reduce its immediate relevance, while continued structural weakness would keep it in focus.

The post Ethereum Price Prediction: Is ETH’s 7% Weekly Drop Just the Start? appeared first on CryptoPotato.
It feels like it was just a few weeks ago, because it was when our article on this topic had a whole different nuance to it. We were highlighting the major green streaks for the ETFs tracking both XRP and SOL, as they had reached local peaks in terms of net inflows.
The reality today is quite different. On one side, the spot Ripple ETFs marked their first red week in months, while the Solana counterparts extended their outflow streak to ten consecutive days.
XRP ETFs Break the Streak
It was an all-out red week for the spot crypto ETFs, with the BTC and ETF funds bleeding by triple digits, as reported earlier. The financial vehicles tracking Ripple’s cross-border token began the business week with the same nonexistent pace as they finished the previous one – with $0.00 reportable net flows.
The first notable activity took place on Wednesday, which was somewhat surprising given the hotter-than-expected inflation data released that day, and the funds attracted just over $740,000. Investors changed their tune on Thursday, pulling $104,510 out. The first and only multi-million transaction took place on Friday, with the net flows jumping to $2.47 million.
Consequently, the five-day trading period ended in the red for the XRP ETFs, with $1.84 million in withdrawals. This made it the first red week since the one that ended on July 10. In other words, investors broke a 13-week green streak. The change in their appetite for XRP is more than evident, as just three weeks ago we were reporting major net inflows of over $75 million.

The past week was quite painful for the underlying asset as well, which was rejected at $1.40 and plummeted to $1.27, where it found some support over the weekend.
SOL ETFs Keep Bleeding
The Solana ETFs are in even worse shape, as they just closed their worst week ever in net outflows, with $25.52 million leaving the funds. As such, they beat the previous week’s anti-record of $24.81 million. What’s particularly worrisome is that the SOL ETFs have seen only one green day since September 29, and the inflows were quite modest at $1.30 million on October 2.
Meanwhile, the ETFs bled over $12.6 million on Friday alone, and the total net inflows have declined from $1.62 billion to $1.56 billion within two weeks.

These outflows have led to an apparent pullback in the underlying asset, which was rejected at $110 this week and dipped to $101-$102 on a couple of occasions. Although it has remained within three-digit territory, the overall landscape has worsened substantially over the past few weeks, and a dip below $100 might be just a matter of time.
The post Spot Ripple (XRP) ETFs Reach the End of an Era, Solana (SOL) Funds Can’t Catch a Break appeared first on CryptoPotato.