Cryptocurrency Posts
Crypto Briefing
The projected cash burn highlights potential financial strain on hyperscalers, influencing debt markets and AI infrastructure investments.
The post Morgan Stanley sees hyperscaler cash burn nearing $600 billion in 2027 appeared first on Crypto Briefing.
Investor resistance to Nscale's IPO valuation highlights broader market skepticism towards high valuations in the cooling AI sector.
The post Nscale meets investor resistance over its IPO valuation target appeared first on Crypto Briefing.
Reduced exchange transfers by mid-term Bitcoin holders may stabilize market volatility but highlight a lack of fresh buying demand.
The post Bitcoin mid-term holders slash exchange transfers to 4.4% from 40.4% in June appeared first on Crypto Briefing.
Skepticism towards AI in trading highlights the need for human oversight, emphasizing liability concerns and cautious tech integration in finance.
The post Charles Schwab CEO Rick Wurster is skeptical of AI agents trading stocks appeared first on Crypto Briefing.
Delays in US data center projects could hinder AI infrastructure growth, prompting potential moratoriums and impacting market dynamics.
The post US data center projects face significant delays, only 35% deemed credible: Bernstein appeared first on Crypto Briefing.
Bitcoin Magazine
Bitcoin Magazine

Poetic Justice: Scammer Lost $5M in Bitcoin After Being Targeted by Ledger Thieves
Call it poetic justice: one of the biggest victims of last week’s Ledger theft happened to be a scammer themself, according to blockchain analysts, and lost nearly $5 million in bitcoin.
In a post Thursday, Chainalysis wrote that a crook lost 60 bitcoins worth about $4.8 million they’d stolen via a so-called task scam.
According to Chainalysis, the address was linked with a con where people were paid to fake sales and reviews of real items. They were told to add their own money in order to get paid — and then stolen from.
But the mastermind behind the task scam moved the stolen money to Ledger addresses which were then targeted by different scammers last week.
“On Sep 22, the person behind the scam moved the proceeds into three separate Ledger addresses,” Chainalysis said. “On Oct 9, thieves emptied all three. One transfer each, into the same wallet. The wallet is reported as stolen funds.”
Paris-based Ledger last week said it had started an investigation after customers in South East Asia reported they’d lost funds after buying from Malaysia-based reseller, CryptoBilis.
Ledger has since said that the scam was a massive organized crime operation where a group installed implants into devices and put them back on the market. The implants could read users’ seed phrases so criminals could then drain wallets.
Calling it one the most “sophisticated attacks” the digital asset industry has experienced, Ledger is yet to reveal how much money has been lost — but blockchain investigator Specter said $86 million had been drained.
And the task scam conman, according to Chainalysis, was one of the victims.
Ledger has said that it is working with law enforcement to “follow the funds and dismantle the attackers’ infrastructure” and has made sure no other vendors have been targeted by scammers.
CryptoBilis has stopped selling Ledger products, the company said.
Criminals have targeted bitcoin hardware sellers this year, with a huge attack taking place in July on the popular Coldcard products.
Crooks were able to steal close to $120 million in bitcoin from Coldcard users because the devices had a firmware bug which led to faulty seed generation, allowing hackers to guess investor seedphrases.
This post Poetic Justice: Scammer Lost $5M in Bitcoin After Being Targeted by Ledger Thieves first appeared on Bitcoin Magazine and is written by Mathew Di Salvo.
Bitcoin Magazine

BFFS26 Denver: Joseph Kelly on Bitcoin Custody and Credit; Alan Lane on Banking Lessons
The Bitcoin for Financial Services Summit (BFFS26) returns to Denver October 20–22, 2026, bringing together CPAs, wealth advisors, attorneys, lenders, and finance leaders who are building Bitcoin into their practices. Now in its second year, the summit has grown to more than 30 sessions across two full program days, with a speaker lineup drawn from the firms defining Bitcoin custody, credit, and advisory.
Headlining the program are Joseph Kelly, CEO and co-founder of Unchained, who opens the summit with a keynote on custody, credit, and trust at scale; Alan Lane, former CEO of Silvergate Bank, on lessons for Bitcoin and banking; Patrick Lowry, CEO of Samara Asset Group, on holding Bitcoin as a public-company treasury reserve; and Colin Crossman, Wyoming’s Deputy Secretary of State, on the regulatory outlook for banks, exchanges, and advisors. Additional speakers include Kate Goldman of Anchorage Digital, Sam Baker of River, Eric Yakes of Epoch Ventures, Daniel Hillery of UTXO Management, Moish Peltz of Falcon Rappaport & Berkman, and CJ Konstantinos of Peoples Reserve.
Sessions focus on practical application: bringing Bitcoin into wealth planning and family offices, Bitcoin-backed lending and mortgages, treasury accounting and valuation, retirement and income planning, charitable giving strategies, mining as an asset class, and fiduciary duty when clients hold Bitcoin. Dedicated workshops will offer continuing education credit for financial advisors and CPAs.
“Last year proved that financial professionals want more than a Bitcoin primer. They want to know how to serve clients who already own it,” said Jordan Guess, CPA, co-host of the summit in a press release shared with Bitcoin Magazine. “This year’s program is built around the questions advisors and accountants are actually getting from clients, answered by the people building the infrastructure.”
The summit opens Tuesday, October 20, with the Better Money Invitational golf tournament at City Park Golf Course, hosted with Bitcoin Sports Network, followed by a welcome party at The Space sponsored by Falcon Rappaport & Berkman. Evening programming includes wine and whiskey tastings, and Thursday begins with an optional sunrise hike in the Rocky Mountains.
BFFS26 is co-hosted by Jordan Guess and Wyatt O’Rourke of BFFS Media, producers of the Bitcoin for Financial Services podcast. Sponsors include Unchained, Anchorage Digital, UTXO Management, River, SOUND HSA, SustainHash, and Stormrake.
Registration is open now at https://www.bffs.media/summit.
Media contact: Wyatt O’Rourke, wyatt@bffs.media
This post BFFS26 Denver: Joseph Kelly on Bitcoin Custody and Credit; Alan Lane on Banking Lessons first appeared on Bitcoin Magazine and is written by Juan Galt.
Bitcoin Magazine
Sazmining Now Sells Jack Dorsey’s Proto Immersion Hashboards
Bitcoin mining just got a lower barrier to entry.
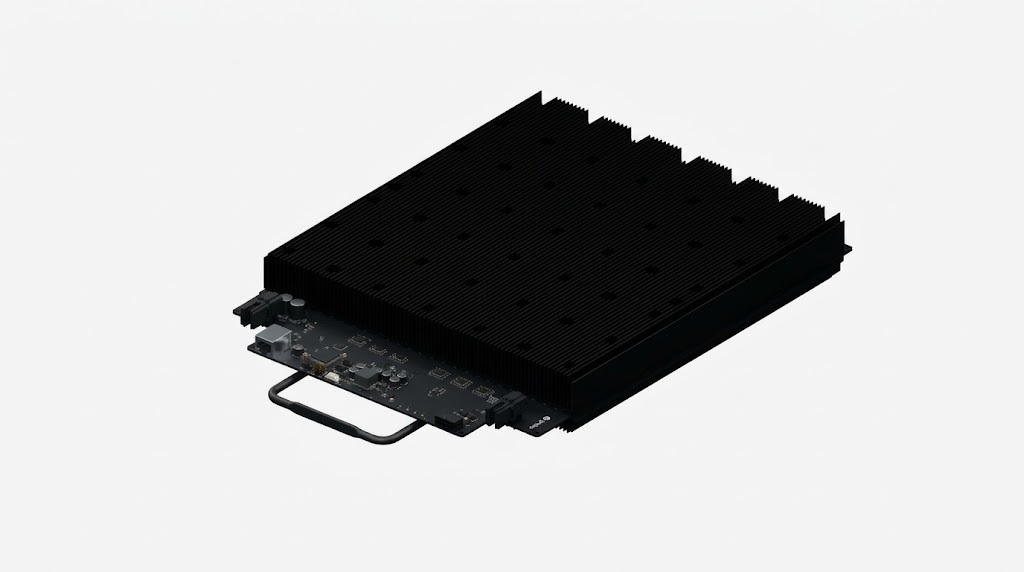
Sazmining announced Thursday that it is now selling Proto’s immersion hashboards directly to individual and institutional buyers through its mining-as-a-service platform. Previously, the hardware was mostly in the hands of large-scale operators.
Each hashboard delivers roughly 200 TH at around 15 J/TH, and buyers own them outright while Sazmining handles deployment, monitoring and maintenance at a US facility. Mining rewards go straight to the owner’s wallet.
The move follows a multi-megawatt supply deal between Sazmining and Proto — the bitcoin mining arm of Jack Dorsey’s Block (NYSE: XYZ) — which both companies expect to expand as demand grows.
“Because of our aligned-incentive model, Sazmining only earns when we produce bitcoin for our clients,” said Kent Halliburton, CEO and co-founder of Sazmining.
He also pitched mining as a form of bitcoin acquisition diversification: rather than paying the market price on the day of purchase, a miner’s costs are spread across the machine’s working life.
Wyoming-based Sazmining, founded in 2018, operates renewable-powered facilities across the US, Paraguay, and Norway. It says its fleet runs more than 20 percentage points ahead of the Bitcoin network’s carbon-free share.
Proto is Jack Dorsey’s Block’s bitcoin mining play. The Twitter founder has spent years arguing bitcoin is the foundation of “a more open financial system,” funding everything from Cash App’s buy-and-send rails to the Bitkey self-custody wallet, and he framed mining as the obvious missing piece back in 2021: “Bitcoin mining should be as easy as plugging a rig into a power source.”
Block formally announced it was building an open bitcoin mining system in January 2022, with the stated aim of making mining “more distributed and efficient.”
This post Sazmining Now Sells Jack Dorsey’s Proto Immersion Hashboards first appeared on Bitcoin Magazine and is written by Mathew Di Salvo.
Bitcoin Magazine

Hot Inflation Data Puts Bitcoin Under Pressure, but ‘Difficult’ Isn’t ‘Bearish’: CoinShares
Bitcoin’s price has dropped this week as new inflation data has come in hot.
But while the largest cryptocurrency’s near-term setup is difficult, it’s not “fundamentally bearish,” according to European asset manager CoinShares’ Head of Research, James Butterfill.
In a report Friday, the analyst said that bitcoin’s near-term challenge stems from a macro environment that’s caught in an awkward middle ground: inflation is too elevated for the Fed to ease up, while the economy is too resilient to force a policy pivot.
“Bitcoin and the broader digital asset market have moved lower on the resulting hawkish repricing, a reminder of how sensitive Bitcoin remains to monetary policy over short horizons,” he wrote.
Bitcoin’s price recently stood at $81,473, down 2% over a seven-day period.
The price of the leading cryptocurrency dropped Wednesday after data showed that U.S. consumer prices shot up more than expected in September.
Then, on Thursday, the Labor Department’s Bureau of Labor Statistics said that U.S. producer prices rose in September at the fastest pace in more than four years.
This has weighed on bitcoin’s price because higher inflation means the Federal Reserve may hike interest rates. Higher borrowing costs can restrict the liquidity the digital coin needs to rally.
The Federal Reserve hiked rates in September and will meet at the end of this month.
But Butterfill added that investors should be patient and advised investors to instead think in the long-term and not react to any single weekly data point.
“For investors, that argues for reading the coming weeks as a data-driven range rather than a trend, and for sizing digital asset exposure against a strategic allocation rather than against this week’s print,” he wrote.
Bitcoin spent the first half of 2026 in a bear market but had its best quarter in years after surging in August and September. Analysts have now said the leading cryptocurrency is now back in a bull market after trading above its 365-day moving average.
This post Hot Inflation Data Puts Bitcoin Under Pressure, but ‘Difficult’ Isn’t ‘Bearish’: CoinShares first appeared on Bitcoin Magazine and is written by Mathew Di Salvo.
Bitcoin Magazine

Deutsche Bank To Debut Bitcoin Custody Within Weeks: Report
German multinational Deutsche Bank is just weeks away from its crypto custody service, according to reports.
The lender — which is Germany’s biggest — also plans to expand the custody platform into Asia next year, according to a Friday Reuters report, which quoted its corporate banking chief.
Top banks worldwide are debuting or planning to debut crypto custody services, with BNY Mellon, State Street, Standard Chartered, U.S. Bank, and Citigroup all committing to direct crypto custody over the past 18 months.
JUST IN:
— Bitcoin Magazine (@BitcoinMagazine) October 16, 2026€732 billion Deutsche Bank to launch Bitcoin custody to its 28 million clients
pic.twitter.com/TAh9EwLkIX
Deutsche Bank first officially announced plans to debut a bitcoin custody service for European corporate and institutional clients in September, with the German multinational at the time saying service was subject to the completion of the applicable regulatory timeline.
Friday’s report added that the service will support custody of major cryptocurrencies such as bitcoin before moving to services that help clients move money into and out of stablecoins.
Gerald Podobnik, co-head of the corporate bank, was quoted by Reuters saying that the financial system will need to “offer tokenized or blockchain solutions.”
A number of top banks have started using the technology that powers bitcoin, the blockchain, for their own products in recent years.
Stablecoins and tokenization in particular have become a hot topic as traditional financial firms aim to accelerate certain services.
Crypto custody is often a starting point for banks moving into the digital asset space. BNY Mellon in 2022 became the first major U.S. bank to offer digital asset custody services.
Banks like Citi and Standard Chartered have this year debuted or announced plans for bitcoin custody around the world.
This post Deutsche Bank To Debut Bitcoin Custody Within Weeks: Report first appeared on Bitcoin Magazine and is written by Mathew Di Salvo.
CryptoSlate
NU7 would leave legacy funds issued but unspendable, even with intact keys, while the mainnet activation decision remains pending.
Read the full story on CryptoSlate
Understand the crypto stories that matter and what to watch next. Get The Catalyst in your inbox
The California agreement requires notice if Fidelity ends its retail transfer feature, while preserving security restrictions and IRA exclusions.
Read the full story on CryptoSlate
Understand the crypto stories that matter and what to watch next. Get The Catalyst in your inbox
The crypto industry has finally found a way to participate in America's partisan warfare without committing to either of the (only) two available parties: help elect people who agree with it about crypto, then let them argue about everything else. Fairshake's latest House spending plans cover 32 candidates, with 19 Republicans and 13 Democrats on…
Read the full story on CryptoSlate
Understand the crypto stories that matter and what to watch next. Get The Catalyst in your inbox
Two tracked Ethereum V3 Umbrella stakes fell 9.7%, while their implied annualized reward run rate stayed near $2 million.
Read the full story on CryptoSlate
Understand the crypto stories that matter and what to watch next. Get The Catalyst in your inbox
On October 17, JUST, the leading DeFi infrastructure in the TRON ecosystem, announced the completion of its fifth buyback and burn of its native token JST as scheduled. Over 170M JST were burned in this round (approx. 1.72% of total supply), backed by nearly $23.53M in capital deployed—all funded directly by JustLend DAO's net operating…
Read the full story on CryptoSlate
Understand the crypto stories that matter and what to watch next. Get The Catalyst in your inbox
CryptoTicker.io
The Solana blockchain pays out around 22.88 million new SOL a year. At $100.91 per token that is a good $2.31 billion of new supply, and it arises whether or not anybody buys. On the other side stand all the American Solana funds together, with cumulative net inflows of $1.56 billion since they launched. In twelve months the blockchain therefore delivers one and a half times what the ETFs have gathered in their entire history.
That calculation is the frame around every Solana forecast. Where the price can point over a horizon of months is set out in our Solana price prediction. The figures for this article come from our own query of the Solana mainnet nodes on Sunday evening, October 18, and they can be recalculated.
The emission in numbers: 62,677 new SOL every day
A query of the getInflationRate method at a mainnet node returns an inflation rate of 3.5969 percent for the current epoch, 1061. The getSupply method gives a total supply of 636,028,735 SOL, of which 589,437,970 SOL are in circulation and 46,590,765 SOL sit in non-circulating accounts. The inflation rate applies to the total supply, not to the float.
From that follows an annual emission of 22,877,199 SOL. Spread over 365 days that is 62,677 new SOL a day, or $6.32 million daily at Sunday evening's price. Measured against the market value of $59.47 billion, the annual emission amounts to 3.88 percent.
For comparison, the demand side as far as it can be quantified: according to figures compiled at 24/7 Wall St. on October 18, the American Solana spot ETFs carry cumulative net inflows of $1.56 billion. Their net assets stood at $1.62 billion on October 16, down from $1.96 billion on September 25. That is a decline of 17.6 percent in three weeks.
How Solana's inflation formula works
Solana has no fixed cap on the token supply the way Bitcoin does. Instead a fixed schedule runs: the emission started in 2021 at 8 percent a year and has since fallen annually by 15 percent of its own value, until it reaches a terminal rate of 1.5 percent. That mechanism is called disinflation. It is set out in the inflation schedule in the Solana documentation and has been unchanged since launch.
Disinflation means the quantity of new tokens keeps growing, only more slowly. At today's 3.5969 percent it will take until roughly 2032 under the current schedule for the 1.5 percent to be reached. Over that period the schedule produces more than 100 million further SOL.
The new tokens go entirely to the validators and to the depositors who stake with them. The foundation field of the query reads 0.0, so the foundation no longer receives a share. For holders who do not stake their SOL, that amounts to a quiet dilution at the full emission rate.
$1.56 billion across all ETFs, $449 million of it from the issuers
The cumulative inflows are not a pure measure of demand. An analysis of the launch phase identifies around $449.3 million as seed capital from the issuers themselves, that is money the fund providers put into their own products at launch so that the products are tradable. Subtract that and around $1.11 billion remains that came from investors.
Measured against that amount, the blockchain delivers 2.08 times as much in a single year. The funds would therefore have to more than double their investor demand to date just to absorb one year of emission.
Since October 5 the funds have recorded outflows in every trading session, $54.9 million in total through October 16. The largest single day was October 16 at $12.7 million. The last day of inflows was October 2.
The price on Sunday evening: $100.91, just above the daily low
SOL traded at $100.91 on Sunday evening, 3.03 percent below its level 24 hours earlier. The daily high was $104.60 and the daily low $100.49. The record of $293.31 is 65.6 percent away from the price.
The round $100 level is therefore within reach for the third time this week. In our Solana forecast of October 17 it was named, at a price of $103, as the level that decides; the price has given up 2.1 percent since then and the daily low was 42 cents above the level. It has held so far, but the distance has grown smaller.
What else has changed since October 17: the stablecoin supply on the Solana blockchain stood at $15.5 billion according to DeFiLlama figures from October 17, down from $17.45 billion at the September 25 high. That base is the fuel for trading on the blockchain, and it continues to shrink.

SIMD-0550 would double the disinflation
The SIMD-0550 proposal takes aim at exactly this emission. SIMD stands for Solana Improvement Document and is the procedure through which changes to the protocol are proposed and voted on. SIMD-0550 was submitted in early June 2026 by a developer at the infrastructure provider Helius who goes by the name lostintime101; Solana co-founder Anatoly Yakovenko has publicly backed the proposal. The discussion is running on the Solana Forum.
The core of it: the annual disinflation rate would be doubled from 15 to 30 percent. The terminal rate of 1.5 percent stays unchanged, it would simply be reached considerably earlier. According to the applicants' model, the path there shortens from about 5.7 years to 2.8. On the same calculation that removes around $1.5 billion of future emission at today's prices.
The price for it is stated in the submission itself: a model shown on the foundation's conference call in June estimates that around 30 validators would tip from profitable or break-even to unprofitable in the second or third year. Anyone running a small validator may therefore lose their basis.
Two failed attempts lie behind the proposal
SIMD-0550 is the third attempt. SIMD-0228 came to a vote in March 2025 and fell short with 61.4 percent approval; two thirds are required, that is 66.67 percent. SIMD-0411, also from Helius developers and submitted in November 2025, would have achieved the same goal and was withdrawn, according to the analysis by Chainflow, while the tooling for the vote was still missing.
Voting goes by stake weight. That means the validators with the most delegated SOL decide, and they decide on their own revenue. A proposal that cuts the emission also cuts the earnings of those voting. The failure of two attempts therefore has an obvious explanation, and it is the reason a third attempt is no formality. No date has been set for the vote on SIMD-0550.
5.23 percent nominal yield on 437 million SOL staked
The getVoteAccounts query at a mainnet node shows 668 active validators and 12 delinquent ones. Together they carry 437,350,803 SOL of activated stake. That is 74.20 percent of the float and 68.76 percent of the total supply.
Those three numbers give the nominal staking yield: the emission of 22,877,199 SOL is spread across 437,350,803 staked SOL, which is 5.23 percent a year before commission and before tax. That figure is nominal, not real. Anyone staking receives 5.23 percent more tokens and afterwards holds roughly the same share of the network as before. Anyone not staking loses share.
If SIMD-0550 passes, that yield falls correspondingly faster. With doubled disinflation it would be at around 2.2 percent within a few years, calculated with today's staking rate. Which providers in the German market offer staking and on what terms is shown in our comparison of staking platforms.
668 validators, 65 of them on full commission
The commission is the share of staking earnings the validator keeps for itself. The value is public in every validator's vote account and can be read out with the same query that returns the stake distribution.
The median commission among the 668 active validators is 5 percent. 65 of them, close to one in ten, take 100 percent: anyone delegating there receives nothing of the 5.23 percent. This is not fraud and sits openly in the data, but nobody sees it in the interfaces of many wallets, because the commission is not displayed there.
A second value from the same query: the five largest validators together hold 15.11 percent of the stake, and 18 validators are enough to make up one third of it. This Nakamoto coefficient of 18 is the number that counts when the question is how distributed the vote on SIMD-0550 actually is.
The tax on staking earnings and the holding period
For investors in Germany the position is this: on the tax authorities' line, staking earnings are other income and are taxable in the year they are received at the personal income tax rate, once the €256 annual threshold is exceeded. The market value at the moment of receipt is the value the tax office applies. At a nominal yield of 5.23 percent that threshold is already reached on a holding of around $5,700.
Separate from that stands the one-year holding period on the disposal gain on the SOL themselves. Where the announced reform of that period stands is something we track continuously on our page on the status of the crypto holding period reform. For documenting individual receipts with date and market value a tax tool makes sense, because the receipts arrive daily.
This paragraph is no substitute for tax advice. The treatment of staking earnings is in parts not yet conclusively settled, and it depends on your personal situation.
Our assessment of the emission
In the view of this desk, the emission is the underrated part of every Solana forecast. The evidence: $2.31 billion of new supply a year against $1.11 billion of investor money in all the ETFs across their entire life, plus outflows in every session since October 5 and a stablecoin base that has shrunk by $1.95 billion since September 25. As long as that is the position, a price rise needs demand from somewhere else, not from the funds.
What argues against it: the emission has been known and priced in since 2021, it is not news. Three quarters of the new tokens land with depositors who staked their tokens and therefore tend to hold rather than sell, and the staking rate of 74.20 percent is high. And the consensus switch to Alpenglow on October 21 lowers validators' costs, which could keep smaller operators viable even at a lower emission. This is an assessment of the situation, not a recommendation to buy or sell.
Solana emission: without SIMD-0550 it stays 22.9 million SOL a year
Three steps that can be dealt with today:
- Check your validator's commission. If it is 100 percent, you receive nothing of the 5.23 percent. The commission sits in the vote account and is not displayed in many wallets. Anyone staking through a provider will find the terms in the comparison of staking platforms.
- Record receipts with date and market value. Income tax applies from €256 of staking earnings a year, and what counts is the value on the day of receipt. The appropriate tools are listed in the comparison of tax tools.
- Weigh the fees when buying more. At an annual emission of 3.88 percent of market value, a purchase fee of one percent carries noticeable weight. The terms at the trading venues are set out in the exchange comparison.
(As of October 18, 2026. This article is not investment advice. Prices and fee structures change; check the terms with the provider before you buy.)
Monero costs around $592 on October 18, a good 8 percent above yesterday's level. What makes the day stand out is not the number on its own: while Monero gains, Zcash loses 3.7 percent, Dash is flat and Bitcoin and Ether slip slightly. The privacy coins that traded as one block for weeks are coming apart, and for holders in Germany more hangs on that than a single day's balance, because access to XMR at regulated venues is narrowing at the same time.
A privacy coin is a cryptocurrency that hides the sender, the recipient and the amount of a payment by default, instead of writing them openly into the blockchain as Bitcoin does. Monero has done this by default for years; Zcash offers it as an option. That technical difference is the lever European supervisors are pulling.
Monero at $592: the gap to Zcash in numbers
According to CoinGecko data, Monero stands at $592.46, up 8.14 percent within 24 hours. Over a week that is a gain of 10.48 percent, over 30 days 3.76 percent. Zcash sits at $1,084.23, 3.70 percent lower than the day before, down 13.86 percent over the week and 26.99 percent over the month. Dash, the third name the market likes to file in the same drawer, is down 18.53 percent over the month.
The comparison with the wider market looks similar. Bitcoin trades just under $81,000 and is down 3.33 percent over the week, Ether at $2,364 with minus 6.69 percent over seven days. Monero is the only one of the three well-known privacy names in positive territory on the day, and it manages that against a market that is giving ground.
One figure puts the proportions in place: Monero reaches a market value of $11.15 billion, which puts it 13th, while Zcash stands at $18.41 billion and 10th. Despite the weaker month, Zcash is therefore the larger asset; Monero's higher unit price says nothing about that. On trading volume the picture reverses: roughly $195 million changed hands in Monero within a day, against roughly $668 million in Zcash. The asset that is falling trades far more often than the one that is rising.
What has changed since the $558 high of October 17
On October 17 we reported on Monero after the software update to version 0.18.5.4 and named the $558 weekly high as the level on which the move would be decided. That level has since been cleared. During the day XMR stood at $607.68, and the daily low was $555.13: what was resistance then is the lower edge of the daily range today.
What has not happened in the same period: there is no protocol change and no mainnet date that would explain the jump. The mid-October update was a maintenance release. The rebuild of transaction verification that runs under the label FCMP++ has so far only been run on test networks; the developers have not named an activation date for the mainnet. Anyone explaining the rise with a technical event is explaining it with something that has not yet taken place.
The second difference from October 17 is Zcash. Back then both assets were moving in the same direction. Since that date ZEC has lost 13.86 percent and XMR has gained 10.48 percent. That is almost 24 percentage points of distance in seven days between two assets assigned to the same category.

Why Zcash and Monero are diverging: liquidity, not a shared narrative
There is a sober explanation for the spread, and it lies in tradability. Zcash remains widely available at large regulated exchanges and, since October, reachable through exchange-traded products. That ties the price to money which arrives quickly and leaves quickly: anyone entering through a fund or with leverage also exits, and that amplifies moves in both directions. Zcash's 26.99 percent monthly loss is the reverse side of the inflows that carried the asset before.
With Monero the opposite applies. It looks like strength but arises as a side effect. The fewer regulated venues that list XMR, the smaller the share of the holdings that can be sold at short notice. A small freely tradable float moves further upward on the same buying interest, and just as far downward under selling pressure. The gap to Zcash is therefore first of all a statement about market mechanics, not about the quality of the two protocols.
What a narrow market means for you in practice
A narrow market shows up in two places you can see directly in your portfolio. The spread between the buying and the selling price widens, and larger orders move the price themselves. At a daily turnover of $195 million that goes unnoticed on small amounts, but not on four-figure sums. Anyone selling into a market like that gets the price they saw on screen less often.
Anonymity coins in the EU anti-money-laundering regulation: Article 79 applies from July 10, 2027
The framework narrowing access to Monero in Europe is the EU anti-money-laundering regulation, Regulation (EU) 2024/1624. Its Article 79 prohibits credit institutions, financial institutions and crypto service providers from keeping accounts that allow holders to be anonymised; crypto assets with built-in anonymisation functions are named explicitly. Under Article 90 of the regulation, the provision applies from July 10, 2027.
What the rule covers, and what it does not
The addressee is the service provider, not the investor. The regulation bars a supervised company from holding or trading such assets for customers. It does not bar you from owning Monero privately, nor from self-custody in your own wallet. Anyone holding XMR therefore does not have to sell because a deadline expires in 2027. What falls away is the convenient route: custody with a provider authorised in the EU.
The effect sets in well before the cut-off date, and that is exactly what can be observed in 2026. Trading venues do not clear such assets from their offering on the day the rule takes effect, but long beforehand, because authorisation, review and product approval all need lead time. According to our own analysis of October 6, six large trading venues no longer list XMR for customers in Germany.
KuCoin closed XMR deposits on October 10
A current example of the friction in day-to-day use comes from KuCoin. In a notice dated October 10 the exchange closed Monero deposits for wallet maintenance. The notice states explicitly that withdrawals are not affected. It names no date for resumption.
This is neither expropriation nor a delisting, and the distinction matters: anyone with XMR sitting there can still withdraw it. But it is an example of the kind of disruption that becomes more frequent with an asset whose infrastructure is shrinking. Maintenance windows without an end date have occurred several times at Monero in recent years, and they always hit whoever wants to trade right now.
Where you can still trade XMR in Germany at all
For practical purposes that means the trading venue now decides more about whether your position is reachable than the price does. Three points count now. First, whether your provider still lists XMR for customers in Germany in spot trading at all, rather than merely showing it on a chart. Second, whether deposits and withdrawals in XMR are open, because the two are switched separately. Third, whether the provider holds authorisation under MiCA, because how it has to handle Article 79 depends on that. Which firms hold that authorisation is set out in our comparison of the best regulated crypto exchanges.

Self-custody of XMR: what a hardware wallet does and what it does not
Because the route through service providers is narrowing, the weight shifts towards custody of your own. A hardware wallet is a device that generates the private key and never releases it; a transaction is signed on the device and the computer never sees the key. For Monero it is the only route that stays independent of a provider's authorisation questions. Supported devices and the differences between them are set out in our hardware wallet comparison.
Two limits come with it. Self-custody shifts the risk, it does not remove it: anyone who loses the recovery phrase loses the holding for good, and nobody can retrieve it. And it does not solve the trading problem. In the end you have to sell where a buyer sits, which means at a trading venue again: your own wallet secures ownership, not the exit.
Holding period: when the tax office leaves XMR gains untaxed
For tax purposes Monero counts in Germany as another asset within the meaning of section 23 of the Income Tax Act, like other crypto assets. From that follows the rule that moves the most money on a day with an 8 percent gain: anyone who holds for more than a year and then sells pays no income tax on the gain. Anyone selling inside the year pays tax on the gain at their personal rate, provided the total of all private disposal gains for the year reaches the €1,000 threshold.
The practical catch with an asset like Monero lies in the documentation. The holding period is measured per acquisition, and anyone who bought across several years and several trading venues, some of which no longer list XMR today, has to produce the acquisition data themselves. Export your history while you still have access to the account, not once the provider has withdrawn the offering.
Our assessment: the gap holds as long as Zcash lacks inflows
In the view of this desk, Monero's lead on the day is real but poorly secured. The numbers support it: plus 10.48 percent over seven days against minus 13.86 percent at Zcash, and that in a market where Bitcoin and Ether are giving ground. What argues against it is where the lead comes from. It does not rest on a documented event at Monero, no protocol date, no authorisation decision, no new infrastructure, but substantially on the freely tradable float having grown smaller. That is the same mechanism which amplifies a move downward just as much.
What follows from that: a narrow market is not a verdict on quality. The $607.68 of the daily high is around 24 percent away from the record Monero reached on January 14, 2026 at $797.73. Reachability in 2027 will be decided by Article 79 in any case, not by a chart level. No buy recommendation can be derived from this, and a total loss is possible with any crypto asset.
What would close the gap again
Two developments would be solid signals, and both are verifiable rather than merely plausible. The first is a return of inflows at Zcash through the exchange-traded products that launched in October; ZEC would then have the buyer base Monero lacks. The second is a decision by a trading venue authorised in the EU to keep listing XMR before 2027, or to list it again: that would be the only piece of news that would actually widen the narrow market at Monero. An activation date for FCMP++ on the mainnet would come as a further signal, but the developers have not named one to this day.
Monero at $592: without inflows it stays an interim reading
- Check today whether your trading venue still lists XMR in spot trading for customers in Germany and whether deposits and withdrawals are open. Anyone who has to switch will find the authorised firms in our comparison of the best regulated crypto exchanges.
- Decide which part of your holding belongs in your own custody before access closes at a provider. The differences between devices are set out in the hardware wallet comparison.
- Export your purchase history for every acquisition while the account is still open, so that the one-year period under section 23 of the Income Tax Act remains documented. Tools for that are shown in our overview of crypto tax software.
(As of October 18, 2026. This article is not investment advice. Prices and fee structures change; check the terms with the provider before you buy.)
Of every Shiba Inu token that can ever exist, 99.96 percent is already in circulation. That is the single most important figure on the supply side, and it means one thing: Shiba Inu has no block of locked tokens waiting to drop into the market. Anyone holding SHIB carries no dilution risk. What they do carry is demand risk, and all of it.
The price stood at $0.00000489 on Sunday evening, or €0.00000436. That is 2.17 percent lower over 24 hours, 11.47 percent over seven days and 10.22 percent over thirty days. Market capitalisation is $2.88 billion, rank 37 among all cryptocurrencies. Every figure in this paragraph comes from the CoinGecko market database.
99.96 percent in circulation: the supply side at Shiba Inu
Total supply is 589.50 trillion SHIB. Of that, 589.24 trillion circulates. The difference is 257.44 billion tokens not yet in circulation. That sounds enormous until you convert it into money: at the current price those 257.44 billion SHIB are worth $1.26 million in total. Daily turnover is $36.05 million. The entire outstanding supply therefore amounts to a little over three percent of a single trading day.
In practice that means this: even if every token still outside circulation hit the market tomorrow at once, the order book would barely register it. In crypto that position is the exception, not the rule.
What a circulating supply ratio actually says
The circulating supply ratio is the share of tokens that are tradable, measured against every token that exists. The figure behind it is total supply, and it includes everything locked in contracts, held in escrow or released later on a fixed schedule.
The difference between the two numbers is the part of the supply still ahead of the market. The larger it is, the more new sellers can appear without a single holder changing their mind. Analysts call this dilution: the price has to attract more capital simply to stay where it is.

XRP at 63 percent, Chainlink at 77: the gap in numbers
How unusual the Shiba Inu figure is becomes clear from a look at other large tokens. All values were retrieved from CoinGecko on Sunday evening and refer to circulating supply against total supply:
- Shiba Inu: 99.96 percent in circulation, 257.44 billion SHIB outstanding, worth $1.26 million.
- Dogecoin: 99.99 percent, 18.49 million DOGE outstanding, worth $1.43 million.
- Solana: 92.68 percent, 46.59 million SOL outstanding, worth $4.75 billion.
- Chainlink: 76.69 percent, 233.15 million LINK outstanding, worth $2.74 billion.
- XRP: 63.14 percent, 36.86 billion XRP outstanding, worth $46.81 billion.
The gap is not a matter of degree but of kind. At XRP, tokens worth $46.81 billion sit outside circulation, more than sixteen times the entire Shiba Inu market capitalisation. Part of that is released monthly on a fixed schedule. Shiba Inu has nothing comparable, because there never was a release schedule: the supply was created in one go in 2020.
Anyone who wants to check this before buying will find both numbers side by side on any market data page, usually as circulating supply and total supply. The ratio takes ten seconds to work out and says more about the risk of the coming months than any chart line. Which venues list a given token and what trading costs there are set out in our overview of the best crypto exchanges.
Vesting and cliffs: why token unlocks weigh on the price
A release schedule, known in the trade as vesting, distributes tokens to founders, investors and foundations in stages over time. A cliff is the lock-up period before that: nothing moves before the cut-off date, and afterwards a block comes free at once. Serious projects set out both in their documentation, and both are known months in advance.
The mechanism works in two steps. First the tradable supply rises without demand growing with it. Then some recipients sell, because for them the tokens are salary or repayment, not an investment. How sharply the price reacts depends on the size of the released amount relative to daily turnover. An unlock worth half a day of turnover is noticeable; one worth several days of turnover moves the price.
That is precisely the risk Shiba Inu does not have. It is the one point where a meme coin with no company and no funding round is structurally better placed than a fully financed protocol.
41 percent has been burned, the rest barely moves
At launch in 2020 there was one quadrillion SHIB, that is 1,000 trillion. Today total supply stands at 589.50 trillion. That makes 410.50 trillion tokens burned, or 41.05 percent of the original supply. The figure follows directly from the difference and can be traced on the public counter at Shibburn.
Most of it came from a single event: in May 2021 Vitalik Buterin destroyed roughly 410 trillion SHIB that the project had sent him unasked. What has been burned continuously since then runs in the order of a few million to a few billion tokens a day. Against 589.24 trillion in circulation, that changes the supply in the fourth or fifth decimal place.

For context, that means the burn is not a price driver and has not been one since 2021. It keeps the supply stable but does not make it scarce. Anyone waiting for scarcity is waiting for a process that would arithmetically take decades.
Shibarium: 659 transactions a day, the lowest level since September 20
The supply side is one half. The other is the question of what the tokens are needed for. Shibarium, the project's second layer, most recently processed 659 transactions in a day, according to an analysis by U.Today. That is the lowest reading since September 20, 2026.
A second layer is a blockchain of its own that bundles transactions and settles them collectively on the main blockchain. Its purpose is to cut fees and create throughput. Neither helps unless somebody uses it. 659 transactions a day is an order of magnitude a single active user can generate in an hour.
Taken together, the two findings give the picture that matters: nothing threatens from the supply side, and nothing is coming from the usage side. That leaves the price hanging on a single factor, demand from outside.
What has happened since October 17
On Friday we wrote here about the fifth anniversary of the record price, which falls on October 27. SHIB stood at around $0.00000500 at the time. Since then it has been $0.00000489, a fall of a good two percent. Sunday's daily low was $0.00000488 and the daily high $0.00000502.
The level that has held over these two days is $0.00000488. That value matches the daily low and sits around 2.8 percent below the daily high. Beyond that nothing in the picture has shifted: the distance to the record of $0.00008616 set on October 27, 2021 is still 94.3 percent.
Holding period and loss offsetting: the tax framework in Germany
For investors in Germany the supply position has one concrete consequence. If no release date moves the price, there is no date on which a sale has to be timed either. That makes the holding period the only calendar that counts.
Under section 23 of the German Income Tax Act, gains on the sale of cryptocurrencies are tax-free if more than a year lies between purchase and sale. Below that the personal tax rate applies, and an exemption threshold of €1,000 a year covers all private disposals taken together. Threshold means exactly that: one euro above it makes the entire amount taxable, not just the excess.
Losses from such transactions can only be set against gains in the same category, not against interest, dividends or employment income. Anyone holding SHIB at a loss since the start of the year who sells inside the twelve-month window can therefore set that loss against gains from other crypto sales in the same year. Which tools assign acquisition dates cleanly on a FIFO basis is shown in our overview of crypto tax software and portfolio trackers.
Our assessment: no dilution risk is no substitute for demand
In the view of this desk, a circulating ratio of 99.96 percent is a real but limited advantage. It is real because it rules out a risk that remains in place at XRP with 36.86 billion outstanding tokens and at Chainlink with 233.15 million. It is limited because an absent risk does not create demand.
The evidence against lies in the same set of numbers: 659 transactions a day on Shibarium, daily turnover of $36.05 million against a market capitalisation of $2.88 billion, which is a turnover rate of 1.25 percent, and minus 50.53 percent over twelve months. A supply that is not growing will not hold the price up if demand shrinks faster. That is exactly what has been happening for twelve months.
We are assessing the situation here, not the investment: Shiba Inu remains a meme coin without cash flows, and a total loss is possible in this asset class.
Shiba Inu without an unlock calendar: the price rests on demand alone
Three things follow from the supply position:
- Work out the ratio yourself. Circulating supply and total supply sit side by side for every token. If the ratio is below 80 percent, the release schedule belongs on the reading list before the purchase. Where each token can be traded and at what fees is set out in our overview of the best perp DEXs for derivatives trading.
- Match custody to the holding period. Anyone planning to hold for a year does not need minute-by-minute access. For holdings meant to sit still, hardware devices are the safer place; the models are listed in our hardware wallet comparison.
- Watch the demand side, not the burn. What counts are transactions on Shibarium and daily turnover, not the amount burned each day. 659 transactions is the reading that matters now.
(As of October 18, 2026. This article is not investment advice. Prices and fee structures change; check the terms with the provider before you buy.)
Quant Fusion is what is known as a multi-ledger rollup: a settlement layer that connects several blockchains at once instead of running on a single one. It has been on mainnet since June 2, 2026, and Quant Network states that it links 74 blockchain networks in one shared environment. The heart of the matter is not the number but a promise: a token that today sits in seven copies on seven blockchains is meant to appear in this environment as a single value with a single liquidity pool.
This piece explains what works under the Quant Fusion rollup technically, how it differs from an ordinary rollup, what role the QNT token plays in it and which claims are documented. For what Quant is in the first place and what banks use the network for, see our overview of Quant, QNT and Overledger. This goes one level deeper.
Quant Fusion is a multi-ledger rollup, not a second layer 2
A classic rollup bundles transactions off a blockchain, nets them and writes the result back to that one blockchain. Arbitrum and Optimism work that way, and both hang off Ethereum. A multi-ledger rollup is meant to do the same for several blockchains at once: it executes transactions in an environment of its own and anchors the results in several connected networks.
Gilbert Verdian, the founder of Quant Network, announced the launch on X with a sentence that sums up the intention well: “Today we go live on mainnet with the Fusion Rollup, the world’s first multi-ledger rollup, connecting 74 blockchain networks in one unified environment, built for institutions.” The phrase “world’s first” is the company’s own presentation, not an independently verified fact. What is documented is the launch date and that the infrastructure is running.
Quant itself avoids the term layer 2 for Fusion and speaks of a category of infrastructure of its own. That is not pedantry: a layer 2 derives its security from exactly one base blockchain. Fusion does not have that single base, because it deliberately does not want one.
Before Fusion, institutions had two unsatisfactory routes: one blockchain or many bridges
The problem Quant describes is familiar to anyone holding tokens across several networks. It is not a problem of technology but of fragmentation. Verdian puts it this way in the same announcement: “For years, institutions had two bad options: bet everything on a single chain, or stitch together insecure bridges across many.” The first route leaves a bank’s clients and counterparties sitting on other networks; the second brings bridges into the picture.
A bridge is a link between two blockchains that locks a token on one side and issues a packaged representation of it, a wrapped token, on the other. That construction has been attackers’ favourite target for years, because the locked holdings sit in one place and the counterpart is only as safe as the contract issuing it. For a regulated institution a second problem comes on top: it has to be able to explain to its supervisor where an asset legally sits. With a wrapped representation on someone else’s blockchain, that question is uncomfortable.
Fusion is meant to make both routes unnecessary. Quant describes the moving of value, the settlement and the exchange of messages between networks as built firmly into the rollup instead of running over bridges. How robust that is in practice cannot be judged from outside yet, because there are no independent technical audit reports on it.

Unified assets: seven USDC copies become one uUSDC with a single liquidity pool
The part of Fusion that goes furthest beyond the usual interoperability is called unified assets. A unified asset is the representation of the same token across several blockchains as a single value inside the rollup. Quant names two examples: the stablecoin USDC, which today sits in copies on several networks, becomes uUSDC in the rollup. Holding USDC across two networks has so far meant two balances that know nothing of each other. BlackRock’s tokenised money market fund BUIDL becomes uBUIDL.
Why that counts becomes clear from liquidity. If a stablecoin sits in seven copies on seven blockchains, there are also seven separate liquidity pools. Moving a larger sum means moving it in the one pool where it happens to sit, at a worse price than pooled liquidity would give. That fragmentation is an annoyance for retail investors and a real cost factor for institutional volumes.
What matters for understanding it is what does not happen: the original token does not travel. On Quant’s account, every component stays anchored to its home blockchain and can be withdrawn at any time. The unified asset is therefore more a shared set of books over distributed holdings than a new token issued somewhere. That is precisely the difference from a wrapped token.
OP Stack and Hyperledger Besu: what works under the rollup technically
According to the technical description reproduced in trade coverage of the launch, Fusion is an optimistic rollup whose software builds on the OP Stack. Optimistic in this context means the system first assumes the submitted transactions are correct and allows a window in which someone can prove an error. That is the same basic idea working under Optimism and Base.
The difference sits beneath it. On that account the transaction data is not stored on a public blockchain but on a permissioned Hyperledger Besu network. Hyperledger Besu is Ethereum software that can also be run in closed networks where only approved participants may write. The state roots, meaning the cryptographic summaries of the respective system state, are returned to the connected layer 1 networks.
For banks that is the decisive property, and for part of the crypto scene the sore point. A permissioned data network means the data does not sit publicly on a blockchain that anyone can check. That meets confidentiality and jurisdiction requirements a public network does not meet. But it also shifts trust from mathematics back to the operators. Quant describes smart contracts with confidentiality protection, nodes with identity checks and access rules with which it can be set who may take part under which legal regime.
That design also explains why Quant builds the technology for institutions and not for the open market. A bank may only move client money through systems its compliance department can sign off, and that includes the question of who runs a node and which supervisor it answers to. An open network in which anyone can take part anonymously fails that requirement regardless of its technical quality. The compliance functions are therefore not an accessory but the actual reason to buy. Yet that is also where usage is decided: the stricter the admission rules, the smaller the circle of possible participants, and the longer it takes for noticeable volume to build.
Layer 2.5: why Quant places the rollup between blockchain and application
For its own position Quant has coined the term layer 2.5. What is meant is a layer that sits above the individual blockchains but below the applications. A layer 1 is the base blockchain, Ethereum for instance. A layer 2 relieves exactly one such base. An application layer sits above all of it and talks to the whole lot.
Fusion wants to stand in between and serve several layer 1 networks at once. Whether that term catches on is open; for now it is a provider’s self-description. Factually, though, it describes a genuine peculiarity, because a component that anchors its settlement back into several independent networks fits none of the established boxes. How Quant’s approach differs from other providers’ is in our comparison of Quant and Chainlink; both solve the same task by different means, and Chainlink’s price development is often read by investors as a gauge of the same bet.
The Trusted Node Program and the role of the QNT token
Further networks, public as well as private, are to be added through the Trusted Node Program, according to Quant. A trusted node is a node whose operator has been vetted and which takes part in processing transactions. For investors, the interesting question about it is where the QNT token comes in.
According to reports on the programme, node operators deposit QNT in order to take part in transaction processing. At the same time, overviews of Quant’s roadmap still list general QNT staking as an item without a fixed date. Those two statements cannot be reconciled cleanly from outside, which is why no clear picture is drawn here on purpose: that QNT has a function in the Trusted Node Program is described. To what extent that is already running, and how many tokens are actually locked for it, is not documented. If you read a figure on this, ask for the source.
The older, well-documented function of the token is a different one: commercial use of Overledger carries a licence fee that is settled in QNT. That construction has existed since late 2021 and is the actual reason the token has a job in the system at all.

Overledger connects, Fusion settles: two layers with two jobs
Overledger and Fusion are often lumped together, but they are two different things. Overledger is the older layer and at its core a universal connector: an application docks onto Overledger once and reaches several blockchains through it, without having to program a separate connection for each. That is integration work and saves companies effort.
Fusion is the newer layer and takes on something else, namely execution and settlement itself. One image for it: Overledger is the wiring through which all networks can be reached. Fusion is the place where the business is actually settled. For the commercial side of tokenised deposits, see our piece on Quant and tokenised deposits.
What is documented about the 74 networks and what Quant leaves open
The number 74 appears in every report on the mainnet launch, and in every one of those reports it comes from Quant itself. Gilbert Verdian too names no breakdown of the networks in his announcement, only the total. The company has not published a complete list of the connected networks, which trade coverage pointed out explicitly. The company’s presentation mentions public networks such as Ethereum alongside permissioned systems of the kind in use inside banks.
That is not an accusation but a piece of context that counts for any assessment. A technical connection is not the same as usage. A network can be connected in the sense of the count without a single piece of business ever having been settled over that connection. It is precisely on that distinction that it will be decided whether Fusion becomes infrastructure for real volume or remains a well-built facility waiting for customers. Trade press at the launch asked the same question: whether large banks will move from testing to live operation.
QNT in the market: rank 38 and the open question about revenue
On Sunday midday QNT was quoted at around $198, or roughly 176 euros, almost three percent below the previous day. Market capitalisation stood at about $2.9 billion, which corresponds to rank 38 among all cryptocurrencies. The price is far from its September 2021 peak of a good $427. The circulating supply is around 14.6 million tokens and therefore very close to the maximum the protocol provides for; hardly any new tokens are being added, which makes the supply side highly predictable.
The question that matters for investors cannot be answered from those figures, and it reads: does the revenue banks generate over this infrastructure actually flow through the QNT token? The licence fee for Overledger in QNT is documented. What is not documented is that every transaction settled over Fusion creates demand for the token. Buying QNT means buying a bet on that connection, not on the technology alone. Where the token can be traded in Germany, and which venues hold a licence under the European crypto regulation MiCA, can be looked up in our crypto exchange comparison.
uBUIDL and tokenised funds are the real test
That Quant names BUIDL of all things as an example is no coincidence. Tokenised money market funds are the segment in which institutional money is currently moving onto blockchains fastest, and they suffer particularly from fragmentation: a fund unit sitting on five networks means five sets of books for a custodian.
If a unified asset reduces that bookkeeping to one without the unit losing its legal anchoring, that has a measurable value for custodians and fund companies. It is the part of the promise most likely to find customers, and at the same time the part where it will show fastest whether the technology holds. A custodian running tokenised fund units over a third party’s settlement layer has to be able to explain that to its own supervisor.
The proof Fusion has to deliver before the clearing house start in 2027
Quant says it is working with the US payments body The Clearing House on tokenised deposits, with a start in the first half of 2027. That is the date on which the technology has to prove itself publicly, and until then there are three things by which progress can be read without having to believe the announcements.
First, a published list of the connected networks, or at least an independent check of the number. Second, a named user in live operation rather than a pilot project, meaning an institution that says it actually settles over Fusion. Third, a verifiable figure for how much QNT is locked in the Trusted Node Program. If none of those three pieces of evidence arrives, Fusion remains what it demonstrably is today: a running facility with a strong blueprint behind it.
Quant Fusion: without bank volume the rollup stays a blueprint
For investors in Germany a sober order of business follows from that. The technology is real and has been in operation since June 2026. The economic benefit for the token is not yet. Three steps make sense now:
- Clarify the venue and its licence. Check which provider lets you trade QNT at all and whether it is licensed in the EU. Our comparison of regulated crypto exchanges shows which providers hold a MiCA licence.
- Factor in the holding period and tax from the start. In Germany the gain from a sale stays tax-free after a holding period of one year; below that it counts as a private disposal. Holding over several years calls for clean records of the purchase dates; the tools for that are in our comparison of tax software and portfolio trackers.
- Keep the three pieces of evidence in view. The network list, a named user in live operation, the locked QNT amount. For tracking metrics on an ongoing basis, the tools from our comparison of analytics platforms are suitable.
And through all of it one thing holds: QNT is a bet on an institutional rollout that is still outstanding. A total loss is possible with any crypto token, including one with a banking mandate.
Further evidence on the launch is in Quant Network’s announcement and in DisruptionBanking’s assessment.
(As of October 18, 2026. This article is not investment advice. Prices and fee structures change; check the terms with the provider before you buy.)
Bitcoin trades at $81,017 on Sunday evening, and the weekend’s most important number is not in the chart but in the protocol itself: since October 16 the network has demanded 5.92 percent more computing work for the same block. Mining difficulty climbed with block 971,712 to 140.58 trillion, its highest level since March 5. At the same time the price has fallen from $84,506 to $81,017 since the previous adjustment on October 3. More effort, less revenue: for miners that is the squeeze which ultimately decides how much they have to sell.
Difficulty is the Bitcoin network’s automatic adjustment screw. Every 2,016 blocks, roughly every two weeks, the protocol measures how quickly the past blocks were found and resets the difficulty so that a block is produced every ten minutes on average. For the longer-term view of where the price can head over a horizon of months, see our Bitcoin price prediction. For the next two weeks, though, what counts is the miners’ short-term arithmetic, and that shifted noticeably on October 16.
Bitcoin at $81,017: what the price board shows right now
The price stood at $81,017 on Sunday evening, down 0.24 percent within 24 hours (source: CoinGecko, as of October 18). The daily range ran from $80,823 to $82,178, so less than 1.7 percent between high and low. That makes Sunday the weakest day of the week: the seven-day high was $83,115.
Set against the quarter it looks different. The 30-day high stands at $86,597, the low of the past 90 days at $62,773. The price is 35.7 percent away from the all-time high of $126,080 set on October 6, 2025. So the market has been moving for weeks in a band that carries neither panic nor euphoria, and it is precisely in such phases that the miners’ cost side becomes a price factor in its own right.
What has happened since our article of October 17
Yesterday this slot focused on the October 30 options expiry, in which contracts worth $12.2 billion run out. You can read that in our piece on the options expiry of October 30. Since then the price has moved from $81,524 to $81,017, a fall of $507 or 0.62 percent.
More important than the $507 is which line gave way. The average of the past 50 daily closes sits at $81,382, our own calculation from the CoinGecko daily data. Yesterday Bitcoin was still above that line, today it is $365 below it. That is no slump, but it is the week’s first close below a level that short-term traders orient themselves by. What is new is the cost side, on which there was nothing to say yesterday: the October 16 adjustment has only been fully felt in mining operations’ books since the weekend.
How a mining operation does the maths since October 16
The mechanism behind the difficulty jump takes three sentences. A mining operation sells nothing but computing power; its revenue depends on what share it holds of the network’s total computing power and on what a Bitcoin is worth. When difficulty rises, so does the total computing power needed to find a block, and each individual operation’s share of the daily payout falls. The electricity bill stays the same, because the machines keep running.
The network pays out 3.125 Bitcoin per block, so 450 Bitcoin a day at the targeted 144 blocks, transaction fees aside. At the October 3 price that was $38.03 million a day, at Sunday’s price it is $36.46 million. The computing power sharing that money has risen over the same period from around 950 to 1,006 exahash per second, derived from the difficulty.

The hashprice falls to $36.23 per petahash per day
The industry rolls both figures into one metric: the hashprice. It says what one petahash per second of computing power earns per day, and is therefore the revenue per machine deployed. We calculated it ourselves from the difficulty values on mempool.space and the CoinGecko prices, excluding transaction fees and operating costs.
On October 3 the hashprice was $40.03 per petahash per day. On October 18 it is $36.23. That is 9.5 percent less in a little over two weeks, and the decline splits almost exactly in half: 4.1 percent comes from the price, the rest from the higher difficulty. An operator running electricity costs close to the break-even point therefore loses almost a tenth of its income in two weeks without anything changing in its hardware.
That is the figure that matters for the price. Mining operations cover their running costs in euros and dollars, while their income arrives in Bitcoin. When the hashprice falls, a larger share of the mined amount has to be sold immediately instead of moving onto the balance sheet. That selling lands on the same exchanges where the rest of the market trades.
Hashrate has been falling since the jump
That very reaction is already visible in the network data. The 30-day average of computing power sits at 1,019 exahash per second. The daily readings of the past week paint a different picture, however: from 1,084 exahash the figure fell to 943 exahash most recently, a drop of 13.0 percent (source: mempool.space, retrieved October 18).
Part of that is noise, because daily hashrate readings are estimated from the number of blocks found and fluctuate by a few percent even at constant output. The rest is switch-offs: operations whose power price no longer works at a hashprice of $36 are taking machines off the network. That also shows in the current period’s average block time of 9 minutes and 59 seconds, marginally above the target.
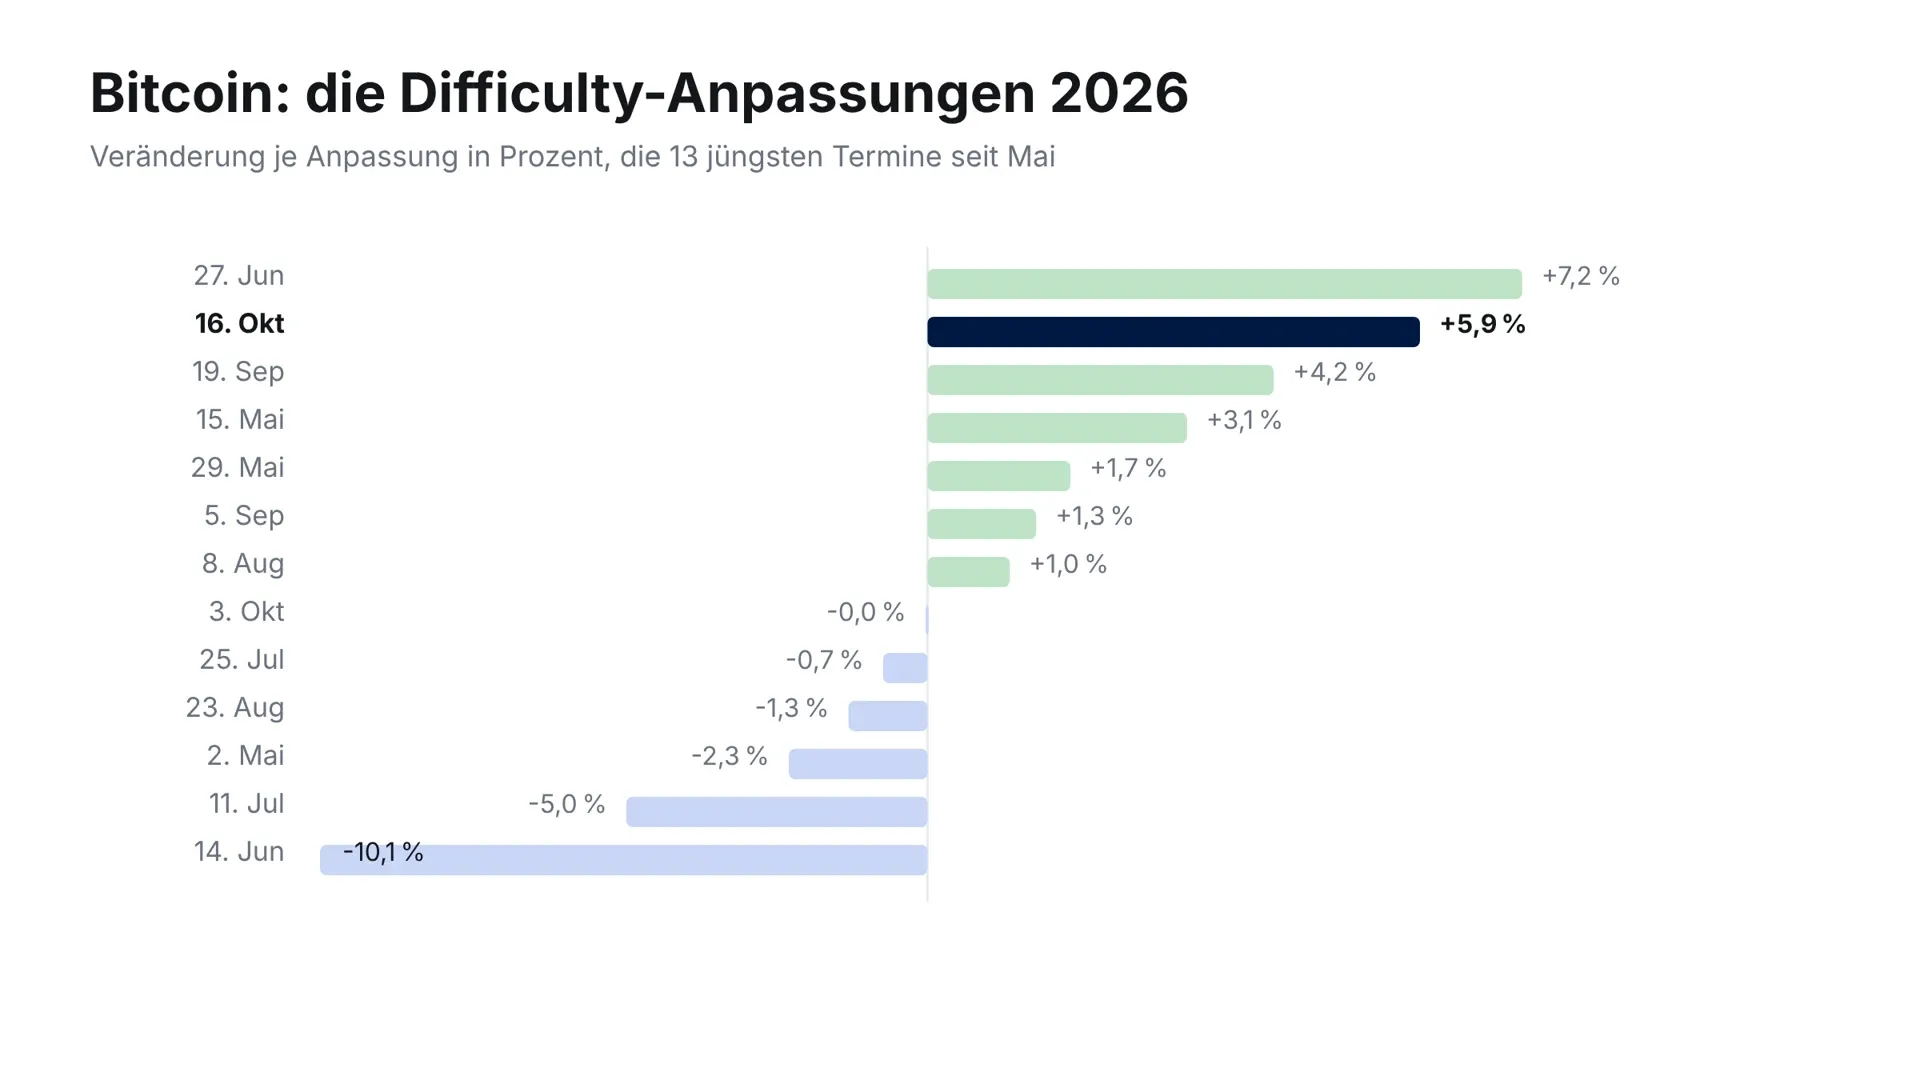
October 16 was the year’s second-largest step up
A look at the 13 most recent adjustments puts the 5.92 percent in context. Only June 27 was bigger in 2026, at 7.15 percent. Then come September 19 with 4.16 percent and May 15 with 3.12 percent (long-run series: blockchain.com). At the other end of the series sits June 14 with minus 10.09 percent, followed by July 11 with minus 5.00 percent.
The immediate predecessor is notable: on October 3 the adjustment came to minus 0.03 percent, practically zero. Within two weeks, then, the network tipped from standstill to the year’s second-largest increase. Such jumps arise when new computing capacity ordered and built over months comes online, and they hit the market regardless of where the price happens to stand.
The next adjustment is due on October 30
The coming adjustment falls at block 973,728. At the current block pace some 1,703 blocks are still missing, and the period is a good 15 percent through. As things stand that points to October 30, and the estimate is minus 0.45 percent. The estimate is no promise, because the network recalculates it with every block, and it shifts as soon as operations switch off or back on at scale.
The date is interesting all the same, because it coincides with the options expiry we wrote about yesterday. Two dates that can both cause short-term movement thus fall on the same day. The difficulty adjustment works on the supply side, the expiry on traders’ positioning.

The levels: $81,382 above, $80,823 below
Three levels can be justified for the coming days, and each has an origin rather than being a line on a chart.
$81,382. The average of the past 50 daily closes. The price sits $365 below it. As long as it stays below, every recovery attempt has this line above it as the first resistance. A daily close above turns the relationship around.
$80,823. Sunday’s daily low and therefore the immediate floor. If it breaks, the next reference is the area around $78,000, where the price turned several times in early October.
$83,115. The seven-day high. Only above it does the sideways move become an upward move again, and only then does selling pressure from the mining sector lose weight, because the hashprice rises with the price.
The span between floor and ceiling thus comes to just under 2.9 percent. For a week that is narrow, and narrow ranges tend to resolve in the direction of the first larger sale.
Our assessment: the selling pressure is real but limited
In the editorial team’s view the difficulty jump is a genuine drag for the coming two weeks, but no reason for a new price picture. The numbers support that: a 9.5 percent fall in the hashprice forces operations at the margin of profitability to sell, and the 13 percent less computing power in the daily readings shows that some have already taken that step. The daily payout of 450 Bitcoin amounts to only $36.46 million at $81,017, however, and measured against a market capitalisation of $1.63 trillion that is a small sum.
The mechanics also argue against it: if operations switch off, computing power falls, and the next adjustment comes out correspondingly lower. The estimated minus 0.45 percent for October 30 is exactly that counterbalance in figures. The network corrects its own overheating, and does so within twelve days. Deriving a months-long downward forecast from the difficulty jump overstretches a metric designed for two weeks. Bitcoin remains an asset carrying the risk of total loss, and none of these figures is a buy or sell recommendation.
What hangs on a top-up purchase in Germany
For investors in Germany a sideways phase has a side effect that has nothing to do with the chart. Every additional purchase starts its own one-year holding period for exactly that amount. If you top up today at $81,017, you can only sell that tranche tax-free from October 18, 2027; earlier holdings are unaffected, but the tax authorities generally allocate them on a first in, first out basis. We track the current state of the political debate about the deadline on an ongoing basis at crypto holding period: reform and status.
In practice that means a purchase decision in this phase is also a decision about a cut-off date in October 2027. Buying regularly in fixed instalments creates a corresponding number of deadlines side by side, which makes the bookkeeping more laborious but smooths the entry price. Which providers offer a savings plan on Bitcoin, and at what fees, is in our overview of buying Bitcoin with a savings plan.
The fee side stays cheap for investors
One development argues for moving coins on the blockchain in this situation: network fees are low. As we measured this morning, one satoshi per byte was enough to make it into the next block, which made a withdrawal possible for around 12 cents. The details of that measurement from the morning of October 18 are in our analysis of the network fee and the mempool.
That connection is no coincidence. When demand for block space falls, fees stay low, and precisely then miners lack the revenue source that could cushion the fallen hashprice. For investors who want to move holdings from an exchange into their own custody, that is the favourable side of the same coin.
Bitcoin at $81,017: the $81,382 line decides the week
The difficulty jump of October 16 makes mining 5.92 percent more expensive, the hashprice sits 9.5 percent below its October 3 level, and the price is quoted $365 below the 50-day average. Three steps follow for the coming days:
- Watch the line at $81,382. A daily close above it ends the short-term weakness, a break of $80,823 opens the way towards $78,000. Where you trade and at what fees is shown in our overview of the best crypto exchanges.
- Mark October 30 in the calendar. On that day the next difficulty adjustment and the options expiry coincide. For a staggered entry in fixed instalments until then, the providers in our comparison of Bitcoin savings plans are suitable.
- Document the holding period of every new tranche. Each additional purchase brings its own cut-off date in October 2027. Which programs keep acquisition dates and deadlines cleanly is in our comparison of crypto tax tools.
(As of October 18, 2026. This article is not investment advice. Prices and fee structures change; check the terms with the provider before you buy.)
Decrypt
MapQuest’s app now offers an optional map layer that plots known license plate readers from Flock Safety and other vendors, as backlash against the cameras grows.
Bitcoin ETFs lost a net $228.6 million this week, following a $681.1 million drain the week before and pushing October deep into the red.
A Bank for International Settlements working paper found that stablecoin growth slows when U.S. banks raise deposit rates, with Circle’s USDC most sensitive.
An FEC filing shows the Fairshake affiliate Defend American Jobs disclosed roughly $7 million more in ads against the Ohio Democrat, pushing its total past $46 million—days after the PAC expanded its map to 32 House races.
The nine-member group, modeled on the Internet Engineering Task Force, aims to set open standards for testing quantum-resistance claims as forecasts place the first practical attack in the late 2020s.
U.Today - IT, AI and Fintech Daily News for You Today
Former Mt. Gox CEO Mark Karpelès has stepped in to address Ledger's security woes, developing an affordable device capable of detecting hidden spy implants in hardware wallets without opening them.
October continues to be a busy month for the XRP Ledger and the Ripple ecosystem.
As Ripple tests RLUSD with banks, fraud networks are spoofing brand names to steal XRP.
Shibarium, the layer-2 network associated with Shiba Inu, sees a slowdown in transaction activity, with daily transactions hitting a monthly low.
Michaels Saylor teases more Bitcoin buys for Strategy’s $69 billion BTC hoard via a fresh ‘orange’ chart update.
Blockonomi
TLDR:
- Monero price prediction centers on $558 resistance after XMR traded near $555, with a daily close above the barrier putting $575 in view.
- Spot volume rose 171% to $13.13 million, while futures volume advanced 70% to $200 million in the reported trading period.
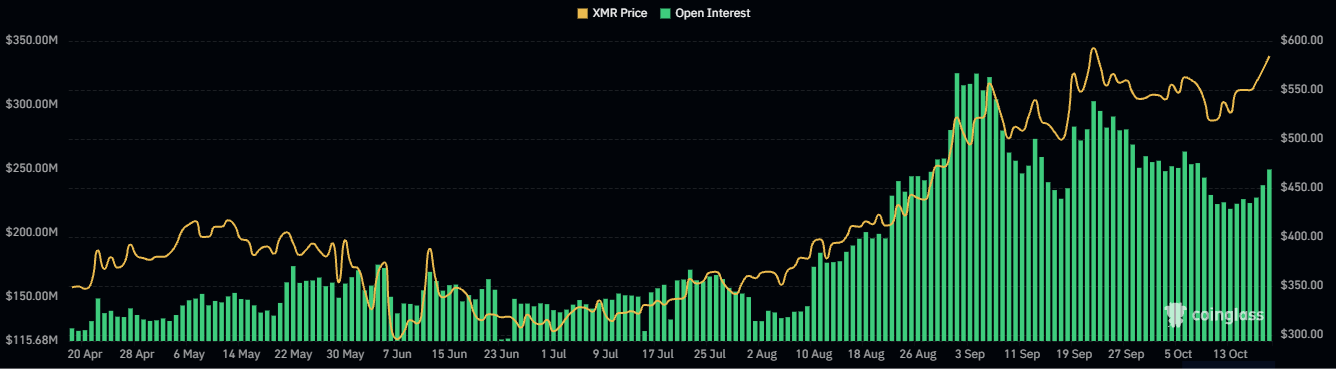
- Open interest climbed 11% to $261 million, and about 63% of traders in the tracked positioning sample held long exposure.
- The $500 level and broader $475 to $500 demand zone remain support references, while $650 marks a more distant swing high.
Monero price prediction shifted into focus after XMR climbed 10% in October 18. The token traded near $555, placing $558 immediately ahead of buyers. That level matters because it acts as resistance before a move toward $575. Derivatives activity also accelerated. Open interest rose 11% to roughly $261 million, while spot and futures volumes increased.
Monero Price Prediction Weighs Spot Demand Against Futures
Spot volume rose 171% to $13.13 million, while futures volume advanced 70% to $200 million in the reported period. Spot trading grew faster by percentage, but futures activity remained far larger in dollar terms. That gap makes cash market participation especially relevant to the Monero price prediction. Rising futures turnover can accompany a strong advance without showing whether traders will hold their positions.
Another volume measure nearly doubled to $147 million. These figures track different markets and methods, so they should not be added together. Higher volume means more XMR changed hands during the period. It does not, on its own, show sustained net buying or confirm a breakout.
Monero open interest provides a clearer view of positions left outstanding. Its 11% increase indicates that traders expanded derivatives exposure during the recovery. Open interest can rise when new long and short contracts enter the market. It cannot show that all new exposure favors higher prices. That makes the price reaction around $558 more useful than the headline figure alone.

Positioning data in the report placed long traders near 63% within the sample tracked by Coinalyze. The measure suggests a bullish tilt among those accounts, though it does not cover every Monero trader. For the Monero price prediction to strengthen, XMR would need to clear $558 and hold the move. A daily close above that level would bring the $575 area into view. Failure there could leave recent long positions exposed to a pullback.
Crowded XMR Longs Face the $558 Resistance and $500 Support Test
XMR price had already reclaimed $500 during its earlier advance, turning that mark into a nearby support reference. The XMR price analysis also identified a broader demand area between $475 and $500. Several rebounds had occurred around that range, while the daily chart showed XMR above key exponential moving averages. These are observed chart conditions, not guarantees that the range will hold again.
A retreat below $500 would put the wider demand zone under pressure. If buyers defend it, they may have another chance to challenge $558. The $650 swing high remains a more distant reference. For the Monero price prediction to reach that level, XMR must clear nearer barriers and sustain demand after the initial breakout.
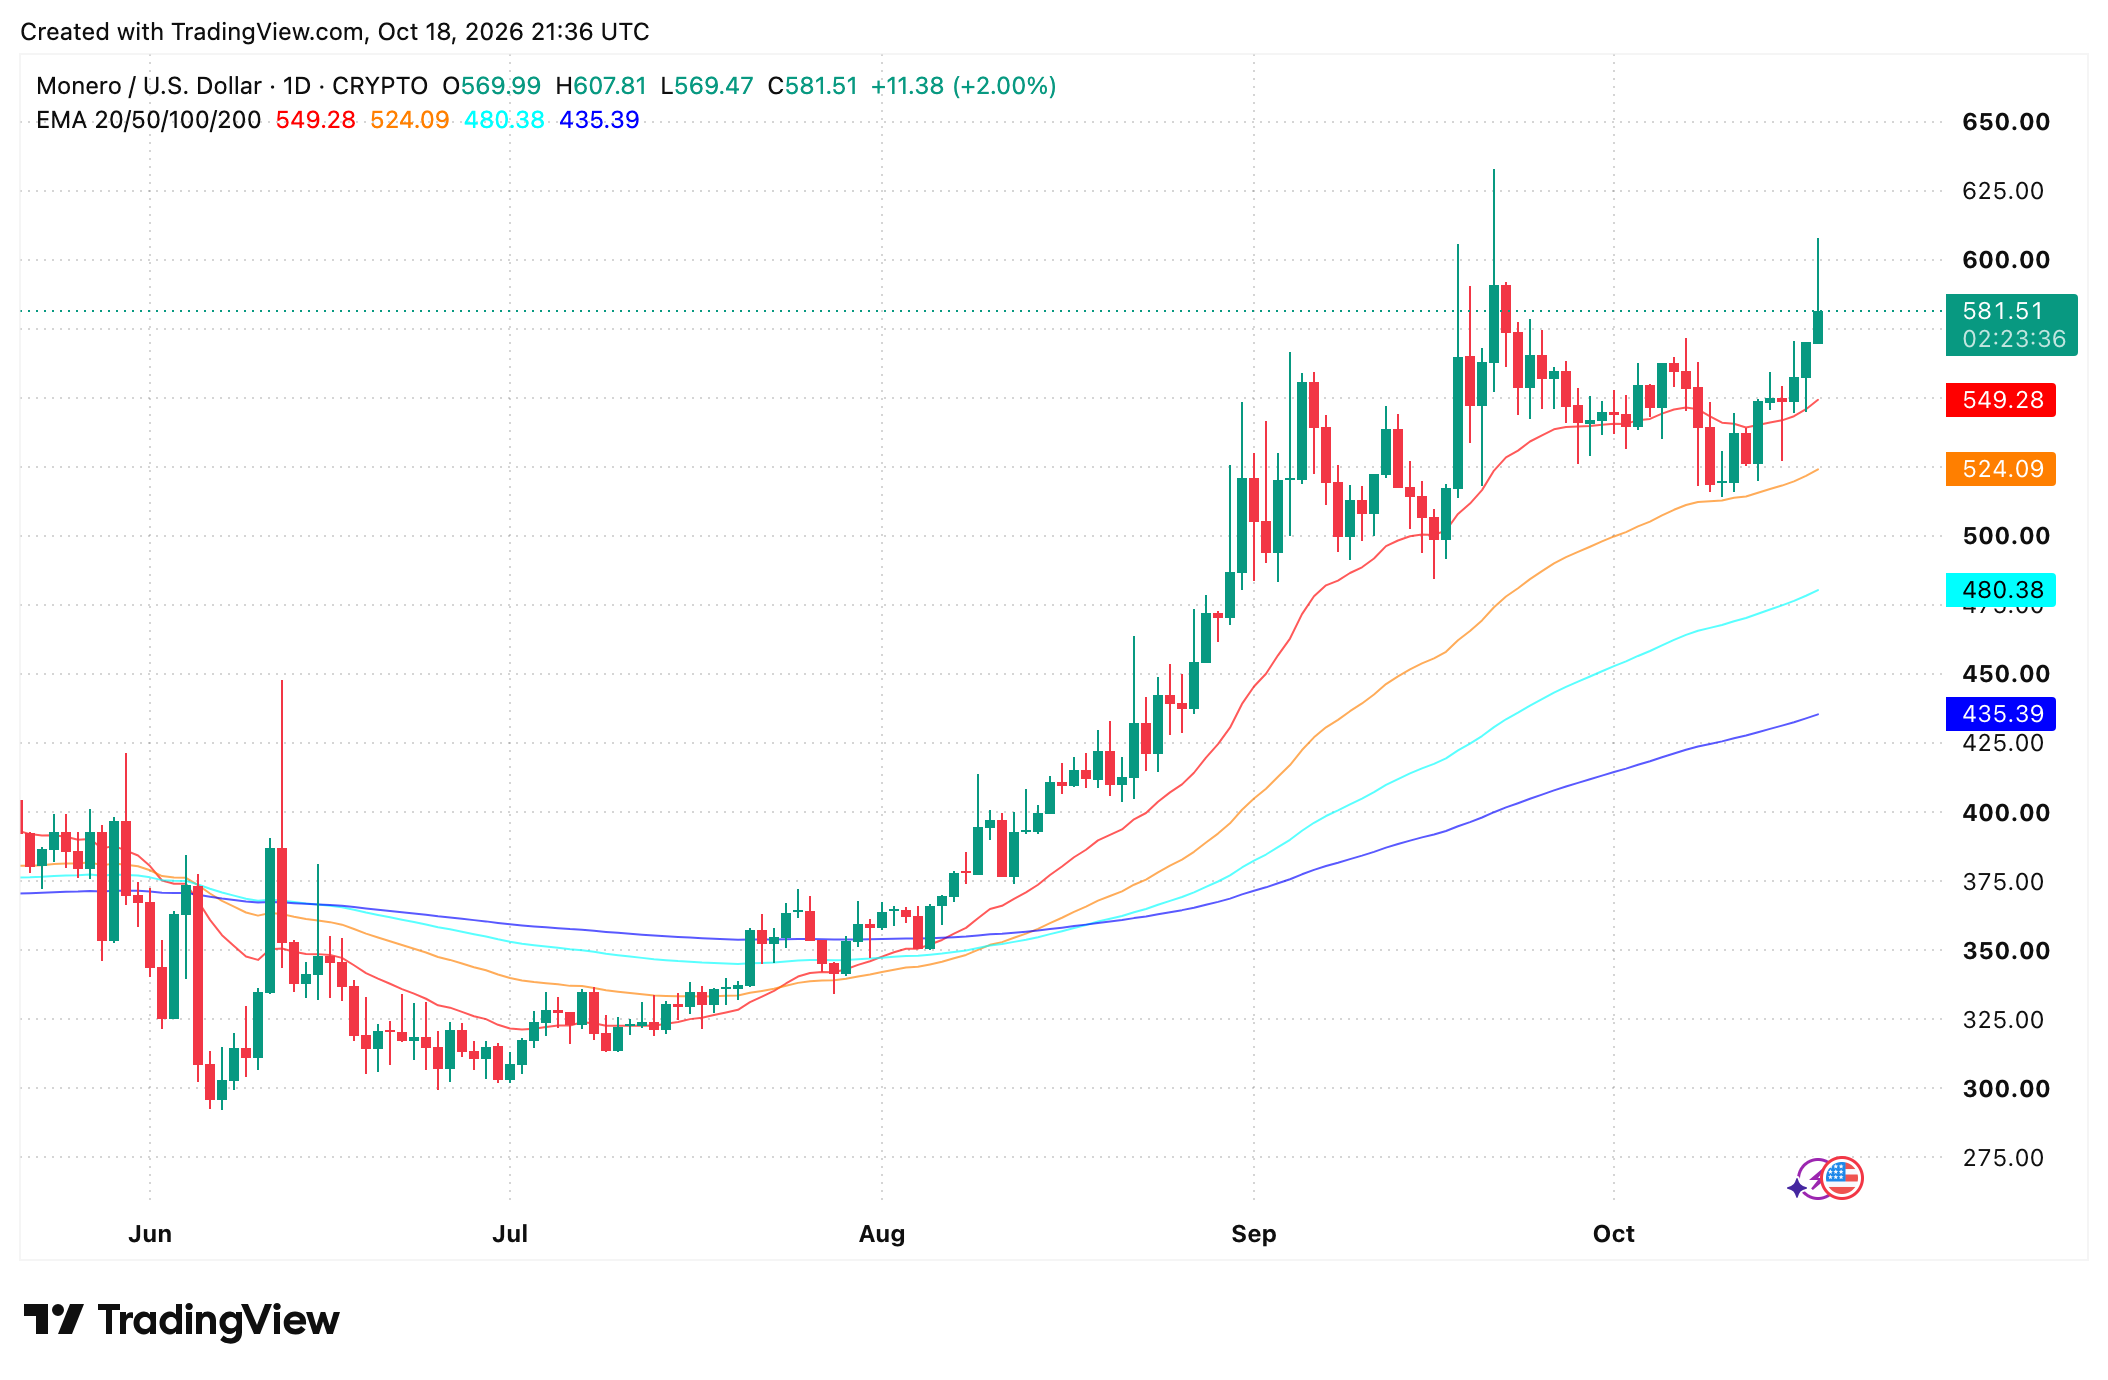
The Monero price prediction also depends on how leverage responds to a reversal. When crowded longs close voluntarily or face liquidation, their exits can add selling into a falling market. The reported 63% long share cuts both ways. It reflects bullish positioning, but it also identifies a group sensitive to a failed rally.
THORChain’s protocol upgrade adds a separate development for Monero. Its published update discussed work toward Monero activation, including swap and node improvements. That work could eventually widen self-custodial trading routes. The update does not establish that native Monero swaps were fully available on the main network during this market snapshot.
According to onchain data, its number of XMR swaps rose 1.43% in August, compared with Monero’s 43% price gain that month. That measure covers one platform and an earlier period than the October trading figures.
The post Monero Rally Tests $558 as XMR Open Interest Reaches $261M appeared first on Blockonomi.
TLDR:
- ONDO is described by the Ondo Foundation as a governance token for the Ondo DAO and Flux Finance.
- Published risk disclosures say ONDO holders have no shareholder rights or claim to company dividends.
- Andreou asks for a clear mechanism, enforceable scope and measurable benefit linking products to holders.
- Ondo’s Solana tokenized assets passed $500M, and Ondo Stocks reached $1B TVL and $18B in volume.
The ONDO token faces a fresh debate over what its holders actually own as Ondo expands its tokenized finance business. Questions have emerged over how product growth translates into value for token holders.
Meanwhile, tokenized assets tied to Ondo on Solana reportedly crossed $500 million. The two views reflect a wider discussion about the link between platform adoption and governance token demand. Both positions depend on how the token is defined in Ondo’s published documents.
What the ONDO Token Represents
The Ondo Foundation describes ONDO as a governance token for the Ondo DAO and Flux Finance. Holders therefore take part in decisions tied to those two areas. The ONDO token is not presented as a claim on company revenue.
Giannis Andreou raised the question in a post on X. He asked how the success of Ondo’s products reaches someone holding the token.
$ONDO BULLS: WHAT EXACTLY DOES THE TOKEN HOLDER OWN?
Ondo could become an important business in tokenized finance.
Institutions could adopt its products. Assets under management could grow. Distribution could expand across wallets, exchanges and financial platforms.
My… pic.twitter.com/F8tbhdRGjE
— Giannis Andreou (@gandreou007) October 18, 2026
He pointed to the Foundation’s token-sale risk disclosures. Those disclosures state that holding the token provides no shareholder rights. They also exclude rights to company dividends and distributions.
Andreou added that a customer buying a tokenized financial product acquires something different from an ONDO buyer.
The yield or economic rights attached to a product do not automatically belong to the governance token holder. Governance rights and product economics therefore sit in separate categories.
What Would Support a Bullish Case
Andreou acknowledged that governance can carry value. He also noted that future changes could strengthen the token’s role. Market demand may rise as the ecosystem grows. However, he asked that each of those arguments be evaluated separately.
He wants supporters to identify the existing mechanism, its enforceable scope, and the measurable economic benefit for holders.
If a thesis relies on a future governance decision, he asked that the dependency be explained. He also asked who holds the power to deliver that decision.
According to Andreou, a documented link between product success and durable demand for the ONDO token would change his view. He said numbers should show why that link matters. This standard applies to any claim that product growth benefits holders.
Solana Milestone Adds Another Angle
Niels offered a separate view in a post on X. He reported that ONDO crossed $500 million in tokenized assets on Solana. Ondo brought its tokenized stocks to the network only in January. The launch started with more than 200 U.S. stocks and ETFs.
Since then, Ondo has expanded 24/7 minting and redemption on Solana. Niels added that the wider Ondo Stocks platform has passed $1 billion in TVL. Cumulative volume has reached $18 billion in under eight months.
Niels described the pace of cross-chain expansion as hard to ignore. His post centers on platform scale. Andreou’s post centers on how the ONDO token captures benefits from that scale. Both posts therefore frame the same debate from different sides.
The post What Does the ONDO Token Holder Own? Debate Grows as Solana Assets Pass $500M appeared first on Blockonomi.
TLDR:
- Bitcoin must hold $81,000, the lower boundary of its daily rising channel, to target $84,000 and $86,500.
- A break below $81,000 would shift Bitcoin’s focus to $76,000 as the next downside level to watch.
- Ethereum must hold $2,350 on a daily close to target $2,700 and $3,000; a loss puts $2,000 in focus.
- XRP needs $1.25 to hold and a sustained close above $1.56 to open the path toward $2; $1 is the downside.
Bitcoin rebound prospects depend on whether buyers defend key support levels, according to crypto analyst Ali Charts.
The analyst named $81,000 for Bitcoin, $2,350 for Ethereum, and $1.25 for XRP as the levels to watch. Each asset has reached a technical test on its daily chart.
Holding these zones could trigger recoveries across all three assets in the near term. A breakdown, however, would shift attention toward lower price targets instead.
Bitcoin Rebound Depends on $81,000 Support
Ali Charts shared the outlook in a thread on X on October 18. For Bitcoin, the analyst pointed to $81,000 as the key level.
This price marks the lower boundary of its daily rising channel. The channel connects a series of higher lows and higher highs on the daily chart.
If buyers defend that support, BTC could rebound toward the channel’s mid-range at $84,000. The $84,000 mark sits near the midpoint of the channel. From there, the next target sits at the upper boundary near $86,500.
However, a break below $81,000 would change the setup. In that case, the analyst would shift focus to $76,000 as the next level.
The $76,000 level would then become the main area for buyers. The Bitcoin rebound case therefore rests on this single channel boundary.
Ethereum Tests $2,350 Support
Ethereum faces a similar test at $2,350. This level acts as the support line of a right-angled ascending broadening pattern. Such patterns form when price swings widen while support rises over time.
A bounce from this zone could lift ETH toward $2,700. A stronger move could extend the rally to $3,000. The $3,000 target would require sustained momentum after the first move. Both targets depend on buyers holding the pattern’s lower boundary.
On the other hand, a daily close below $2,350 would change the outlook. A close below that line would invalidate the support the pattern relies on. In that scenario, the analyst would watch $2,000 instead. Ethereum therefore needs to hold that line on a closing basis.
XRP Watches $1.25 Inverse Head-and-Shoulders
For XRP, Ali Charts is watching $1.25. Holding this level could complete the right shoulder of a potential inverse head-and-shoulders pattern.
The pattern appears on the 3-day chart. This formation often signals a potential trend reversal when the price breaks above its neckline.
The rebound would still need confirmation, though. A sustained close above $1.56 could open the path toward $2. The $1.56 level acts as the resistance XRP must clear first. Such a move would confirm the setup on the higher timeframe.
Failure to hold $1.25 would change the picture. In that event, $1 becomes the downside level to watch. That level would mark a drop of roughly 20% from the $1.25 support. All three setups, including the Bitcoin rebound case, depend on support holding in the coming sessions.
The post Bitcoin, Ethereum, and XRP Reach Critical Support Zones: Here Are the Levels to Watch appeared first on Blockonomi.
TLDR:
- Solana’s bubble map turned heating for the first time after roughly six months of cooling volume.
- About half a dozen red bubbles printed as SOL fell from roughly $112 to $103, per the volume chart.
- The June low near $62 printed neutral bubbles, so that bottom did not show a volume climax.
- A $100 break with ongoing heating would confirm the decline, while fading volume points to a pullback.
Solana spot volume has flipped to a heating state for the first time in this window, and the move is happening while price falls.
A bubble map of daily spot volume shows the first red bubbles after roughly six months of cooling readings. SOL has dropped from about $120 in early October to near $103.
The chart colors each day’s volume against its own baseline. Heating means volume is running above that baseline, though color does not show direction.
Six Months of Cooling Volume
From December through early June, nearly every bubble on the chart was green. Green marks cooling volume against the baseline.
The chart plots each day’s spot volume state on price. During that stretch, SOL slid from about $150 to the low $80s.
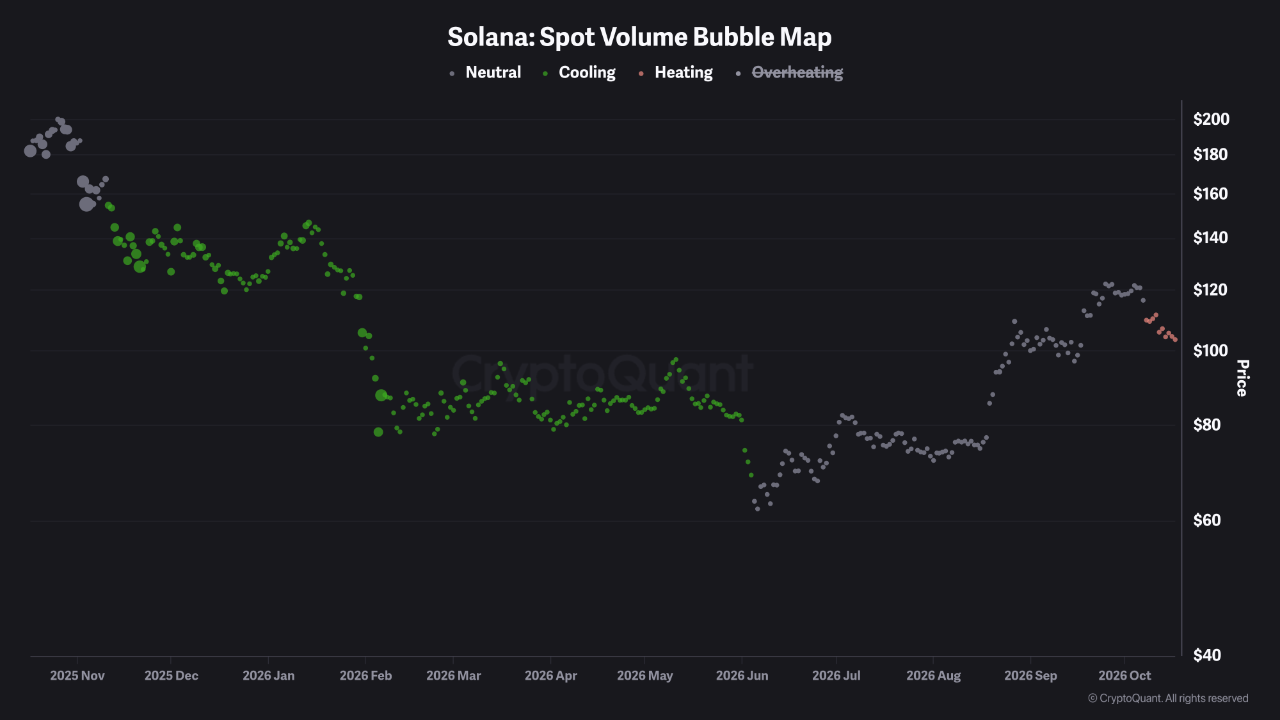
Source: Cryptoquant
Price drifted lower without any rise in volume. No spike in activity appeared along the way. That pattern matches a quiet bleed rather than a panic. Solana spot volume stayed muted while participation faded, and the decline continued.
The June low near $62 did not follow that script. Bubbles at that level turned neutral instead of heating. As a result, the bottom did not print a volume climax. Neutral bubbles then held through the recovery to roughly $120 in early October.
First Red Bubbles Appear as Price Falls
The first red bubbles on this chart have now appeared. About half a dozen printed as SOL fell from roughly $112 to $103. Until then, no heating readings had shown up in the window.
Color only shows that volume is running hotter than baseline. It does not show direction. Neutral and cooling bubbles dominated earlier readings on the chart. However, heating volume on falling price points to active selling rather than drift.
This tape differs from the one that dominated the first half of the year. Earlier, price declined while volume cooled. Now, Solana spot volume is expanding as price moves lower.
The $100 Level Frames the Next Move
Analyst Iko | Web3 shared a related view in a post on X. According to the post, SOL ran toward $120 but now trades near $103. The analyst described $100 as the key zone to watch.
Holding that level could give buyers another shot at recovery. Losing it could allow sellers to take control. The post also asked whether buyers can defend their gains after the rally.
$SOL bulls have a decision to make.
Solana ran toward $120, but now the price is back near $103.
Here’s the level that matters most
→ $100 is the key zone to watch.
→ Hold it, and buyers may get another shot at recovery.
→ Lose it, and sellers could take control.The… pic.twitter.com/majLJUzIXR
— Iko | Web3 (@IkoWEB3) October 18, 2026


The Solana spot volume chart offers a way to track how that level plays out. If bubbles return to neutral or cooling while price holds near $100, selling is fading. In that case, the move would read as a pullback.
The alternative scenario looks different. If heating persists and $100 breaks, volume confirms the decline. The overheating state is struck through in the legend, so the chart does not show it.
A move into that state would be the stress signal. Until one of those outcomes plays out, the $100 area remains the level to watch.
The post Solana Spot Volume Flips to “Heating” or the First Time as SOL Price Falls appeared first on Blockonomi.
TLDR:
- The Ethereum gas limit on Hoodi is scheduled to rise from 60 million to 200 million when Glamsterdam activates on October 26, the Foundation said.
- The Ethereum Foundation has not set a mainnet activation date; Hoodi is the next scheduled public test network after Sepolia for Glamsterdam.
- Glamsterdam adds enshrined proposer-builder separation, block-level access lists, and gas repricing that reflects execution costs and state growth.
- A higher block gas limit creates room for more computation in each block, but it does not guarantee faster confirmations or higher transaction rates.
The Glamsterdam upgrade will raise the Ethereum gas limit on Hoodi to 200 million on October 26. The planned setting expands the computation each block can hold, giving developers another chance to examine Ethereum’s layer-one capacity. The Foundation has not set a mainnet launch date or activation schedule.
The increase could leave room for more transactions or complex contract calls, depending on demand and gas use. A larger gas target, however, does not translate directly into a fixed transactions-per-second figure. Client teams must assess execution behavior and node requirements under load before weighing results against a potential mainnet deployment plan.
Ethereum Gas Limit Moves to 200 Million on Hoodi Testnet
The Ethereum gas limit rise takes Hoodi from 60 million to 200 million, about 3.3x its former level. The Ethereum Foundation’s Hoodi announcement places that change at the same fork epoch as Glamsterdam. Sepolia activated the upgrade on October 6, and now the Hoodi testnet follows. Hoodi’s result will help developers evaluate client behavior under the revised rules.
The Ethereum gas limit sets a ceiling on computation each block can contain. Every transaction uses gas based on the work it requires. A higher cap could leave room for more transactions or more complex contract activity when demand exists. It does not promise faster confirmations or a fixed transactions-per-second figure. Actual throughput also depends on block demand, transaction size, and how quickly nodes propagate and process blocks. The 200 million figure describes the Ethereum gas limit ceiling, not guaranteed network activity.
The higher Ethereum gas limit may add pressure to node hardware, storage, and bandwidth. The Glamsterdam upgrade includes changes intended to manage those demands. Block-level access lists record accounts and storage locations accessed during a block. That record could help clients read state and validate transactions in parallel.
Gas repricing will also adjust costs to better reflect execution and long-term state growth. Developers will watch whether these changes let nodes handle larger blocks reliably. Researcher Toni Wahrstätter has discussed 300 million gas as a possible longer-term target, not a confirmed Glamsterdam setting.
Glamsterdam Upgrade Pairs Capacity Gains with Node Testing
The Ethereum Foundation identifies enshrined proposer-builder separation and block-level access lists as core parts of the Glamsterdam upgrade. Under ePBS, the protocol separates the validator proposing a block from the builder assembling its execution payload. The change formalizes that handoff within Ethereum and gives validators more time to check execution data.
Access lists track which accounts and storage locations transactions touch across a block. This structure could let clients process state reads and validation work in parallel. That could support higher layer-one capacity while keeping validation practical. The Ethereum gas limit also aligns with Glamsterdam’s broader processing and validation changes.
The Hoodi testnet is the next scheduled public network after Sepolia for this fork. Wahrstätter has described it as the last testnet step before a possible mainnet launch. Client teams will review test results before establishing the next schedule. Node operators must also install compatible execution and consensus clients before Hoodi’s activation.
The Sepolia client guidance showed that some validator clients defaulted to a 60 million gas target after the fork. Those operators needed an explicit setting to propose blocks with 200 million gas. The Hoodi announcement also tells validators to check their gas-target settings.
Ethereum’s next planned fork after Glamsterdam is Hegotá, expected in 2027. Wahrstätter said developers were considering 23 proposals, including FOCIL and Frame Transactions, though the final package remained undecided.
Buterin has described Hegotá as a possible last fork using conventional cryptography. He pointed to future work on advanced cryptography, formal verification, consensus, and quantum resistance. PeerDAS has also been discussed as a way for nodes to verify data availability without downloading every block.
The post Ethereum Gas Limit Rises as Glamsterdam Moves to Hoodi Testnet appeared first on Blockonomi.
CryptoPotato
A recent report by Chainalysis claimed that the United States has become a net importer of bitcoin this year while continuing to export dollar-backed stablecoins around the world.
The trend highlights an increasingly unusual dynamic: institutions are pulling BTC into the US, while the rest of the world is becoming more dependent on tokenized dollars.
Institutions Bring BTC Into the US
The report found that the US became a net importer of BTC this year for the first time since 2022. The distinction between retail and institutional activity is particularly notable, as transfers below $10,000 remained net outbound, but larger transactions moved strongly in the opposite direction. The $10 million-plus bracket alone accounted for 53,200 BTC flowing into the country.
In other words, retail users are sending BTC out, while US-based institutions are bringing it in. Chainalysis links the shift partly to the rise of spot Bitcoin ETFs, which have steadily increased the US share of global crypto activity since their launch in early 2024.
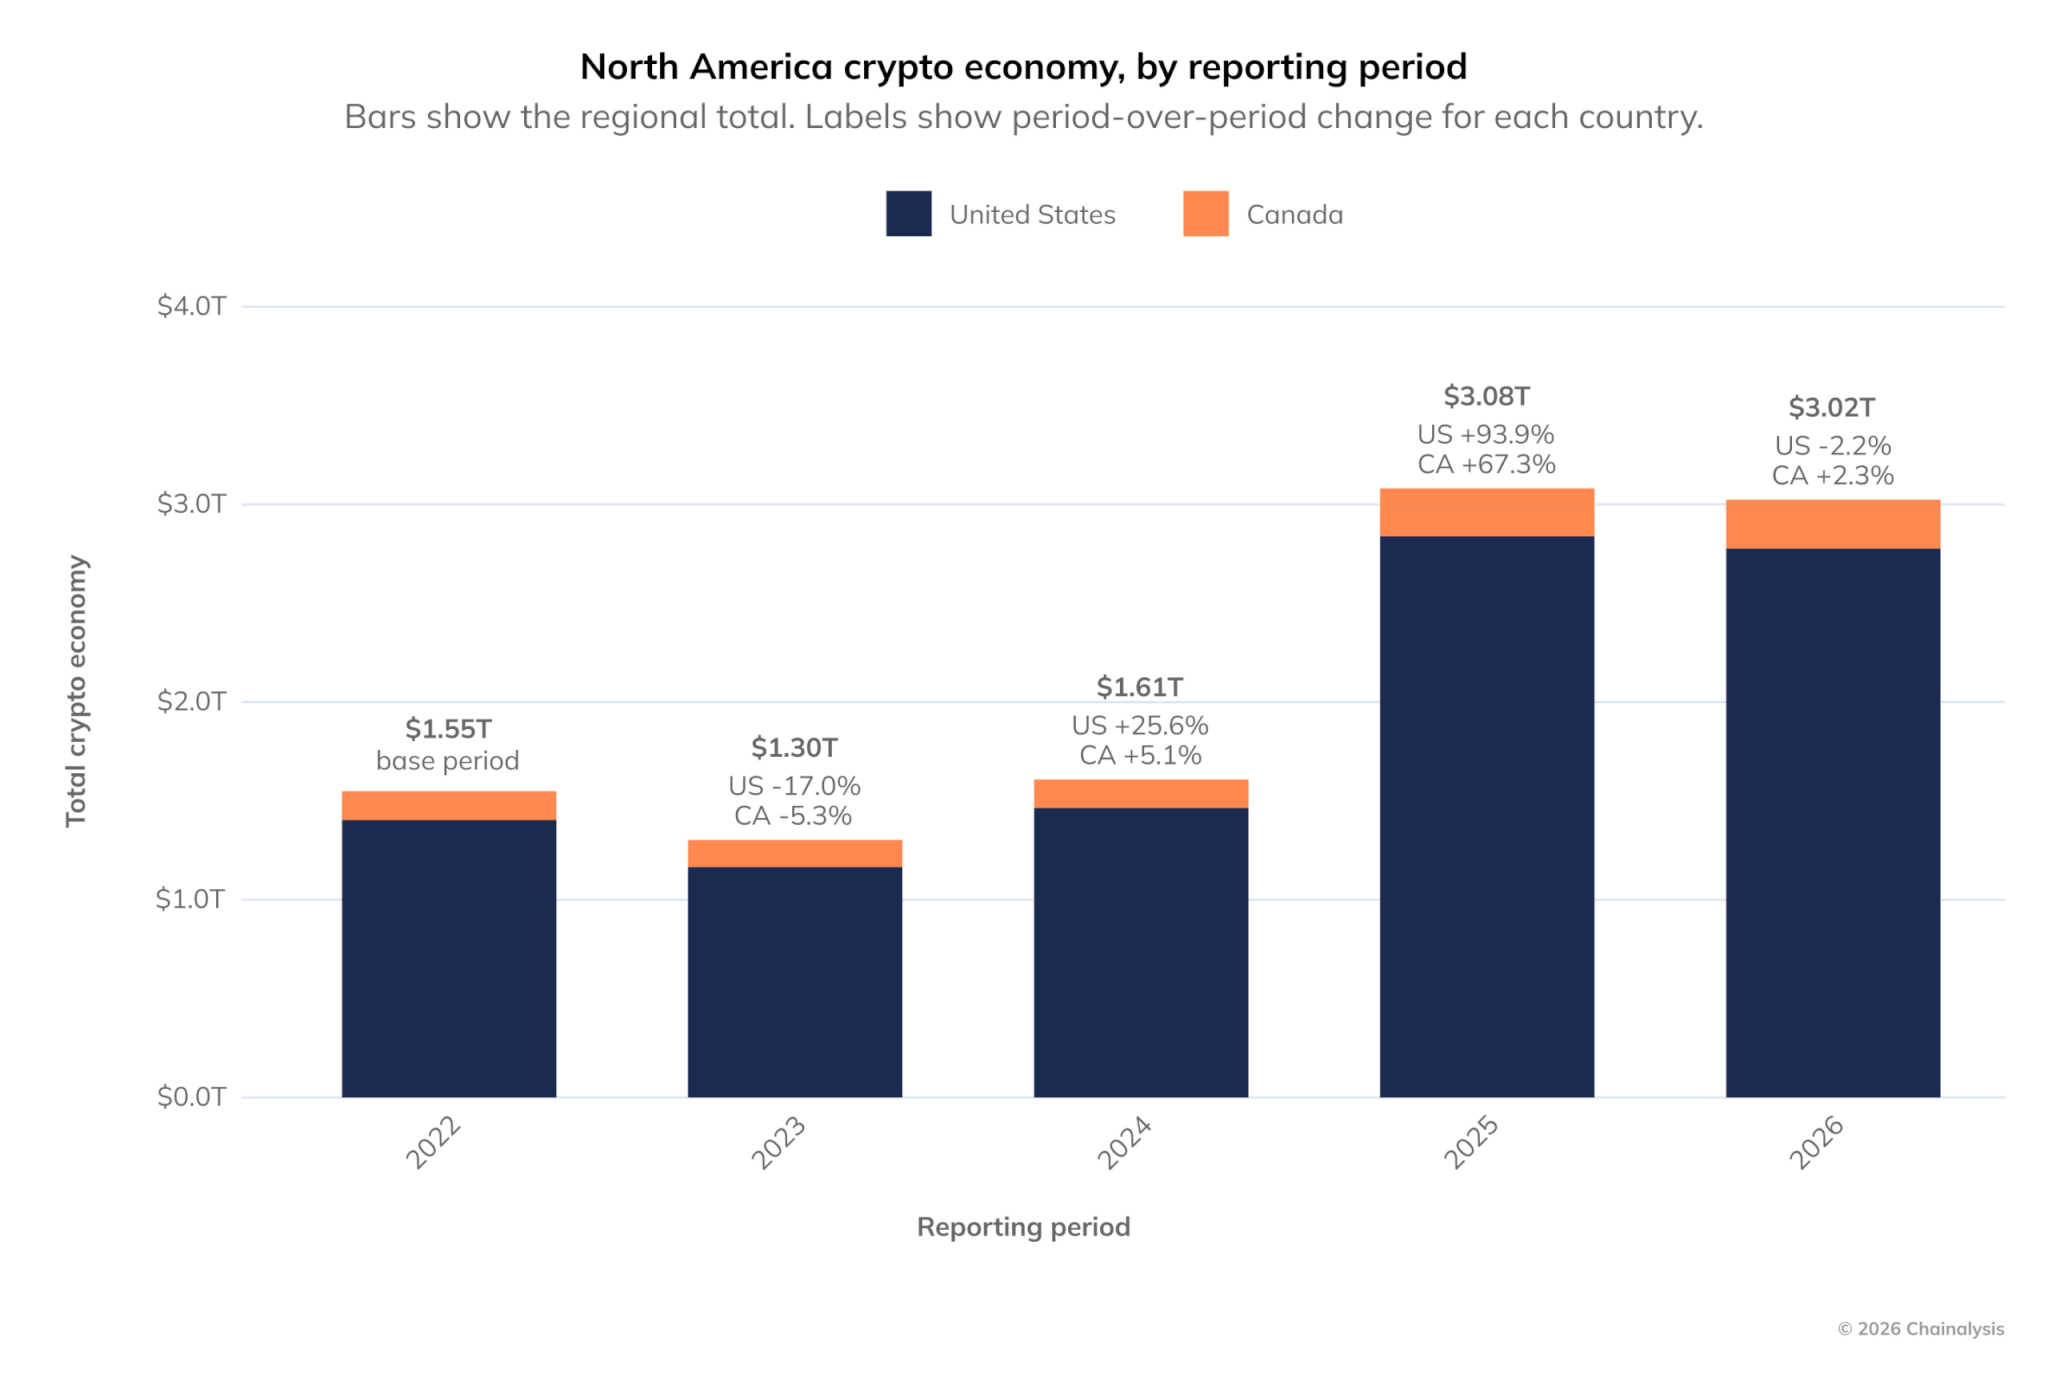
That fits a broader trend we previously covered, suggesting BTC has increasingly migrated from exchange balances to institutional structures such as ETFs and corporate treasuries. This reduces the amount of units readily available on trading platforms.
Chainalysis also noted that the US Strategic Bitcoin Reserve has added another layer of implicit sovereign demand, despite there being no standing federal purchasing program yet.
Everyone Else Wants Digital USD
The report further indicated that 99.1% of stablecoin order-book volume is tied to the greenback. It argued that users outside the US increasingly rely on such assets because they offer access to dollars without requiring an American bank account. That dynamic ultimately feeds back into US financial markets because stablecoin issuers typically hold reserves in short-dated US government debt.
The growing RWA sector reinforces the same trend, as the global market exceeded $36 billion in Q2 this year. It’s up 135% from the previous period, while tokenized US Treasuries alone accounted for $15.42 billion, or almost 43% of the total.
We have previously highlighted the rapid expansion of the sector, with tokenized Treasuries emerging as one of the largest and fastest-growing niches.
Taken together, the picture is quite straightforward: foreign users are increasingly demanding tokenized dollars and US debt, while American institutions are accumulating BTC.
The post US Is Importing Bitcoin and Exporting Digital Dollars: What Does it Mean? appeared first on CryptoPotato.
Chainalysis has revealed that one of the biggest victims of the Ledger implant thefts was a task scam operator who lost more than 60 Bitcoin (BTC).
The blockchain analytics firm put that loss at about $4.8 million. It seems the operator moved the scam’s proceeds into three Ledger addresses on September 22, and then emptied all three into the same wallet on October 9.
A flow chart Chainalysis posted traces the money back to a consolidation wallet, and it labels three of the wallets feeding it as reported scams. Likewise, the largest scam wallet sent it $1.36 million across 106 transfers. Each Ledger address was then drained of about $1.64 million in a single transfer.
Fake Reviews Led to Deposits
The report said the scam paid people to fake sales and reviews of real products, who then saw a negative balance appear in their accounts. They were told to add their own money before they could be paid.
One of the biggest victims of the Ledger theft was a scammer themselves. They lost more than 60BTC, about $4.8M. The funds were from a task scam.
In this task scam, people were paid to fake sales and reviews of real items. Then a “negative balance” appeared, and they were told to add their own money in order to get paid.
On Sep 22, the person behind the scam moved the proceeds into three separate Ledger addresses. On Oct 9, thieves emptied all three. One transfer each, into the same wallet. The wallet is reported as stolen funds.
— Chainalysis (@chainalysis) October 15, 2026
The US Federal Trade Commission (FTC) described the same pattern in a December 2024 report on task scams. The agency estimated that task scams made up nearly 40% of job scam reports in 2024.
“Cryptocurrency is the payment of choice for these scams,” the FTC said. Reported crypto losses to job scams hit $41 million in the first half of 2024, the agency added.
Ledger Ties Losses to CryptoBilis
Chainalysis didn’t disclose where the operator bought the Ledger signers, but Ledger has tied every confirmed loss from the incident it disclosed on October 9 to signers sold through CryptoBilis, a Southeast Asian reseller.
On October 10, Ledger found an unauthorized hardware implant inside one victim’s signer. Its Donjon security team said the implant reads the screen during setup and captures the 24-word recovery phrase. The implant then sends those words out over LTE through a provisioned eSIM.
On-chain analyst Specter has estimated losses from the CryptoBilis drain at more than $86 million, across Bitcoin, Ethereum (ETH) and TRON (TRX).
“We have not confirmed the total number of affected users or the total value lost,” Ledger said on Tuesday. The company has told anyone who set up a signer bought from CryptoBilis to move their assets to a new signer with a new recovery phrase.
The post Scammer Gets Scammed: Ledger Implant Thieves Steal $4.8M in Bitcoin appeared first on CryptoPotato.
Ethereum is testing a critical support confluence below $2.4K as its correction continues. Buyers have defended the area with several sharp reactions, but persistent lower highs suggest that selling pressure has yet to ease.
Ethereum Price Analysis: The Daily Chart
On the daily timeframe, ETH has declined into the highlighted $2.36K–$2.44K demand zone, where the lower boundary of the broader ascending channel provides additional support. The asset is currently near $2.36K, with recent lower wicks indicating buying interest beneath the consolidation.
However, these reactions have not produced a sustained recovery. Since losing the channel’s midpoint, ETH has continued to form lower highs, keeping the immediate outlook fragile. Buyers need to reclaim the $2.44K demand boundary and then overcome the recent $2.5K–$2.56K resistance area to demonstrate improving strength.
Holding the current confluence could support a recovery toward the former consolidation around $2.67K–$2.74K. Conversely, a decisive daily close beneath $2.36K and the ascending channel boundary would weaken the broader recovery structure, increasing the risk of a deeper correction toward $2.2K.
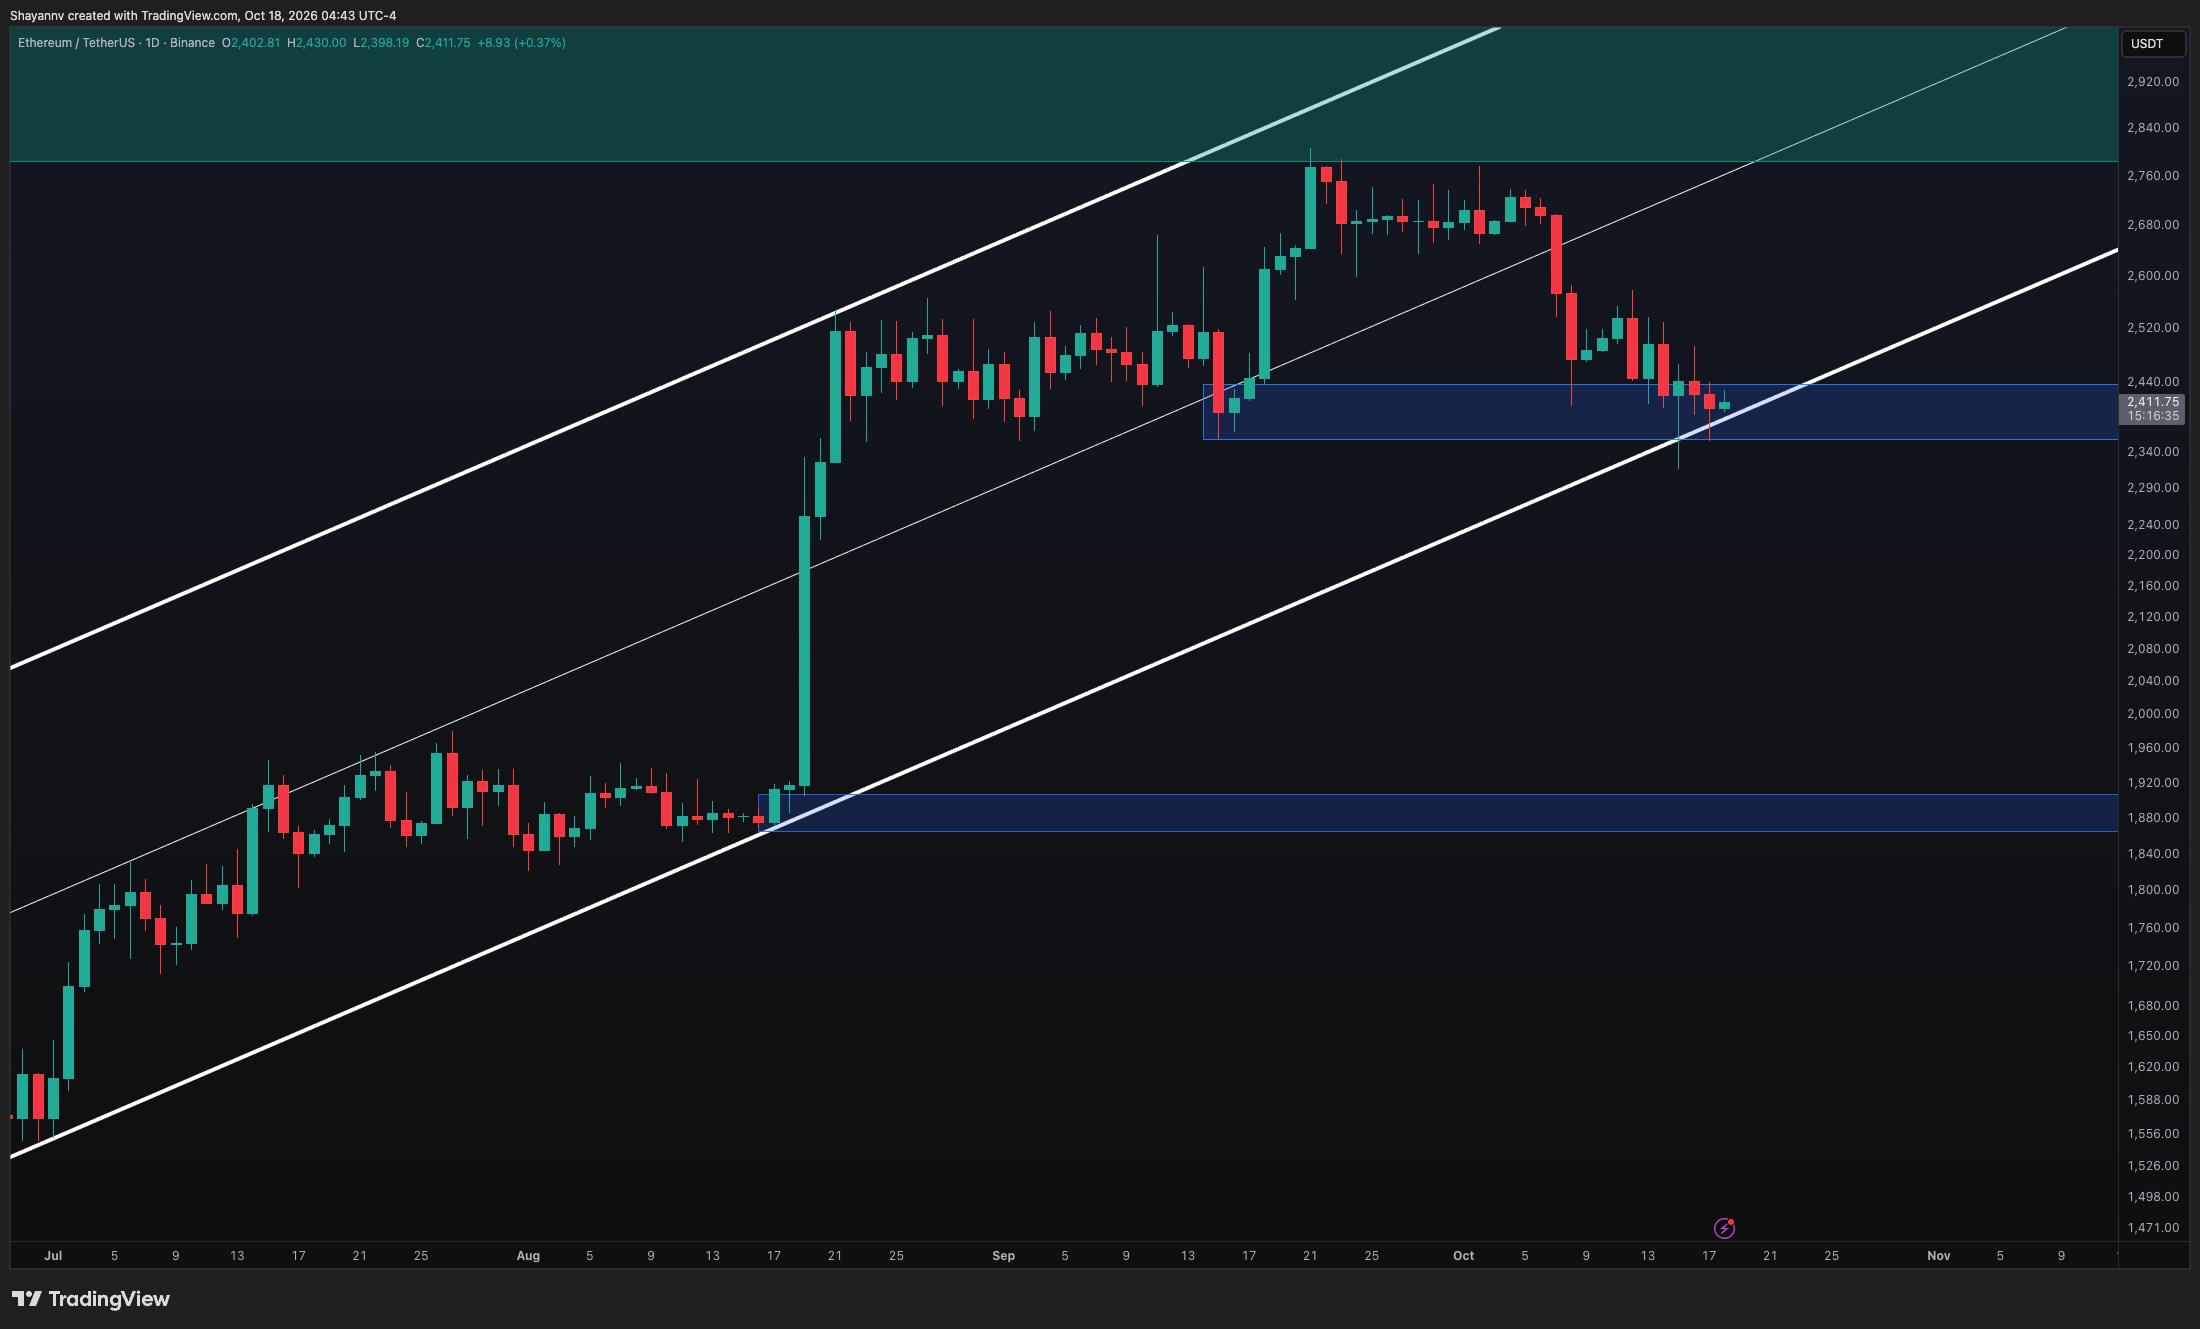
ETH/USDT 4-Hour Chart
The 4-hour chart shows Ethereum trading within a descending channel following the sharp early-October selloff. Repeated rebounds have failed to break the upper trendline, while the latest candles are consolidating inside the $2.36K–$2.44K demand zone.
The descending resistance currently approaches $2.45K–$2.47K, making this the first important obstacle to a recovery. A sustained breakout above both the demand zone’s upper boundary and this trendline would interrupt the immediate bearish structure and could allow a move toward $2.5K–$2.58K.
Until that occurs, another test of $2.35K remains possible. Losing this support would expose the recent wick lows around $2.32K, followed by the highlighted $2.2K–$2.27K demand zone. The descending channel’s lower boundary also approaches that deeper region, reinforcing its relevance if the correction extends.
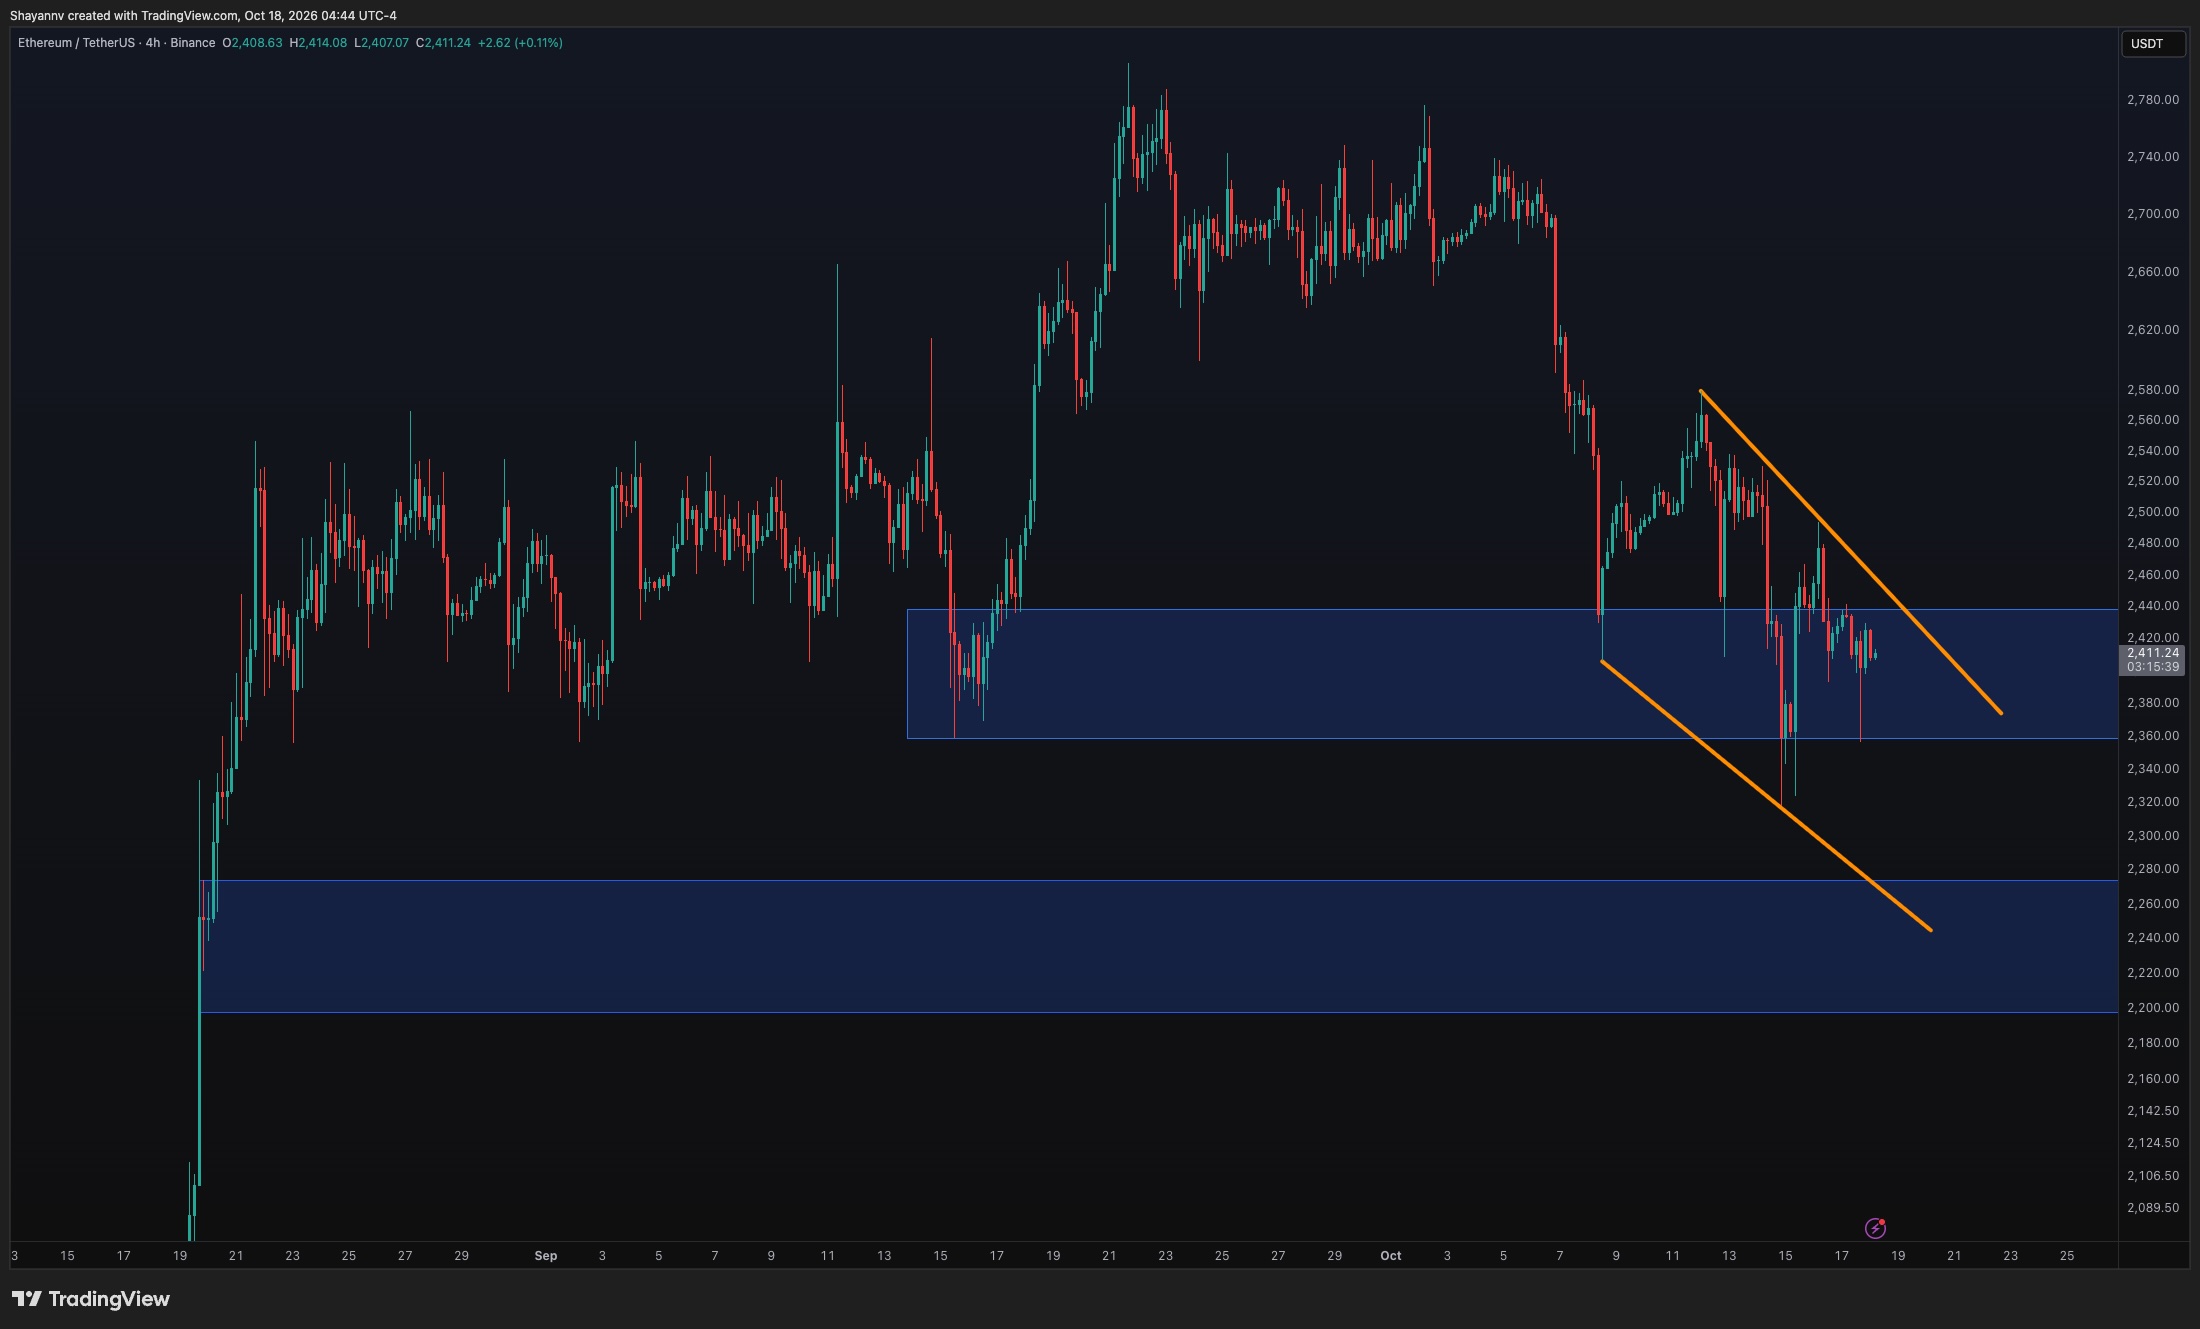
Sentiment Analysis
The one-month ETH liquidation heatmap highlights a substantial estimated liquidation cluster around $2.15K–$2.2K, above the psychological $2K threshold. The band has remained visible across multiple sessions and is particularly bright near the chart’s latest readings, indicating a significant concentration of potential liquidation exposure below the current price.
This cluster becomes especially relevant if Ethereum loses the $2.36K support zone and its broader ascending structure. Under that scenario, further declines could trigger long liquidations as the price approaches $2.2K, potentially accelerating the move into this liquidity pool.
Its proximity to the $2.2K–$2.27K technical demand zone adds significance to that broader area. However, the cluster represents potential forced-selling exposure rather than guaranteed support or an inevitable price target. A sustained recovery above nearby resistance would reduce its immediate relevance, while continued structural weakness would keep it in focus.

The post Ethereum Price Prediction: Is ETH’s 7% Weekly Drop Just the Start? appeared first on CryptoPotato.
It feels like it was just a few weeks ago, because it was when our article on this topic had a whole different nuance to it. We were highlighting the major green streaks for the ETFs tracking both XRP and SOL, as they had reached local peaks in terms of net inflows.
The reality today is quite different. On one side, the spot Ripple ETFs marked their first red week in months, while the Solana counterparts extended their outflow streak to ten consecutive days.
XRP ETFs Break the Streak
It was an all-out red week for the spot crypto ETFs, with the BTC and ETF funds bleeding by triple digits, as reported earlier. The financial vehicles tracking Ripple’s cross-border token began the business week with the same nonexistent pace as they finished the previous one – with $0.00 reportable net flows.
The first notable activity took place on Wednesday, which was somewhat surprising given the hotter-than-expected inflation data released that day, and the funds attracted just over $740,000. Investors changed their tune on Thursday, pulling $104,510 out. The first and only multi-million transaction took place on Friday, with the net flows jumping to $2.47 million.
Consequently, the five-day trading period ended in the red for the XRP ETFs, with $1.84 million in withdrawals. This made it the first red week since the one that ended on July 10. In other words, investors broke a 13-week green streak. The change in their appetite for XRP is more than evident, as just three weeks ago we were reporting major net inflows of over $75 million.

The past week was quite painful for the underlying asset as well, which was rejected at $1.40 and plummeted to $1.27, where it found some support over the weekend.
SOL ETFs Keep Bleeding
The Solana ETFs are in even worse shape, as they just closed their worst week ever in net outflows, with $25.52 million leaving the funds. As such, they beat the previous week’s anti-record of $24.81 million. What’s particularly worrisome is that the SOL ETFs have seen only one green day since September 29, and the inflows were quite modest at $1.30 million on October 2.
Meanwhile, the ETFs bled over $12.6 million on Friday alone, and the total net inflows have declined from $1.62 billion to $1.56 billion within two weeks.

These outflows have led to an apparent pullback in the underlying asset, which was rejected at $110 this week and dipped to $101-$102 on a couple of occasions. Although it has remained within three-digit territory, the overall landscape has worsened substantially over the past few weeks, and a dip below $100 might be just a matter of time.
The post Spot Ripple (XRP) ETFs Reach the End of an Era, Solana (SOL) Funds Can’t Catch a Break appeared first on CryptoPotato.
In a week in which the underlying asset tumbled from over $84,000 to a monthly low of under $80,000, it’s almost expected that the exchange-traded funds tracking its performance were in the red. And they were.
The same can be said about the Ethereum ETFs, which, albeit finally saw a single green day, extended their negative streak.
Bitcoin ETFs Bleed Again
The spot Bitcoin ETFs have become synonymous with BTC’s price movements over the past several weeks. When net inflows dominate in an impressive manner, as they did at the end of September when investors poured in $2.4 billion into the funds in five trading days, the cryptocurrency’s price blossomed. Vice versa, BTC tumbled during the first and second full weeks of October.
As reported last weekend, the ETFs saw net outflows of over $680 million as the asset was rejected at $87,000 and slumped by several grand. It tried to recover in the following days and tapped $84,000 on a couple of occasions, only to be rejected again. This time, the bears took it a step further, pushing it to just under $80,000 for the first time in a month.
Needless to say, this transpired during a red week in terms of ETF flows. Overall, the funds bled $228.58 million, which wasn’t as bad as the previous week. It started with a $65.40 million loss on Monday, followed by a net inflow of $175.62 million on Tuesday, back to red with $261.46 million on Wednesday, a minor gain of $5.06 million on Thursday, and $82.39 million taken out on Friday to close the week.
Ultimately, the funds’ total net cumulative inflows have declined from almost $57.8 billion on October 2 to $56.88 billion on October 16.

ETH ETFs Still in Red
Although the BTC ETFs saw nearly $230 million in net outflows last week, the landscape around them is not as bad as that around their Ethereum counterparts. The funds tracking the leading altcoin have seen only a single day in the green since September 28. It came on October 13, when investors poured in $24.84 million.
In contrast, the rest of the week went in the opposite direction, with net outflows of $85.40 million on Monday, a whopping $129.51 million on Wednesday, another $60.22 million on Thursday, and $69.68 million on Friday. Consequently, the week ended with roughly $320 million in net outflows, beating the spot BTC ETFs in that adverse ranking.
This marks the third consecutive red week for the Ethereum ETFs, which lost $1 billion during the period. The underlying asset’s price also dipped hard last week, going toward $2,300 for the first time since the August breakout rally.

The post Bitcoin ETFs vs Ethereum ETFs: Which Bled More Last Week? appeared first on CryptoPotato.