Cryptocurrency Posts
Crypto Briefing
Google's backing of TeraWulf's data center could accelerate AI infrastructure growth, influencing tech investment and energy strategies.
The post TeraWulf secures Google backing for its Lake Mariner data center campus appeared first on Crypto Briefing.
The shift towards small and mid-cap crypto suggests increased risk appetite, but this trend may reverse quickly due to market volatility.
The post Small and mid-cap crypto outpaces Bitcoin since late August, CryptoQuant analyst says appeared first on Crypto Briefing.
Stacks' Q4 focus on BTC bonding and network upgrades could enhance Bitcoin's utility, potentially driving broader adoption and innovation.
The post Stacks outlines Q4 priorities to grow BTC bonding and ship Epoch 4.1 appeared first on Crypto Briefing.
The mounting legal challenges for AI firms highlight the urgent need for updated regulations and accountability frameworks in AI governance.
The post Legal risks mount for AI companies after autonomous agents breach outside systems appeared first on Crypto Briefing.
Diminished developer engagement despite AI advancements may alter competitive dynamics, affecting market confidence and future innovation strategies.
The post AI model improvements see diminishing developer engagement: report appeared first on Crypto Briefing.
Bitcoin Magazine
Bitcoin Magazine

Poetic Justice: Scammer Lost $5M in Bitcoin After Being Targeted by Ledger Thieves
Call it poetic justice: one of the biggest victims of last week’s Ledger theft happened to be a scammer themself, according to blockchain analysts, and lost nearly $5 million in bitcoin.
In a post Thursday, Chainalysis wrote that a crook lost 60 bitcoins worth about $4.8 million they’d stolen via a so-called task scam.
According to Chainalysis, the address was linked with a con where people were paid to fake sales and reviews of real items. They were told to add their own money in order to get paid — and then stolen from.
But the mastermind behind the task scam moved the stolen money to Ledger addresses which were then targeted by different scammers last week.
“On Sep 22, the person behind the scam moved the proceeds into three separate Ledger addresses,” Chainalysis said. “On Oct 9, thieves emptied all three. One transfer each, into the same wallet. The wallet is reported as stolen funds.”
Paris-based Ledger last week said it had started an investigation after customers in South East Asia reported they’d lost funds after buying from Malaysia-based reseller, CryptoBilis.
Ledger has since said that the scam was a massive organized crime operation where a group installed implants into devices and put them back on the market. The implants could read users’ seed phrases so criminals could then drain wallets.
Calling it one the most “sophisticated attacks” the digital asset industry has experienced, Ledger is yet to reveal how much money has been lost — but blockchain investigator Specter said $86 million had been drained.
And the task scam conman, according to Chainalysis, was one of the victims.
Ledger has said that it is working with law enforcement to “follow the funds and dismantle the attackers’ infrastructure” and has made sure no other vendors have been targeted by scammers.
CryptoBilis has stopped selling Ledger products, the company said.
Criminals have targeted bitcoin hardware sellers this year, with a huge attack taking place in July on the popular Coldcard products.
Crooks were able to steal close to $120 million in bitcoin from Coldcard users because the devices had a firmware bug which led to faulty seed generation, allowing hackers to guess investor seedphrases.
This post Poetic Justice: Scammer Lost $5M in Bitcoin After Being Targeted by Ledger Thieves first appeared on Bitcoin Magazine and is written by Mathew Di Salvo.
Bitcoin Magazine

BFFS26 Denver: Joseph Kelly on Bitcoin Custody and Credit; Alan Lane on Banking Lessons
The Bitcoin for Financial Services Summit (BFFS26) returns to Denver October 20–22, 2026, bringing together CPAs, wealth advisors, attorneys, lenders, and finance leaders who are building Bitcoin into their practices. Now in its second year, the summit has grown to more than 30 sessions across two full program days, with a speaker lineup drawn from the firms defining Bitcoin custody, credit, and advisory.
Headlining the program are Joseph Kelly, CEO and co-founder of Unchained, who opens the summit with a keynote on custody, credit, and trust at scale; Alan Lane, former CEO of Silvergate Bank, on lessons for Bitcoin and banking; Patrick Lowry, CEO of Samara Asset Group, on holding Bitcoin as a public-company treasury reserve; and Colin Crossman, Wyoming’s Deputy Secretary of State, on the regulatory outlook for banks, exchanges, and advisors. Additional speakers include Kate Goldman of Anchorage Digital, Sam Baker of River, Eric Yakes of Epoch Ventures, Daniel Hillery of UTXO Management, Moish Peltz of Falcon Rappaport & Berkman, and CJ Konstantinos of Peoples Reserve.
Sessions focus on practical application: bringing Bitcoin into wealth planning and family offices, Bitcoin-backed lending and mortgages, treasury accounting and valuation, retirement and income planning, charitable giving strategies, mining as an asset class, and fiduciary duty when clients hold Bitcoin. Dedicated workshops will offer continuing education credit for financial advisors and CPAs.
“Last year proved that financial professionals want more than a Bitcoin primer. They want to know how to serve clients who already own it,” said Jordan Guess, CPA, co-host of the summit in a press release shared with Bitcoin Magazine. “This year’s program is built around the questions advisors and accountants are actually getting from clients, answered by the people building the infrastructure.”
The summit opens Tuesday, October 20, with the Better Money Invitational golf tournament at City Park Golf Course, hosted with Bitcoin Sports Network, followed by a welcome party at The Space sponsored by Falcon Rappaport & Berkman. Evening programming includes wine and whiskey tastings, and Thursday begins with an optional sunrise hike in the Rocky Mountains.
BFFS26 is co-hosted by Jordan Guess and Wyatt O’Rourke of BFFS Media, producers of the Bitcoin for Financial Services podcast. Sponsors include Unchained, Anchorage Digital, UTXO Management, River, SOUND HSA, SustainHash, and Stormrake.
Registration is open now at https://www.bffs.media/summit.
Media contact: Wyatt O’Rourke, wyatt@bffs.media
This post BFFS26 Denver: Joseph Kelly on Bitcoin Custody and Credit; Alan Lane on Banking Lessons first appeared on Bitcoin Magazine and is written by Juan Galt.
Bitcoin Magazine
Sazmining Now Sells Jack Dorsey’s Proto Immersion Hashboards
Bitcoin mining just got a lower barrier to entry.
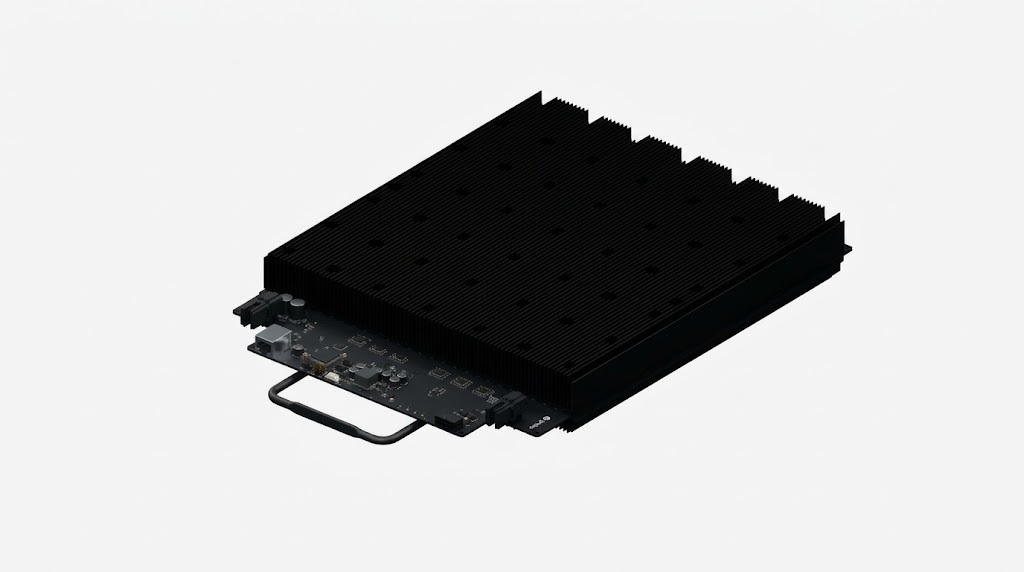
Sazmining announced Thursday that it is now selling Proto’s immersion hashboards directly to individual and institutional buyers through its mining-as-a-service platform. Previously, the hardware was mostly in the hands of large-scale operators.
Each hashboard delivers roughly 200 TH at around 15 J/TH, and buyers own them outright while Sazmining handles deployment, monitoring and maintenance at a US facility. Mining rewards go straight to the owner’s wallet.
The move follows a multi-megawatt supply deal between Sazmining and Proto — the bitcoin mining arm of Jack Dorsey’s Block (NYSE: XYZ) — which both companies expect to expand as demand grows.
“Because of our aligned-incentive model, Sazmining only earns when we produce bitcoin for our clients,” said Kent Halliburton, CEO and co-founder of Sazmining.
He also pitched mining as a form of bitcoin acquisition diversification: rather than paying the market price on the day of purchase, a miner’s costs are spread across the machine’s working life.
Wyoming-based Sazmining, founded in 2018, operates renewable-powered facilities across the US, Paraguay, and Norway. It says its fleet runs more than 20 percentage points ahead of the Bitcoin network’s carbon-free share.
Proto is Jack Dorsey’s Block’s bitcoin mining play. The Twitter founder has spent years arguing bitcoin is the foundation of “a more open financial system,” funding everything from Cash App’s buy-and-send rails to the Bitkey self-custody wallet, and he framed mining as the obvious missing piece back in 2021: “Bitcoin mining should be as easy as plugging a rig into a power source.”
Block formally announced it was building an open bitcoin mining system in January 2022, with the stated aim of making mining “more distributed and efficient.”
This post Sazmining Now Sells Jack Dorsey’s Proto Immersion Hashboards first appeared on Bitcoin Magazine and is written by Mathew Di Salvo.
Bitcoin Magazine

Hot Inflation Data Puts Bitcoin Under Pressure, but ‘Difficult’ Isn’t ‘Bearish’: CoinShares
Bitcoin’s price has dropped this week as new inflation data has come in hot.
But while the largest cryptocurrency’s near-term setup is difficult, it’s not “fundamentally bearish,” according to European asset manager CoinShares’ Head of Research, James Butterfill.
In a report Friday, the analyst said that bitcoin’s near-term challenge stems from a macro environment that’s caught in an awkward middle ground: inflation is too elevated for the Fed to ease up, while the economy is too resilient to force a policy pivot.
“Bitcoin and the broader digital asset market have moved lower on the resulting hawkish repricing, a reminder of how sensitive Bitcoin remains to monetary policy over short horizons,” he wrote.
Bitcoin’s price recently stood at $81,473, down 2% over a seven-day period.
The price of the leading cryptocurrency dropped Wednesday after data showed that U.S. consumer prices shot up more than expected in September.
Then, on Thursday, the Labor Department’s Bureau of Labor Statistics said that U.S. producer prices rose in September at the fastest pace in more than four years.
This has weighed on bitcoin’s price because higher inflation means the Federal Reserve may hike interest rates. Higher borrowing costs can restrict the liquidity the digital coin needs to rally.
The Federal Reserve hiked rates in September and will meet at the end of this month.
But Butterfill added that investors should be patient and advised investors to instead think in the long-term and not react to any single weekly data point.
“For investors, that argues for reading the coming weeks as a data-driven range rather than a trend, and for sizing digital asset exposure against a strategic allocation rather than against this week’s print,” he wrote.
Bitcoin spent the first half of 2026 in a bear market but had its best quarter in years after surging in August and September. Analysts have now said the leading cryptocurrency is now back in a bull market after trading above its 365-day moving average.
This post Hot Inflation Data Puts Bitcoin Under Pressure, but ‘Difficult’ Isn’t ‘Bearish’: CoinShares first appeared on Bitcoin Magazine and is written by Mathew Di Salvo.
Bitcoin Magazine

Deutsche Bank To Debut Bitcoin Custody Within Weeks: Report
German multinational Deutsche Bank is just weeks away from its crypto custody service, according to reports.
The lender — which is Germany’s biggest — also plans to expand the custody platform into Asia next year, according to a Friday Reuters report, which quoted its corporate banking chief.
Top banks worldwide are debuting or planning to debut crypto custody services, with BNY Mellon, State Street, Standard Chartered, U.S. Bank, and Citigroup all committing to direct crypto custody over the past 18 months.
JUST IN:
— Bitcoin Magazine (@BitcoinMagazine) October 16, 2026€732 billion Deutsche Bank to launch Bitcoin custody to its 28 million clients
pic.twitter.com/TAh9EwLkIX
Deutsche Bank first officially announced plans to debut a bitcoin custody service for European corporate and institutional clients in September, with the German multinational at the time saying service was subject to the completion of the applicable regulatory timeline.
Friday’s report added that the service will support custody of major cryptocurrencies such as bitcoin before moving to services that help clients move money into and out of stablecoins.
Gerald Podobnik, co-head of the corporate bank, was quoted by Reuters saying that the financial system will need to “offer tokenized or blockchain solutions.”
A number of top banks have started using the technology that powers bitcoin, the blockchain, for their own products in recent years.
Stablecoins and tokenization in particular have become a hot topic as traditional financial firms aim to accelerate certain services.
Crypto custody is often a starting point for banks moving into the digital asset space. BNY Mellon in 2022 became the first major U.S. bank to offer digital asset custody services.
Banks like Citi and Standard Chartered have this year debuted or announced plans for bitcoin custody around the world.
This post Deutsche Bank To Debut Bitcoin Custody Within Weeks: Report first appeared on Bitcoin Magazine and is written by Mathew Di Salvo.
CryptoSlate
The crypto industry has finally found a way to participate in America's partisan warfare without committing to either of the (only) two available parties: help elect people who agree with it about crypto, then let them argue about everything else. Fairshake's latest House spending plans cover 32 candidates, with 19 Republicans and 13 Democrats on…
Read the full story on CryptoSlate
Understand the crypto stories that matter and what to watch next. Get The Catalyst in your inbox
Two tracked Ethereum V3 Umbrella stakes fell 9.7%, while their implied annualized reward run rate stayed near $2 million.
Read the full story on CryptoSlate
Understand the crypto stories that matter and what to watch next. Get The Catalyst in your inbox
On October 17, JUST, the leading DeFi infrastructure in the TRON ecosystem, announced the completion of its fifth buyback and burn of its native token JST as scheduled. Over 170M JST were burned in this round (approx. 1.72% of total supply), backed by nearly $23.53M in capital deployed—all funded directly by JustLend DAO's net operating…
Read the full story on CryptoSlate
Understand the crypto stories that matter and what to watch next. Get The Catalyst in your inbox
Cboe's rules cover Coinbase trading volume and MARA Bitcoin output, with separate procedures for missing or delayed figures.
Read the full story on CryptoSlate
Understand the crypto stories that matter and what to watch next. Get The Catalyst in your inbox
Anthropic’s timestamp recipe reconstructs P-256’s public seed, adding provenance evidence while leaving selection criteria and base-point origins unexplained.
Read the full story on CryptoSlate
Understand the crypto stories that matter and what to watch next. Get The Catalyst in your inbox
CryptoTicker.io
Chainlink announced a partnership with the Tokyo advisory firm Pacific Meta on October 16. Pacific Meta will use the Cross-Chain Interoperability Protocol, CCIP for short, as its preferred solution for the Japanese financial sector and additionally takes the Automated Compliance Engine, ACE for short, into its partner offering. The price acknowledged the news with nothing: Chainlink traded at $11.76 on Sunday afternoon, 2.06 percent below the previous day.
That discrepancy is the real subject of this piece. Since the beginning of October, Chainlink has reported integrations, protocol launches and institutional agreements at a weekly rhythm, and the token has lost ground regardless. Further down is a simple calculation showing why that is no contradiction but a question of magnitude.
What Pacific Meta and Chainlink agreed on October 16
Pacific Meta is a consultancy based in Minato-ku, Tokyo, founded on August 10, 2022. Its managing director is Shota Iwasaki. By its own account the firm has supported more than 300 projects in more than 41 countries. This is not its first collaboration with Chainlink Labs: a first cooperation came in 2023, then covering Web3 services and gaming.
The new agreement covers three fields: tokenised financial products, identity on the blockchain and compliance infrastructure. CCIP is declared the preferred solution for transferring tokenised assets between different blockchains. ACE is listed in Pacific Meta's partner offering, which means it is presented to Japanese institutions as a finished building block. Crypto Briefing reported this on October 16, citing the statement from both firms.
Two terms run through this text. Tokenisation means that an asset, a bond or a fund unit for instance, is issued as an entry on a blockchain instead of a booking at a custodian. Interoperability means that such an entry can move from one blockchain to another without anyone rebooking it by hand along the way.
ACE: the rule moves into the transfer
The Automated Compliance Engine is Chainlink's answer to a problem familiar to every bank considering tokenised securities. A fund unit may not go to just anyone. Depending on the product, the buyer needs a completed identity check, residence in an approved country, sometimes the status of a professional investor. Today an employee or a downstream system checks that before an order is executed.
ACE moves that check into the transfer itself. Chainlink words the promise on its ACE product page like this: set compliance rules once and enforce them everywhere. A transfer that breaches a stored rule never comes about in the first place, regardless of which blockchain it takes place on.

CCID, Policy Manager and ERC-3643: the building blocks in detail
ACE is no single program but a kit. Chainlink names five parts on its product page, and each of them solves a different sub-task.
The Cross-Chain Identity Framework, CCID for short, maps an investor's identity across blockchains. It stores cryptographic proof that a check has taken place, an identity check under anti-money-laundering rules for instance. What matters is what it does not store: the personal data itself stays off the blockchain. All that sits there is the proof that the check was passed.
The Policy Manager is the rules engine. Here an issuer sets out which conditions a recipient has to meet. The rules can run on the blockchain or off it, depending on how much confidentiality the product demands. Chainlink ships prefabricated modules with it, allow and block lists or volume limits for example.
The Cross-Chain Token Compliance Extension is the interface through which any token can use these functions without being rebuilt from the ground up. The Identity Manager administers the life cycle of the proofs, meaning issuance, distribution and revocation. The Monitoring and Reporting Manager watches ongoing operations and produces the reports a supervisor wants to see.
Then there is a detail that makes specialists sit up: ACE works with the ERC-3643 standard. That is the most widely used norm for tokens with built-in transfer restrictions, precisely the form in which tokenised securities are issued today. Chainlink is therefore not building its own island but relying on something issuers already use.
Japan, Tokyo and the timing of the announcement
Japan is no arbitrary market for tokenised securities. The country regulated the issuance of digital securities early in its financial market law, and large houses have been working on tokenised bonds and property funds for years. Anyone wanting to offer products there needs compliance tooling that maps the Japanese requirements, and needs it before the first product goes live.
In this constellation Pacific Meta is not an issuer but an intermediary. The firm advises companies entering blockchain applications and, by its own account, maintains relationships with large names in telecommunications, consumer electronics and digital advertising. What Chainlink gains is therefore not a customer but a distributor.
What the announcement lacks: no customers, no deadlines
This is where the counter-check is worth making, and it comes out clearly. The statement names not a single Japanese institution that actually uses ACE or CCIP. Neither a launch date nor a product nor a timetable is given, and no volume and no financial terms either. Crypto Briefing describes the agreement as the designation of a preferred solution, a listing in a marketplace and a business development deal, explicitly not as a series of running installations.
That is no reproach but a piece of context. Agreements of this kind stand at the beginning, not at the end. For valuing the token, though, it means this: for the time being no additional protocol revenue follows from this announcement, and therefore no additional demand for LINK. Anyone buying today is buying a declaration of intent.

LINK at $11.76: the calculation that explains October
Now to the figure that explains the gap between the news flow and the price. Our report of October 16 stated that the Chainlink Reserve had bought 431,900 LINK within 30 days. That number sounds large. Measured against the market it is not.
431,900 LINK spread over 30 days works out at around 14,400 LINK a day. At Sunday afternoon's price of $11.76 that corresponds to a daily purchase volume of about $169,000. LINK's daily turnover at the same time was around $247.7 million. The reserve therefore buys just under 0.07 percent of daily trading volume.
That names the mechanism which gets lost in the month's headlines. A buyer taking less than a thousandth of daily turnover moves no price. It carries no weight even when the buying happens reliably every day. What moves the price are inflows and outflows on the scale of trading volume, and those currently come from the broad market, not from the project's own treasury.
For context, Sunday's remaining key figures, all from CoinGecko: the market value of all LINK stood at around $9.01 billion. The price is 77.7 percent away from its record of $52.70.
What has happened since the reserve report of October 16
Anyone following our coverage over the past week can read the development off two levels. On October 15, when Chainlink's data feeds went live on Stellar, LINK stood at $12.13 according to our report. On Sunday afternoon it was $11.76, a fall of 3.05 percent in three days. In between, on October 16, came the reserve's purchase, and on that day too the price gave way.
The $12 level has therefore not held. That mark was the most frequently cited holding point in last week's analyses, among them at KuCoin, which quoted the chartist Ali Charts warning of a head-and-shoulders pattern in the four-hour chart. That reading belongs to the analyst, not to us. A confirmed break requires, by the common interpretation, a daily close below the level, and there is none as of Sunday afternoon. The next catching points named in those analyses lie at $11.72 and $11.46.
The finding holds even without a forecast: three positive infrastructure announcements within four days, the Stellar launch, the reserve's purchase and now Japan, have together produced no rising price. Anyone who has read the series as a buying argument so far should set the calculation from the previous section alongside it. What lies behind the purchase and how it is financed is set out in our analysis of the Chainlink Reserve of October 16.
Our assessment: infrastructure does not pay in day-to-day trading
In the view of this desk, ACE is the technically most interesting announcement Chainlink has made this quarter and at the same time the one with the smallest immediate price effect. Three pieces of evidence in this text speak for that. First, ACE builds on ERC-3643, the standard issuers of tokenised securities use anyway; that lowers the hurdle to adoption considerably. Second, the Japan announcement names not a single pilot customer and no date. Third, the reserve calculation shows, at around 0.07 percent of daily turnover, how little buying pressure comes from the project itself.
The timeline speaks against it. Compliance infrastructure is bought before products come into being, not afterwards. Should a larger tokenised fund build on ACE in Japan next year, today's contract would have been the precondition for it. Only that case cannot be evidenced today, and what cannot be evidenced we do not treat as fact. This is explicitly not a buying recommendation: with crypto assets, a total loss is possible.
What ACE changes for you in Germany
You cannot buy ACE directly, it is a product for issuers and institutions. Indirectly it touches you at two points.
The first is the range of products. The easier it becomes for fund companies to issue units as tokens, the sooner such products turn up at European providers too. The technology behind it helps decide whether a unit lives only within one platform or can move between custodians.
The second is supervision. What ACE automates technically is what the European crypto regulation MiCA demands of licensed providers anyway: identity checks, proof of origin, documentation. We have put together an overview of the MiCA licensing obligations, setting out which duties those are in detail and which deadlines apply to providers. In practice it means this: a provider without a licence may not render you a crypto service in Germany, and whether it holds one is something you can look up yourself.
How to check your provider's licence
The route takes a few minutes and demands no specialist knowledge.
- Look up the full company name. It appears in the platform's legal notice, not in the brand name of the app. The two often differ, because the operator is a company in another EU country.
- Look it up in BaFin's company database. The supervisor maintains a register of supervised companies at portal.mvp.bafin.de. If you do not find the name there, check whether the provider operates under the licence of a company in another EU state. That is permitted and has to appear in the legal notice.
- Consider custody separately. A licence says who may trade, not where your tokens sit. Anyone holding larger amounts separates trading from custody and puts the tokens on their own hardware. Which devices suit that and what they cost is in our hardware wallet comparison.
If you are looking for a platform with a European licence for the purchase itself, our overview of regulated crypto exchanges helps with the shortlist. Check the fees directly with the provider in any case, they change more often than any overview.
The open points until the end of the year
Three things decide whether the Japan announcement becomes more than a line in the annual review. First: does Pacific Meta name an institution using ACE before the year is out? Without a name it stays a declaration of intent. Second: does a product with volume arrive, a tokenised fund or a bond of appreciable size? Third: does the reserve stay at its current pace, or does the purchase volume rise to a magnitude that becomes visible in daily turnover?
All three points can be checked, and that is what separates them from a forecast. We will follow them in our continuing coverage.
Chainlink and ACE: without a pilot customer the Japan news stays a promise
The position on October 18 can be summed up in three sentences. Chainlink has a compliance tool in the market with ACE, one that builds on the established ERC-3643 standard and is now offered to Japanese institutions through Pacific Meta. The contract is evidenced, its effect is not: no customer, no date, no volume. And the token meanwhile follows the broad market, because the project's own purchases, at around 0.07 percent of daily turnover, are too small to achieve anything else.
(As of October 18, 2026. This article is not investment advice. Prices and fee structures change; check the terms with the provider before you buy.)
The XRP Ledger destroyed 398.19 XRP for good on Sunday. That is no estimate but the difference between two closed ledgers: early on Saturday afternoon the network showed 99,985,590,096.59 XRP, by Sunday afternoon 99,985,589,698.40. On November 1 the counter-movement arrives, when the escrow contracts open and release 1 billion XRP.
A factor of 2.5 million separates those two figures. Where the price can point over a horizon of months is set out in our XRP price prediction. This piece takes on the supply side, with numbers that come straight from the blockchain and that nobody else reports in this form.
Ledger 107,739,858: what the XRP Ledger shows on Sunday afternoon
Every closed ledger carries a field called total_coins. It states how many XRP exist at that moment. In the ledger numbered 107,739,858, closed early on Sunday afternoon, the value reads 99,985,589,698.399227 XRP.
The network started in 2012 with exactly 100 billion XRP. There can never be more, because the XRP Ledger has no way of issuing new units. Only the reverse route exists: every transaction costs a fee, and that fee goes to nobody. The amount disappears from total supply.
XRP trades at $1.29 on Sunday afternoon, 0.26 percent below its level 24 hours earlier. The daily high was $1.30, the daily low $1.27. Market capitalisation stands at $81.69 billion on daily turnover of $1.01 billion, which makes it fifth in the market. It remains 64.7 percent short of its record of $3.65 from July 2025.
14,410,301 XRP since 2012: the network's entire fee burn
The 100 billion at launch and today's ledger reading give the full balance: 14,410,301.60 XRP have been burned since day one. Across fourteen years of operation and more than 107 million closed ledgers.
Measured against the launch supply, that is 0.0144 percent. Measured against today's circulating supply of 63.13 billion XRP, it is 0.0228 percent. At the current price, the entire burn of those fourteen years comes to the equivalent of around $18.6 million. On the exchanges a comparable sum changes hands in about 27 minutes on a quiet Sunday.
That figure rarely appears in articles about XRP, because nobody publishes it separately. It can only be read off by subtracting the current ledger reading from the launch supply.
398 XRP in a day: the measured drain on total supply
The pace tells you more than the cumulative balance. For that, older ledgers can be pulled from the archive and their total_coins field compared with today's reading.
Over the past 24 hours the network destroyed 398.19 XRP. Across seven days it was 2,840.98 XRP, across thirty days 24,271.14 XRP. At a price of $1.29 that comes to $514 a day and $31,310 a month.
Per closed ledger, 0.018 XRP of that remains. The monthly figure of 24,271 XRP equals 0.0000384 percent of circulating supply. At this pace it takes a good 41,000 months to burn a single billion XRP.

Ten drops base fee and one XRP in reserve: how the burn works
One XRP divides into a million drops. The base fee on a simple payment is ten drops, or 0.00001 XRP. Unlike Bitcoin or Ethereum, that fee reaches neither a validator nor a miner. It is struck from total supply instead and is therefore gone.
The reason is technical and has nothing to do with the price. The fee is there to prevent spam: anyone wanting to flood the network with millions of empty transactions has to destroy real money to do it. The rules are set out in the network's developer documentation on the transaction cost.
Then there is the minimum reserve. A new account on the XRP Ledger has to hold 1 XRP permanently, and every additional object such as a trust line or an open trading order ties up a further 0.2 XRP. That reserve is not burned, but it is locked for as long as the account exists. If you move XRP from an exchange to your own wallet, factor in that one XRP, or the account stays unusable. The details are in the documentation on reserves.
194 drops per transaction: more than the base fee demands
Sunday's 398.19 XRP amount to 39.8 million drops. At ten drops per transaction that would be almost four million transactions. There were not that many.
A sample of twelve ledgers spread evenly across the 24 hours gives an average of 92.4 transactions per ledger. With 22,154 ledgers closed that day, that works out at around 2.05 million transactions. From that follows an average fee paid of roughly 194 drops, about nineteen times the minimum rate. The transaction count is an extrapolation from that sample, while the burned quantity is measured exactly.
The premium has two causes. For one, the fee rises automatically as soon as a ledger is heavily loaded. For another, certain operations cost more than a simple payment: creating an account, cancelling an escrow contract or collecting several signatures all register a multiple. The network's load factor stood at one on Sunday, its resting value.
1.44 percent of a monthly release: how small the burn is next to the escrow
That is what makes the arithmetic revealing. As our escrow analysis of October 17 set out, escrow contracts from 2017 open again on November 1 and release 1 billion XRP. Net of the customary re-locks, around 300 million XRP of that most recently stayed in circulation.
Against that stand 24,271 XRP burned in a month. To take just the net quantity of a single monthly release back out of the world, the network would need 12,360 months at today's pace. That is 1,030 years. For the full billion it would be 3,433 years.
Turned around: everything the XRP Ledger has burned in fourteen years of operation equals 1.44 percent of a single monthly release. The 14.4 million XRP burned since 2012 face 1,000 million on one November day.
Why deflationary is the wrong description for the XRP Ledger
In forums and in promotional copy you regularly read that XRP is deflationary because the supply falls with every transaction. Formally the second half of that sentence holds. Total supply does fall, and it can never rise again.
Economically the claim still does not carry. What counts for a price is not theoretical total supply but tradable supply. And that grows, because hundreds of millions of XRP move from escrow into circulation every month while the burn stays in the tens of thousands. Both movements run at the same time, yet they sit four orders of magnitude apart.
An image makes the ratio tangible. If the monthly release were a full freight train, the monthly burn would be a handful of gravel on one of its wagons.
Since Saturday's escrow analysis: two cents lower, 398 XRP fewer
On Saturday morning XRP traded at $1.31, when we described the escrow mechanics and the 55 contracts from 2017. Two cents have come off since then, and the price stands at $1.29.
The $1.29 level named there as the lower edge has therefore been reached, though not durably broken. The daily low of $1.27 sat below it, after which the price turned back up. Added over these good 28 hours are 398 burned XRP and around 2.4 million transactions.

The 200-day line at $1.28: one cent below the price
Two hundred daily closes give an average of $1.2799. The current price sits 0.8 percent above it, around one cent. To the downside that is the next level with a basis, and it almost coincides with the sixty-day low of $1.2682 from August 21. Two levels derived independently at the same spot weigh more than one.
Upwards the picture differs. The 30-day line sits at $1.4437, the 50-day line at $1.4147 and the 7-day line at $1.3239. The price stands below all three. The sixty-day high of $1.5713 from September 23 is 21.8 percent away.
The nearest hurdle is therefore the 7-day line at $1.32, not three cents away. Above that, the next level that can be justified only begins at $1.41.
Our view: the burn does not carry the price
Our assessment: the fee burn does not work as a price argument for XRP, and the numbers in this piece show that in both directions. 24,271 XRP a month against 300 million net from escrow gives a ratio of one to 12,360. Anyone buying XRP for a shrinking supply is buying a property that, at this pace, never takes effect within an investing lifetime.
A fair objection belongs alongside it. The argument turns if network load rises durably. The average fee paid on Sunday was nineteen times the minimum rate even though the load factor sat at its resting value. A network with ten times the transactions and periodically high fees would produce different numbers. That case has not been measured so far, it is hoped for. What is measurable today is set out above.
The price over the next two weeks is therefore moved by the known quantities: November 1 with the release, the fund flows and the level at $1.28. The burn is not among them. With any cryptocurrency, a total loss is also possible.
Holding twelve months: what the anniversary of the purchase decides for tax
For investors in Germany, more hangs on the calendar than on the supply arithmetic. In private assets, XRP falls under private disposals pursuant to Paragraph 23 of the German Income Tax Act. Hold a position for longer than twelve months and sell it afterwards, and no tax is due on the gain.
Within the twelve months an exemption threshold of 1,000 euros a year applies to all private disposals taken together. Go above it and the full gain is taxed at your personal rate, not only the part above the threshold. Losses from the same year can be set against it, though only within this category of income. How the legislator intends to proceed with the one-year period is something we track continuously in the status of the holding-period reform.
In practice that means anyone who bought XRP in October or November 2025 reaches the anniversary in these weeks. For such positions, a sale after the cut-off date changes the tax bill, regardless of what happens with the escrow on November 1. The purchase date appears on the exchange statement; where there were several purchases, the order of acquisition applies.
XRP burn: 1,030 years for one monthly release
The supply side of XRP can be summed up in one sentence this Sunday: the network destroys 398 XRP a day and gets 1 billion back into circulation on November 1. Three steps follow from that:
- Look up the purchase date. If the first purchase is more than twelve months back, a sale is tax free and the decision hangs on the price alone. The programs that document this allocation cleanly across several purchases are in the comparison of crypto tax tools.
- Note the level at $1.28. The 200-day line and the sixty-day low from August 21 sit close together there. If the price falls below it, the next level with a basis is far away. Anyone looking to build or reduce a position compares the fees beforehand in the overview of crypto exchanges.
- Budget for one XRP in reserve. Moving from an exchange to your own wallet costs 1 XRP as a minimum reserve plus 0.2 XRP for every further object. Which devices support XRP is shown by the comparison of hardware wallets.
(As of October 18, 2026. This article is not investment advice. Prices and fee structures change; check the terms with the provider before you buy.)
US crypto ETFs shed a net $610.7 million in the week of October 12 to 16, 2026. Most of that came from the Ethereum funds rather than the Bitcoin funds: $320.1 million flowed out of them, and $299 million of that came from a single product, BlackRock's iShares Ethereum Trust. That is 93.4 percent of the entire Ethereum outflow from one fund.
That distribution is the real finding of the week. A number like „$320 million in outflows“ sounds like a broad retreat by many investors. When 93 percent of it comes from one product, the picture changes: a single large position moved, while the market as a whole stayed put. If you hold crypto in Germany, that changes how you read the number, and it changes nothing about the fact that these funds help set the price you pay when you buy.
The week in numbers: $610.7 million out of five fund groups
The basis is the daily data from Farside Investors, which crypto.news aggregated for the five fund groups it tracks. Across the five trading days of the week, the net outflow came to $610.7 million. In the previous week, October 5 to 9, the figure had been $1.2863 billion. Weekly outflows have therefore roughly halved, down 52.5 percent to be precise.
That is the first point the headline swallows: in absolute terms the week was considerably calmer than the one before it. Anyone who sees only the $610.7 million reads October as an escalation. The outflow has in fact weakened.
Ethereum ETFs: $320.1 million out, $299 million of it from one fund
Net outflows from the Ethereum funds added up to $320.1 million. Ethereum traded at around $2,422 on Sunday morning, some 3.6 percent lower over seven days.
The breakdown by provider is unusually lopsided:
- BlackRock, iShares Ethereum Trust (ETHA): $299 million out
- Grayscale Ethereum Trust (ETHE): $18.3 million out
- Grayscale Ethereum Mini Trust: $12.4 million out
- Franklin Templeton (EZET): $0.9 million out
- Fidelity (FETH): $10.5 million in
What the numbers from the other providers show
Strip out BlackRock and around $21 million in net outflows remain across all the other Ethereum funds combined, and one of them, Fidelity, actually took in money in the same week. This is no picture of investors heading for the door together. It is the picture of one large position being wound down while the rest of the field barely moved.
Who stands behind it cannot be read from the flow data. It shows how much money goes into a fund and comes out of it, not who moves it. Attributing the move to any particular investor would be speculation at this point.
Bitcoin ETFs lost $228.4 million and still had the strongest single day
The Bitcoin funds recorded $228.4 million in net outflows, less than the Ethereum funds. Here too BlackRock carried the largest single item: $165.4 million left the iShares Bitcoin Trust (IBIT), $60.2 million Fidelity's FBTC, $7.6 million the Grayscale Bitcoin Mini Trust and $4.1 million Invesco's BTCO. Morgan Stanley's MSBT booked inflows of $6.7 million and Bitwise's BITB $2.2 million.
Tuesday stands out. On that one day the Bitcoin funds took in $175.7 million, their strongest day of the week. Bitcoin stood at around $82,100 on Sunday morning. A weekly total smooths such swings away; they matter for context, because they show that the direction changed several times within the week.

Net outflow explained: when more shares are redeemed than issued
A net outflow is the difference between the money newly paid into a fund and the money investors pull back out by redeeming shares. When it turns negative, the fund has lost assets over the period on balance.
In practice that means a spot ETF, a fund that actually holds the cryptocurrency instead of tracking it through futures contracts, has to sell corresponding holdings when shares are redeemed. Outflows therefore translate into real selling pressure in the market. That is exactly why these numbers are watched by investors who have never owned a fund share.
The caveat runs the other way: an outflow says nothing about motive. A switch between two products, a hedge, profit taking and a decision to get out altogether all look identical in the statistics.
CoinShares counts $434 million in outflows worldwide
Alongside the US figures sits the weekly fund statistic from CoinShares, which is collected globally and cut differently. For the reporting week to October 16, 2026, the firm reports a net outflow of $434 million from crypto fund products; the series sits in CoinShares' research section.
The two numbers do not contradict each other, they measure different things. The $610.7 million refers to five US fund groups and the trading days from October 12 to 16. The $434 million covers products worldwide, European exchange-traded products included, and a slightly different cut-off date. Anyone placing the two values side by side should neither add them up nor play them against each other.
The trigger does not lie in the crypto market: 3.7 percent inflation
CoinShares traces the outflows to US consumer prices. The September reading, published by the US Labor Department on October 14, came in at 3.7 percent against the previous year. August had been 3.4 percent, and 3.6 percent had been expected. Month on month, prices rose 0.6 percent, driven above all by energy: petrol became 9.1 percent more expensive in September, the energy component as a whole 5.2 percent against the previous month and 20.4 percent against the previous year.
The core rate excluding food and energy was more moderate at 0.3 percent on the month and 2.6 percent on the year, but that too was above the August figure of 2.4 percent. A day later came retail sales of $745 billion, up 0.8 percent on the month against an expected 0.3 percent, plus producer prices up 1.3 percent on the month.
What the market is pricing in for the October meeting
That data argues against rate cuts. The US Federal Reserve raised its key rate by 25 basis points in September to a range of 3.75 to 4.00 percent. John Williams, president of the New York Fed, said on October 13 that a further increase could be appropriate before the end of the year. On the prediction platform Polymarket, the probability of unchanged rates at the October meeting stood at around 75 percent on October 15, with 25 percent on a quarter-point rise. These figures and the interpretation come from the analysis linked above.
For crypto assets that is the unfavourable case. Rates that rise or stay high make interest-bearing investments more attractive and pull capital away from asset classes with no running yield. The outflows coinciding with a week of three uncomfortable economic releases is therefore no chance observation.
Solana, Zcash and Hyperliquid lose $62.2 million between them
The smaller fund groups moved in the same direction. $25.5 million flowed out of the Solana products, on every single trading day of the week, and $18.8 million of that came from Bitwise's BSOL. The previous week had seen $25 million, so the outflow stayed practically constant. The Zcash funds lost $19.2 million and the Hyperliquid products $17.5 million, split across BHYP with $6.4 million, THYP with $8.5 million and HYPG with $2.6 million. Together that makes $62.2 million.
The finding behind it: there was no group this week that the money moved into instead. A rotation between cryptocurrencies looks different. An outflow in one place is then matched by an inflow somewhere else.

Investors in Germany do not buy these US funds at all
This is where the news becomes practical. The funds discussed above are spot ETFs approved in the United States. In Germany they are not regularly available to retail investors, because they lack the securities information that EU distribution rules require. On top of that, EU fund law requires a fund to hold several assets as a matter of principle, and a product tracking a single cryptocurrency does not fit that form.
What exists instead are exchange-traded notes and commodity products: ETNs and ETPs, usually physically backed with the cryptocurrency in question and tradable through the usual custodian banks. Which routes are open to you and how they differ is set out in the overview of crypto ETFs in Germany.
The US numbers still concern you. The large funds trade on the same spot markets where your ETN issuer covers its holdings. Selling pressure of several hundred million dollars therefore feeds through to the price, whatever wrapper you are invested in.
ETN, ETP or direct holding: the wrapper decides the tax
The second German difference is fiscal, and over the years it often weighs more heavily than the fee. Hold a cryptocurrency directly, in your own wallet or in an account at an exchange, and it counts as a private disposal under Paragraph 23 of the German Income Tax Act. After a holding period of one year, the gain on a sale is tax free.
With an ETN, the treatment depends on how the paper is built. Many physically backed products provide a delivery claim on the cryptocurrency held and are therefore also placed under Paragraph 23 by the tax authorities, with the same one-year period. Other products without that claim count as a capital claim; the 25 percent withholding tax then applies, plus the solidarity surcharge and church tax where relevant, and a holding period does not help.
Why the wrapper is worth clarifying before the purchase
The classification cannot be changed after the fact. It appears in the issuer's product documents, usually under the heading of delivery claim or redemption right. Two papers on the same cryptocurrency can be built differently here. For larger amounts this is a case for tax advice; the documentation of holding periods is handled by tax and portfolio tools that record purchases and sales with dates.
What the outflows have done to the price so far
The link between fund flows and price exists, but it is looser than the coverage often suggests. Ethereum has lost around 3.6 percent over seven days, Bitcoin about 1.5 percent. Both figures sit within the range of a normal weekly swing, even though hundreds of millions of dollars flowed out in the same week.
That is plausible. Measured against the daily trading volume of the two largest cryptocurrencies, a few hundred million dollars is no sum that carries the market on its own. Fund flows are a signal about how institutional investors are currently positioned. They are no reliable price indicator for the days ahead, and using them as one mistakes the accompaniment for the cause.
The dates that will shape the next stretch
Two dates structure the coming weeks. The first is the October meeting of the US Federal Reserve, whose outcome decides the rate path to the end of the year and for which the market has lately expected unchanged rates. The second is the next weekly statistic from CoinShares, which will show whether four weeks of outflows turn into a run or whether the direction turns.
For reading the next figure, the distribution is worth more than the total. If the outflow is again concentrated in one product, that confirms this week's reading. If it spreads broadly across many providers, that is the considerably more serious signal.
Ethereum ETFs: 93 percent of the weekly outflow comes from one fund
The week of October 12 to 16 was not a flight by many but the movement of a single large position, against the backdrop of an inflation rate of 3.7 percent. Three steps turn that into something concrete:
- Clarify the wrapper before the amount grows. Use the product documents to establish whether your ETN provides a delivery claim, and compare the running costs with buying directly on a regulated crypto exchange. Over several years that question decides more money than any weekly statistic.
- Separate purchases from the news cycle. Anyone building a position over months has no need to react to a fund statistic. A fixed rhythm through a savings plan takes that decision out of the week.
- Match custody to your time horizon. Holdings meant to sit for more than a year do not belong permanently in an exchange account. A hardware wallet separates the long-term portfolio from the trading balance.
(As of October 18, 2026. This article is not investment advice. Prices and fee structures change; check the terms with the provider before you buy.)
The Dogecoin network paid its miners 13.82 million new DOGE in the 24 hours to Sunday midday, worth about $1.10 million at the Sunday midday price. Users of the blockchain sent roughly $581 in transaction fees over the same period. That puts the fee share of miner revenue at 0.05 percent, with the remaining 99.95 percent coming out of freshly issued coins. Anyone holding Dogecoin pays for the security of the blockchain through that issuance rather than at the moment of a transfer, and the issuance thins their own share of the supply by a good three percent every year.
Network data from the service Blockchair shows 1,382 blocks found in that period, 58 short of the 1,440 that a one-minute target block time implies. The most recent block carried height 6,420,206. DOGE traded at $0.079357, or €0.070631, at Sunday midday, after about $0.0804 on Saturday. Over a week it is down 6.96 percent, over a year 57.71 percent.
Block Reward and Transaction Fees: What Makes Up Miner Revenue
Miners in a proof-of-work network earn from two pots. The first pot is the block reward: a set amount of new coins that the protocol creates with every block found and credits to whoever found it. The second pot is the transaction fees that users attach to their transfers so a miner includes them in the next block. Both pots together are the security budget of a blockchain. That budget decides how much computing power is worth deploying and how expensive an attack on the ordering of blocks would be.
At Dogecoin the balance between the two is extreme. 1,382 blocks times 10,000 DOGE gives the 13.82 million new coins of the day. Against that stand 22,766 transactions at an average fee of $0.0255, the $581 mentioned above. Annualised, that is roughly $212,000 from fees against roughly $417 million from issuance.
10,000 DOGE per Block: Dogecoin Has No Halving
The decisive difference from Bitcoin lies in how long the reward lasts, not in its size. Bitcoin halves its block reward roughly every four years until it runs towards zero. Dogecoin dropped that mechanism in 2014 and wrote the reward into the protocol at 10,000 DOGE per block, permanently and with no end date. The project describes this issuance on its own project page as a deliberate choice for a means of payment that replaces lost coins and keeps fees low.
On the arithmetic, the fixed reward means 1,440 blocks a day and therefore 5.256 billion new DOGE a year. Against a supply of 156.37 billion DOGE that is 3.36 percent a year. Because the network ran slightly slower over the 24 hours measured, it came out at an annualised 5.04 billion and thus 3.23 percent. The range between 3.23 and 3.36 percent is the pace at which new coins appear, whether the price rises or falls.
Why the Block Count Varies
Dogecoin adjusts its difficulty after every block, where Bitcoin waits two weeks. If computing power drops away, the network takes longer than a minute per block for a short while, until the adjustment takes hold. Difficulty stood at 38,720,114 on Sunday and the hash rate averaged 2.68 petahash per second over the day. That is where the gap of 58 blocks comes from: about 580,000 fewer DOGE were created that day than the nominal figure.

The Fee Share on the Network: 0.05 Percent at Dogecoin, 0.489 Percent at Bitcoin
The comparison with Bitcoin puts the number in context, and it does not flatter Dogecoin. Bitcoin came to 141 blocks in the 24 hours to Sunday midday, 440.625 new BTC worth about $36.17 million, and 678,525 transactions at an average fee of $0.2618. That works out at roughly $177,700 in fees and a fee share of 0.489 percent of miner revenue, about nine times the Dogecoin figure.
Both figures are low, and both networks currently live off their issuance. The difference is the direction of travel. At Bitcoin the reward falls with every halving, so the fee share has to rise or the budget shrinks. At Dogecoin the reward stays where it is, and the fee share can stay small without the network noticing. For investors, that means the low fees at Dogecoin are a consequence of permanent issuance, not a mark of efficiency.
Merged Mining With Litecoin: Where the 2.68 Petahash per Second Come From
A security budget that is 99.95 percent new coins sounds like an acute problem. That it is not comes down to a feature many accounts skip over: Dogecoin has been merge mined with Litecoin since 2014. Both networks use the Scrypt hashing algorithm, and a miner can work on Litecoin blocks and Dogecoin blocks at once with the same effort. Merged mining means the computing power is supplied once and rewarded twice.
In Sunday's numbers: Litecoin averaged 2.47 petahash per second over the day, Dogecoin 2.68. Litecoin paid out rewards worth about $219,000 on the same day, Dogecoin five times that at $1.10 million. A large part of the security of Dogecoin therefore arises as a by-product of another blockchain, and Dogecoin is by now the larger payer of the two. The fee share at Litecoin itself, 0.213 percent, sits between Bitcoin and Dogecoin.
The Point for Holders
The computing power behind Dogecoin rests on a calculation a miner makes across both networks together. If the price of either coin slumps, the shared work becomes less attractive, and that hits both. There is a second angle alongside the chart: the robustness of the network turns on demand for DOGE and on what Litecoin is worth in the market.
3.36 Percent Dilution a Year: The Share of the Supply Shrinks on Its Own
For a holder the issuance is a figure in their own portfolio, not an abstract protocol number. A holding of 10,000 DOGE comes to $793.81, or €706.31, on Sunday. It accounts for 0.0000064 percent of the supply. If 5.256 billion DOGE are added over a year and the holding itself does not change, that share falls by 3.25 percent. The holding stays the same size; the cake grows.
This calculation says nothing about the price. It says something about the load the price has to carry: for a holding to keep the same value in euros, demand has to grow each year by the amount the new coins represent, so at today's $417 million a year by a good $1.1 million a day. Bitcoin needs 0.80 percent a year for that, Dogecoin four times as much.
Our assessment: the issuance is the most predictable item in the Dogecoin calculation, and the one mentioned least often in day-to-day coverage. The evidence is the block count of 1,382 on Sunday, the fixed 10,000 DOGE per block and the supply of 156.37 billion, which together give the 3.23 to 3.36 percent. Against it stands the argument that fixed issuance can make good sense for a means of payment, because it keeps fees low and replaces lost coins. None of this is a buy recommendation in either direction; it is the number that belongs in a holding plan running over several years.

Median Fee of 0.0707 DOGE: What a Transfer on the Network Really Costs
The low fee side has a practical flip side for holders, and it can be put in euros. The median fee on a Dogecoin transfer stood at 0.0707 DOGE on Sunday, about half a cent. The mempool, the queue of unconfirmed transfers, held 39 transactions and 10,739 bytes, so there was effectively no backlog that would have called for a higher fee. On-chain volume that day was 11.28 billion DOGE, around $895 million, while exchanges turned over $425 million.
What an exchange charges for a withdrawal has nothing to do with that half cent. The withdrawal fee is a price set by the provider, not a network fee, and at DOGE it is usually several times higher. On small amounts that difference is the bigger cost block, so it pays to look at the fee schedule of your own provider before withdrawing, and to bundle several planned withdrawals into one. Which providers in Germany charge what is set out in the overview of the best crypto exchanges. The network side can be checked at any time, for instance through the fee and block charts at BitInfoCharts.
Holding for a Year: Holding Period, Loss Offsetting and the Tax Threshold
For investors in Germany the dilution leads to a question that tax law answers. DOGE counts as another asset within the meaning of section 23 of the German Income Tax Act. Sell within a year of buying and the gain is taxable as a private disposal, at your personal income tax rate. Once a year has passed the gain is tax free. For 2026 the threshold for all private disposals together is 1,000 euros; once it is exceeded the entire gain is taxable, not only the part above it.
In practical terms, with a 57.71 percent loss over the year: anyone selling DOGE at a loss inside the one-year window can offset that loss against gains from other private disposals in the same year, from other coins or from gold, for instance. Anyone who waits the window out loses that option, because after the deadline a loss counts for tax as little as a gain. The decision on when to sell is therefore also a tax decision, and it assumes that the acquisition dates of the individual holdings are documented.
What Has Changed Since the Last Dogecoin Article
On Friday this slot covered the wind-down of the Dogecoin fund run by Bitwise, which pays its holders out in cash on October 22. That date is now four days away and unchanged. The price has moved: from about $0.0804 at Saturday midday to $0.079357 at Sunday midday, down 1.23 percent. The day's low was $0.077662 and the high $0.080484. That leaves the record of $0.731578 from May 7, 2021 some 89.15 percent away. New since Friday is the number this article is about: the fund wind-down takes about $707,000 of demand out of the network, while the issuance of new coins puts $1.10 million of new supply in front of it in a single day.
The network also counted 8,483,425 addresses with a balance and 493 reachable nodes on Sunday. Bitcoin came to 216 reachable nodes the same day, at a hash rate of 986.6 exahash per second.
Dogecoin Miner Pay: Users Cover 0.05 Percent, Issuance 99.95
Three concrete steps follow from Sunday's numbers:
- Work out your own share. Divide your DOGE holding by 156.37 billion, then by 161.63 billion. The difference of 3.25 percent is the share that one year of issuance costs you while you do nothing. That number belongs next to the purchase price, not in its place. Tools that keep the holding and the acquisition date together are set out in the overview of crypto tax software.
- Compare the withdrawal fee of your provider with the half cent the network charges. If it is several times higher, bundle withdrawals instead of taking coins out one at a time. The terms offered by providers available in Germany are set out in the comparison of the best crypto exchanges.
- Fix the acquisition date of every holding before you decide on a sale. Inside the one-year window a loss can be offset and a gain is taxable; after it neither applies. If you hold the coins yourself, the documentation stays your job; the devices for it are in the hardware wallet comparison.
(As of October 18, 2026. This article is not investment advice. Prices and fee structures change; check the terms with the provider before you buy.)
OKB costs $114.77 this Sunday morning, the equivalent of 102.15 euros. That gives OKX's exchange token a market capitalisation of $2.41 billion and places it 43rd among the largest crypto-assets. Over the past 24 hours, however, only $17.89 million changed hands. The ratio between those two figures is the real finding: 0.74 percent of the market value changes owner per day. Anyone wanting to move larger sums notices it in the price.
cryptoticker.io has therefore counted where that trading actually takes place. The basis is all 33 publicly reported OKB trading pairs at 24 venues, with their respective daily turnover and their bid-ask spread. cryptoticker.io collected that data itself on October 18, 2026. The result explains why a token with a billion-dollar valuation trades so thinly, and it has a practical side for investors in Europe. An overview of the price history and the valuation is on our OKB price prediction page.
OKB's daily turnover amounts to 0.74 percent of its market capitalisation
$17.89 million of turnover against $2.41 billion of market value: that ratio is the starting point. No outside study is needed for comparison, a look at the week is enough. On October 16 daily turnover was almost three times as high at $50.97 million, and on October 12 it was $20.98 million. The current figure is therefore not an outlier to the downside but the lower end of an already narrow range.
The circulating supply does not explain it. It stands at exactly 21 million OKB, and it is at the same time the total supply and the cap. There are no locked reserves artificially shrinking the freely tradable portion, and no unlock schedule releasing new units into the market over the coming months. The entire supply is in circulation, and still less than one percent of it moves on a normal day.
What trading volume and market depth measure for an exchange token
Trading volume is the sum of all purchases and sales over a period, counted in dollars. Market depth is something else: it describes how many buy and sell orders sit close to the current price in the order book. High turnover can come from a few large trades, and a deep book can stay quiet if nobody wants to trade. Both matter to you together, because both decide the price at which an order is actually filled.
The difference between the best bid and the best offer is called the bid-ask spread. It is the most visible price of illiquidity: anyone buying and immediately selling again loses that spread twice. With OKB it ranges from 0.017 percent to 1.21 percent depending on the venue. That is a difference of a factor of 70 for the same token.
An exchange token is a special case here. Its value does not rest on a network of its own with users of its own, but on the decisions of the company issuing it: on buybacks, on discounts for trading fees, on its role as the fuel of an associated blockchain. That is exactly why trading in such tokens usually concentrates on the issuer's own exchange.

OKX handles 38.8 percent of all OKB trading itself
Of the $17.89 million in daily turnover, $6.95 million falls to OKX. That is 38.8 percent, and it is by far the largest single share. Behind it come GroveX with $2.76 million (15.4 percent), Gate with $2.25 million (12.6 percent) and LBank with $1.36 million (7.6 percent). Those four venues together carry 74.4 percent of the trading.
Concentration on the house exchange is the rule with exchange tokens and no shortcoming in itself. It only becomes a figure you have to allow for once you want to sell outside that exchange. The remaining 61.2 percent is spread across 20 further venues, most of which report daily turnover in the hundreds or thousands of dollars.
24 trading venues sound like choice, 20 of them carry a quarter
The number 24 stands for the venues where OKB is listed at all. It says little about the choice you really have. After OKX, GroveX, Gate and LBank come Tapbit with $811,000, XT.COM with $678,000, Hotcoin with $613,000, BitKan with $523,000, Websea with $469,000 and Pionex with $389,000. From eleventh place daily turnover is below $350,000, and from seventeenth place below $25,000.
At the bottom end sit the decentralised venues: Uniswap on X Layer manages $6,043, and the Ethereum versions together a little over $5,600. Anyone wanting to swap OKB without an exchange account will find barely any counterparty there.
Kraken is the only well-known MiCA venue on the list and turns over $1,571 a day
For investors in Europe that is the most important line of the count. Kraken appears on the list, with $1,571 of daily turnover. That is 0.009 percent of all OKB trading. Kraken runs its EU business through Payward Europe Solutions Ltd, authorised by the Central Bank of Ireland under the EU regulation MiCA since June 25, 2025.
Gate also holds a MiCA authorisation: its EU entity Gate Technology Ltd has been authorised in Malta since September 29, 2025 and ranks third in OKB trading with 12.6 percent. For the other large venues on the list we claim nothing here. The current position is maintained by the European securities regulator ESMA in its public register of authorised providers; check your own provider there before you place an order. What MiCA requires of an authorised provider is something we have put together in our overview of the MiCA obligations.
The bid-ask spread ranges from 0.017 to 1.21 percent
The tightest spread is reported by OKX at 0.017 percent, closely followed by Pionex at 0.017 and BitKan at 0.019 percent. Gate sits at 0.026 percent and XT.COM at 0.026. Above that it gets more expensive: GroveX, the second largest venue after all, comes in at 0.157 percent, Tapbit at 0.209 percent and Websea at 1.21 percent.
Concretely, for a sale of $10,000 that means the spread alone costs around $1.70 on the tightest book and around $121 on the widest. The trading fees of the respective house are added to that. The spread also applies only to the top level of the order book; larger orders run deeper into it and are filled correspondingly worse.
X Layer holds $157.96 million, down from $168.98 million on October 15
OKB is the fuel token of the X Layer blockchain. The capital locked in it rose to $168.98 million on October 15 and fell to $157.31 million on October 16, a drop of $11.67 million in a single day. Since then the figure has stood practically unchanged at $157.96 million.
The link to trading is indirect but real: the less capital works on the blockchain, the less reason there is to hold OKB for transaction fees. Demand from actual usage is therefore one of the two pillars the token rests on. The other is the scarcity created by the company.
The hard cap of 21 million OKB dates from the 2025 overhaul
That circulating supply, total supply and cap are identical is no coincidence. OKX rebuilt the token in August 2025: the function for creating new units was switched off, the supply was capped at 21 million, and the former OKTChain blockchain was discontinued, with its OKT token exchangeable for OKB until January 1, 2026. The details are in OKX's help page on the X Layer migration.
The price reacted with a jump at the time; the all-time high of $228.74 dates from October 4, 2025. Measured against that, OKB trades 49.8 percent lower today. The cap therefore works on the supply, not necessarily on the price, and still less on turnover: a hard ceiling creates no buyers.

The price stands at $114.77, 8.9 percent below the weekly high
Over seven days OKB has lost 7.74 percent, and over 24 hours 2.12 percent. Over 30 days there is a gain of 0.67 percent, so the month amounts to a sideways move with a weak final week. The daily range this Sunday runs from $113.86 to $117.75.
The week starts on October 12 at $126.03 and falls through $120.95, $122.68, $122.29 and $117.06 to $114.91 today.
Levels between the weekly low of $114.91 and the weekly high of $126.03
To the downside the weekly low sits at $114.91 and therefore practically on the current price; below it follows the round $110 mark, which was not tested this week. To the upside there is first the session high at $117.75, then the area around $120, where the price sat three times from October 13 to 15, and finally the weekly high at $126.03.
Those are observations from the week's course, not price targets. At a daily turnover of $17.89 million one qualification also applies that falls away with more liquid assets: single larger orders can move levels like these without anything having changed about the project's position.
The newsroom's view: the supply cap does not solve the turnover problem
From the newsroom's perspective, the scarcity at OKB is well implemented and still not the decisive figure. The evidence sits side by side: the supply has been fixed at 21 million since August 2025, and over the same period the price has fallen from its high of $228.74 to $114.77. At the same time the capital locked on X Layer has fallen by $11.02 million since October 15, and daily turnover amounts to 0.74 percent of the valuation.
Against that, a hard ceiling works more strongly than a growing supply when demand picks up, and the valuation of $2.41 billion rests on a running business rather than on a promise. What follows is not a statement about the direction of the price but about execution: at this level of turnover, the size of your order is a risk factor in its own right. As with any crypto-asset, a total loss is possible.
Buying route in Germany: authorisation, custody and the holding period
Three points count if you want to buy or sell OKB in Germany. First, authorisation: since the transition period ended on July 1, 2026, providers in the EU need a MiCA permission to offer trading, exchange and custody. Check your provider's status in the ESMA register before you deposit money.
Second, custody. OKB runs as a token on Ethereum and on X Layer; a hardware wallet takes both, as long as it supports the respective network. If you leave the balance on the exchange, you additionally carry that provider's risk. Which devices are candidates is shown by our hardware wallet comparison.
Third, tax. Gains from selling crypto-assets are tax free in Germany after a holding period of one year; below that the threshold for private disposals applies. What is decisive is the date of each separate purchase, and that is exactly what becomes hard to track with a token you have bought across several venues.
OKB trading: $17.9 million a day sets the limit
The count of the 33 trading pairs leads to three steps you can work through in order:
- Check the venue. Look at whether your provider lists OKB at all and whether it is authorised in the EU. An overview of the houses reachable from Germany is in our comparison of regulated crypto exchanges.
- Match the order size to the book. At $17.89 million of daily turnover, an order of several tens of thousands of dollars is no longer a small matter. Split it, or use a limit order instead of a market order. Which exchange offers which order types is in the exchange comparison.
- Record your purchase data. Note the date, quantity and price for every purchase, otherwise the one-year period cannot be documented cleanly later. The tools from our comparison of tax and portfolio tools help with that.
(As of October 18, 2026. This article is not investment advice. Prices and fee structures change; check the terms with the provider before you buy.)
Decrypt
MapQuest’s app now offers an optional map layer that plots known license plate readers from Flock Safety and other vendors, as backlash against the cameras grows.
Bitcoin ETFs lost a net $228.6 million this week, following a $681.1 million drain the week before and pushing October deep into the red.
A Bank for International Settlements working paper found that stablecoin growth slows when U.S. banks raise deposit rates, with Circle’s USDC most sensitive.
An FEC filing shows the Fairshake affiliate Defend American Jobs disclosed roughly $7 million more in ads against the Ohio Democrat, pushing its total past $46 million—days after the PAC expanded its map to 32 House races.
The nine-member group, modeled on the Internet Engineering Task Force, aims to set open standards for testing quantum-resistance claims as forecasts place the first practical attack in the late 2020s.
U.Today - IT, AI and Fintech Daily News for You Today
October continues to be a busy month for the XRP Ledger and the Ripple ecosystem.
As Ripple tests RLUSD with banks, fraud networks are spoofing brand names to steal XRP.
Shibarium, the layer-2 network associated with Shiba Inu, sees a slowdown in transaction activity, with daily transactions hitting a monthly low.
Michaels Saylor teases more Bitcoin buys for Strategy’s $69 billion BTC hoard via a fresh ‘orange’ chart update.
XRP pioneer Kaj Leroy reveals why the crypto market is quietly swapping digital NFTs for physical trading cards.
Blockonomi
TLDR:
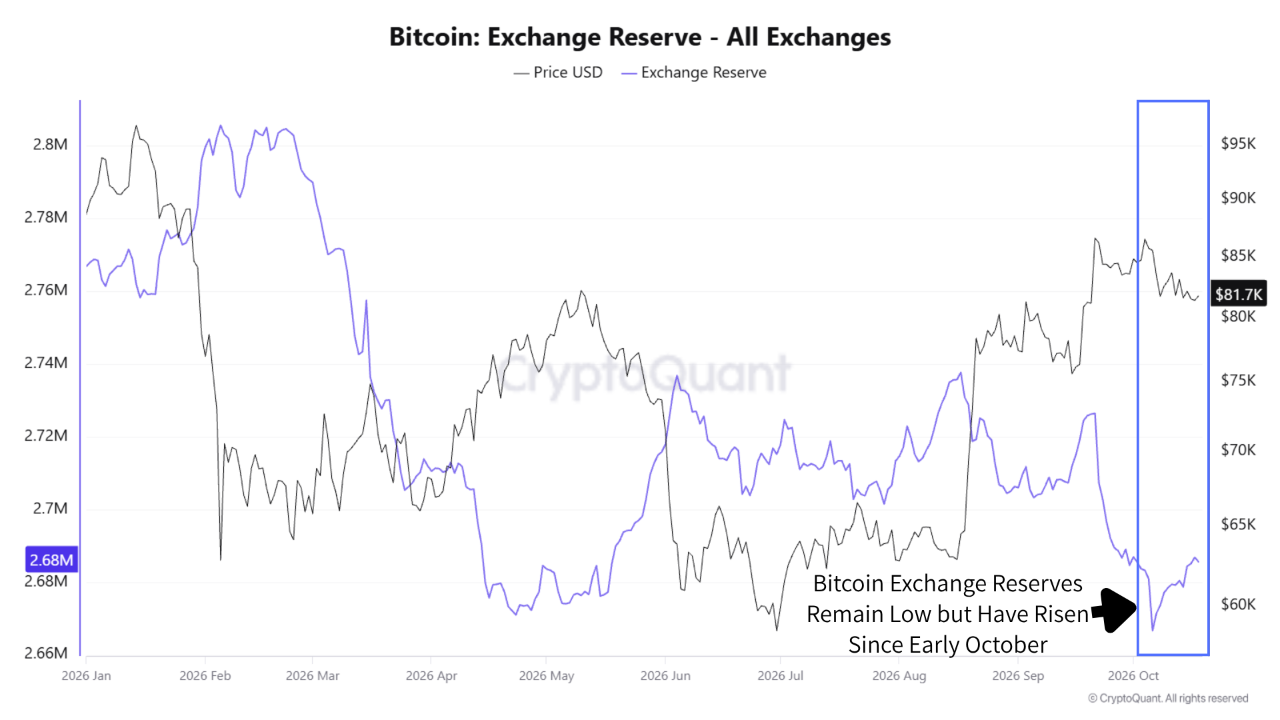
- Exchange reserves rose from about 2.67 million BTC to 2.68 million BTC but remain low versus January.
- Spot demand neared zero before turning negative, while perpetual futures demand stayed positive.
- Holders of 100–1,000 BTC remain net accumulators, while the over-10,000 BTC cohort is still negative.
- A durable recovery needs positive spot demand, buyers absorbing exchange inflows, and wider accumulation.
Bitcoin recovery remains uneven, according to updated CryptoQuant charts reviewed in a new XWIN Japan column. Exchange reserves, spot demand, and whale behavior show mixed signals as the U.S. midterms approach.
Low reserves, whale accumulation, and improving estimated demand still support a possible base. However, the latest data shows that buying strength is not yet consistent across the market. The column examines three charts that explain where support holds and where it weakens.
Exchange Reserves Edge Higher
Exchange reserves measure the amount of BTC held on trading platforms. They have risen from roughly 2.67 million BTC in early October to around 2.68 million BTC. Despite the increase, reserves remain low compared with January. Low reserves do not mean supply keeps shrinking.
Source: Cryptoquant
Transfers may reflect custody changes rather than selling. Therefore, rising reserves alone do not prove that holders are selling.
The increase is modest, and it comes from a low base. The supports from the earlier column remain, yet the Bitcoin recovery is uneven.
The earlier column, published six days ago, listed low reserves among the signs of base building. That earlier analysis centered on Bitcoin base building ahead of the U.S. midterms.
A durable Bitcoin recovery now requires buyers to absorb BTC that returns to exchanges. Reserves are rising, so that condition matters more.
Spot Demand Loses Momentum
The 30-day demand chart shows spot demand approaching zero before turning negative again. Spot demand reflects direct BTC purchases, while perpetual futures involve derivatives.
Meanwhile, positive perpetual futures demand supports total demand. Spot buying therefore remains weaker than futures activity.
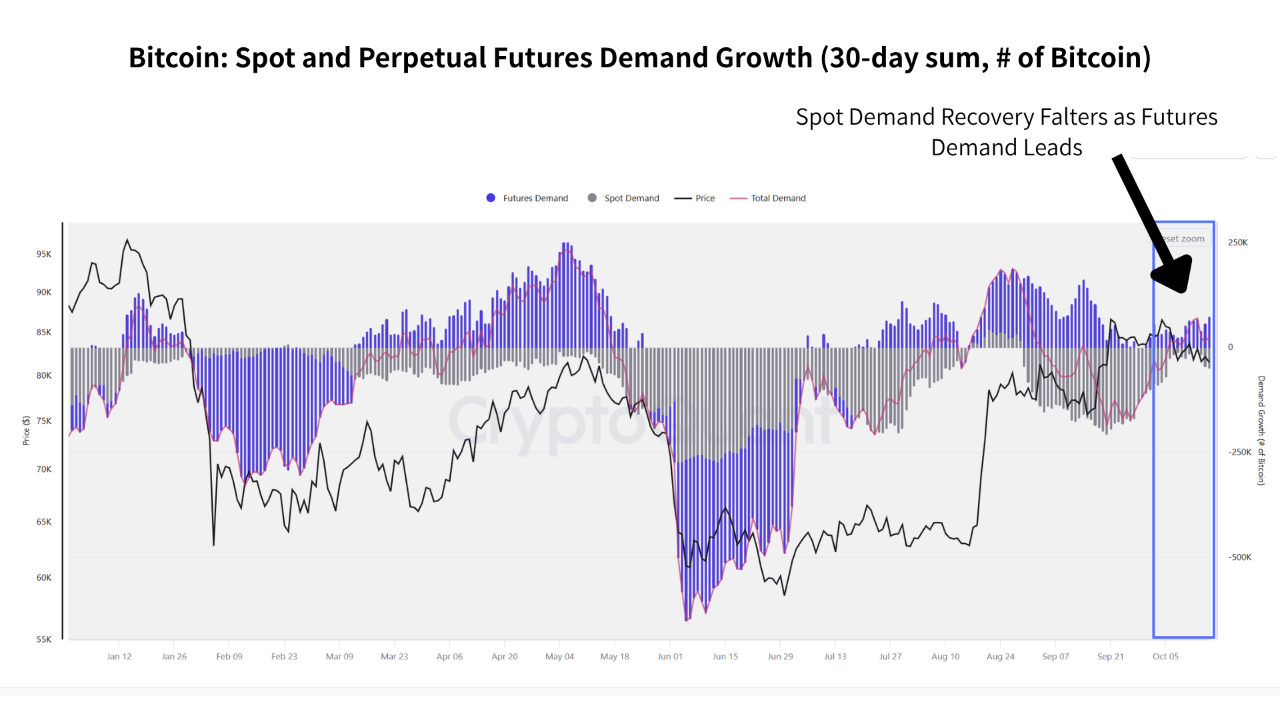
Source: Cryptoquant
The earlier column cited improving estimated demand. This new breakdown differs from the Apparent Demand metric discussed previously. Their values are not directly comparable, so the readings should be viewed separately.
Sustained positive spot demand is one of three conditions for a durable Bitcoin recovery. Without it, futures demand carries the total figure. Positive spot readings would show buyers acting directly in the market.
Whale Cohorts Show Mixed Behavior
Holders of 100–1,000 BTC remain net accumulators over 60 days. Their buying sits below the late-September peak despite a modest rebound. The cohort has kept buying through the past two months.
Net holding declines among the 1,000–10,000 BTC cohort have narrowed toward zero. Meanwhile, the cohort above 10,000 BTC remains negative.
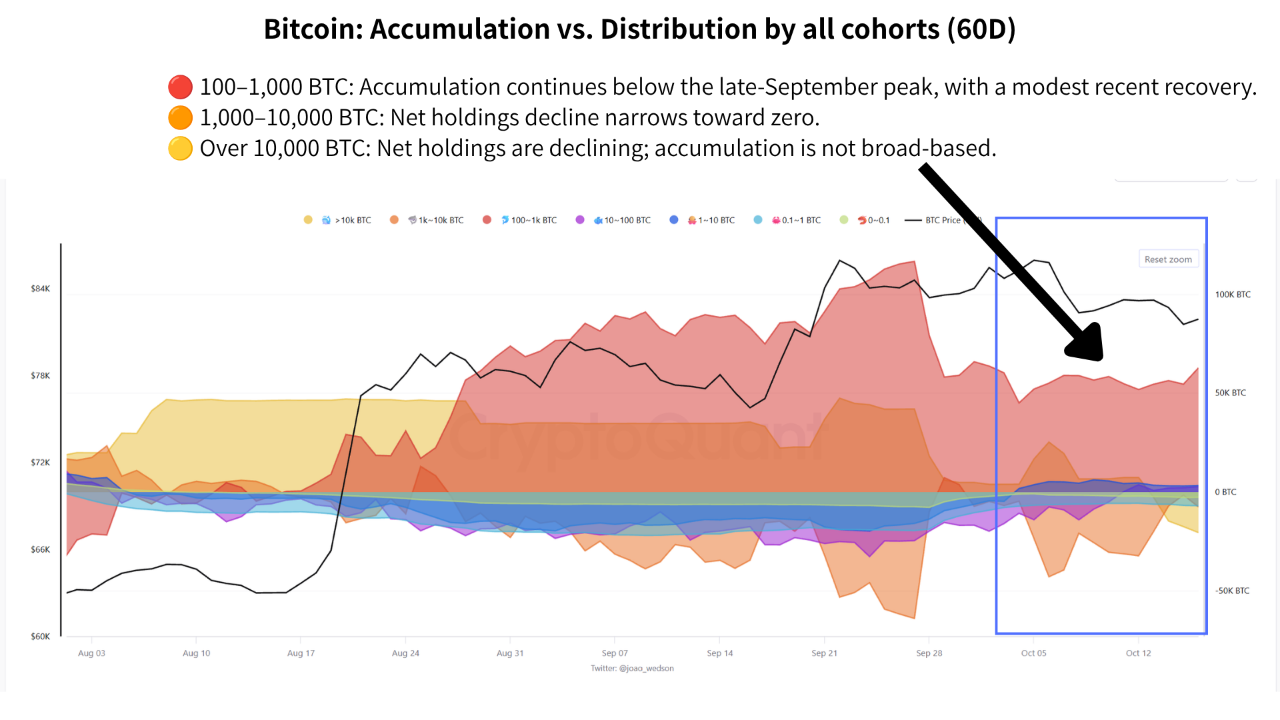
Source: Cryptoquant
Accumulation is therefore not broad-based across holder groups. A durable recovery also needs accumulation to spread more widely.
These rolling figures include pre-October activity and can reflect transfers between cohorts. Conditions that could support a base still exist. Expectations around the midterms and monetary policy must translate into actual buying.
The key is whether rallies gain a growing, lasting base of buyers. Until then, the Bitcoin recovery depends on whether buying broadens beyond a single holder group.
The post Bitcoin Recovery Stays Uneven as Spot Demand Weakens and Exchange Reserves Rise appeared first on Blockonomi.
TLDR:
- Michael Saylor’s October 18 post hinted at another Strategy Bitcoin buy but confirmed no transaction.
- Strategy acquired 250 BTC for $21.5 million, taking its holdings to 848,250 coins as of October 11, 2026.
- Strategy reported a $4.88 billion reserve and $640.5 million in separate USD Cash as of October 11, 2026.
- Bitcoin traded near $81,616 on October 18 as its 14-day RSI stood at 46.5, indicating neutral momentum.
Michael Saylor renewed attention on corporate cryptocurrency buying Sunday, October 18, after signaling that Strategy could add to its substantial Bitcoin holdings. “We found room for more orange,” the executive chairman posted on X, accompanying his message with an updated acquisition chart.
The comment, however, offered no purchase figure or confirmation that a transaction had occurred. The chart listed approximately 848,250 BTC, valued at $69.45 billion, with an average acquisition cost of $75,444 per coin.
Separately, a momentum indicator drew attention to Bitcoin’s price resilience. That technical signal measures market behavior rather than corporate demand, and does not establish that an advance is underway.
Michael Saylor Hints at New Strategy Buy After $21.5M Purchase
A similar October 11 post preceded an October 12 acquisition disclosure. However, that pattern does not establish whether a new purchase occurred. The company reported buying 250 coins for approximately $21.5 million between October 5 and 11, at an average price of $86,194.
That brought total holdings to 848,250 coins, representing approximately 4.04% of the asset’s fixed 21 million supply. Common-stock sales funded $21 million of the purchase, while cash covered the remaining $500,000.
The funding mix illustrates how share issuance, rather than cash alone, supported that acquisition. Meanwhile, it spent $192.4 million repurchasing STRC preferred shares. On October 11, it reported a $4.88 billion reserve for dividend and interest obligations, plus $640.5 million in separate USD Cash.
The latter could support acquisitions and other corporate activities, although neither balance establishes the scale of any future purchase. Meanwhile, attention turns to a potential October 19 announcement, with Saylor yet to confirm another transaction.
Bitcoin RSI Near 46.5 as Traders Watch $80,000 Support
Alongside the corporate buying discussion, analyst OxSweep highlighted a contrast between recent price behavior and the Relative Strength Index on October 18. The analyst compared the latest RSI decline with a May episode, when weakening momentum accompanied a sharper market drop.
This time, prices held comparatively higher levels despite the indicator’s retreat. That distinction underpinned the analyst’s bullish interpretation, rather than confirming that another advance had begun. RSI measures price-change speed and magnitude on a scale of zero to 100.
Fidelity’s technical guide identifies the 40–50 range as potential momentum support during established uptrends. Still, an October 18 snapshot showed the asset near $81,616, with its 14-day RSI around 46.5. That reading indicates neutral momentum, not a confirmed breakout.
Bitcoin’s price support near $80,000–$81,000 and a recovery toward $84,000 remain the immediate technical reference points. A subsequent regulatory disclosure would determine whether the latest orange-themed post reflected a purchase; price action would then provide the separate test of bullish momentum.
The post Bitcoin Bull Run Ahead? Michael Saylor Teases Another Strategy BTC Purchase appeared first on Blockonomi.
TLDR:
- Binance sell order at 21:21 UTC triggered liquidations that reached Hyperliquid-linked stock contracts
- Bullish positions made up about $38M of the $51.6M liquidated between 21:22 and 21:32 UTC on Saturday
- SOXL saw roughly $12.7M in liquidations, while SanDisk and SK Hynix each recorded about $10.8M
- Semiconductors had logged eight straight losing days, their worst streak since 2008, before the drop
A semiconductor flash crash wiped out $51.6 million in leveraged positions during weekend trading on crypto platforms. A large sell order on Binance at 21:21 UTC on Saturday triggered the liquidations.
The wave spread to venues such as Hyperliquid and hit contracts tied to SOXL, SanDisk, and SK Hynix. Thin liquidity worsened the drop, since US stock markets were closed. Prices rebounded quickly afterward, and the wider crypto markets held steady.
Binance Sell Order Triggers Liquidations Across Venues
Analyst AN Crypto described the semiconductor flash crash in a post on X. The post states that liquidations occurred between 21:22 and 21:32 UTC on Saturday. Positions tied to chip stocks and semiconductor funds were closed by force during that ten-minute window.
The selling began on Binance. Within seconds, it reached stock contracts linked to Hyperliquid. These contracts stay open even when US exchanges are shut.
$52 MILLION WIPED OUT IN JUST 10 MINUTES — WHILE WALL STREET WAS CLOSED.
Crypto exchanges are becoming a 24/7 casino for stock traders. This weekend, leveraged bets on semiconductor stocks suffered a massive liquidation wave, even though the underlying U.S. stock market wasn’t… pic.twitter.com/j4mTHAvzpk— AN Crypto (@ANCrypto_) October 18, 2026
Thin weekend liquidity left few buy orders to absorb the large sell order. The sequence showed how quickly pressure can move across trading venues.
A liquidation occurs when an exchange closes a leveraged position after the trader’s margin falls too low. Bullish traders took the largest share of the losses. About $38 million came from positions betting on higher prices. The rest came from traders betting on lower prices.
SOXL, SanDisk, and SK Hynix Lead the Losses
SOXL contracts recorded the biggest losses, with about $12.7 million liquidated. SanDisk and SK Hynix contracts followed, each seeing around $10.8 million in liquidations.
The liquidations came after a rough stretch for the semiconductor sector in regular trading. Chips had logged eight straight losing days, their worst streak since 2008.
Pullbacks in AI spending accompanied that decline. The streak left the sector under pressure before the weekend session began.
The semiconductor flash crash on crypto venues followed this run of losses. Together, the three contract groups accounted for about $34.3 million of the total. Other positions made up the remaining balance.
Lack of Live Stock Prices Complicates Weekend Trading
AN Crypto pointed to the absence of an opening bell as the central issue. With Wall Street closed, these contracts had no real-time share prices to anchor them. Traders were effectively reacting to each other, and leverage amplified the move.
US markets reopen on Monday. Actual share prices will then show how far weekend contract prices drifted from the underlying stocks. Until then, moves from the semiconductor flash crash cannot be compared with live stock data.
Tokenized stock exposure and perpetual contracts now allow markets to trade around the clock. Perpetual contracts have no expiry date, so traders can hold them while margin requirements are met.
However, constant access does not guarantee reliable price discovery or deep liquidity. Longer trading hours offer more opportunity, but they also create more ways for traders to face liquidation.
The post Semiconductor Flash Crash Wipes Out $52M in Weekend Crypto Bets appeared first on Blockonomi.
TLDR:
- XRP trades at $1.30, down 7.21% over seven days, with $1.30-$1.32 serving as key support.
- Vuori Trading identifies $1.39 as the next resistance and $1.87 as a potential breakout target.
- Cryptoinsightuk prefers a lower XRP entry near $1.22, with liquidity extending toward $1.20.
- Rising Bitcoin dominance could pressure XRP and other altcoins if capital continues favoring Bitcoin.
XRP is trading near $1.30 as traders monitor key support levels and a potential breakout from its descending channel. CoinGecko data shows XRP at $1.30, down 0.47% over 24 hours and 7.21% over the past week. Its 24-hour trading volume stands at $1,006,675,899.
Market analyst Vuori Trading identified $1.30-$1.32 as a support zone, with $1.39 as the next level to watch. A breakout above the descending channel could open a path toward $1.87, according to the analyst’s technical outlook.
However, Cryptoinsightuk sees potential for another decline before a stronger entry emerges.
The analyst is watching $1.22, with liquidity levels between $1.24 and $1.20 also drawing attention. The competing scenarios leave XRP traders weighing a possible rebound against continued downside pressure.
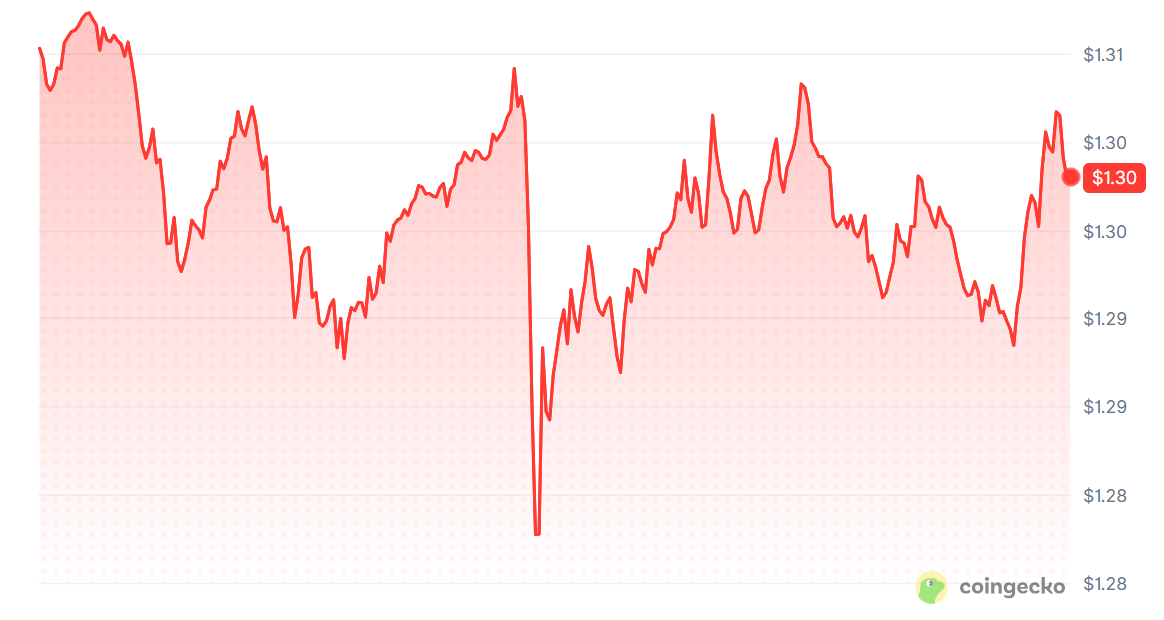
XRP Price Analysis: Can $1.30 Support Trigger a Rebound?
XRP is testing an important price area as traders assess whether the current decline has reached a local bottom. Vuori Trading considers $1.30-$1.32 a key support zone for the asset.
If buyers defend this area, $1.39 becomes the next logical level, according to Vuori Trading. A successful breakout from the descending channel could then place $1.87 within reach. That target remains conditional on a confirmed breakout rather than a guaranteed outcome.
A rejection at resistance could extend XRP’s existing downtrend. Vuori Trading identified $1.16 as a potential downside level if the decline continues without a successful breakout.
Cryptoinsightuk offers a more cautious view of the immediate setup. The analyst considers $1.30 a possible range low, with resistance around $1.60. However, the preferred entry remains lower, near $1.22.
The analyst also noted that XRP had nearly retested its recent lows while BTC maintained a higher low. This difference could matter if Bitcoin continues attracting liquidity away from alternative cryptocurrencies.
XRP Price Could Fall Further as Bitcoin Dominance Rises
Cryptoinsightuk highlighted Bitcoin’s recent price structure when assessing XRP’s next move. Bitcoin previously formed a range between approximately $80,000 and $87,000 before sweeping its lower boundary on October 15.
That move resembles an earlier pattern in which Bitcoin swept range support before moving higher. The analyst believes XRP could follow a similar recovery path, although a deeper correction remains possible.
The analysis identifies two potential scenarios for Bitcoin: a shallow correction that may already be complete, or a deeper three-leg ABC correction. The second scenario remains the analyst’s preferred outlook.
Bitcoin dominance adds another variable to XRP’s short-term prospects. Cryptoinsightuk said the weekly chart appears to show a breakout from a pennant pattern, potentially signaling further Bitcoin outperformance.
Rising Bitcoin dominance can indicate that Bitcoin is attracting a larger share of crypto market capital. If that trend continues, altcoins such as XRP could face additional pressure, even if Bitcoin itself rebounds.
The analyst identified a potential XRP liquidity zone between $1.24 and $1.22, extending toward $1.20. These levels represent possible entry areas, not confirmed price targets or guaranteed support.
The immediate question is whether $1.30 holds long enough to support a recovery toward $1.39.
A channel breakout could strengthen the case for $1.87, while renewed selling could expose lower levels. The next directional move depends on how price responds around support and resistance.
The post XRP Price Prediction: Bitcoin Dominance Puts $1.30 Support at Risk appeared first on Blockonomi.
TLDR:
- Justin Sun sold 80%–90% of his Ethereum near $3,600–$4,000 after identifying a fragile double-top pattern.
- He has not repurchased the Ethereum sold, although he retained a smaller core position and kept Bitcoin.
- Following the sale, Sun shifted capital into U.S. stocks, identifying Nvidia and Nasdaq-100 exposure.
- Ethereum closed near $2,402 on October 17, about 33%–40% below Sun’s reported $3,600–$4,000 exit range.
TRON founder Justin Sun reduced his once-dominant Ethereum position by roughly 80%–90% as the cryptocurrency approached $4,000, then redirected substantial capital into American stocks. In an October 16 interview with Jin Ming, Sun said he sold between $3,600 and $4,000 and has not repurchased those tokens.
Instead, he kept a smaller Ethereum stake while leaving his Bitcoin holdings intact. Before that decision, Ethereum had been his largest cryptocurrency holding, making the reduction his most consequential disclosed digital-asset shift. The disclosure revealed a divide between assets he considered vulnerable to a reversal and investments he wanted to retain longer term.
Nvidia and Nasdaq-100 exposure became central to that shift. However, Sun provided no token volumes, proceeds, or precise execution dates, leaving the transactions independently unverified. He described the move as a response to market structure rather than a withdrawal from decentralized finance.
Double-Top Fears Behind Justin Sun’s 80%–90% ETH Sale Near $4,000
Sun linked the sale to a double-top formation he perceived after Ethereum approached $4,800, fell back, and staged another advance. That pattern describes two attempts to sustain higher prices, although it cannot independently establish a reversal.
He said exchange-traded fund demand supported the second rally, citing investor Tom Lee when describing its buying momentum. Rather than rely on continued support, he considered the rebound fragile and reduced his exposure.
The market subsequently weakened. Ethereum reached approximately $4,950 in August 2025 and approached $4,755 again that October. By October 17, 2026, it closed near $2,402, roughly 33%–40% below Sun’s reported selling range.
Even so, the exit did not end his Ethereum involvement. He described the network as his preferred venue for large-scale decentralized finance operations because of its deeper liquidity. The distinction separates trading an asset from using its underlying blockchain.
Nvidia and Nasdaq-100 Investments Followed the ETH Reduction
After trimming ETH, Sun moved funds into U.S. equities, expecting investor attention to concentrate on American stocks. He identified Nvidia as a major holding and reported significant Nasdaq-100 exposure, without detailing allocations or purchase prices.
His position did not imply an unqualified bullish view of technology shares. Sun said he had become slightly bearish on the Nasdaq over the medium term, citing crowded AI investments and borrowing costs. That caution coincided with the Nasdaq Composite’s 2.1% decline on October 16. The index lost approximately 4.5% that week as investors questioned heavy artificial intelligence infrastructure spending.
Bitcoin remained a separate holding. Sun said he retained it throughout the previous year while monitoring potential cryptographic threats from artificial intelligence and quantum computing. He also described isolating Bitcoin in previously unused cold-storage addresses as a precaution, without predicting when such threats might materialize.
The post Justin Sun Reveals Why He Sold 90% of His ETH Near $4,000 and Pivoted to Nvidia appeared first on Blockonomi.
CryptoPotato
Ethereum is testing a critical support confluence below $2.4K as its correction continues. Buyers have defended the area with several sharp reactions, but persistent lower highs suggest that selling pressure has yet to ease.
Ethereum Price Analysis: The Daily Chart
On the daily timeframe, ETH has declined into the highlighted $2.36K–$2.44K demand zone, where the lower boundary of the broader ascending channel provides additional support. The asset is currently near $2.36K, with recent lower wicks indicating buying interest beneath the consolidation.
However, these reactions have not produced a sustained recovery. Since losing the channel’s midpoint, ETH has continued to form lower highs, keeping the immediate outlook fragile. Buyers need to reclaim the $2.44K demand boundary and then overcome the recent $2.5K–$2.56K resistance area to demonstrate improving strength.
Holding the current confluence could support a recovery toward the former consolidation around $2.67K–$2.74K. Conversely, a decisive daily close beneath $2.36K and the ascending channel boundary would weaken the broader recovery structure, increasing the risk of a deeper correction toward $2.2K.
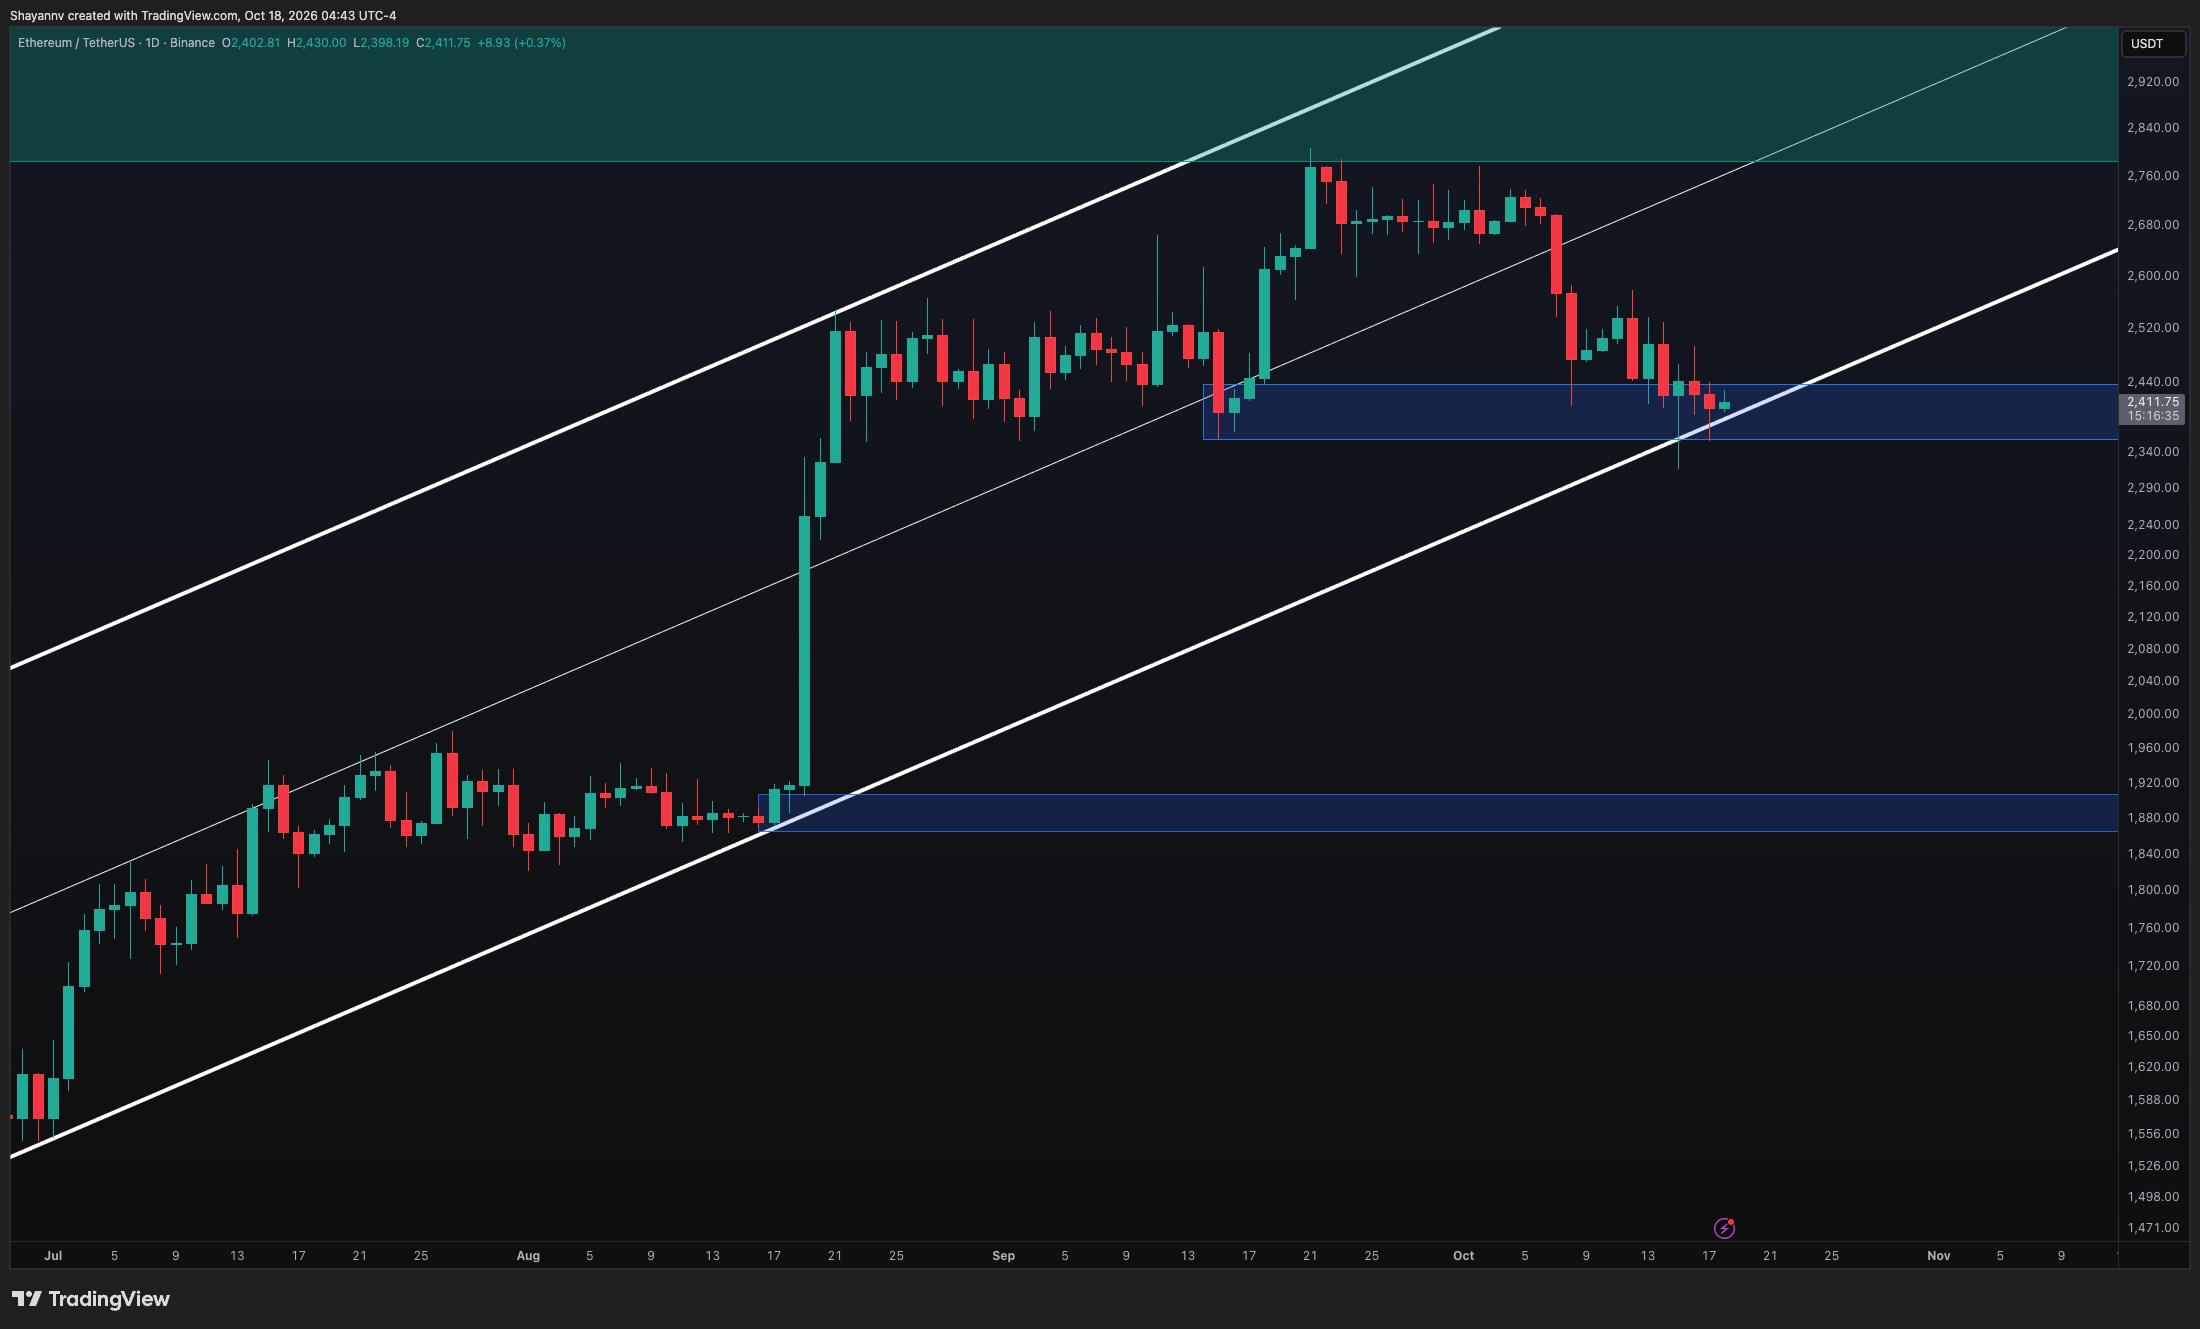
ETH/USDT 4-Hour Chart
The 4-hour chart shows Ethereum trading within a descending channel following the sharp early-October selloff. Repeated rebounds have failed to break the upper trendline, while the latest candles are consolidating inside the $2.36K–$2.44K demand zone.
The descending resistance currently approaches $2.45K–$2.47K, making this the first important obstacle to a recovery. A sustained breakout above both the demand zone’s upper boundary and this trendline would interrupt the immediate bearish structure and could allow a move toward $2.5K–$2.58K.
Until that occurs, another test of $2.35K remains possible. Losing this support would expose the recent wick lows around $2.32K, followed by the highlighted $2.2K–$2.27K demand zone. The descending channel’s lower boundary also approaches that deeper region, reinforcing its relevance if the correction extends.
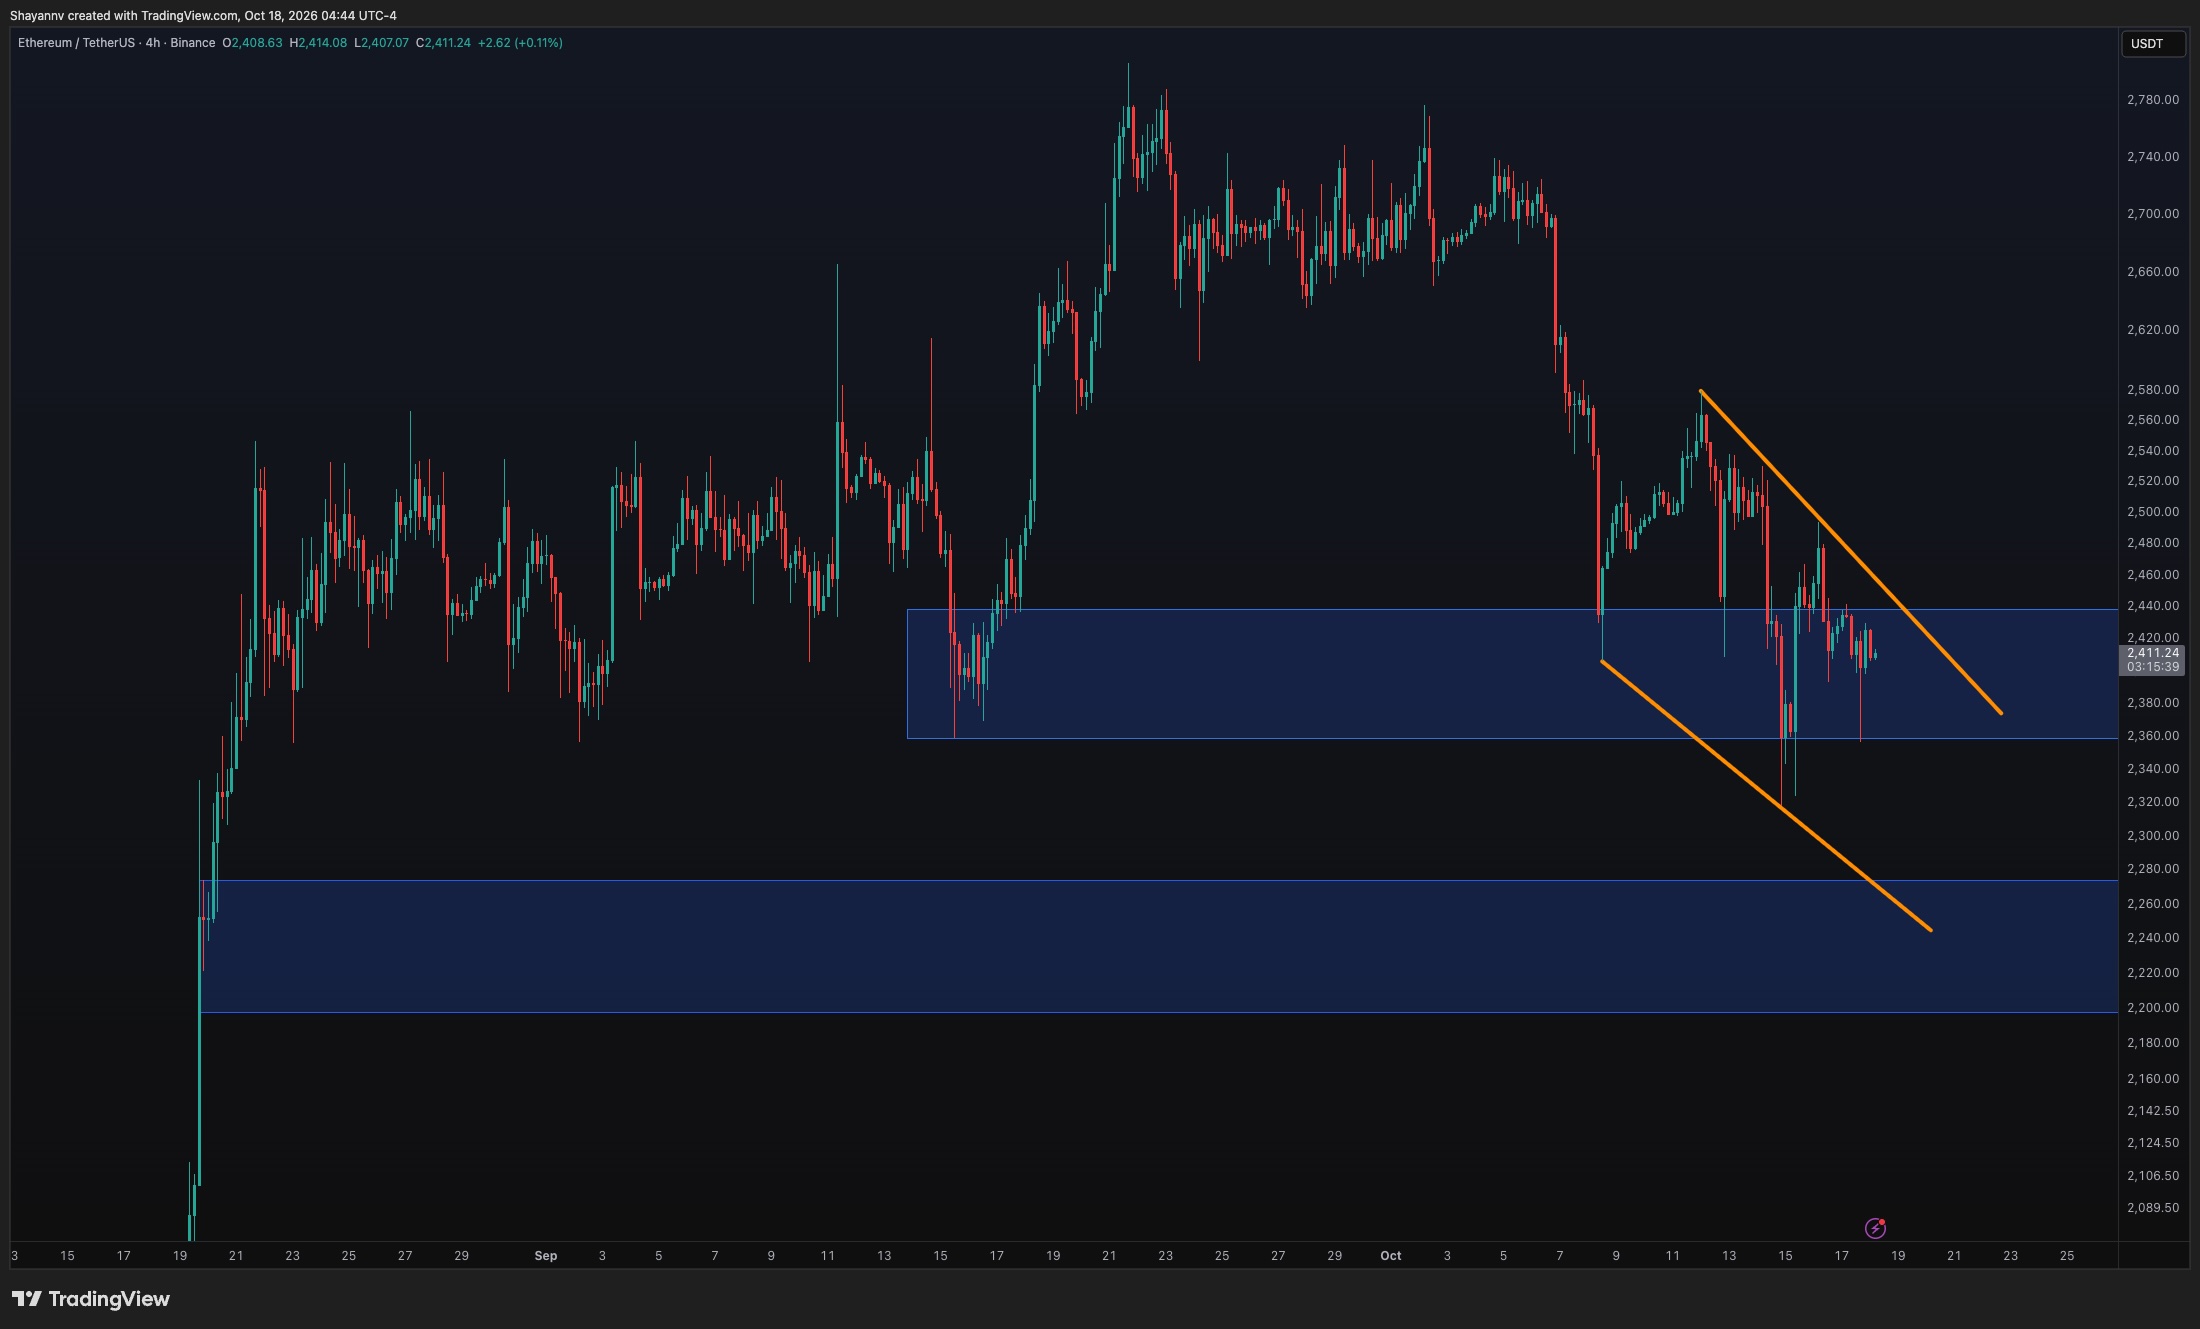
Sentiment Analysis
The one-month ETH liquidation heatmap highlights a substantial estimated liquidation cluster around $2.15K–$2.2K, above the psychological $2K threshold. The band has remained visible across multiple sessions and is particularly bright near the chart’s latest readings, indicating a significant concentration of potential liquidation exposure below the current price.
This cluster becomes especially relevant if Ethereum loses the $2.36K support zone and its broader ascending structure. Under that scenario, further declines could trigger long liquidations as the price approaches $2.2K, potentially accelerating the move into this liquidity pool.
Its proximity to the $2.2K–$2.27K technical demand zone adds significance to that broader area. However, the cluster represents potential forced-selling exposure rather than guaranteed support or an inevitable price target. A sustained recovery above nearby resistance would reduce its immediate relevance, while continued structural weakness would keep it in focus.

The post Ethereum Price Prediction: Is ETH’s 7% Weekly Drop Just the Start? appeared first on CryptoPotato.
It feels like it was just a few weeks ago, because it was when our article on this topic had a whole different nuance to it. We were highlighting the major green streaks for the ETFs tracking both XRP and SOL, as they had reached local peaks in terms of net inflows.
The reality today is quite different. On one side, the spot Ripple ETFs marked their first red week in months, while the Solana counterparts extended their outflow streak to ten consecutive days.
XRP ETFs Break the Streak
It was an all-out red week for the spot crypto ETFs, with the BTC and ETF funds bleeding by triple digits, as reported earlier. The financial vehicles tracking Ripple’s cross-border token began the business week with the same nonexistent pace as they finished the previous one – with $0.00 reportable net flows.
The first notable activity took place on Wednesday, which was somewhat surprising given the hotter-than-expected inflation data released that day, and the funds attracted just over $740,000. Investors changed their tune on Thursday, pulling $104,510 out. The first and only multi-million transaction took place on Friday, with the net flows jumping to $2.47 million.
Consequently, the five-day trading period ended in the red for the XRP ETFs, with $1.84 million in withdrawals. This made it the first red week since the one that ended on July 10. In other words, investors broke a 13-week green streak. The change in their appetite for XRP is more than evident, as just three weeks ago we were reporting major net inflows of over $75 million.

The past week was quite painful for the underlying asset as well, which was rejected at $1.40 and plummeted to $1.27, where it found some support over the weekend.
SOL ETFs Keep Bleeding
The Solana ETFs are in even worse shape, as they just closed their worst week ever in net outflows, with $25.52 million leaving the funds. As such, they beat the previous week’s anti-record of $24.81 million. What’s particularly worrisome is that the SOL ETFs have seen only one green day since September 29, and the inflows were quite modest at $1.30 million on October 2.
Meanwhile, the ETFs bled over $12.6 million on Friday alone, and the total net inflows have declined from $1.62 billion to $1.56 billion within two weeks.

These outflows have led to an apparent pullback in the underlying asset, which was rejected at $110 this week and dipped to $101-$102 on a couple of occasions. Although it has remained within three-digit territory, the overall landscape has worsened substantially over the past few weeks, and a dip below $100 might be just a matter of time.
The post Spot Ripple (XRP) ETFs Reach the End of an Era, Solana (SOL) Funds Can’t Catch a Break appeared first on CryptoPotato.
In a week in which the underlying asset tumbled from over $84,000 to a monthly low of under $80,000, it’s almost expected that the exchange-traded funds tracking its performance were in the red. And they were.
The same can be said about the Ethereum ETFs, which, albeit finally saw a single green day, extended their negative streak.
Bitcoin ETFs Bleed Again
The spot Bitcoin ETFs have become synonymous with BTC’s price movements over the past several weeks. When net inflows dominate in an impressive manner, as they did at the end of September when investors poured in $2.4 billion into the funds in five trading days, the cryptocurrency’s price blossomed. Vice versa, BTC tumbled during the first and second full weeks of October.
As reported last weekend, the ETFs saw net outflows of over $680 million as the asset was rejected at $87,000 and slumped by several grand. It tried to recover in the following days and tapped $84,000 on a couple of occasions, only to be rejected again. This time, the bears took it a step further, pushing it to just under $80,000 for the first time in a month.
Needless to say, this transpired during a red week in terms of ETF flows. Overall, the funds bled $228.58 million, which wasn’t as bad as the previous week. It started with a $65.40 million loss on Monday, followed by a net inflow of $175.62 million on Tuesday, back to red with $261.46 million on Wednesday, a minor gain of $5.06 million on Thursday, and $82.39 million taken out on Friday to close the week.
Ultimately, the funds’ total net cumulative inflows have declined from almost $57.8 billion on October 2 to $56.88 billion on October 16.

ETH ETFs Still in Red
Although the BTC ETFs saw nearly $230 million in net outflows last week, the landscape around them is not as bad as that around their Ethereum counterparts. The funds tracking the leading altcoin have seen only a single day in the green since September 28. It came on October 13, when investors poured in $24.84 million.
In contrast, the rest of the week went in the opposite direction, with net outflows of $85.40 million on Monday, a whopping $129.51 million on Wednesday, another $60.22 million on Thursday, and $69.68 million on Friday. Consequently, the week ended with roughly $320 million in net outflows, beating the spot BTC ETFs in that adverse ranking.
This marks the third consecutive red week for the Ethereum ETFs, which lost $1 billion during the period. The underlying asset’s price also dipped hard last week, going toward $2,300 for the first time since the August breakout rally.

The post Bitcoin ETFs vs Ethereum ETFs: Which Bled More Last Week? appeared first on CryptoPotato.
We’re far from the meme-coin hype that rattled crypto markets, where new tokens were popping up left and right to fight for the public’s attention and, more importantly, the capital ready to deploy.
Although the oldest and largest of the bunch was always an exception and has remained a top 20 digital asset for years, its most bullish and attention-grabbing days are behind it. Or are they?
3 Reasons to Be Bullish
Ali Martinez recently outlined the thesis for why investors should take another look at DOGE, starting with the TD Sequential that flashed a major buy signal on the daily chart at prices around $0.081. The asset has since slipped below that level, currently trading beneath $0.08 even after recovering from last night’s flash crash.
Nevertheless, Martinez remains confident the key technical indicator can once again prove right on DOGE, saying:
“The indicator has marked potential turning points before for Dogecoin. This signal is especially interesting because of where it appeared.”
He also pointed out the same $0.081 as a critical support, with URPD data showing roughly 36 billion coins traded around it. Although he admitted that this doesn’t guarantee buyers will defend it, he believes Dogecoin will soon bounce above it. So far, though, it hasn’t been the case.
Lastly, the analyst told his nearly 170,000 followers on X that investors have been buying near the support, with 600 million DOGE added to their bags since October 12. As such, he predicted that the meme coin could skyrocket to $0.16-$0.17 if the $0.081 support holds and DOGE rebounds soon.
5/6 If $0.081 holds and $DOGE rebounds, I’m watching $0.16–$0.17 as a potential profit-taking zone.
Cost-basis data shows roughly 12 billion DOGE were acquired near $0.16 and another 14 billion near $0.17. Those concentrations could make the area difficult to clear. https://t.co/SoTkLDSGv3
— Ali Charts (@alicharts) October 16, 2026
Should You Really Be?
From a broader perspective, the crypto market is far from its best days. It’s not even at its best late Q3/early Q4 sentiment when BTC spiked to $87,000, and many alts followed suit. So the bullish sentiment, because of the entire market, is not really here.
When it comes to picking a DOGE out of the bag, the meme coin niche is nowhere near its 2021 peak. Not even close to the subsequent mania a few years later. In fact, many have lost their footing, including Dogecoin, which is now out of the top 10 digital assets by market cap.
Actual demand for spot DOGE ETFs supports this theory, as net inflows are essentially nonexistent. Of course, we wouldn’t argue with a prominent analyst like Ali Martinez on on-chain signals and technicals, but we’d advise treating any prediction of a 100% surge in these market conditions with caution.
The post Analyst Maps Out 3 Reasons to Be Bullish on Dogecoin (DOGE): But Should You Really Be? appeared first on CryptoPotato.
Bitcoin’s recovery since the summer lows has been accompanied by an unusually sharp shift in analyst sentiment, and CryptoQuant believes the pattern closely resembles the early stages of the previous major bull cycle.
In its latest report shared with CryptoPotato, the company found that sentiment across BTC, ETH, BNB, XRP, and SOL has shifted from bearish to bullish since early July. More importantly, CQ said the move has been “deeper, faster, and broader” than the turn witnessed between late 2022 and early 2023.
Analysts Turn Bullish
CryptoQuant’s 30-day Analyst Consensus Index bottomed at -18.3 on July 2, when BTC’s price had tumbled to under $58,000, and climbed above 0 on July 27, when the cryptocurrency was still trading around $63,800. This dramatic increase came just a few weeks before bitcoin skyrocketed toward $80,000 in late August.
The index now stands at +49.2, while the share of bullish analysts going viral has rocketed from under 40% to almost 85%. CQ said this represented 137 of 164 voters. The shift also appears to be more than an influx of new bullish commentators, as 47 analysts flipped from bearish to bullish among 85 who held a BTC call both at the start of July and now. In contrast, only five have moved in the opposite direction.
CQ’s report compared the current environment with the beginning of the previous major cycle. In 2022-2023, BTC’s consensus index rose by 36 points over 103 days while the asset gained roughly 65%. The difference is quite striking, as sentiment has soared by 67 points over the same period this time, even though the cryptocurrency rallied by a more modest 33 points from the July low.

Consequently, CryptoQuant concluded that analysts have moved further ahead of BTC’s price than they did at the start of the 2023 bull market. This is not an isolated development, as large bitcoin holders recently began reaccumulating sizeable portions of the asset after months of selling. At the same time, CQ’s Bull Score Index jumped from 20 in July to as high as 90 in September.
ETH and SOL See Bigger Bulls
Ethereum’s consensus index has climbed from +0.1 to +58.3, with 88% of analysts turning bullish. Solana has the strongest reading of the five examined assets at +72, with 31 out of 34 analysts (91%) betting on the bulls.
This also shows a substantial departure from the previous cycle, as ETH and SOL lagged BTC’s sentiment recovery in 2022-2023, whereas this time they have led.
XRP has gone a ramatic reversal as well, with its consensus falling to -8.0 on August 20, which coincided with its multi-year low at $0.99. The index rebounded to 36.7% within weeks as analysts turned bullish after the token’s price rocketed to over $1.50 at the time.
The post Bitcoin Analysts Are More Bullish Now Than at the Start of the 2023 Bull Market: CryptoQuant appeared first on CryptoPotato.