Cryptocurrency Posts
Crypto Briefing
The ruling underscores the permanence of legal settlements, limiting the impact of policy shifts on finalized judgments and regulatory actions.
The post Judge refuses to let Gemini and CFTC undo $5 million settlement appeared first on Crypto Briefing.
Ark Invest's purchase highlights a strategic bet on CoreWeave's potential rebound, despite market volatility and significant debt concerns.
The post Ark Invest buys 192,566 CoreWeave shares as the AI cloud stock slides appeared first on Crypto Briefing.
The brief AI pause highlights the challenge of balancing rapid innovation with safety, as competitive pressures quickly resume dominance.
The post AI competition intensifies after a brief pause for safety appeared first on Crypto Briefing.
SpaceX's AI compute expansion could reshape the AI landscape, intensifying competition and potentially boosting Nvidia's market dominance.
The post SpaceX targets 10GW of AI compute by 2027 with Nvidia’s Vera Rubin chips appeared first on Crypto Briefing.
The Pirate Chain exploit highlights the challenges of maintaining security in privacy-focused cryptocurrencies, emphasizing the need for robust validation.
The post Pirate Chain exploit mints around 39.8 million ARRR, team proposes rollback appeared first on Crypto Briefing.
Bitcoin Magazine
Bitcoin Magazine
Brooklyn DA Pulls the Plug on Crypto Scam Network
The Brooklyn District Attorney’s office has dismantled the online backbone of a multinational cryptocurrency scam that drained tens of millions of dollars from Russian-speaking victims across the U.S.
Working with the FBI, investigators executed search warrants across three time zones in a matter of hours and seized or disrupted 241 scam domains and more than 100 cloud servers hosted by Eastern European and American companies. The servers held the scammers’ victim data, site content and operating software, according to a Wednesday statement.
“Our groundbreaking Virtual Currency Unit identified the fraud, tracked the stolen cryptocurrency, broke new ground by uncovering the infrastructure behind the operation, and worked with the FBI to dismantle it,” Brooklyn District Attorney Eric Gonzalez said.
“By disrupting more than 100 servers and hundreds of fraudulent websites, we have struck at the heart of this criminal enterprise and made it far harder for these scammers to victimize others. I commend our investigators and thank the FBI for their partnership in this extraordinary operation.”
The scam worked by luring victims via Russian-language investment ads on Facebook. A Russian-speaking “advisor” then called and walked them through opening an account on a fake crypto platform and buying digital assets.
Weeks or months later, when victims tried to withdraw, they were locked out or hit with bogus “fees” and “taxes.”
Some lost their life savings. Then the scammers came back for more: Posing as recovery services, they contacted victims weeks later and promised to retrieve the stolen money.
The unit had already taken down 400 scam domains, but new ones kept appearing. Hitting the servers behind them cuts off the scammers’ ability to launch new sites quickly or reach past victims.
The three-year investigation has recovered about $300,000 so far, and prosecutors say they are working to claw back more.
This post Brooklyn DA Pulls the Plug on Crypto Scam Network first appeared on Bitcoin Magazine and is written by Mathew Di Salvo.
Bitcoin Magazine
Bitcoin’s Volatility Has Fallen Within S&P 500 Ranks, Study Shows
Stocks and shares are a safer bet than buying bitcoin? Not so fast.
According to research from crypto asset manager Grayscale, the digital coin’s realized volatility fell within the distribution of S&P 500 constituents — with a meaningful number of large-cap stocks exhibiting more price swings.
Bitcoin’s price surged in August and September, giving it its best quarter in years and leading a number of analysts to declare that it’s back in a bull market.
“As the asset has matured, with deeper liquidity, broader institutional participation, and more regulated access venues, its price swings have narrowed considerably from the extremes of its early years,” the Grayscale’s head of research, Zach Pandl, wrote in a Wednesday note.
“That shifts the question from whether to own a volatile asset to how to size an allocation.”
He added that bitcoin’s volatility has declined to 43% over the past year, from an average of 64% over the past 10 years and 81% five years ago.
It is now lower than that of 19% of S&P 500 constituents. “For those comfortable owning volatile equities, Bitcoin’s price fluctuations may be less daunting than assumed,” the report added.
December data from K33 Research revealed that 2025 was the least volatile year for the asset so far.
Bitcoin’s price became notorious for wild swings in its early days — with drawdowns of over 80% in the space of months.
But as more investors have piled into the asset — especially since the 2024 approval of U.S. spot bitcoin exchange-traded funds — it’s become harder to move its price.
Still, bitcoin at one point in 2026 was down over 50% from the all-time high it hit last October . It has since recovered and was recently trading for $82,485 — 35% below its record of $126,080.
The coin in August benefited from news that the U.S. Treasury would at least double the size of its liquidity-support buyback operations. The so-called debasement trade — where investors buy an asset to hedge against a weakening currency — has become popular again, especially as the dollar has dropped.
This post Bitcoin’s Volatility Has Fallen Within S&P 500 Ranks, Study Shows first appeared on Bitcoin Magazine and is written by Mathew Di Salvo.
Bitcoin Magazine
US Hoovers up Bitcoin While the World Runs on Its Digital Dollars: Report
America is accumulating bitcoin while exporting dollar-pegged stablecoins to everyone else, according to a new Chainalysis report.
The blockchain data said in its Wednesday report, “North America: Inside the Growth of Agentic Commerce,” that the U.S. became a net importer of Bitcoin in 2026 — for the first time since 2022.
According to the data, institutions this year have been buying bitcoin while retail largely sells.
“A dollar stablecoin is a way to hold dollars without an American bank account, and Americans already have one,” the report read.
“The rest of the world is pivoting to a digital dollar because it meets a need that American users don’t share. Meanwhile, Americans are leaning harder on bitcoin as an infinitely scarce store of value.”
It added that U.S. dominance keeps climbing: Since the 2024 launch of spot bitcoin exchange-traded funds, America’s share of global Bitcoin activity has risen every single reporting period — even as the overall U.S. crypto economy ($2.78 trillion) contracted 2.2% in a brutal bear market, retaining most of 2025’s near-doubling.
The U.S. Securities and Exchange Commission approved bitcoin ETFs in January 2024 after a decade of denying the products.
Managed by Wall Street titans like BlackRock, Fidelity, and most recently, Morgan Stanley, the funds had the most successful debut in the history of ETFs.
Institutions and Wall Street can now buy shares of the funds which track the price of bitcoin and take care of buying and selling the digital coin.
The approval of the ETFs has helped the industry mature, the report noted, and helped the U.S. become an overall bigger bitcoin investor.
Stablecoins, meanwhile, have turned U.S. debt into a “currency-of-choice for peer-to-peer economies as well as businesses working across borders,” the report continued.
“In the 2026 period we continued to see stablecoins enter new use cases most especially abroad, benefitting the U.S. companies, and the U.S. government, with billions of dollars in economic activity,” it added.
Since Donald Trump became president, he has signed a number of pro-crypto laws and executive orders. The GENIUS Act, signed in 2025, allows banks and other entities to issue stablecoins if they back the tokens with assets like U.S. Treasuries and provide monthly disclosures of their reserves.
This post US Hoovers up Bitcoin While the World Runs on Its Digital Dollars: Report first appeared on Bitcoin Magazine and is written by Mathew Di Salvo.
Bitcoin Magazine
Ledger Says Organized Crime Group Spent Millions Targeting Hardware Wallet Users
Ledger has issued a statement following reports from customers of loss of funds and tampered devices, calling it one the most “sophisticated attacks” the digital asset industry has experienced.
The hardware manufacturer said Thursday that a “highly organized criminal group” bought Ledger devices and installed implants that could read users’ seedphrases before then putting them back into the supply chain via resellers.
Paris-based Ledger last week said it had started an investigation after customers in South East Asia reported they’d lost funds after buying from Malaysia-based reseller, CryptoBilis.
The company then said it confirmed that one of the impacted users’ devices contained an unauthorized hardware implant.
It isn’t clear how much money has been lost from the tampered devices but blockchain investigator Specter said $86 million had been drained. Ledger did not respond to Bitcoin Magazine’s written questions.
“[The criminal group] built their own logistics and technology infrastructure with seeds collector servers, draining and laundering infrastructures. They were patient, they spent millions, and they struck in one coordinated operation, draining wallets,” Ledger said in a Thursday statement.
“There was no flaw in Ledger’s chip, operating system or servers. Ledger’s systems were not compromised. This was an attack on the distribution channel after the devices left our control.”
The company said that in its “largest investigation to date” it sent employees to other markets — including Europe — to make sure other supply chains hadn’t been targeted.
It said that screened devices were clean and authorized resellers and distributors in Southeast Asia and Hong Kong have suspended their sales.
Ledger added that it was working with law enforcement to “follow the funds and dismantle the attackers’ infrastructure.”
It isn’t clear how many customers had been targeted from Ledger’s statement.
The crypto industry is still reeling after hackers in July were able to steal close to $120 million in bitcoin from Coldcard users.
There have also been a number of data breaches this year, with scammers targeting Ledger to get customer information via the company’s payment processor Global-e.
This post Ledger Says Organized Crime Group Spent Millions Targeting Hardware Wallet Users first appeared on Bitcoin Magazine and is written by Mathew Di Salvo.
Bitcoin Magazine
Bitcoin Briefly Slides Below $80,000 On More Hot Inflation Data
Bitcoin’s price momentarily dipped below $80,000 on Thursday following more hotter-than-expected U.S. inflation data.
The price of the biggest cryptocurrency recently stood at $81,028 after dropping as low as $79,805 on Thursday morning in New York.
Over a 24-hour period, it’s only down over 1% after making a recovery. But over the past week, it’s shed nearly 3% of its value.
Data Thursday from the Labor Department’s Bureau of Labor Statistics showed U.S. producer prices rose in September at the fastest pace in more than four years.
The numbers came one day after September’s Consumer Price Index came out higher than expected.
Bitcoin has news that high prices won’t go away in the world’s largest economy — leading traders to bet that the Federal Reserve may keep interest rates higher for longer.
The Federal Reserve will make a decision on what to do with interest rates at the end of this month.
Bitcoin’s price has previously done well in a low interest rate environment as when borrowing costs are cut, more liquidity can be used to buy the cryptocurrency.
But the Fed this year has raised interest rates, with the head of the central bank claiming that getting inflation down in the U.S. is its number one priority.
The biggest cryptocurrency is currently nearly 36% below the record of $126,080 it touched last October.
Despite the dip this week, analysts have declared the asset to be out of the bear market it spent most of 2026 following a rally in August and September.
This post Bitcoin Briefly Slides Below $80,000 On More Hot Inflation Data first appeared on Bitcoin Magazine and is written by Mathew Di Salvo.
CryptoSlate
Reservations are open for the data-only device, which pairs everyday apps with hardware approvals and targets 2027 delivery.
Read the full story on CryptoSlate
Understand the crypto stories that matter and what to watch next. Get The Catalyst in your inbox
Nic Carter's hypothetical attack highlights why safer signatures would leave an ownership choice for holders unable to migrate or prove prior control.
Read the full story on CryptoSlate
Understand the crypto stories that matter and what to watch next. Get The Catalyst in your inbox
River’s net holdings figures show concentration, while issuer disclosures separate fresh purchases from merger transfers, expected financing and share buybacks.
Read the full story on CryptoSlate
Understand the crypto stories that matter and what to watch next. Get The Catalyst in your inbox
The October 12–15 custody build raises a supply question, but the balance data cannot establish completed sales.
Read the full story on CryptoSlate
Understand the crypto stories that matter and what to watch next. Get The Catalyst in your inbox
Streami and Pravang are among 16 affected financial companies as the FSC outlines plans for a wider security overhaul.
Read the full story on CryptoSlate
Understand the crypto stories that matter and what to watch next. Get The Catalyst in your inbox
CryptoTicker.io
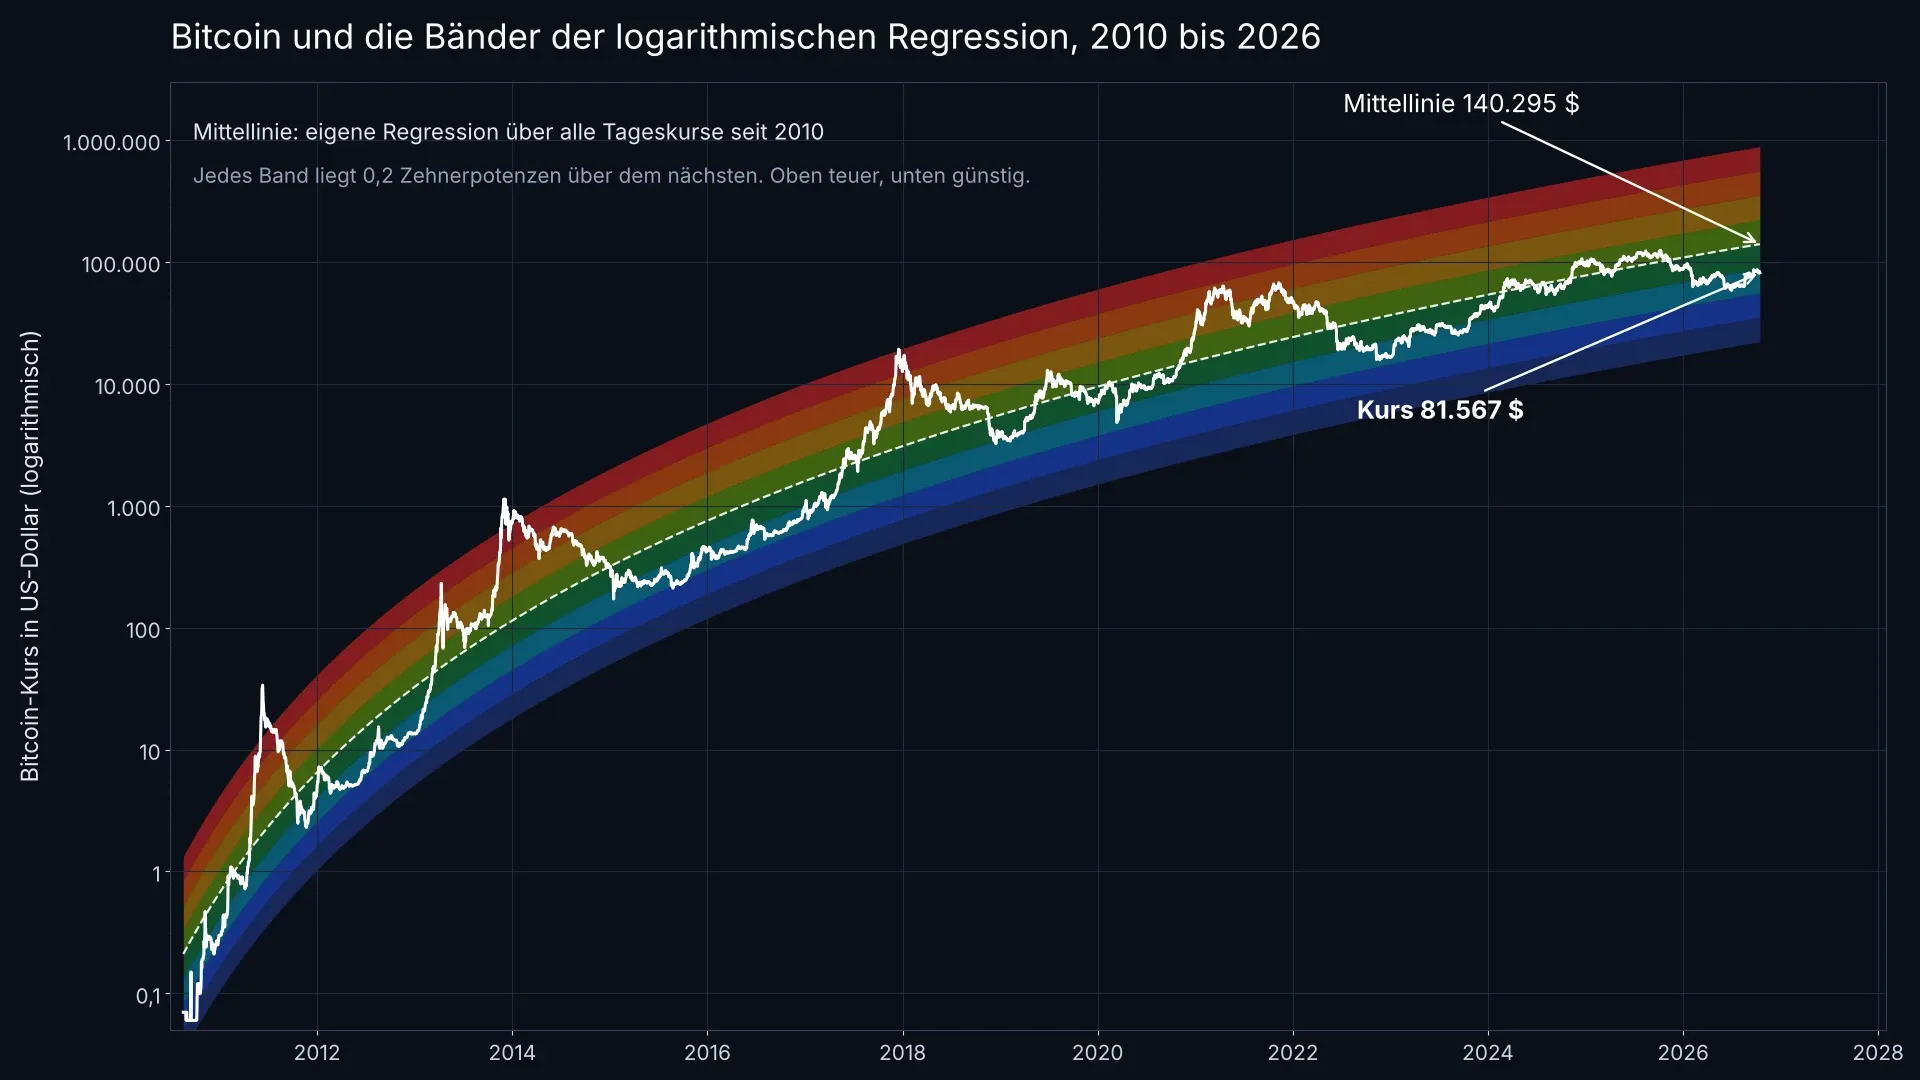
The Bitcoin Rainbow Chart is not a price target but a frame of reference: it lays nine coloured bands over the price history and shows whether the current price sits high or low against the long-term growth path. Recalculating the regression across every daily close since 2010, the centre line of the arc runs at roughly $140,300 on this October 15, 2026. The bitcoin price itself stands at $81,600 to $82,200. Bitcoin is therefore trading well below the middle of its own historical trend, in the green zone of the arc.
That is exactly the appeal of this presentation, and at the same time its danger. The arc turns a volatile price into a tidy graphic with clear colours. That the colours themselves rest on an assumption which shifts with every cycle is not something the picture reveals.
What the Bitcoin Rainbow Chart shows: nine bands around a logarithmic regression
A logarithmic regression is a fitted curve drawn through a cloud of points whose increments shrink over time. For bitcoin that means the price grew by multiples at first and by percentages later. Plot the price on a logarithmic axis, where each step upwards means a tenfold increase, and the steep climb of the early years becomes an almost straight line.
That line is the middle of the arc. Around it the model places bands at fixed distances, above and below. The common presentation works with nine bands, from a deep blue zone at the very bottom to a red zone at the very top. Each band stands for a fixed distance from the middle, measured in powers of ten. A distance of 0.2 powers of ten corresponds to a factor of 1.58, a distance of 0.6 powers of ten to a factor of 4.
In the best-known version the colours carry mocking names, from the sell-off at the bottom to maximum bubble territory at the top. The operator of the site writes himself that there is no scientific basis for it and that you cannot predict the price with a rainbow. That line does not sit in the small print but directly beneath the graphic.
The formula behind the arc: why the centre line grows with the logarithm of the days
The calculation behind it fits on one line. The centre line follows from the number of days since the blockchain started in January 2009. The base-ten logarithm of the price grows linearly with the natural logarithm of the elapsed days. In the original 2014 version it reads: price equals 10 to the power of 2.9065 times the natural logarithm of the days, minus 19.493.
The two numbers 2.9065 and 19.493 are no natural constants. Both come from a fitting exercise on the price data available in 2014. Repeat the same calculation with more data and you get different numbers. Recalculated across all 5,903 daily closes from August 18, 2010 to October 15, 2026, the coefficient is 2.4318 and the subtracted term 16.2007.
The difference sounds small and is enormous. With the 2014 numbers, the centre line would sit at around $1.14 million today. With the numbers from the complete price history it sits at $140,300. The same model, the same form of equation, a difference of a factor of eight. The centre line is therefore no property of bitcoin but a property of the period it is calculated from.
Where the price sits today: 0.24 powers of ten below the centre line
For October 15, 2026, the calculation across the full price history gives a centre line at $140,295. The daily close stood at $81,567, with afternoon trading at around $82,200. The distance is therefore 0.24 powers of ten to the downside, or in familiar terms: bitcoin costs 58 percent of what the fitted curve shows for this day.
The distance to the all-time high helps place that. It stands at $124,777 and dates from October 7, 2025, the week of a good year ago. From the high to today the price has given up around 35 percent, while the centre line has kept rising over the same year. Together, both push the price down within the arc without anything having changed about bitcoin itself.
The nine bands in dollars: from 35,240 to 885,200 for October 15, 2026
Because the centre line rises every day, the band boundaries move with it. For today they sit, calculated from the same fitted curve, at these values:
- $35,240 and below: the lowest zone, the sell-off in the familiar version
- $35,240 to $55,852: deep blue zone, historically the floor of severe bear markets
- $55,852 to $88,520: green zone, where the price stands today
- $88,520 to $140,295: light green zone below the middle
- $140,295 to $222,352: first zone above the centre line
- $222,352 to $352,405: yellow to orange zone
- $352,405 to $558,524: orange to red zone
- $558,524 to $885,200: red zone
- above $885,200: the maximum bubble territory of the presentation
These numbers apply to this one day. In a year the centre line sits around 9 percent higher on the arithmetic, in five years around 39 percent. The model therefore extends a path that rises more slowly than in the early days but never stops rising. That too is an assumption, not a measurement.
How often bitcoin stood in which band: 1,772 of 5,903 days in today's zone
A model is worth only as much as its hit rate. Count how many days the price spent in which band and a lopsided picture emerges. The zone where bitcoin stands today was by far the most frequent, with 1,772 of 5,903 days: 30 percent of the entire price history. Together with the two neighbouring bands around the middle, 75 percent of all days add up.
The spectacular edges, by contrast, are almost empty. Above the red zone, in maximum bubble territory, the price spent 100 days, or 1.7 percent of the time. Below the deepest blue band it was 36 days, or 0.6 percent. Waiting for those edges means waiting a statistically very long time. Over the past seven years the lower edge has not been reached once.
A sober finding follows. The colour scale promises a decision aid but fails to deliver one precisely when it would be needed. For 75 percent of the time the price stands in the broad middle, and there the colour says nothing a glance at the price chart would not show as well.
Where the model comes from: a 2014 joke and a regression from the Bitcointalk forum
The rainbow and the calculation have different fathers. The coloured arc over the price history appeared in August 2014 as a post in a Reddit forum and was, according to several retrospectives, half ironic: a jab at the scene's habit of seeing a law of nature in every price chart.
The calculation beneath it came the same year from another corner. On October 22, 2014, a user opened the thread "Logarithmic (non-linear) regression - Bitcoin estimated value" in the Bitcointalk forum and presented the formula there along with a chart. In his own post, the author writes that the whole thing is "just a model, not a crystal ball".
The two parts were brought together later on the Blockchaincenter site, which maintains the chart to this day. Its operator reworked the formula in November 2022, after the price broke through the lower boundary of the old version on its fall below $16,000. The current version continuously fits the regression to the entire price history.

Where the model goes wrong: the centre line falls with every cycle
The heaviest objection to the Rainbow Chart can be worked out on paper. Fit the same curve through the price data only up to a given cut-off date and it becomes clear how strongly the result depends on the period chosen. For today, the calculation says:
- With data only to the end of 2014: centre line today at $1,140,722
- With data only to the end of 2017: centre line today at $141,720
- With data only to the end of 2021: centre line today at $193,892
- With data only to the end of 2024: centre line today at $150,388
- With all data to today: centre line at $140,295
The 2014 version is off by a factor of eight, because it was extended twelve years into the future. That alone would be no reproach. What stands out is the direction: every extension of the data window pushes the curve down. The model therefore always corrects itself the same way, and only once the price has forced it to.
In practice that means a band showing "cheap" today can show "expensive" in two years after the next adjustment of the same formula, without the price having moved. A statement that changes retrospectively is no basis for a purchase decision.
The cycle highs are moving down: from 1.04 to 0.47 powers of ten above the middle
The same development shows in the three big price peaks. Measured against today's fitted curve, the high of November 30, 2013 stood at $1,134 and therefore 1.04 powers of ten above the centre line, or eleven times it. The high of December 16, 2017 reached $17,508 and 0.77 powers of ten; the high of November 9, 2021 stood at $67,562 and only 0.47 powers of ten above the middle.
The lows move along too, but less strongly: the floor of December 15, 2018 sat 0.22 powers of ten below the centre line, that of November 21, 2022 at 0.33. The price therefore swings in an ever narrower corridor around its trend. For a model with nine equally wide bands that is a problem: the outer bands lose their function because the price no longer reaches them. October 7, 2025 at $124,777 was the most recent cycle high, and that too stayed within the middle bands.
To place the market breadth behind this, metrics with the same ambition but a shorter horizon are in our look at the 200-day line and the hashprice. The halving rhythm underlying many of these cycle comparisons is shown in our halving overview.
Rainbow Chart against stock-to-flow: two models, one design flaw
The Rainbow Chart has a well-known relative. The stock-to-flow model derived the bitcoin price from the ratio of existing supply to annual new production and was considered strikingly accurate around 2020. It predicted six-figure prices for the years after the 2020 halving and was, measured against the actual course of 2022 and 2023, far off.
Both models share the same design flaw: a curve that fits the data so far already counts, for them, as a property of the market. The longer the series grows, the worse the original curve fits, and the more often it has to be readjusted. A model that adapts to every new data point describes the past ever better and the future not one day further.
Both are therefore usable as a reading aid and useless as a signal generator. Comparing valuation models properly takes raw data rather than colourful pictures. An overview of the tools for that is in our comparison of crypto analytics platforms.
What the Rainbow Chart is worth for investors in Europe: a frame, not a buy signal
For investors the chart remains an orientation picture with tight limits. Three points count in practice. First, the colour is a statement about the distance to the price's own trend, not about the business behind it, the regulation or the rate environment. Second, the scale changes retrospectively, which makes any buying rule built on it unreliable. Third, it says nothing about timing: the price can spend years in one band.
In tax terms the chart changes nothing in any case. For private disposals of cryptocurrencies, the one-year holding period under Section 23 of the German Income Tax Act applies, and once it has run, a gain is tax-free. A sale that a colour suggests can destroy a running holding period and therefore cost more than the supposedly good entry level brings in.
If you still want something out of the model, use it as a cross-check on your own mood. When the price sits high in the arc and enthusiasm does too, the question of where the next buyer is to come from is worth asking. When it sits in the green zone as it does today amid general apathy, that is no buy signal, but it is an indication that the market is not trading expensively against its own history. For regular purchases over time, the cost-average effect is the more sober answer than any colour scale.
Rainbow Chart: $140,000 is a calculation, not a forecast
The centre line at $140,295 is the result of a fitting exercise across 5,903 daily closes, not the announcement of a future price. The distance of 58 percent to today's price describes the present and says nothing about the next month. Three steps follow from it:
- Check the data basis before trusting a colour. With any presentation, ask which period the regression comes from and when it was last adjusted. Tools that disclose raw data and the basis of calculation are in the comparison of analytics platforms.
- Decouple purchases from the model. A fixed amount at a fixed rhythm needs no colour reading and sidesteps the problem of a retrospectively shifted scale. Which providers allow that at what cost is shown by the comparison of bitcoin savings plans.
- Settle custody separately from the price. Whether the price sits in the green or the red band changes nothing about key risk. The devices for it are compared in our overview of hardware wallets.
The full interactive version of the model, including the operator's statement that the chart has no scientific basis, is on Blockchaincenter.
(As of October 15, 2026. This article is not investment advice. Prices and fee structures change; check the terms with the provider before you buy.)
The US Labor Department published September's producer prices this Thursday, and they come in markedly hotter than Wednesday's consumer price index: prices for final demand rose 1.3 percent against August and 6.3 percent over twelve months. That has two consequences for your portfolio. The market is once again pricing in a rate rise on October 28, and it has already taken two different views of that today. Bitcoin fell to just under $80,000 in the turbulence and is back at $82,266.
The producer price index measures what producers receive for their goods and services before retailers and consumers pay for them. It therefore sits at the start of price formation, not at the end. That is exactly what makes the 6.3 percent uncomfortable: consumer prices stood at 3.7 percent in September, as cryptoticker.io reported on October 14. A gap lies between the two readings, and gaps of this kind have historically closed upwards rather than downwards.
September producer prices: 1.3 percent on the month, 6.3 percent on the year
The figures are in the producer price index release from the Bureau of Labor Statistics, published on October 15 at 8:30 am New York time. The index for final demand rose 1.3 percent against August on a seasonally adjusted basis. Unadjusted, it climbed 6.3 percent in the twelve months to September.
A monthly jump of 1.3 percent is large for this series. Annualised, the rate would sit in double digits. Such extrapolations are no use as a forecast, because individual months swing sharply, but they show why the reading had an immediate effect in the futures markets.
How the two figures are read matters. The monthly number is seasonally adjusted, the annual one is not. Putting both in one sentence compares two different calculations. For the question of whether the central bank reacts, the trend over several months counts, not a single data point.
Producer prices run ahead of consumer inflation
The mechanism behind this is unspectacular and therefore reliable. When costs for inputs, transport and energy rise, manufacturers and retailers try to pass them on. Whether that works depends on demand. If it does, inflation reaches the consumer with a delay. If it does not, corporate margins shrink.
Both paths are uncomfortable for the central bank. The first means higher consumer prices in the coming quarters, the second weaker profits and therefore weaker equity markets. That is why rate expectations often react more strongly to producer prices than their news value would suggest.
For crypto, the effect travels through real interest rates. The higher the expectation for short-term rates, the more expensive it becomes to park money in assets that pay no yield. Bitcoin pays no coupon. As the expected return on cash rises, the relative calculation worsens, and the current Bitcoin price shows how sensitive the market is to macro data in such phases.
Rate rise on October 28: from 22 to 47 percent and back to 26
The Fed's Open Market Committee meets on October 27 and 28, with the decision coming on the second day. Every data point is currently being recalculated against that date.
How unsettled that calculation is shows in CoinDesk's analysis: after the consumer price report, the probability of a rate rise implied by CME Group's FedWatch tool jumped from around 22 to almost 47 percent and then fell back to 26 percent. On the prediction platform Polymarket it briefly rose to almost 50 percent and eased to about 30 percent. The same source reads a probability of more than 70 percent for an unchanged rate out of Fed funds futures at the same time.
That spread is the real story. There is no consensus at present. One camp considers a rise likely, while the majority stays with an unchanged rate. Positions leveraged towards either side will end up on the wrong one several times over the next 13 days.

Bitcoin at $82,266, session low just under the $80,000 level
According to CoinGecko, bitcoin is quoted at $82,266, with the session high at $82,508. On the downside the move reached $79,806 or $79,711 depending on the data source, which means the round number broke during the session. Ether fell to a low of $2,324.97 and stands at $2,456.
The $80,000 mark is the line where something will be decided over the coming days, for two reasons. First, the price tested it today and won it back, which makes it an evidenced level rather than a drawn one. Second, below it lie the positions that were already closed out today.
Liquidations: $948.22 million in 24 hours, 90.6 percent on the long side
A liquidation is the forced closure of a leveraged position by the exchange as soon as the collateral no longer suffices. It is not a sale out of conviction but a technical process, and it hits the price because the exchange sells at the next available level.
According to CoinGlass data compiled by Decrypt, positions worth $948.22 million were closed out within 24 hours, spread across 177,440 accounts. Long positions accounted for $858.96 million, or 90.6 percent. Ether led the list with $282.03 million, with bitcoin following at a good $200 million.
One detail from the same analysis explains this article's headline better than any percentage: the largest single position was a bitcoin long worth $12.03 million, which the exchange Binance closed out at $80,208.96. Precisely there, a few dollars above the round number, lay the threshold at which a paper loss became a realised one.
ETF outflows on October 14: $150.5 million after an inflow the day before
US exchange-traded funds on bitcoin recorded outflows of $150.5 million on October 14. The day before, $175.7 million had still flowed in. These figures come from Vikram Subburaj, head of the trading platform Giottus, quoted in the analysis linked above.
The change of direction within a single day fits the picture of the rate bets. Fund flows are no use as a leading indicator. What shows up in them is the trace of decisions already taken. Reading them as a forecast confuses cause and effect. To see whether a move is carried by large addresses, fund flows offer a usable cross-check.
Outside crypto, the day was equally unsettled. South Korea's benchmark Kospi index lost 8 percent according to the same source, triggering its automatic trading halts. That puts the crypto move in context: it belonged to a broad retreat from risk across several asset classes.
Funding rate and open interest: the two metrics before the rate decision
Open interest is the sum of all outstanding futures contracts. It says how much leverage sits in the market. The funding rate is the balancing payment between the long and short side in perpetual futures contracts, known as perpetuals. When it is positive, buyers pay, and that is the normal case in rising markets.
Together, the two answer a question the price alone does not: whether a move is carried by fresh money or by leverage. If the price rises while open interest falls, shorts are mainly closing their positions. If it falls with high open interest and a positive funding rate, further forced closures are queued up. If you use leveraged products, the running costs and the liquidation rules are in the perp exchange comparison, because those terms decide exactly at what price a position dies.

What has changed since the consumer price report of October 14
cryptoticker.io published its own assessment of the consumer price index yesterday: US inflation rises to 3.7 percent. Three things are new since then.
First, the producer price index is now out, and at 6.3 percent year on year it runs well above the 3.7 percent on the consumer side. Second, the rate bet has turned a full circle: up to almost 47 percent, back down to 26. Third, the $80,000 level, which still had room yesterday, broke today and was won back. A number in the calendar has thereby become a level with a history.
The twelve-month holding period: selling in a panic costs tax
The holding period is the time after which a gain from selling crypto-assets remains tax-free in Germany under the law as it stands. It is one year, counted from acquisition, and it applies per purchase. Selling on the day of a macro shock gives that period away for precisely the units handed over.
That is why a rate decision is a different question for a long-built holding than for a leveraged position. The leveraged position has a mechanical end determined by the price. The holding has a tax date determined by the calendar.
Before reacting to a macro figure, a look at your own acquisition history pays off: which tranches are more than a year old and which are not. A portfolio tracker with a tax function answers that in minutes, where doing it by hand takes considerably longer across several purchases.
The purchase route under MiCA: authorisation, spread and payout
MiCA is the EU regulation on markets in crypto-assets. It requires trading venues to hold an authorisation and governs what information they must give customers. In practice, that means you can check a provider's authorisation, the gap between its buying and selling price and the time a euro payout takes before you buy.
Payout times are underestimated in quiet weeks and expensive in unsettled ones. On a day with $948 million in liquidations, deposit and withdrawal routes are measurably slower, because the review processes run under load. Noticing only then that your account is not fully verified costs days.
Our assessment: the rate path hangs on two data points, not one
From the newsroom's point of view, the 26 percent probability of a rise on October 28 looks too low rather than too high. In favour of that are the 6.3 percent on the producer side and the monthly jump of 1.3 percent, two readings from the same release that both point the same way. Against it is that the market has already driven the same bet to 47 percent today and unwound it again, and that Fed funds futures still argue for more than 70 percent in favour of an unchanged rate. A central bank caught between two contradictory data series waits, when in doubt, for the third.
No directional bet follows from that, but preparation for both outcomes does. Leveraged positions have a poor ratio of opportunity to risk in this muddle, because the market reprices the probability twice a day. For an unleveraged holding, a single rate step changes the investment case little. A total loss is possible at any time with crypto-assets, and that holds regardless of how this meeting ends.
Fed decision on October 28: 13 days to the rate verdict
- Measure the leverage against the $80,000 level. Put your liquidation price next to today's session low of $79,806. If it sits above, today's move would have ended your position. The cost side and the liquidation rules are in the perp exchange comparison.
- Sort out the acquisition dates. Check which tranches have reached the twelve-month period and which have not, before a macro figure pushes you into a sale. A tax and portfolio tool shows that per purchase.
- Test the payout route. Transfer a small amount in euros and measure how long it takes. Knowing your route means not having to look for it on the day of the rate decision. Authorisations and fees of the providers are in the exchange comparison.
(As of October 15, 2026. This article is not investment advice. Prices and fee structures change; check the terms with the provider before you buy.)
The European Banking Authority classified USDC as the first significant e-money token in the European Union on October 14, 2026. The status sounds technical, but it carries one concrete consequence with a date attached: from November 12, 2026, the EBA will examine the reserve behind your USDC itself, jointly with the French supervisor ACPR. Until now that examination sat with Paris alone.
What is affected is not the token in your wallet but the issuer behind it. In the EU, USDC is issued by Circle Internet Financial Europe SAS, and in the United States by Circle Internet Financial, LLC. The European company stands behind the reserve for tokens held in the European Economic Area, and it is precisely that company's own funds, reserve assets, liquidity requirements and recovery and redemption plan that move into the EBA's direct remit.
What the EBA decided about USDC on October 14
The authority classified USDC as a significant e-money token after assessing the criteria set out in the Markets in Crypto-Assets Regulation (MiCA). According to the EBA, 45 e-money tokens are currently notified in the European Union. USDC is the first to receive the status.
Under MiCA, an e-money token is a crypto-asset that references the value of a single official currency, the US dollar in the case of USDC. Significant means the token has reached a size and a degree of interconnection at which national supervision alone is no longer sufficient. The regulation draws no penalty from that, but a shift of competence upwards.
For scale: according to CoinGecko data at 15:53 on October 15, 2026, USDC has a market capitalisation of around $72.58 billion, roughly 64.77 billion euros, with about 72.60 billion tokens in circulation and sixth place in the overall market. That figure covers both issuers, the European and the American.
Significant e-money token: what the status triggers under MiCA
MiCA recognises two classes of value-stable crypto-assets: asset-referenced tokens (ARTs), which reference a basket or another value, and e-money tokens (EMTs), which are pegged to exactly one official currency. The EBA may attach the label "significant" to either. The legal basis is Articles 43 and 56 of the regulation.
The consequence differs by class. When an asset-referenced token becomes significant, the issuer passes entirely under EBA supervision. With a significant e-money token, the EBA and the competent national authority divide the work. That shared competence is governed by Article 117, and it is the reason the ACPR in Paris remains in play.
The classification is not a one-off act. The EBA assesses at least annually whether a token should continue to count as significant or whether the criteria are no longer met. The status can therefore fall away again.
Which criteria the EBA assesses, and which it does not name
The regulation lists a set of criteria against which the importance of a token can be measured: the number of holders, the value of the tokens issued and of the reserve, the number and volume of transactions, the interconnectedness with the financial system, cross-border use, and integration into other crypto-asset services. A token becomes significant when it meets several of these criteria at once.
Which indicators apply in detail is set out in Commission Delegated Regulation (EU) 2024/1506. In its statement, the EBA additionally refers to its own decision EBA/DC/558.
One gap remains, and it belongs to the story: the EBA does not state in its announcement which individual criteria USDC met. It says only that it assessed the criteria in the regulation. If you want to know whether the classification turned on the number of holders or on transaction volume, the publication offers no answer.

From November 12, 2026: four supervisory fields move from the ACPR to the EBA
The date is the hard part of the story. From November 12, 2026, USDC falls under the shared supervision that MiCA provides for significant e-money tokens. Direct responsibility passes from the Autorité de Contrôle Prudentiel et de Résolution to the EBA in four fields:
- Own funds. How much hard capital the issuer must hold beyond the reserve.
- Reserve assets. What the backing consists of, how it is held separately and who manages it.
- Liquidity requirements. How quickly the reserve can be turned into cash if many holders want to redeem at the same time.
- Recovery and redemption plan. What is to happen if the issuer gets into difficulty or winds down operations.
Those four fields are exactly the ones that decide whether a stablecoin's nominal euro or dollar is still a euro or a dollar in the end. That their examination moves up a level is the substantive part of the decision.
What stays with the French ACPR: governance, qualifying holdings, outsourcing
The ACPR is not handing over its whole role. According to the EBA it remains responsible for corporate governance, for qualifying holdings, for the fit and proper assessment of senior managers, for outsourcing and for conflicts of interest. Both authorities say they will work closely together to make the transition smooth.
In practice, that means Circle's e-money authorisation stays in France, and the authority watching over board appointments and outsourcing contracts still sits in Paris. Where the numbers behind the token are concerned, a European authority is the addressee from November. How MiCA spreads obligations across crypto firms is set out in our overview of the MiCA licensing duties for crypto companies.
Dual supervision under Article 117: how two authorities share one authorisation
Shared supervision is no special case in European financial supervision, but it brings one peculiarity: there are two addressees with different questions. MiCA handles this through supervisory colleges set up for significant tokens (Article 119) and obliges the EBA to exercise its powers in close cooperation with the other competent authorities (Article 117(5) and Article 128).
For the mechanics of the reserve, that makes a difference in enforcement. A national authority examines an issuer within its own jurisdiction. A European authority can request the same data without going through a national intermediate step, and it sits at the same time at the end of the lines to supervisors in the other member states where the token circulates. That shortens the path between a finding and a measure.
Circle Internet Financial Europe SAS: why the issuer matters for holders in the EEA
USDC has two issuers. In the European Union, Circle Internet Financial Europe SAS issues the token; in the United States, Circle Internet Financial, LLC. The tokens of both companies are interchangeable; a USDC from Europe is indistinguishable on the blockchain from one from the US.
Because the tokens are interchangeable, you do not need to work out which company issued "your" USDC, and an individual token would not tell you anyway. What counts is who is obliged to redeem for you when you buy through a European platform. The EBA's supervisory reach is directed at the European company.
Memorandum with the New York financial regulator: the bridge to the US
One detail of the announcement is easily lost in the short reports: the EBA has concluded a cooperation arrangement with the New York State Department of Financial Services. Its purpose is the exchange of information between the two authorities, to support the supervision of cross-border stablecoin activity.
That is the second lever alongside the shift of competence, and it says more about the situation than the change of status itself. A dollar token with two issuers on two continents cannot be supervised sensibly if each authority sees only its own half. That the European side reaches for New York first rather than Washington follows the division of responsibility: supervision of Circle's American business is seated in New York State.

Redemption at par: the claim held by European holders stays
The classification changes nothing about your claim, and that is the most important piece of information for holders. MiCA gives the holder of an e-money token a claim against the issuer to redeem at par at any time. That claim existed before October 14 and exists after it. What changes is the authority that checks whether the issuer can actually meet it.
Nor does tradability change. There is no deadline by which you would have to file, move or confirm anything, and no delisting is on the table. If you hold USDC on a platform authorised in the EU, you will notice nothing on November 12: the handover plays out between two authorities and one issuer.
Where the status does make a difference for you is in how you compare. Of the 45 e-money tokens notified in the EU, USDC is the first with European supervision over its reserve. If you are choosing between value-stable tokens, that is a distinguishing feature none of them had before. Which stablecoins exist and how they differ in backing and authorisation is shown in our stablecoin overview; which issuers are authorised in the EU at all is in the MiCA register of stablecoin issuers.
Custody and tax: where the classification improves nothing
Two risks remain untouched, and it would be a mistake to confuse them with supervision.
The first is custody. The EBA examines the issuer's reserve, not the exchange where you leave your tokens. If a platform fails or is attacked, the token's status does not help. A stablecoin on someone else's platform is a claim against that platform, significant token or not.
The second is tax. In Germany, stablecoins are crypto-assets for tax purposes like any other; swapping bitcoin into USDC is a disposal and not a neutral parking manoeuvre. Using stablecoins as a way station therefore accumulates events that matter for tax, and the EBA's supervisory decision has no bearing on that.
Our assessment of the EBA decision
From the newsroom's point of view, the classification is good news for holders, but smaller news than the headline suggests. In its favour is the cut of the four fields that move across: own funds, reserve assets, liquidity and the redemption plan are precisely the places where a stablecoin breaks, if it breaks. Having a European authority with direct access there puts one more step between you and a failure than before.
Against it is what the announcement leaves open. The EBA does not say which criteria were met, names no additional own-funds or liquidity requirement and publishes no examination calendar. The decision moves a competence; for now it tightens no requirement. That only one of 45 notified e-money tokens holds the status also shows how high the threshold sits, and that is no seal of quality for the European stablecoin market as a whole.
The decision only becomes verifiable in its execution. The next solid data points are November 12 as the handover date and the at least annual review of whether USDC keeps the status.
USDC supervision: from November 12 the EBA examines the reserve itself
- Separate supervision from custody. The EBA examines the issuer, not your storage location. If you hold larger stablecoin balances permanently, they belong in custody you control yourself; the differences are shown in the hardware wallet comparison.
- Check your platform's authorisation, not just the token's. A significant token on an unauthorised exchange is still a platform risk. Which trading venues are authorised in the EU is set out in the overview of crypto exchanges.
- Keep November 12 in the calendar without doing anything. There is no deadline for holders. Use the time for record-keeping instead: every swap into or out of USDC is an event that matters for tax, and the tax tools and portfolio trackers capture it.
The EBA's announcement is public and readable without an account: The EBA classifies USDC as the first significant e-money token in the European Union. An assessment of the decision can be found at Cointelegraph.
(As of October 15, 2026. This article is not investment advice. Prices and fee structures change; check the terms with the provider before you buy.)
XRP trades at $1.3385 on Thursday evening, and the day's most important headline is not about the coin but about the stablecoin standing next to it. On October 15, Ripple opened trading in perpetual swaps on more than 100 real-world reference assets to institutional clients. The collateral posted there is RLUSD. XRP does not appear in that structure at all.
For investors in Europe, that is the real question of the day: Ripple keeps winning business, while the coin has been stuck below the $1.40 zone since October 12. This article works out which part of Ripple's business actually creates demand for XRP, where the day's reliable levels sit, and what the holding period, leverage and purchase route make of all this.
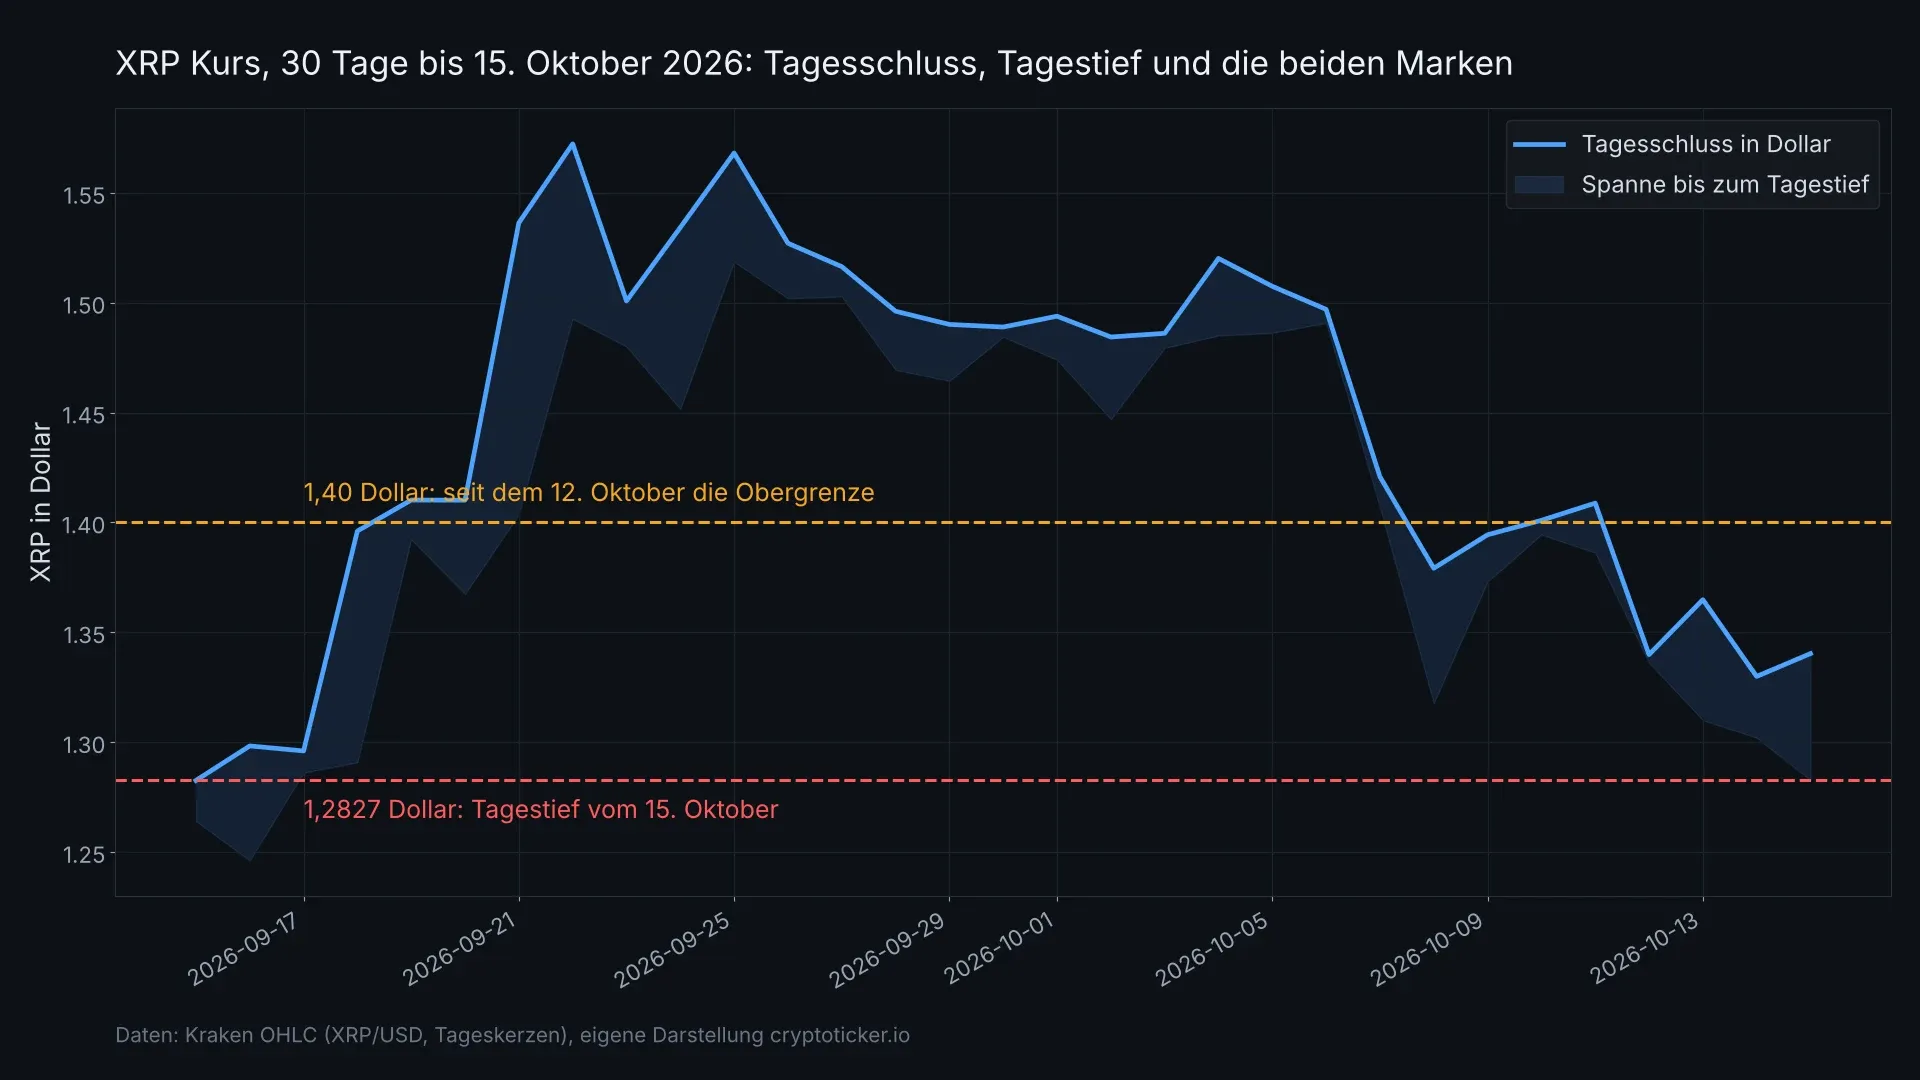
XRP price today: $1.3385 after a session low of $1.2827
XRP opened Thursday at $1.3303, slid to $1.2827 during the session and stands at $1.3385 in the evening (price data: Kraken, XRP/USD pair). The session high is $1.3460. Measured from the low, the price has recovered 4.4 percent and trades in the upper third of the daily range.
Over 24 hours the gain is roughly 1.5 percent, market capitalisation stands at $84.7 billion and turnover over the past 24 hours at $2.35 billion (data: CoinGecko). XRP remains the fifth-largest token by market value.
A perpetual swap is a futures contract without an expiry date: buyers and sellers pay each other a running adjustment through the funding rate, so the contract price does not drift away from the spot price. Those are precisely the contracts Ripple has been offering its institutional clients since October 15, on equities, exchange-traded funds, metals, energy and currencies.
Ripple Prime: more than 100 reference markets around the clock, collateral is RLUSD
Ripple Prime, the group's prime brokerage arm, acts as counterparty to the trades. The reference instruments are the perpetual futures that trade.xyz lists on Hyperliquid. Trading runs continuously, weekends included, and clients may net their positions against other asset classes on the same platform. Michael Higgins, international chief executive of Ripple Prime, described the ambition by saying the unit had been built to work in both worlds, meaning traditional finance and digital infrastructure (CryptoPotato, October 15, 2026).
Ripple Prime grew out of the $1.25 billion purchase of prime broker Hidden Road and has carried the Ripple name since. October already added financing for leveraged funds, a business that banks had until then kept among themselves.
What is decisive for the coin is the question of what clients post against their positions. The answer given is RLUSD, the house's dollar-pegged stablecoin. XRP is listed in the announcement neither as collateral nor as a settlement asset.
What has changed since the Privy agreement of October 14
On October 14, our coverage had XRP at $1.33, prompted by the integration of Privy, the Stripe subsidiary that builds XRP Ledger wallets into third-party apps (XRP price at $1.33 and the Privy deal). Little has moved in the price since: $1.3385 is 0.6 percent above the previous close of $1.3299.
Two things are new. First, the $1.28 level held, with the session low of $1.2827 just above it and comfortably above the monthly low of $1.2461. Second, the swap offering and the DriveWealth settlement deal mean Ripple has announced business twice within two days that runs through RLUSD rather than through the coin. The $1.40 zone that has capped the price since October 12 went untested on both days.
DriveWealth will settle in Europe with RLUSD in future
A day before the swap launch, US financial services firm DriveWealth announced it would integrate Ripple's stablecoin infrastructure for settlement in Europe. RLUSD is to be issued and redeemed on the XRP Ledger, with the same planned for the United States later. Ripple Payments for partners' cross-border transfers and Ripple's custody technology for DriveWealth's crypto business in Europe come on top. Jack McDonald, who runs stablecoins at Ripple, said the agreement came about because DriveWealth had approached the company with a specific cross-border settlement problem (CoinGape, October 14, 2026).
The move matters for the European market because Europe is the starting point here rather than the afterthought. If you trade through a platform that uses DriveWealth in the background, you will see nothing of the change; the settlement rail switches one layer down.
1.05 billion RLUSD sit on the XRP Ledger
How large this stablecoin has become can be read straight off the blockchain. Our own query of the XRP Ledger on October 15, covering the obligations issued by the RLUSD issuer, returns 1,046,787,452 RLUSD in circulation, measured against validated ledger number 107,680,341. A little more than a billion dollars of stablecoin therefore sits on the same blockchain whose native coin has clung below its October range for days.
That figure explains why the debate among holders has run so hot this week. The business is growing visibly; it is simply growing in a unit that is not called XRP.

XRP Ledger transaction fee: ten drops per payment, and how much of it burns
The most common objection runs that every RLUSD payment travels across the XRP Ledger after all and costs a fee in XRP there, which is destroyed. That is correct, and the order of magnitude can be calculated. A drop is one millionth of an XRP. The base fee for a transaction is ten drops, or 0.00001 XRP, and it is indeed destroyed rather than paid out to a recipient (XRP Ledger documentation). Our own query of the current fee confirms those ten drops on October 15, with the network load factor at one.
That leads to a sobering calculation. One million payments on the XRP Ledger burn ten XRP between them. At $1.3385 a coin, that is worth $13.39. By comparison, $2.35 billion of XRP changed hands this Thursday. Even millions of stablecoin payments a day would move nothing through the fee channel that could show up in a price.
There is a second and larger channel, and it is called the reserve: every account on the XRP Ledger must currently keep one XRP permanently in place to exist at all. If account numbers grow strongly through embedded wallets, that ties up XRP without burning it. The effect is bigger than the fee, but it works slowly and it unwinds again as soon as accounts are closed.
Our assessment: the revenue side runs on RLUSD, the price on fund flows
From the newsroom's point of view, this week's announcements show a clear pattern. The business lines Ripple is building out, namely prime brokerage, settlement and payments, earn revenue in dollars and in RLUSD. The evidence sits above: RLUSD as collateral for the swaps of October 15, RLUSD as the settlement asset at DriveWealth from October 14, a little over a billion RLUSD on the ledger. The coin benefits from that indirectly through reserves and fees, and both channels are small, as the calculation above shows.
One point argues the other way and should not be waved aside: each of these agreements binds partners to the XRP Ledger, and a ledger with volume is better for the native coin in the long run than one without. That, though, is a perspective measured in years, not an explanation for a price on this Thursday. In the short term, what funds buy and what positions the futures market holds are what decide, and both have lately produced pressure rather than demand. No buy or sell recommendation follows from this reading.
Levels above and below: 1.2827, 1.3460 and the $1.40 zone
The day's reliable levels come out of the price data itself, not out of a model. On the downside, the first level is the session low of $1.2827. Below that comes $1.2461, the low of the past 30 days, reached on September 16. If the lower level fails to hold, there is no clear support left before that monthly low.
On the upside, the session high of $1.3460 counts first. Above it begins the zone around $1.40, where XRP failed on October 12 and has not knocked again since. From $1.3385, that leaves 4.6 percent to go. Only above that zone would the picture of the past week be broken; the monthly high of $1.6578 sits a good deal higher still.
To keep an eye on those levels you need no software. Two price alerts, at $1.28 and at $1.40, in your own exchange's app are enough, and if you have no suitable trading venue yet, the crypto exchange comparison lists the providers with their fees and their licensing status.
Leverage and liquidation: what the slide to $1.2827 cost
Thursday works well as a worked example because the range was wide. From the opening price of $1.3303 to the low of $1.2827 is 3.6 percent. Unleveraged, that is a poor morning. At three times leverage, the same move is a loss of 10.7 percent in the portfolio, at five times one of 17.9 percent. At ten times leverage, 35.8 percent would be gone on paper, which would already put the position below the usual margin call threshold, in the range of forced closure.
The sequence matters here: the recovery to $1.3385 came only after the low. Anyone liquidated along the way did not take part in it. That is exactly what separates a leveraged position from a holding in your own wallet, and it is the reason leverage on a coin with daily ranges like these does not suit beginners.
In practical terms: the liquidation threshold of your own position should sit below the $1.2461 level, otherwise a day like this one is enough to catch it. If you cannot arrange that, the leverage is set too high.
Holding period, ETPs and tax: two routes, two calculations
The purchase route is where the tax paths part in Germany, and the difference is larger than any fee. Hold XRP directly, on an exchange or in your own wallet, and a sale counts as a private disposal under Section 23 of the Income Tax Act. After a holding period of one year the gain is tax-free; below that it counts towards your personal income tax rate, and an exemption limit of 1,000 euros a year applies to all private disposals taken together.
Buy an exchange-traded product on XRP instead, an ETP or ETN, and the taxation of investment income under Section 20 of the Income Tax Act applies, with the flat withholding tax of 25 percent plus the solidarity surcharge. There is no holding period after which the gain becomes tax-free. In return, the custodian usually withholds the tax directly. Which product is cheaper in tax terms therefore depends on the intended holding period and on your personal tax rate.
Work on the holding period itself is under way politically, but nothing has been decided: the cabinet date of October 15 passed without a resolution, which leaves the December 31 cut-off standing for now, as we reported the same day (Crypto holding period: cabinet date passed). If you have sold this year or still intend to, keep clean records of your acquisition dates; the common tools for that are in the crypto tax software comparison.
XRP at $1.34: without demand of its own, RLUSD carries the turnover
The day ends with a price in the upper third of its range and with two announcements that enlarge Ripple's business without raising demand for the coin. Three steps make a line out of that for the days ahead:
- Set the two levels. One alert at $1.2827 and one at $1.40 map the range the price has moved in since October 12. Both can be set up in any common app, and an overview of the providers is in the exchange comparison.
- Match the purchase route to the tax treatment. Direct holdings with a one-year period and ETPs with withholding tax lead to different calculations. Documenting the acquisition dates is handled by the tools from the tax software comparison.
- Measure the leverage against the daily range. A liquidation threshold above $1.2461 was tightly set on this Thursday. Running the numbers shows quickly whether your own position would survive a second day like it; which venues apply which leverage and fees is shown by the perp venue comparison.
(As of October 15, 2026. This article is not investment advice. Prices and fee structures change; check the terms with the provider before you buy.)
Solana carried the single largest share of trading in tokenized equities again over the past week: around 31 percent of weekly volume across all blockchains, ahead of BNB Chain with 26 percent, Robinhood's blockchain with 25 percent and Base with 18 percent. The figures come from data provider Blockworks, cited by CoinDesk. For Solana it is the first weekly lead in 14 weeks, after Robinhood had led for six weeks running.
The interesting part is less the ranking than what this trading actually is. Buying a tokenized Tesla or Nvidia share through a Solana address does not buy a share. It buys a certificate issued by a company that tracks the share price. That sounds like a technicality, and in Germany it decides the tax burden, what is left if the issuer goes insolvent, and whether the provider may sell the product to retail clients at all.
Solana carries the largest share of tokenized equity trading again
The weekly number is only one of several measures, and the sources measure different things. Blockworks counts the share of weekly volume across all blockchains and arrives at about 31 percent for Solana. Crypto Briefing reports a share of around 65 percent for a single day in the week of October 11, based on volume at decentralised exchanges. Both figures stand side by side because they do not count the same thing: a daily figure swings more than a weekly one, and decentralised exchange volume leaves out centralised platforms such as Robinhood. Presenting either number as Solana's market position rounds off reality.
The order of magnitude of the overall market is not in dispute. Across all blockchains, weekly volume came to just under $3 billion on the same surveys, with volume on decentralised exchanges at $12.4 billion year to date through early October. The stock of tokenized equities on Solana peaked in mid-September at $684 million. Crypto Briefing puts the number of wallets holding such tokens in a range of 727,000 to 850,000. Most of the activity on Solana is concentrated at the decentralised exchange Raydium, with 63 to 70 percent.
For a sense of scale: daily equity turnover at Deutsche Börse is regularly above these weekly figures. Tokenized equity trading is a small, fast-growing side market, not a competitor to the regulated floor. That matters for perspective, because the products nevertheless arrive with the promise of being tradable around the clock.
What an xStock is in law: a bearer note rather than a share
The most widespread product on Solana is the xStocks range from Backed Finance, a firm that now belongs to Kraken. As set out in our October 14, 2026 article on tokenized equities as collateral, these tokens are in law tracker certificates in the form of bearer notes. The base prospectus was approved by the Liechtenstein financial market authority and subsequently passported into the European Economic Area.
A bearer note is a document in which an issuer promises the holder a payment. Applied to an equity token, that means you hold a claim against Backed Finance, the size of which is measured by the price of the underlying share. You do not own the share itself. The same construction appears in other providers' products, among them the bStocks from the Binance group, which according to the provider are to be backed one for one by the underlying share in regulated custody.

MiFID II instead of MiCA: why the crypto regulation does not apply here
For crypto investors in Germany, the European regulation on markets in crypto-assets has been the familiar framework since 2024. That regulation does not apply here. It expressly excludes financial instruments from its scope, and a token built as a certificate or a note is a financial instrument. The European markets in financial instruments directive, MiFID II, applies instead, together with securities trading and prospectus law.
The practical consequence is concrete. A provider holding only a crypto licence under the crypto-asset regulation may not sell such products to retail clients. It needs authorisation as an investment firm. Kraken opened xStocks to clients in the European Economic Area on exactly that basis. Which trading venues operate in Germany under which licence is therefore the first question before the first purchase.
That the distinction is no paper tiger is shown by how far behind the traditional houses are. Morgan Stanley has pushed its own launch of equity tokens back to 2027, as we reported; in Germany the bank does not sell such tokens to retail clients in any case. We set out the background in our article on the Morgan Stanley delay.
Where investors in Germany can trade tokenized equities
Access is patchy, and that is the most common source of misunderstanding. Kraken offers xStocks in the European Economic Area. On 360X, a platform supervised by BaFin, a small number of names have been tradable against stablecoins since February, five in concrete terms. Robinhood's tokens on US equities are not readily accessible in Germany. Binance accepts bStocks as collateral in cross and portfolio margin accounts, but requires a suitability assessment at the lower tiers.
Then there is the decentralised route through a Solana wallet and an exchange such as Raydium. There is no entry check there, but no investor protection either: no advice, no suitability assessment, no deposit guarantee and no German paying agent. Taking that route means trading a security without the safeguards that were built for securities. Which platform brings which licence to equity trading is set out in our overview of crypto brokers.
The backing and the issuer risk
The decisive point on issuer risk is not the coverage ratio but who holds the backing and under which law. An issuer can have the shares sitting at a regulated custodian without them being separated from its own assets in insolvency. The token holder then queues up among all creditors with an ordinary claim. If the backing is ring-fenced as segregated assets or through a special purpose vehicle, that changes the order.
This detail does not appear in the marketing but in the base prospectus and the product documentation. Investors who cannot find it have not read the most important information about their paper. Three things belong together in the prospectus: the name of the issuer, its registered office together with the supervisory authority, and the section on backing.

No voting rights, no annual general meeting
An equity token securitises economic participation in the price. A voting right at the annual general meeting is practically never included, and a shareholder's information rights do not travel with it either. On dividends it depends on the structure: some products credit the distribution to the token's value, others pay it out, and both are set out in the terms of the respective issuer.
For pure price speculation that mostly makes no difference. For anyone looking to hold a position over years and collect dividends along the way, it is the difference between a security and a bet on one. The question, then, is not whether the token tracks the price well, but what is left of the share besides the price.

Taxation follows investment income, not the crypto holding period
This is where the most expensive misconception sits, and it affects every investor in Germany. With crypto-assets, a gain is tax-free after a holding period of one year, because it counts as a private disposal. For tokenized equities, the prevailing view is that this one-year rule does not apply: the paper is classified as an investment that generates income from capital assets. Flat-rate withholding tax then falls due, plus the solidarity surcharge and, where applicable, church tax, regardless of how long you have held the paper. That is how our October 14, 2026 article puts it, describing this classification expressly as the prevailing view rather than settled law.
Two consequences are regularly overlooked. First, loss offsetting: losses from capital assets can only be set against gains of the same kind, not against gains from crypto sales. Second, tax withholding: whether anything is withheld at all depends on whether the provider acts as a domestic paying agent. At foreign trading venues that is usually not the case, and the income then has to be declared by you. Holding both product types in one portfolio calls for records that keep them apart; the tools for that are in our overview of tax software and portfolio trackers.
One qualification belongs here: the tax treatment of these products is not conclusively settled, and it hangs on the specific structure of the individual token. On a larger position, the question is one for a tax adviser rather than a forum.
63 percent of trading happens outside US market hours
The real appeal of these products sits in a single figure: through August 2026, 63 percent of trading in tokenized equities on Solana took place outside regular US market hours. That is precisely what a traditional securities account cannot deliver. Reacting to news on a Sunday evening is possible with an equity token, where the exchange only offers it on Monday.
The price for that is liquidity. Outside the trading hours of the underlying, the issuer cannot adjust its hedge in the market, and the spread between bid and offer widens. In quiet hours the token price therefore regularly sits away from the last exchange price. That is not a flaw in the product but its construction, and it is the reason a market order at the weekend is a bad idea.
Alpenglow on October 21: the consensus switch reaches the equity tokens too
On October 21, Solana changes its consensus mechanism with Alpenglow, according to developer firm Anza at around 14:50 UTC, at the start of epoch 1064. The official upgrade overview cites a target finality of about 150 milliseconds. During the transition, user transactions will briefly not be included in blocks, and the Firedancer and Frankendancer clients are unsupported in that window; validators need a version based on Agave 4.3.0. The details for stakers are in our article on Alpenglow and epoch 1064.
Two points matter for trading in equity tokens. First, the window itself: an order planned for midday on October 21 should not be placed during the migration. Second, a metric that will cause confusion afterwards. Because validator votes will no longer appear as transactions in blocks, Solana's reported transaction count falls sharply without usage declining. CoinDesk's report on the date describes this as well. Reading that number as a demand signal in the coming weeks means reading it wrong.
What has changed since last week
Compared with our October 14 piece, which focused on the use of tokenized equities as collateral, the market side has turned: Robinhood led weekly volume then, and since October 13 Solana has been back on top. Nothing about the product itself has changed, neither the legal form nor the tax classification. That is the real message of this week. A market share changes within seven days; an issuer's prospectus does not.
Solana's own price plays a secondary role here. SOL was quoted at around $105.82 on Thursday evening, after an intraday low of $100.99 and a high of $106.33, down a good 1.6 percent over seven days (CoinGecko). For trading in tokenized equities the SOL price matters only through transaction fees, since trading is done against stablecoins.
Equity tokens on Solana: the prospectus decides, not the market share
Three steps to place a product like this before you commit money:
- Identify the issuer and the prospectus. The issuer's name, registered office and supervisory authority, plus the section on backing in the base prospectus. If one of those is missing, the insolvency question is unanswered. The licence your trading venue works under is shown in our comparison of regulated crypto exchanges.
- Settle the route in. Through an authorised platform with a securities licence, the investor protection of the markets in financial instruments directive applies; through a decentralised exchange it does not. Which provider offers equity trading in Germany is set out in our overview of crypto brokers.
- Set up the tax separation. Equity tokens and crypto-assets belong in separate records, because the one-year rule applies only to the crypto-assets and losses cannot be offset against each other. The right tools are in our comparison of tax software and portfolio trackers.
(As of October 15, 2026. This article is not investment advice. Prices and fee structures change; check the terms with the provider before you buy.)
Decrypt
Researchers added hidden text to contact AI agents probing Alibaba’s map service, getting replies about their tasks as investigators traced activity to Tencent Cloud infrastructure.
Google's Willow chip cut errors 40x on the scarce “magic states” quantum computers burn through, a step toward smaller, useful machines—and toward ones that could threaten today's encryption.
Russians have until July 1, 2027 to buy and sell crypto directly with each other. After that, every trade runs through a broker or exchange approved by the Bank of Russia.
In a note to investors, Matt Hougan used a “Choose Your Own Adventure” framework to argue that superabundance, an AI bust or a muddle-through economy all ultimately funnel to the same place: Bitcoin higher.
Speaking after BlackRock’s Q3 earnings, Fink said AI infrastructure spending has become so central to growth that a construction halt would be dangerous—calling the backlash “misinformation” as data centers become a midterm flashpoint.
U.Today - IT, AI and Fintech Daily News for You Today
Cryptocurrency market is certainly struggling to regain the control of the market, as bears push most assets even lower.
Strategy executive chairman Michael Saylor has reacted to a new study examining AI models' monetary preferences with a bullish Bitcoin statement.
Three members of the Canadian Armed Forces are among seven suspects charged in connection with a shocking cryptocurrency-related kidnapping in Toronto.
Overnight liquidations hit $932 million as XRP, DOGE, and NEAR face deep corrections before a sudden market reversal.
Dogecoin whale activity may be rising as the ongoing market volatility pushes traders to dump their crypto holdings to hedge against further losses.
Blockonomi
TLDR
- Meta (META) shares closed at $736.72, then dipped further to $735.02 after hours.
- Muse Spark Open offers 816 billion parameters and a 1M-token context window.
- Meta’s new AI model can run locally using two powerful M5 Ultra Mac Studio computers.
- Developers can access Muse Spark Open through leading API and cloud services.
- Meta expands its open-weight AI lineup following August’s Muse Glimmer launch.
Meta Platforms shares fell Thursday, October 15, as the company released Muse Spark Open for coding and automated tasks. Meta (META) stock closed at $736.72, down 0.11%, then slipped 0.23% to $735.02 after hours. The launch expanded access to advanced AI tools, while shares recorded losses in both sessions.
Meta Platforms, Inc., META
Meta Releases Muse Spark Open for Coding
Meta introduced Muse Spark Open as an open-weight model for software development and multi-step reasoning. The system has 816 billion parameters, with 42 billion active during processing. It also handles context windows reaching one million tokens, supporting lengthy, complex coding assignments.
The model processes multiple information formats and handles programming tasks that require several decisions. Meta said the system supports long projects and difficult software engineering work. Company evaluations also compared its performance against other open-weight models available to developers.
Open-weight releases let developers download parameters and customize systems for specific operations. Businesses can therefore control deployment and manage information within their preferred environments. Meta released a smaller model, Muse Glimmer, in August before introducing this larger system.
Mac Studio Deployment Brings Hardware Demands
Meta designed Muse Spark Open to run on two Apple Mac Studios with M5 Ultra chips. The setup uses Apple’s MLX framework to manage machine learning operations locally. However, this configuration requires substantial hardware resources, including about one terabyte of memory.
The company tested Muse Spark Open alongside Muse Code, its terminal assistant for development work. One exercise involved updating a Mastodon client through software fixes and new features. These demonstrations illustrated how the system manages connected tasks without repeated manual instructions.
Meta also tested the model with DaVinci Resolve, a professional video editing application. The system reviewed footage and cropped selected sections during the demonstration. That work showed its potential for desktop tasks outside conventional programming assignments.
Meta Expands Access Through APIs and Cloud Services
Meta made the model accessible through Baseten, Fireworks AI, Groq, Modal, Nebius, OpenRouter, and Together AI. Developers can download weights from Hugging Face, Amazon SageMaker AI, Google Cloud, and Microsoft Foundry. These services provide alternatives to installing an expensive local hardware setup.
Compatible inference engines include vLLM, SGLang, TensorRT-LLM, llama.cpp, and Hugging Face Transformers. The new model also supports AMD, Apple, Intel, and Nvidia hardware for wider deployment. Developers can customize the system using PyTorch for specialized applications.
Open-weight distribution can reduce dependence on proprietary providers and increase deployment flexibility. However, running large models still demands technical expertise and significant computing resources. Meta’s release expands its AI offerings as Thursday’s stock action remained slightly negative.
The post Meta Platforms (META) Stock: Slips as Muse Spark Open AI Debuts appeared first on Blockonomi.
TLDR
- Volvo Cars expands its Nvidia partnership to advance automated driving technology.
- Nvidia’s Hyperion and Alpamayo platforms will power future Volvo driving systems.
- The automaker plans to introduce Nvidia technology across future vehicle models.
- Nvidia’s Alpamayo software surpasses 650,000 developer downloads worldwide.
- Volvo Cars targets its next-generation automated driving system before 2030.
Volvo Cars announced an expanded Nvidia partnership on Thursday, October 15, to develop advanced automated driving technology for future vehicles. Separately listed AB Volvo (VOLV-B.ST) shares stood at SEK 319.70, gaining SEK 0.70, or 0.22%, according to supplied figures. The agreement combines Nvidia’s artificial intelligence platforms with Volvo Cars’ vehicle safety engineering to improve automated navigation.
Volvo Cars Expands Nvidia Partnership With Advanced AI Systems
Volvo Cars will integrate Nvidia’s Hyperion architecture, Alpamayo driving software, and Halos safety technology into its next-generation vehicles. Hyperion combines sensors and computing systems to help vehicles process surrounding traffic conditions and road information. Alpamayo provides artificial intelligence tools that support driving decisions across different road environments.
Nvidia developed Alpamayo as a collection of AI models, training datasets, simulation tools, and software development resources. The platform operates alongside conventional driving software that uses machine learning, cameras, and radar systems. This combined approach allows different technologies to process information simultaneously and support more reliable driving decisions.
Nvidia automotive division head Ali Kani explained that the company operates multiple software systems alongside different sensor technologies. The approach uses separate systems to assess road conditions and reduce dependence on individual software components. More than 650,000 developers have downloaded Nvidia’s open-source Alpamayo software, according to Kani.
Volvo Targets Automated Driving Across Future Vehicle Models
Volvo Cars plans to extend its automated driving technology beyond its existing battery-electric vehicle lineup. The company also intends to support plug-in hybrids and gasoline-powered vehicles through a broader software architecture. This expansion reflects its strategy of developing shared technology platforms across different vehicle categories.
Volvo Cars uses Nvidia’s Orin computing technology across its battery-electric vehicle range. These processors analyze information from cameras, radar, and other sensors to support driving assistance functions. The expanded partnership introduces additional computing capabilities and software components for more advanced automated driving features.
Volvo Cars software development head Alwin Bakkenes outlined the company’s shift toward developing integrated vehicle technology internally. The automaker previously relied on vehicle-specific development programs and multiple technology suppliers for different models. Now, its approach combines hardware, software, and safety engineering through a more unified development structure.
Nvidia Technology Supports Volvo Cars’ Long-Term Driving Strategy
Volvo Cars plans to introduce the upgraded Nvidia platform through a new vehicle before the decade ends. Management has not confirmed the model name, production schedule, or specific launch date. The company expects the initial deployment to support supervised automated driving, while drivers retain responsibility for vehicle operation.
The new system will use Nvidia’s Hyperion sensor and computing architecture to process information across different driving conditions. The Halos safety layer will support the evaluation of automated driving functions and system performance. These technologies will help the automaker develop software for increasingly complex road and traffic situations.
The partnership also supports Volvo Cars’ broader transition toward software-based vehicle development and shared technology platforms. Standardizing computing systems and sensors could simplify future integration across electric, hybrid, and conventional vehicles. The companies have not announced commercial revenue targets, implementation costs, or financial forecasts associated with the expanded agreement.
The post Volvo Cars (VOLCAR) Stock: Expands Nvidia Partnership to Advance Self-Driving Technology appeared first on Blockonomi.
TLDR
- LULU stock jumps 5.16% to $98.95 despite declining revenue and earnings.
- Quarterly net income falls to $329 million as operating margins continue to shrink.
- The retailer holds $1.39 billion in cash despite a challenging sales outlook.
- Free cash flow climbs to $225 million despite weaker quarterly sales performance.
- The company spends $1.16 billion on share buybacks as annual profits face pressure.
Lululemon Athletica (LULU) shares climbed 5.16% to $98.95 on Thursday, gaining $4.86 despite continued weakness in its financial performance. The athletic apparel retailer reported lower quarterly revenue and earnings, while operating margins also narrowed. The company maintained substantial cash reserves and generated positive free cash flow despite weaker sales.
Lululemon Athletica Inc., LULU
The latest trading gain followed an extended period of poor share performance. Lululemon stock has declined 44.6% over the past year, while the S&P 500 gained 17.3%. This performance gap reflects pressure on the retailer as weaker revenue and profitability challenge its previous growth trajectory.
Management reduced its annual revenue forecast on September 3 after reporting softer business conditions. Revenue declined 4.3% year over year during the quarter ending August 2, 2026. The revised outlook reflects weaker sales expectations and increases attention on the company’s ability to protect operating earnings.
Lululemon Earnings Decline as Profit Margins Narrow
Lululemon reported quarterly net income of $329 million, compared with $371 million during the corresponding period last year. The decline exceeded the percentage drop in revenue, showing that costs consumed a larger share of sales. Weaker operating efficiency affected profitability even before accounting for unusual financial adjustments.
The retailer recorded an operating margin of 18.8%, compared with 20.7% one year earlier. One-time tariff refunds contributed 5.6 percentage points to the latest margin. Excluding that benefit, the operating margin reached approximately 13.2%, indicating substantially weaker underlying profitability.
If the latest quarter repeated four times, annual net income would reach approximately $1.32 billion. The quarter included roughly $97 million in after-tax tariff refunds, which increased reported profits. Excluding those refunds, the annualized earnings figure falls to approximately $930 million, below the trailing twelve-month total of $1.42 billion.
Lululemon Maintains Strong Cash Flow and Balance Sheet
Despite declining earnings, Lululemon maintained a relatively strong balance sheet during the latest reporting period. The company held $1.39 billion in cash and cash equivalents as of August 2, 2026. It reported no outstanding bank loans or bond borrowings, reducing its exposure to financing costs.
Lululemon carried approximately $2.14 billion in lease liabilities, representing its principal long-term financial obligations. The company generated $1.35 billion in free cash flow during the previous twelve months. That amount covered approximately 63% of its lease liabilities, providing financial flexibility despite slowing business growth.
Quarterly free cash flow also improved, reaching $225 million compared with $151 million during the previous year. This increase showed that the retailer continued generating cash despite lower revenue and shrinking profit margins. Its cash generation remained stronger than the latest earnings performance alone would suggest.
Lululemon spent approximately $1.16 billion repurchasing shares over the trailing twelve-month period. These purchases represented about 10.8% of its market capitalization, reflecting substantial capital returns to shareholders. Management also indicated in September that its 2026 repurchase spending would match the previous year’s level.
The company’s valuation presents a different picture after adjusting for the temporary tariff benefits. At the October 14 close, shares traded near 7.5 times trailing earnings, including those one-time refunds. Excluding the refunds and annualizing quarterly profits produces an earnings multiple of approximately 11.5 times.
The annualized calculation remains a mechanical comparison rather than a forecast of future financial results. Lululemon generates its highest quarterly sales during the reporting period ending in February, which creates seasonal differences. Its financial position therefore combines declining underlying earnings with substantial liquidity, positive cash generation, and continued share repurchases.
The post Lululemon Athletica (LULU) Stock: Earnings Slide as Revenue Declines appeared first on Blockonomi.
TLDR
- CleanSpark’s September Bitcoin production fell nearly 11% to 529 BTC from 593 BTC in August.
- CleanSpark sold 702 BTC and closed September with Bitcoin holdings of 13,530 BTC.
- CleanSpark discontinued monthly mining reports while advancing its $2.276 billion data center financing.
- BitFuFu’s cloud mining output fell to 69 BTC as an electricity dispute threatened its Ethiopia acquisition.
- Canaan mined 44 BTC, while its Nordic heating project supplied recovered heat to approximately 2,800 homes.
CleanSpark mined 529 Bitcoin in September, down from 593 in August, while rival BitFuFu also recorded lower production. Canaan held steady at 44 BTC. The three publicly traded miners reported different changes to their operations.
CleanSpark reduces production and ends monthly updates
CleanSpark finished September with 13,530 BTC, compared with 13,703 at August’s end. It sold two BTC on spot markets and another 700 through exercised call options. The company reported an average sale price of $72,928, including option premiums.
Its average daily production reached 17.64 BTC. CleanSpark reported 50 exahashes per second in operational computing power and nearly 200,000 deployed mining machines. The company will now report quarterly rather than release monthly mining updates.
Data center investment remains a priority
CleanSpark closed a $2.276 billion secured bond offering to fund construction at Sandersville, Georgia. It expects a data center lease there to generate approximately $6.6 billion during its initial term. A separate report on AI chip supplies examined potential problems for miners.
On October 13, Bitcoin Magazine shared an X discussion about Bitcoin mining and artificial intelligence computing. CleanSpark said the bond financing covers Sandersville through completion, while its mining business continues operating.
BitFuFu faces an Ethiopian power dispute
BitFuFu produced 167 BTC in September, versus 174 in August. Its own mining increased from 88 to 98 BTC, but customer cloud mining fell from 86 to 69 BTC. Total managed computing power dropped to 19.4 exahashes per second.
Its proposed Ethiopian mining acquisition remains unfinished because of a dispute involving the site’s electricity supplier. BitFuFu paid $4.1 million and deployed around 13,700 machines there. Separately, Binance announced plans to close its cloud mining service in November.
Canaan maintains output and expands heat recovery
Canaan ended September holding 1,875 BTC, up from 1,868 at August’s close. Its non-joint-venture computing capacity remained at 10 exahashes per second, while joint ventures operated at 4.18. September mining production matched the previous month.
Thursday’s trading also followed a wider fall in Bitcoin mining shares. CleanSpark traded at $8.76, BitFuFu at $1.27 and Canaan at $0.25. Several rival miners had fallen more than 12% during Wednesday’s stock market selloff.
Canaan said its eight-megawatt Nordic heating facility now supplies recovered mining heat to about 2,800 homes. The company is also preparing a similar heat-recovery project for Canadian greenhouses, pending final site inspections.
The post CleanSpark Mines 529 BTC, but Reporting Takes a Turn appeared first on Blockonomi.
TLDR
- Ledger introduces tighter sales controls following the discovery of modified hardware wallets sold through resellers.
- Criminals installed hidden components that captured customers’ 24-word recovery phrases and transmitted them through mobile networks.
- Bitquery estimates $102 million was stolen from 324 wallets, exceeding Specter’s earlier $86 million estimate.
- Ledger says inspections found no tampering in the retail and warehouse samples its teams examined.
- Authorized dealers must keep devices off display shelves, while returned wallets remain barred from resale.
Ledger has introduced tougher rules for hardware wallet sellers after criminals altered genuine devices and stole cryptocurrency. In its October 15 statement, the company reaffirmed its ban on reselling returned wallets and ordered retailers to keep new devices away from display shelves.
Criminals altered devices before resale
Ledger said attackers purchased legitimate wallets, fitted hidden components, and returned them to reseller channels in Southeast Asia. The company said the group spent months preparing the operation and built systems to collect recovery phrases and move stolen funds.
The investigation began on October 9 after customers reported missing assets from devices sold by Malaysia-based CryptoBilis. An earlier Ledger wallet theft investigation connected the complaints to the reseller, which subsequently halted sales.
How the hidden implants worked
Ledger’s security team found an implant that copied the 24-word recovery phrase displayed during wallet setup. The component then sent those words through a mobile data connection using a built-in electronic SIM card.
The company said the device’s security chip and operating system remained intact. Binance founder Changpeng Zhao warned on X on October 9 that the evidence pointed to an attack through one seller, rather than a problem across all Ledger wallets.
Loss estimates rise as investigators trace funds
Blockchain researcher Specter initially estimated losses above $86 million. However, Bitquery’s October 15 update traced $102 million from 324 wallets across six networks. Earlier confirmation of device tampering established that investigators found an unauthorized component. Ledger has not confirmed total losses or the number of affected customers.
Bitquery said Tether froze $10 million in USDT linked to the theft. Its investigation also tracked stolen funds through swaps and privacy services. The researchers counted wallets, not individual customers, and noted that one owner could control several affected addresses.
Ledger changes distribution and customer guidance
Ledger said its teams examined devices from stores in Germany and stock held in warehouses. Those samples showed no tampering. In an October 14 X update, the company called for a pause in sales across seven markets, including Hong Kong. Resellers in Asia suspended wallet sales as the investigation continued.
Authorized dealers must now store wallets away from public shelves and hand them to buyers at purchase. Ledger advises CryptoBilis customers against setting up unused devices. Those who already used one should move assets to a new wallet with a fresh recovery phrase.
The post Ledger Reveals How Hidden Chips Exposed Crypto Wallets appeared first on Blockonomi.
CryptoPotato
Circle’s USDC has become the first stablecoin in the European Union to receive significant e-money token status under the Markets in Crypto-Assets Regulation (MiCA).
The classification was made by the European Banking Authority (EBA) after assessing the token against the regulation’s criteria.
Regulatory Upgrade
The EU currently has 45 e-money tokens notified under MiCA. USDC is the first to be classified as “significant.” The new rules will take effect on November 12, 2026. From that date, the EBA will take over direct supervision of the crucial areas, such as capital requirements, asset reserves, liquidity, and recovery and redemption plans. These responsibilities currently fall under France’s banking regulator, the ACPR.
However, the ACPR will retain oversight of other areas. These include governance, major shareholdings, management suitability, outsourcing, as well as conflicts of interest. The EBA and ACPR will work together to manage the transition and coordinate their supervision.
USDC has a presence on both sides of the Atlantic. Circle Internet Financial Europe SAS issues the token in the EU, while Circle Internet Financial, LLC handles issuance in the United States.
The EBA has also signed a memorandum of understanding with the New York State Department of Financial Services. The agreement aims to improve cooperation and information sharing on cross-border stablecoin activities.
Expansion Across Banks and Payments
USDC faced fresh competition concerns earlier this year following the unveiling of Open USD (OUSD), a stablecoin project that was developed with founding partners including Visa, Mastercard, Stripe, Coinbase, and Shopify, and backed by a consortium of over 140 companies. The announcement put the spotlight on the battle for stablecoin adoption, but USDC continues to find new opportunities to expand its reach.
For instance, BNY Mellon expanded its partnership with Circle by bringing USDC to its Digital Asset Custody platform for institutional clients. The bank allowed its clients to hold and transfer USDC, as well as mint tokens by converting US dollars and redeem them back into dollars. BNY has already been serving as the primary custodian of USDC reserves.
Binance also doubled down on USDC with a fresh five-year agreement with Circle, alongside a $100 million investment in the stablecoin issuer. The deal could help the token reach more users through Binance, which has previously agreed to hold USDC in its corporate treasury and make it available to its 240 million users.
Samsung announced plans to bring USDC transfers to Samsung Wallet for eligible Galaxy users in the US, the rollout, for which, is expected in the last week of October 2026. The service will let users send the stablecoin to compatible crypto wallets and transfer funds to eligible bank accounts in more than 60 countries.
The post USDC Just Hit a Major EU Regulatory Milestone: Here’s What Changes in November appeared first on CryptoPotato.
According to Charles Edwards, CEO of Capriole Investments, Bitcoin’s price could rise 30% to 50% in a day if developers agree on a roadmap to protect the blockchain against quantum computers.
He also warned that delays in addressing the threat could weigh on the asset’s valuation.
Edwards Sees Quantum Security as a Potential Bitcoin Catalyst
Speaking to BMTV, Edwards described the quantum threat as tangible within a typical two- to three-year investment horizon. Bitcoin developers have yet to reach a consensus on a path forward, he noted, despite early-stage proposals intended to help prepare the network.
“If they kind of align and say, okay, this is the roadmap that we’re going to do, or this is the signature schemes that we’re going to probably implement in the next sort of 12 months or 18 months or what have you,” Edwards said, “I think that results in a significant repricing of Bitcoin up.”
He estimated that a concrete plan from Bitcoin Core developers could produce a 30% to 50% price move in one day as investors reassess the threat. The next six to 12 months could therefore be positive for BTC if development progresses. Failure to make headway would leave the network increasingly exposed as technology advances, prompting Edwards to reconsider Bitcoin’s fair value.
Coinbase has also outlined requirements for post-quantum security, arguing that any new signature design must account for transaction fees and the cost of validating transactions across the network. Its October 13 blog discussed possible technical approaches, including hybrid signatures during a transition.
Rates and Mining Data Complicate the Outlook
BTC was trading around $81,000 at the time of writing, down nearly 3% in the last 24 hours, with a daily range of $80,400 to $84,000. In the past week, it lost over 2%, although it is up more than 4% from a month ago, while sitting roughly 36% below its all-time high.
According to Edwards, interest rates are a short-term liquidity headwind, though the CEO doubts they will stay high for long because the inflation behind them comes mostly from oil prices tied to the US-Iran conflict.
Mining data provides another reason for cautious optimism. Bitcoin’s hash rate, a measure of computing power committed to secure the network, began recovering four to six weeks ago after a prolonged decline. Edwards views that recovery as evidence that the cycle bottom may be in, although miners shifting capacity toward AI makes future hash rate trends harder to interpret.
He also warned that AI could accelerate quantum development, even though he considers current fears about AI independently breaking Bitcoin’s encryption premature.
The post Bitcoin Could Jump 50% If Developers Agree on Quantum Plan: Capriole CEO appeared first on CryptoPotato.
Hotter-than-expected US inflation data, along with the KOSPI index’s crash in South Korea, weighed heavily on the cryptocurrency market. Bitcoin (BTC) slipped below $80,000, while most altcoins followed suit, posting steeper declines.
Pi Network’s PI couldn’t escape the broader correction, plunging to around $0.077, or its lowest level since July. Many investors have likely grown weary of the token’s major downfall over the past several months, so we asked three of the most popular AI-powered chatbots for their outlook on the remainder of the year. Here’s what they had to say.
More Pain or a Rebound?
ChatGPT leaned bearish, expecting the price to sustain its current level or even plunge to a new all-time low of around $0.06 sometime in Q4. OpenAI’s platform claimed that the constant PI token unlocks are the main factor preventing a decisive comeback. It also cited KYC issues reported by some Pioneers and migration struggles as additional hurdles.
On the other hand, ChatGPT sees potential for a significant rebound in the coming months, but only if protocol 28 deploys successfully and prices sustain a recovery above $0.10. While the upgrade is scheduled for tomorrow (October 16), it won’t be a surprise if it gets delayed, since the Core Team has a habit of postponing important developments.
Perplexity also warned of an additional downside risk that could drive the price down to $0.05. The chatbot estimated that such a collapse has a 15% to 25% probability of happening sometime during the final quarter of 2026, while the base case for PI is to trade between $0.07 and $0.10.
Google’s Gemini seemed more favorable to a price increase, suggesting that a rise to $0.15 is mathematically and technically possible. It added an important disclaimer that such a pump would depend on several catalysts, including the protocol 28 upgrade, further ecosystem developments, and listings on major exchanges.
“A surprise spot listing on Binance or Coinbase during Q4 would unlock significant retail and institutional buying liquidity, typically sparking short-term price surges capable of pushing a micro-cap asset past key resistance barriers ($0.10, $0.12, and up to $0.15),” it explained.
Additional Forecast
X user Crypto With Gopal is among the few to address PI lately, and his analysis points to a cautious approach. He assumed that a breakout above $0.10-$0.105 could open the door toward $0.15, but that represents a solid 42% increase from current levels.
“Until then, $0.075-$0.08 is a key support zone to watch; losing it could signal further downside. Sentiment: cautiously watching for reversal. A confirmed neckline is needed to validate the double-bottom setup,” he concluded.
The post Pi Network (PI) Plunges Near Its ATL: 3 AIs Speculate Whether Q4 Will Bring More Pain appeared first on CryptoPotato.
The primary cryptocurrency posted substantial gains in September, fueling expectations that the uptrend would continue this month. In fact, BTC started October on the right foot and briefly surged to nearly $87,000 at one point.
However, the bulls couldn’t maintain momentum, and the asset headed south. The past 24 hours brought more pain for investors as Bitcoin dipped below $80,000 after US inflation came in hotter than expected, while South Korea’s KOSPI index crashed over 7% on the day. The latest red wave, though, might be just a temporary correction before a renewed rally, and here’s why.
The Bullish Signals
Let’s start with the fact that October has historically been one of the best months for BTC, earning it the nickname “Uptober.” The asset has finished the period in the red on only 3 of 13 occasions. We still have more than two weeks left to see whether bulls can regain control and secure another successful “Uptober.”
Next is whale activity. Not long ago, Ali Martinez revealed that large investors used the slump from $87K to $80K to stack an additional 16,010 coins (worth nearly $1.3 billion).
An analysis published by CryptoQuant also shows that whales have launched a buying spree. The team revealed that big wallets (excluding exchanges and mining pools) have increased their total holdings to 3.03 BTC, the highest combined balance since November last year.
This accumulation is generally seen as a bullish signal, as large investors are often considered smart money with a longer-term investment horizon. Their buying leaves fewer coins available on the open market, which, combined with steady demand, could trigger a price uptick. In addition, these efforts can encourage smaller players to join the ecosystem, bringing in fresh capital.
Last but not least, we will observe BTC’s price movement after the previous US CPI data. The asset saw major initial volatility after the last four announcements (similar to what we witnessed over the past 24 hours), but X user Crypto Rover noted that the bulls eventually gained control each time, and Bitcoin rallied hard. It remains to be seen whether this time will be the same.
The Latest Predictions
According to the X account Wealthmanager, BTC has “major bid zones” stacked between $75,000 and $80,000. That said, the price could sweep lower toward that range before resuming its next big move.
X user Aman claimed that Bitcoin might be developing a “head-and-shoulders” pattern. The analyst suggested that if this plays out, $76,000-$77,000 could become “the next area to watch.”
“Not saying it will happen for sure, but the setup is there. Better to prepare for the possibility now than panic if BTC actually breaks down,” they added.
Martinez also recently chipped in. He identified $84,000 as a key level marking the 50 SMA and potentially unlocking the next rally.
The post 3 Reasons Why Bitcoin (BTC) Could Bounce Back Quickly After the Latest Pullback appeared first on CryptoPotato.
XRP is approaching a key technical inflection point after weeks of declining price action erased much of its August recovery. Trading around $1.30, the asset is testing an important support zone on both the daily and 4-hour charts. The next move around this area could determine whether buyers manage another rebound or sellers push XRP toward lower support levels.
Ripple Price Analysis: The USDT Pair
The daily chart shows XRP maintaining a broader bearish structure after falling from its early-2026 highs above $2.30. The asset has formed a series of lower highs, while the descending orange trendline continues to reflect the prevailing downward pressure, as the price has once again dropped below it and failed to continue higher. Although XRP staged a sharp recovery from the $1.00 region in August, the subsequent rally toward $1.70 failed to establish a sustained bullish reversal.
The latest decline has brought the token back to the $1.30 support zone. This area is key because it previously consolidated before the June sell-off. Holding above it could help XRP stabilize and attempt another recovery, while a decisive daily close below it would raise the risk of a deeper correction.
If support breaks, the $1.15 zone represents the next major downside area visible on the chart. Below that, the $1.00 region remains an important floor, having preceded the sharp August rally.
On the upside, XRP would first need to reclaim the $1.50 region created by recent highs to show signs of improving short-term structure. Beyond that, the $1.70 resistance zone stands out as the major obstacle, and the main level buyers must break through to start a new long-term rally.
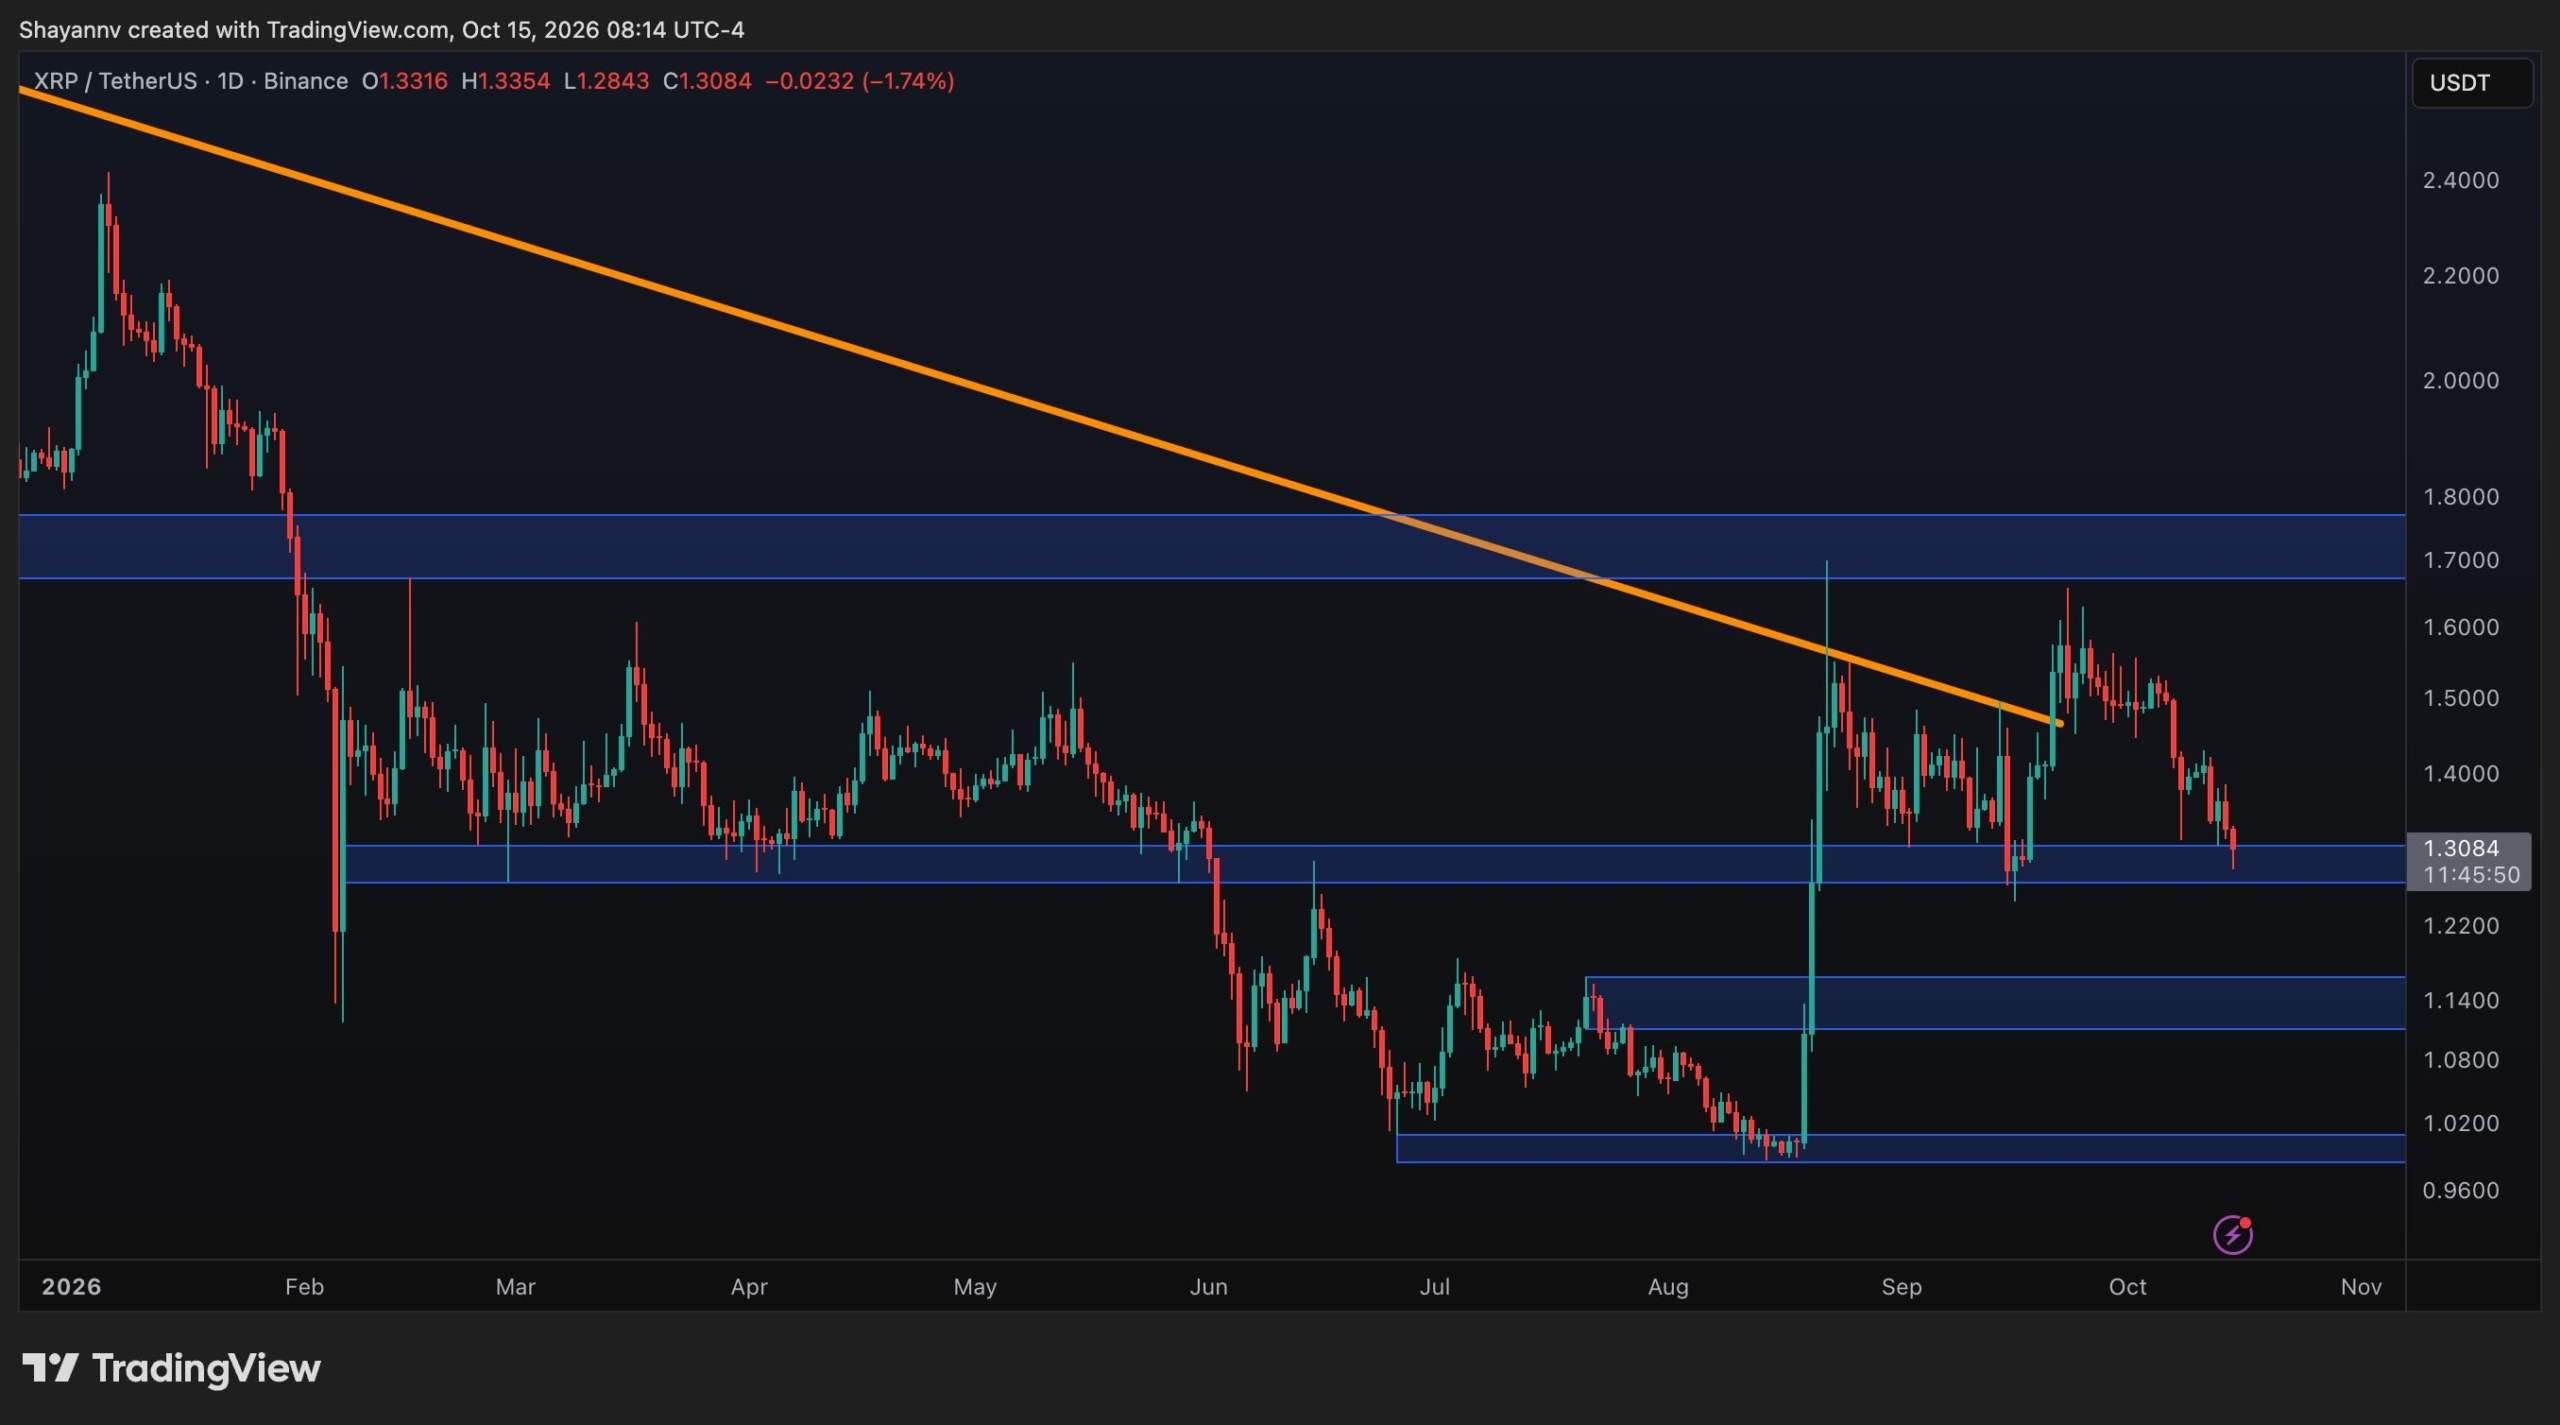
The 4-Hour Chart
The 4-hour chart offers a clearer view of immediate selling pressure. Since reaching approximately $1.65 in late September, XRP has been trading within a descending channel, characterized by lower highs and lower lows. Both channel trendlines remain relevant, with the upper boundary acting as dynamic resistance and the lower boundary marking the area where buyers could attempt to defend the price.
XRP is now testing the $1.30 support zone, which overlaps with the lower boundary of the descending channel. This confluence makes the current area particularly important for the short-term outlook. The latest candles show the price pressing against this support, but the chart does not yet confirm a decisive breakdown or a valid bullish reversal.
If buyers defend the zone, the asset could attempt a relief rally toward the $1.40 region, where the upper channel boundary is located. A breakout above this resistance would weaken the immediate bearish structure and potentially bring the $1.60-$1.70 area back into focus.
However, a confirmed move below $1.30 would suggest that buyers are losing control of the current support area. In that scenario, XRP could face further downside pressure, with the daily $1.15 zone emerging as the next major support region.
The descending channel therefore remains the dominant short-term pattern. While its lower boundary could provide a foundation for a rebound, a bullish shift would require XRP to reclaim nearby resistance and eventually break above the channel’s upper trendline.

The post Ripple Price Analysis: Is the Worst Over for XRP After Holding $1.30? appeared first on CryptoPotato.