Cryptocurrency Posts
Crypto Briefing
Safenet Aegis' launch could redefine blockchain security, balancing user costs with enhanced transaction safety and governance-driven reliability.
The post Safe launches Safenet Aegis security network on Ethereum, Gnosis, and Arbitrum appeared first on Crypto Briefing.
Increased Democratic turnout in Republican areas may signal shifting voter dynamics, potentially influencing Ohio's Senate and gubernatorial races.
The post Ohio early voting shows surprising Democratic turnout in Republican areas appeared first on Crypto Briefing.
The destruction of arms depots may shift regional power dynamics, impacting market perceptions and potentially altering future military engagements.
The post Saudi-led Coalition destroys over 120 arms depots in Yemen appeared first on Crypto Briefing.
Ripple Prime's 24/7 RWA swaps could enhance XRP's utility and adoption, potentially influencing its market position and price dynamics.
The post Ripple Prime launches 24/7 RWA swaps for institutional clients appeared first on Crypto Briefing.
The increased ad spending highlights a shifting political landscape, indicating potential vulnerabilities in traditional Republican strongholds.
The post Republicans boost ad spending to $888M for 2026 midterms as Democrats gain ground appeared first on Crypto Briefing.
Bitcoin Magazine
Bitcoin Magazine

Latin America’s MSTR: How OranjeBTC is Running the Saylor Playbook in Brazil | Gui Gomes
Bitcoin is “likely the best collateral one could ask for,” says OranjeBTC CEO Gui Gomes. He explains how digital credit, Bitcoin-backed loans, and new financial products are pushing Bitcoin deeper into global financial markets, including a first-of-its-kind Bitcoin-backed loan in Brazil. He also shares why every step brings Bitcoin closer to becoming the world’s reserve currency.
Chapters:
0:00 – OranjeBTC CEO Gui Gomes on Running the Strategy Playbook in Latin America
0:32 – Why Brazil Ranks No. 1 in Grassroots Bitcoin Adoption
1:57 – Brazil’s Advantages for Building a Bitcoin Treasury Company
3:38 – Brazil’s New Bitcoin Regulations and VASP Licensing
5:23 – Brazil’s Elections and the Shift Toward a Pro-Market Economy
7:22 – Lower Rates, the Real and Brazil’s Next Growth Phase
8:27 – How Global Investors Can Buy OranjeBTC Shares
9:21 – DIGI11: Bringing STRC and SATA to Brazilian Investors
11:21 – How DIGI11 Delivered Its First Dividend
14:08 – Bitcoin as Collateral and the Future of Digital Credit
DISCLAIMER: The views and opinions expressed in this show are those of the participants and do not necessarily reflect the official policy or position of BTC Inc., Bitcoin Magazine, or any affiliated entities. This content is provided for informational and educational purposes only and should not be construed as investment, legal, tax, or accounting advice. Nothing contained in this show constitutes a solicitation, recommendation, endorsement, or offer to buy or sell any securities or financial instruments. Viewers should consult their own advisors before making financial or business decisions.
This post Latin America’s MSTR: How OranjeBTC is Running the Saylor Playbook in Brazil | Gui Gomes first appeared on Bitcoin Magazine and is written by Patrick Green.
Bitcoin Magazine

Charles Edwards: Why Quantum Risk Could Be MASSIVE BTC Upside Catalyst
What will it take for Bitcoin to break to new all-time highs? Charles Edwards says something substantial has to happen, whether it’s real progress on quantum, a shift in Fed policy, the U.S. government buying Bitcoin, or a stimulus event. He also discusses how institutional buying through ETFs is keeping the backdrop strong.
Chapters:
0:00 – Charles Edwards on Rates, Liquidity and Bitcoin’s Market Outlook
1:36 – ETFs vs. Treasury Companies: Who’s Driving Bitcoin Buying?
2:54 – How AI-Driven Unemployment Could Change the Fed and Bitcoin
4:01 – Hash Ribbons: Why Rising Hash Rate Is a Bullish Signal
6:13 – Is This Hash Rate Cycle Different With AI?
8:14 – Is Bitcoin Still Undervalued? Production Cost, Energy Value and MVRV
10:37 – Global Liquidity, 5% Rates and Bitcoin’s Uncharted Territory
14:50 – Quantum Computing: Why a Roadmap Could Be an Upside Catalyst
17:21 – Can AI Break Bitcoin? Superintelligence and Encryption Risk
19:15 – What Could Trigger Bitcoin’s Next All-Time High
DISCLAIMER: The views and opinions expressed in this show are those of the participants and do not necessarily reflect the official policy or position of BTC Inc., Bitcoin Magazine, or any affiliated entities. This content is provided for informational and educational purposes only and should not be construed as investment, legal, tax, or accounting advice. Nothing contained in this show constitutes a solicitation, recommendation, endorsement, or offer to buy or sell any securities or financial instruments. Viewers should consult their own advisors before making financial or business decisions.
This post Charles Edwards: Why Quantum Risk Could Be MASSIVE BTC Upside Catalyst first appeared on Bitcoin Magazine and is written by Patrick Green.
Bitcoin Magazine

Wellington-Altus’ James Thorne: Bitcoin “Supercycle” has Begun
“The next run in Bitcoin is going to be one for the ages.” Economist James Thorne, Chief Market Strategist at Wellington-Altus Private Wealth, joins Grace Remington and Sean Hagan to explain why he believes Bitcoin is entering a generational supercycle. Drawing on his experience with the commodities supercycle, he explains why a changing market structure makes this time different. He also explains why he thinks the four-year cycle is done.
Chapters:
0:00 – James Thorne on Hot Core CPI: Why Shelter, Not Energy, Drove It
1:30 – Is the Fed Making a Policy Mistake by Hiking?
5:35 – Why Hedge Funds Are Acting Like the New Bond Vigilantes
6:42 – Can AI Deliver a Greenspan Moment? Warsh’s Jackson Hole Miss
10:22 – Why Bitcoin Is Entering a Generational Supercycle
14:11 – The Four-Year Cycle Is Done and Who Buys Bitcoin Next
18:45 – Why Bitcoin Solves the Settlement Problem
21:15 – Strategy, Pristine Collateral and Harvesting Bitcoin Volatility
24:59 – Tokenization and the End of Delayed Innovation
27:04 – Bitcoin vs. Gold: Will Bitcoin’s Market Cap Surpass Gold?
DISCLAIMER: The views and opinions expressed in this show are those of the participants and do not necessarily reflect the official policy or position of BTC Inc., Bitcoin Magazine, or any affiliated entities. This content is provided for informational and educational purposes only and should not be construed as investment, legal, tax, or accounting advice. Nothing contained in this show constitutes a solicitation, recommendation, endorsement, or offer to buy or sell any securities or financial instruments. Viewers should consult their own advisors before making financial or business decisions.
This post Wellington-Altus’ James Thorne: Bitcoin “Supercycle” has Begun first appeared on Bitcoin Magazine and is written by Patrick Green.
Bitcoin Magazine

Troy Cross: Number Go Up – The Solution to Bitcoin’s Marketing Problem?
Can Bitcoin really separate money and state? Philosopher Troy Cross offers a grounded answer. He doesn’t expect governments to give up printing money anytime soon, but argues Bitcoin puts a check on endless money printing because people will take refuge in it. He also explains why he thinks academics will be the last to get Bitcoin, after innovators, finance, and journalists.
Chapters:
0:00 – Troy Cross on the Clarity Act’s Failure and Why Bitcoin Continues On
1:20 – The Getting Bitcoin Campaign in the Wall Street Journal
2:32 – Why Readers Are Clicking Bitcoin Essays at 4–6x Normal Rates
4:10 – Why Academics Will Be the Last to Get Bitcoin
5:51 – Nakamoto Project Survey: Is Bitcoin Becoming Partisan?
7:52 – The 2026 Survey: Bitcoin Normalizing While Polarizing
10:08 – Bitcoin’s Brand Problem and Confusion With Crypto
11:44 – Price Action, Education and Why Number Go Up Is the Universal Language
13:39 – Crossing the Chasm to Reach the 82% of Non-Bitcoiners
16:55 – Separation of Money and State: Why Bitcoin Keeps Governments Honest
DISCLAIMER: The views and opinions expressed in this show are those of the participants and do not necessarily reflect the official policy or position of BTC Inc., Bitcoin Magazine, or any affiliated entities. This content is provided for informational and educational purposes only and should not be construed as investment, legal, tax, or accounting advice. Nothing contained in this show constitutes a solicitation, recommendation, endorsement, or offer to buy or sell any securities or financial instruments. Viewers should consult their own advisors before making financial or business decisions.
This post Troy Cross: Number Go Up – The Solution to Bitcoin’s Marketing Problem? first appeared on Bitcoin Magazine and is written by Patrick Green.
Bitcoin Magazine

Russia’s Central Bank Authorizes Sberbank to Exchange Cryptocurrencies
Russia’s central bank has added Sberbank to its register of organizations authorized to exchange digital currencies, according to reports.
Sberbank was added to the list of digital depositories, which will keep a record of cryptocurrencies and digital rights, earlier this month.
Now, it joins eight other organizations on the exchange register, including state-controlled VTB, Russia’s second-largest bank, and T-Invest Lab, part of T-Technologies, which also owns online lender T-Bank, according to a Monday report from Interfax.
The announcement comes as Russia fast moves forward with Bitcoin-related regulation. Sberbank last month announced that it was the first in the country to have been approved to custody bitcoin.
The Bank of Russia gave it the green light for “digital currency record-keeping” and to facilitate the transfer of such assets, covering bitcoin and other, smaller cryptocurrencies.
“This status will allow the bank to provide services related to organizing the circulation of digital currency on interfaces which clients already use,” Sberbank was quoted saying in the news report.
A law on digital currencies and digital rights came into effect in Russia on September 1, creating a comprehensive legal framework for cryptocurrency circulation. Transactions involving cryptocurrencies can be conducted via the existing infrastructure of exchanges, brokers and trustees, and now also via crypto exchanges and digital depositories.
Cryptocurrency can be bought and sold via crypto exchanges, while the rights to these assets are recorded in digital depositories.
Banks and other organizations have been able to apply to the CBR for the corresponding licenses since October 5. Some existing players have simplified access to the market and can obtain licenses on a notification basis within just one day.
Under the new rules, unqualified investors will be able to buy bitcoin and other cryptocurrencies including stablecoins, within a limit of 300,000 rubles ($3,556) per year through one intermediary.
Qualified investors will have access to all cryptocurrencies traded on the exchange and over-the-counter markets.
Sberbank will debut its crypto wallet in December — the same month the Moscow Exchange will debut crypto trading.
This post Russia’s Central Bank Authorizes Sberbank to Exchange Cryptocurrencies first appeared on Bitcoin Magazine and is written by Mathew Di Salvo.
CryptoSlate
A dated three-week entry estimate shows how direct deposits and pooled holdings bear the cost of inactive staking capital.
Read the full story on CryptoSlate
Understand the crypto stories that matter and what to watch next. Get The Catalyst in your inbox
Prosecutors say recovered data showed the same scammers returning weeks later with false promises to recover stolen assets.
Read the full story on CryptoSlate
Understand the crypto stories that matter and what to watch next. Get The Catalyst in your inbox
Bitwise CIO Matt Hougan argued in an Oct. 14 memo that nearly every macroeconomic path ends with Bitcoin higher, including an extraordinary AI productivity boom that makes scarce assets more valuable. Two days earlier, the Bank for International Settlements published a working paper that models a fourth path. In it, AI automates work and lifts…
Read the full story on CryptoSlate
Understand the crypto stories that matter and what to watch next. Get The Catalyst in your inbox
Bitcoin registered an intraday low of $81,514.28 on Oct. 14 as September CPI came in hotter than forecast, with headline inflation at 3.7% year over year against 3.6% expected and core at 2.6% against 2.5%. Glassnode's latest on-chain data suggests a calmer holder base than the price action. The harder test sits near $80,000, where…
Read the full story on CryptoSlate
Understand the crypto stories that matter and what to watch next. Get The Catalyst in your inbox
New OCC findings put crypto restrictions in a nine-bank record, while AML, sanctions and operational assessments still shape access.
Read the full story on CryptoSlate
Understand the crypto stories that matter and what to watch next. Get The Catalyst in your inbox
CryptoTicker.io
On Wednesday, 15 October 2026, forced closures on the crypto market wiped out roughly $489 million in leveraged positions within a single hour. That is more than half the sum that accumulated over the full 24 hours. Across the day, traders lost about $942.1 million according to figures from CoinGlass, and $863.3 million of that fell on long positions, that is, on bets that prices would rise.
For anyone trading with leverage, the decisive number is not the price loss. Bitcoin gave up just under three percent that day, Ethereum a good five. Holding without leverage, you see a red day in the portfolio. Being long with tenfold leverage at a five percent price loss means half the stake is gone, and at ten percent the position is closed before any recovery can catch up with it. That is exactly what happened on a mass scale in this one hour.
$942 million in 24 hours, more than half in 60 minutes
The numbers diverge depending on the time window and the provider, and they are not going to be smoothed over here. CoinGlass reports $489.4 million for the hour in question. The news service PANews names $476 million for a window as of 10:35, of which $457 million on long and $18.2 million on short positions. The range therefore lies between $476 million and $489 million, depending on where the hour begins. Both are robust on the point that matters: the lion's share of the day's losses fell into a very short window.
A liquidation is not a decision to sell but an enforcement measure by the exchange. Once the posted margin no longer covers the accumulated loss, the risk system closes the position automatically at the market price. The client is not asked, and gets no grace period. CoinCentral traces the course of the day with the values for the individual coins.
Leverage works in both directions, and that is what makes it dangerous in down phases: the larger it is, the smaller the price move that wipes out the stake. At fivefold leverage that threshold sits at a 20 percent price loss, at twentyfold at five, at fiftyfold at two. Fees and funding costs move the point forward further still.
Long positions carry 91.6 percent of the losses
Of the day's $942.1 million, $863.3 million fell on long positions. That is 91.6 percent. A distribution that lopsided says something about sentiment in the preceding days: the market was predominantly positioned for rising prices, and the other side was thinly occupied.
From that arises the mechanism that turns a pullback into a cascade. A forced closure is a sale into the market. That sale pushes the price down another notch. A notch lower sit the liquidation prices of the next positions, and those get closed too. In a market where almost everyone has bet in the same direction, one initial nudge is enough to set that sequence in motion. It explains why the losses clustered into a single hour instead of spreading evenly across the day.

Why Ether was hit harder than Bitcoin
According to the daily data, roughly $286 million in liquidations fell on Ethereum and roughly $197 million on Bitcoin. That is remarkable, because Bitcoin is considerably larger by market value. A market worth three times as much carried a third fewer forced closures that day.
Reports say that on Binance alone more than $106 million in Ether long positions were closed within about an hour. The explanation lies not in the price but in how the futures market was positioned: before the slump, markedly more accounts stood on the long side in Ether than in Bitcoin. That claim can be recalculated, and we did it.
Our analysis: 2.36 long accounts per short account in Ether
This analysis was compiled by cryptoticker.io itself on 15 October 2026. It is based on the public market data of the exchange OKX on its perpetual futures contracts on Bitcoin and Ether, queried across ten individual data points: account ratio, open contracts, funding rate, daily range and turnover, in each case for both coins.
The result: for every account betting on falling prices in Ether there are 2.36 accounts betting on rising ones. In Bitcoin the figure is 1.73. The long overhang in Ether is therefore a good third larger. In the hours before the slump the Ether ratio even stood at 2.65 to one, the highest reading in the series examined.
Add to that the open contracts. On the Ether contract, 622,656 ETH were open at the time of the query, equivalent to $1.47 billion. On the Bitcoin contract it was 30,777 BTC, or $2.49 billion. Over the past thirty days the dollar value of open Ether positions has fallen by just under two percent, that of Bitcoin risen by a good 16 percent. Against its respective monthly high, Ether sits just under 15 percent lower, Bitcoin only just under four percent.
Both funding rates were still positive at the time of the query, at 0.0051 percent for Bitcoin and 0.0036 percent for Ether per settlement period. A positive funding rate means the long side pays the short side. As long as that figure sits above zero, the overhang on the long side has not been worked off, not even after a cascade of this size.
What has changed since the deleveraging of 13 October
On 13 October 2026 we described in this space how the Ether futures market had shed 16 percent of its leverage within five days, at a price of $2,534 (Ethereum price $2,534, 16 percent less leverage in five days). Two days later the price stands at roughly $2,364, that is $170 lower. The $2,500 level, which held back then, has fallen.
The deleveraging, in other words, did not settle the matter. It brought the market into a new long-overhang position at a lower price, and that position was unwound for the second time this Wednesday. The difference from 13 October lies in the speed: back then the unwind spread across five days, this time more than half of it fell into one hour.
Liquidation price and margin: how a forced closure runs
The liquidation price is the price at which the posted margin is used up. Every exchange calculates it from position size, leverage, maintenance margin and fees, and displays it in the trading window before the position is opened. Trading without knowing that number is trading blind.
Two points are regularly overlooked here. First, many platforms work with a reference price drawn from several exchanges rather than their own last traded price. A brief spike on a single venue therefore does not necessarily trigger a closure, whereas a market-wide move very much does. Second, risk systems tier the maintenance margin by position size: a large position needs proportionally more margin than a small one, and its liquidation price therefore sits closer to the current price.
In practice that means the distance between the current price and the liquidation price is the only buffer there is. That distance can be widened in three ways, and all three cost something. Adding margin ties up additional capital. Partly closing the position shrinks the possible gain. Lowering the leverage means putting up more equity for the same position size. What does not exist is a way to widen the buffer for free.

The daily ranges and what they offer as levels
According to our query at OKX, Bitcoin moved between $80,168 and $83,910 that day and was last quoted at $80,913.70. Ether ran between $2,315.26 and $2,520 and stood at $2,363.78. Those daily lows are the levels that matter now for leveraged positions, because below them there are no fresh reference points from current trading.
The distance is narrow in both cases. Bitcoin sits less than one percent above its daily low, Ether around two percent. A position with twentyfold leverage opened this morning is therefore already close, on the arithmetic, to its closure threshold. Waiting in that situation for a quick counter-move relies on the cascade being complete. The positive funding rates argue against it.
Leveraged trading in Europe: what is permitted and what is not
Retail clients in the European Union can trade crypto contracts for difference only with leverage of at most 2:1. That cap has applied since the product intervention measures of the European securities authority and was adopted for Germany by BaFin. Negative balance protection applies for retail clients: the loss cannot exceed the stake.
The leverage of ten, twenty or fifty that produced this day's liquidations comes predominantly from platforms outside that framework. Trading there means giving up two things: the leverage cap and the protection against a loss beyond the stake. On top of that, no deposit guarantee exists for crypto assets in any case, neither here nor there. An orderly overview of providers with clear leverage limits and local settlement is given in our crypto broker comparison; for trading perpetual futures contracts on decentralised venues, the differences in funding costs and risk systems are set out in our perp DEX overview.
Spot instead of leverage: holding period and custody
For investors watching this day from the outside, the real point lies elsewhere. A cascade of this kind hits leveraged positions exclusively. Holding coins directly and keeping them in self-custody means having no risk system above you that sells in a price slide. A red day stays a red day.
Added to that is the tax difference, and in Germany it is considerable. Gains from selling directly held crypto assets are tax-free after one year of holding, provided the coins were not used for staking or lending in that time. Gains from contracts for difference and other derivatives, by contrast, fall under capital gains tax, and losses from futures transactions are restricted in how they can be offset. One year of holding is therefore no side issue but the most tax-efficient route German law provides for crypto assets. If you prefer the spot purchase to leverage, the best way to compare venues and fees is our crypto exchange overview.
Our assessment: the deleveraging is not complete
In this newsroom's view the data argues that this Wednesday was not a clean-out but a stage. Three pieces of evidence carry that assessment. The account ratio in Ether, at 2.36 to one after the cascade, still sits above the Bitcoin figure, and Bitcoin came through the cascade better. The funding rates are positive for both coins, so the long side keeps paying for its positions. And the dollar value of open Ether contracts sits only just under 15 percent below the monthly high, after a day in which roughly $286 million in forced closures fell on this coin alone.
Against that stands the speed of the sequence. A cascade that works through more than half its volume in one hour clears out the most thinly margined positions thoroughly. The accounts still long now are on average better cushioned than those closed at ten o'clock. That makes a second wave of the same size less likely, but does not rule it out. This assessment evaluates the market situation and is not a recommendation to buy or sell; with crypto assets a total loss is possible.
Liquidation cascade: below $80,168 it gets tighter for longs
Bitcoin's daily low at $80,168 and Ether's at $2,315.26 are the two levels from which the coming trading days will show whether the market has digested the cascade. If the distance above them holds, this Wednesday was a clean-out. If the levels fall, the next nudge meets a futures market that by our measurement still stands predominantly long.
- Look up the distance to the liquidation price. Every open leveraged position shows that price in the trading window. If it sits closer than today's daily range of three to four percent, a day like this one is enough for the forced closure. How platforms differ on leverage limits, maintenance margin and funding costs is set out in the broker comparison.
- Check the funding rate before the next position. It is quoted on every perpetual contract and says which side pays. Positive values mean running costs for long positions, which add up over a longer holding period. The differences between the decentralised venues are broken down in the perp DEX overview.
- Set the spot share against the leveraged share. Directly held coins are tax-free after one year and are sold by no risk system. Which venues charge what on a plain purchase is shown by the exchange overview.
(As of October 15, 2026. This article is not investment advice. Prices and fee structures change; check the terms with the provider before you buy.)
Dogecoin trades at $0.0801 on Thursday midday, down 8.6 percent over seven days. Bitcoin gave up 2.0 percent in the same period. That distance is the real finding of the day: Dogecoin is falling more than four times as hard as the market's largest asset, and it is doing so at a point the price already visited four weeks ago.
Dogecoin at $0.0801: the numbers at Thursday midday
As of 15 October the price stands at $0.080056. Over 24 hours that is 5.0 percent lower, over seven days 8.6 percent, over 30 days 3.0 percent. On a one-year view there is a loss of 61.1 percent. Spot turnover over the past 24 hours is $1.07 billion and market capitalisation $12.52 billion. That is rank twelve in the overall market. All figures come from CoinGecko and were read off at Thursday midday.
CoinGecko reports the day's low from tick data at $0.078426. On hourly values, which allow lows to be compared cleanly across weeks, the lowest hourly print of the day is $0.078951, reached in the early morning. The two numbers do not contradict each other; they measure at different resolutions. For the comparison with September, the second one counts.
Seven days down 8.6 percent, Bitcoin down 2 percent
The weekly comparison places the move. Over seven days Ethereum loses 7.3 percent, XRP 6.6 percent, Shiba Inu 7.8 percent, Litecoin 9.3 percent, Solana 10.2 percent and Cardano 11.5 percent. At 8.6 percent, Dogecoin sits in the middle of that group. The only striking figure is the distance to Bitcoin, which at 2.0 percent is almost unmoved and over 30 days is even 5.5 percent up.
That yields a plain reading which needs no speculation. What is under way bears the marks of a rotation out of the smaller assets into the largest. Managing a portfolio by weights shows it in Dogecoin's share of the overall market, which has fallen this week, while Bitcoin's share has risen.
What the term rotation means here
Rotation describes capital shifting between segments of the same market without money leaving that market. It is recognisable when one segment falls while another holds or rises, with turnover overall normal. That is precisely the picture this week's numbers show.
Since yesterday: $0.0845 has become $0.0801
On 14 October the price stood at $0.0845 in our look at the large-address share, as set out in Wednesday's edition on the Dogecoin price and the share held by large addresses. Since then 5.2 percent has been given up. The level named there as the next test has now been reached and was briefly breached during the day.
What matters here is keeping the time frames apart. This year's February low was $0.0887, measured on 6 February. That line has been history since June, a month that brought hourly prints down to $0.0731. The line where something is being decided today is younger and sits lower.
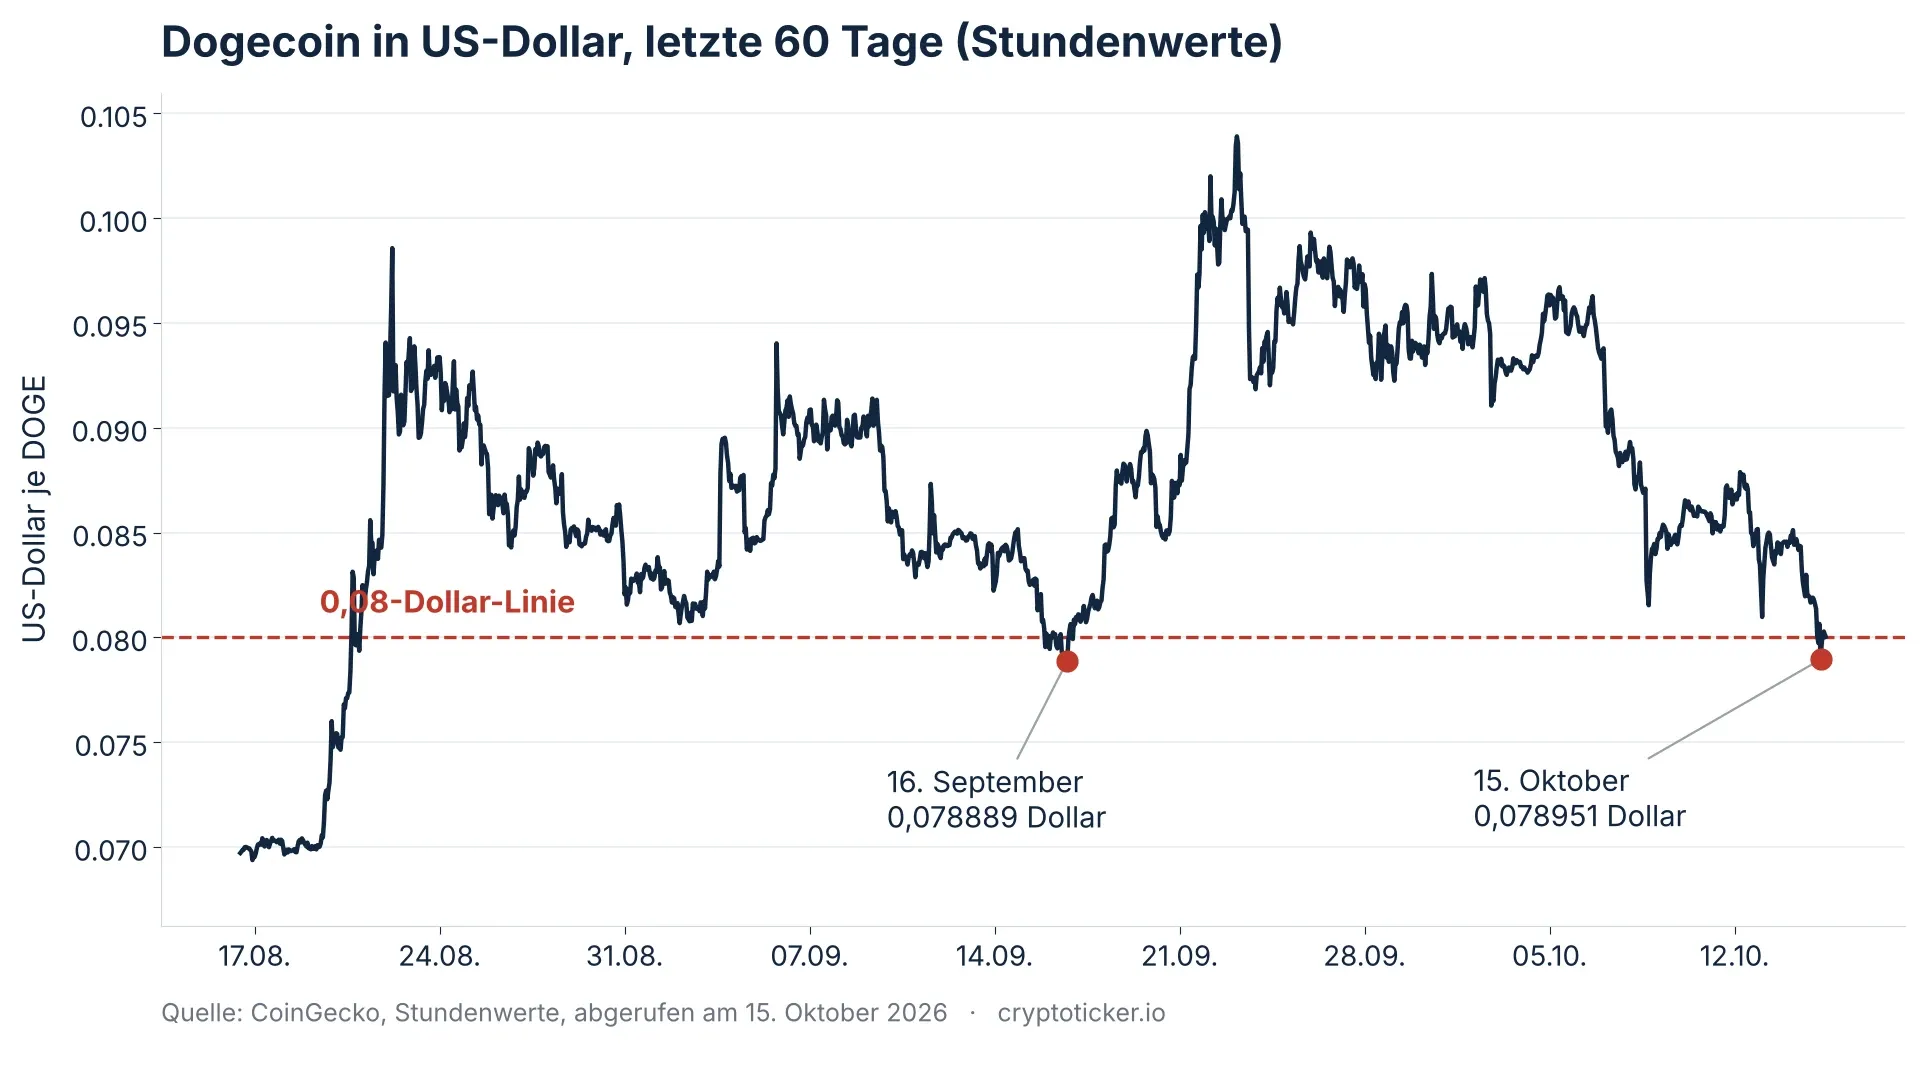
The $0.08 line and the September low at $0.078889
On 16 September the lowest hourly print fell to $0.078889. On 15 October it was $0.078951. Between the two values lie $0.000062, less than a tenth of a percent. Two attempts 28 days apart therefore ended at practically the same point.
Alongside that stands September as a month with a lowest daily value of $0.080051 and October with $0.080024. On a daily basis the round $0.08 line has held twice; on an hourly basis it was briefly breached both times. In practice a level is rarely an exact line. Usually it is a zone a few tenths of a percent wide.
To the upside the next well-founded level is the October high of $0.097149 from 2 October. To the downside the year's low sits at $0.06902, reached on 7 August. The current price is 89.1 percent away from the all-time high of $0.7316.
The last test on 16 September and the recovery to $0.1039
The comparable case is four weeks back and can be recalculated to the hour. After the low of 16 September the price turned up and reached $0.103908 on 23 September. That is 31.7 percent above the low, achieved in seven days. After that it went down again in stages: $0.097149 on 2 October, $0.088349 on 8 October, $0.0801 today.
For investors that means two things. The line held at the last test, and it brought no trend reversal. The recovery ended 32 percent higher and then retraced in full. Taking September as a template means taking both halves of the template.
Where Dogecoin is traded and at what cost differs markedly from venue to venue. A look at the crypto exchange comparison shows the ranges on trading fee, spread and withdrawal, which weigh more heavily on a price with four decimal places than they do on Bitcoin.
Mining supply: 13.64 million new DOGE a day
A second way into the subject lies not in the chart but in the blockchain itself. Dogecoin has no cap on total supply. Each block creates 10,000 new DOGE, as the project site at dogecoin.com describes it. Over the past 24 hours, 1,364 blocks were found according to Blockchair.
That works out to 13.64 million new DOGE in a day and around 4.98 billion a year. At the current price the daily amount corresponds to a value of roughly $1.09 million. Circulating supply lies between 156.3 billion units at CoinGecko and 172.0 billion at Blockchair, depending on the count. Annual expansion thus comes to just under three percent.
Why that number does not explain today
$1.09 million in new supply faces $1.07 billion in spot turnover. New supply therefore accounts for roughly one part in a thousand of daily turnover. As an explanation for a weekly loss of 8.6 percent it does not serve. It works as a permanent drag over years, not as the trigger of a single trading day. Anyone seeking to understand the annual balance of minus 61.1 percent finds one building block here. For today it contributes nothing.
The blockchain, incidentally, shows no congestion. 23,015 transactions in 24 hours, 17 items in the mempool, an average fee of $0.028. Panic-driven movement on the blockchain looks different.

Holding period and the exemption limit: 31 December under section 23 of the German Income Tax Act
Here lies the concrete check an investor in Germany can carry out today, and it has little to do with the chart. Crypto falls under private disposal transactions. The governing rule is section 23 of the German Income Tax Act. It sets the period between acquisition and disposal at "not more than one year", and it sets the exemption limit: gains stay tax-free if the total gain from private disposal transactions in the calendar year comes to less than 1,000 euros.
What the annual balance of minus 61.1 percent has to do with it
Anyone who bought Dogecoin within the past twelve months is, at today's price, sitting on a loss on paper. Losses from private disposal transactions realised within the one-year period can be offset against gains in the same category in the same year, for instance gains from other coins or from gold. The calendar year ends on 31 December, and a disposal takes effect only in the year in which it occurs.
Two points belong with that. First, with every month a part of the holding runs out of the one-year period, and what lies outside the period has no tax effect, in gain or in loss. Second, the order of acquisitions is decisive, which is why a clean record per purchase matters more than any view on the price. Which tools keep that record and track the deadlines per lot is shown in the overview of tax software and portfolio trackers.
This account is no substitute for tax advice. What is named here is the deadline, the section and the exemption limit, so that the question to check is on the table before the turn of the year.
Buying route and custody: fees, spread and your own keys
At a price of $0.08 the buying route decides a noticeable part of the outcome. On the cost side at entry we have already broken down the ranges between instant buy and order book, as set out in our look at the buying route for Dogecoin. The finding there still holds: the convenient route costs the larger mark-up.
For custody the usual trade-off applies. On the exchange the holding stays quickly tradable and sits with a third party. On your own hardware it sits with you, with full responsibility for securing the recovery words. Which devices support Dogecoin and what they cost is set out in the hardware wallet comparison. For amounts earmarked for a sale within the one-year period anyway, moving to your own hardware is rarely the first job.
Our assessment: the line is holding so far, the annual balance is not
In this newsroom's view the situation is less dramatic than the daily loss of 5.0 percent suggests, and at the same time less reassuring than the line holding makes it look. Three documented points support that. First, the zone around $0.0789 has stopped the price twice within 28 days, at $0.078889 on 16 September and at $0.078951 on 15 October. Second, the blockchain is unremarkable: 17 items in the mempool and an average fee of $0.028 show no selling pressure backing up in the network. Third, the weekly loss sits in the middle of the larger altcoins, not at the bottom of them.
Against that stands the longer view. On a one-year basis there is a 61.1 percent loss, over 30 days 3.0 percent, while Bitcoin gained 5.5 percent in the same month. The recovery after the September low ended at $0.103908 and retraced in full. A line that holds twice is a floor and not yet a turn. A turn can only be proven once an attempt ends above the October high of $0.097149. This assessment evaluates the situation and is not a buy or sell recommendation.
Dogecoin: below $0.078889 the path to the August low opens
Three steps order the coming weeks, each of them checkable.
- Watch the zone around $0.0789. If it holds a third time, the picture of the past four weeks stays intact. If a daily close lands clearly below it, the year's low of $0.06902 from 7 August is the next figure the market can refer to. To be ready to trade on that, know the costs of your venue and check them against the exchange comparison.
- Write down the one-year deadline for each purchase lot. Purchase date, quantity, price, and from that the date on which the one-year period under section 23 of the German Income Tax Act ends. Until 31 December this list decides which losses can still be offset. The tools for it are in the overview of tax software.
- Match the place of custody to the investment horizon. Holdings that will sit longer than the one-year period belong on your own hardware rather than at a trading venue. The devices and their costs are in the hardware wallet comparison.
(As of October 15, 2026. This article is not investment advice. Prices and fee structures change; check the terms with the provider before you buy. Crypto investments can lead to a total loss.)
Chainlink has been delivering its price data on Stellar since 14 October. Applications on that blockchain can now pull quotes for Bitcoin, Ether, LINK, XLM and USDC without building a data supply of their own. The token price is not following the news: Chainlink trades at $12.13 on 15 October, 6.12 percent below the previous day. The day's low was $11.98, the high $12.99.
That gap between network expansion and price action is the real story of the day. An oracle network wins another blockchain as a customer, and the paper on it gives way because the whole market gives way. The two are connected far less tightly than they look at first glance. This case shows precisely why.
What Chainlink delivers on Stellar: Data Feeds and Data Streams
Chainlink is an oracle network. An oracle is a service that brings data from outside a blockchain onto the blockchain in a form that contracts there can compute with. A blockchain knows no prices of its own; it knows only what sits in its own blocks.
Two products are available on Stellar. Data Feeds are continuously updated price readings that sit on the blockchain as a contract and can be queried by any application. Data Streams deliver the same data at a higher cadence and are written to the blockchain only when they are called, which is aimed at trading applications that need fast quotes.
Reports on the launch name feeds for BTC/USD, ETH/USD, LINK/USD, XLM/USD and USDC/USD. Developers select a single feed through an identifier addressed via a shared contract. Data like this is used above all where collateral has to be valued: in lending applications, with stablecoins, with tokenised equities and with derivatives.
Chainlink Scale: who carries the cost of the oracles
The launch runs through a programme called Chainlink Scale. The announcement by the Stellar Development Foundation describes joining that programme and the intention to adopt Data Feeds, Data Streams and CCIP. CCIP is Chainlink's protocol for transfers between different blockchains.
Economically this is the most interesting point. Under the Scale programme the adopting network carries the running cost of oracle operation, not the individual application and not Chainlink. Reports on the 14 October launch describe exactly that: the foundation behind Stellar bears the operating cost. That lowers the barrier for developers on Stellar to use this data. For demand for the LINK token, little follows for now, because payment happens at the level of the foundation rather than through every single call made by an application.
Two executives speak in the announcement. Johann Eid, Chief Business Officer at Chainlink Labs, calls the move an entry point to the infrastructure needed for institutional tokenisation. Raja Chakravorti, Chief Business Officer of the Stellar Development Foundation, says that once the integration is complete Stellar will be a step closer to a unified financial system on the blockchain. The announcement itself is written in the future tense and describes the integration as a plan; the reports of 14 October cover the feeds going into operation.
Stellar's tokenised assets: $3.54 billion to more than $4 billion
The size of the target market is stated differently in different places, and those differences are not a trifle. Several reports on the launch put the stock of tokenised assets on Stellar at roughly $3.54 billion, others at more than $4 billion, depending on cut-off date and definition. One of those figures refers explicitly to the position on 1 September 2026.
The foundation itself cites a different measure in its announcement: $5.4 billion in payment volume with tokenised assets per quarter. That is not the same as a stock. A payment volume counts movements over a period; a stock counts what exists on a given date. Setting the two numbers side by side without naming the difference compares two different things. On DeFi activity on Stellar, the foundation writes that it has grown more than threefold this year.

The LINK price on 15 October: $12.13 after $11.98 at the low
The price figures in this article come from a direct query at CoinGecko on 15 October 2026. LINK stands at $12.13, or 10.82 euros. Over 24 hours that is 6.12 percent down, and 7.23 percent down over one week.
Longer periods look different. Over 30 days LINK is 7.01 percent up. The month, in other words, was friendly, and the weak day falls within a phase that trended higher overall. Over twelve months there is a loss of 35.71 percent. From the May 2021 record high of $52.70 the price is almost 77 percent away.
Market capitalisation is $9.30 billion and daily turnover $382.56 million. There are 766.85 million LINK in circulation out of a total supply of one billion. A good fifth of the supply, then, is not yet in the market.
Oracles explained: how a price feed triggers a liquidation
The path from a price reading to a change in a position is shorter than many assume. Borrowing on a blockchain means posting collateral, Ether for example. The contract that manages that loan has to know continuously what the collateral is worth. It takes that reading from a price feed.
If the posted value falls below a defined threshold, the contract sells the collateral by itself. This is called a liquidation. What decides the outcome is not what is happening on a trading venue, but the value standing in the feed. A feed that delivers late or delivers wrong triggers liquidations that should never have happened, or prevents ones that were needed.
That is why the choice of oracle is a decision about liability and trust for a blockchain, and not merely a technical detail. And that is why landing an established provider weighs heavily for Stellar. The foundation notes in its announcement that the security layer of CCIP builds on infrastructure which, on its account, secures value in the region of nearly $100 billion across DeFi.
Why network expansion and token demand drift apart
An oracle network earns money when applications call data and pay for it. When a network such as Stellar covers those costs in a lump sum, reach is created without an amount in LINK falling due for every call. The link between distribution and token demand does exist, but it is indirect and lagged.
There is also the question of scale. Even a stock of $4 billion in tokenised assets is, measured against a market capitalisation of $9.30 billion, not a sum that moves a price on its own. Chainlink has reported several integrations in recent weeks alone, most recently the CCIP Vault Adapters on 8 October. The price has not turned any of them into a lasting uptrend.
Terms at the trading venues are set out in the crypto exchange comparison for anyone looking to buy in. The spread between bid and ask barely matters for an asset of this size; at $382.56 million in daily turnover the market is deep enough that larger orders also fill at the quoted price.

What the funds hold in Chainlink
Alongside buying directly, there are exchange-traded products on LINK. According to SoSoValue data cited by Coingape, the two US funds together held $244.34 million, of which $175.69 million sat with Grayscale and $68.64 million with Bitwise. On 1 October, $2.62 million flowed in, all of it into the Bitwise product.
Measured against a market capitalisation of $9.30 billion, $244.34 million is around 2.6 percent. These products are a factor, then, but not a dominant one. How the inflows have developed lately was set out by cryptoticker.io on 10 October in its piece on the first fund inflow after five trading days.
The broad decline on 15 October
The day was weak for almost every large crypto asset. Bitcoin gave up 2.54 percent, Ether 5.20 percent. At 6.12 percent, LINK sat clearly below Bitcoin and somewhat below Ether. That pattern is not unusual for Chainlink: in broad declines the asset usually falls harder than the two largest ones, and in recoveries it rises harder.
For reading the day, that leaves one conclusion: the price loss cannot be attributed to the Stellar news. It fits a market that gave way across the board that day. The only robust statement is that the news did not prevent the decline.
Access in Europe: MiCA licensing, custody and the holding period
For investors in Europe the Stellar launch changes nothing about the practical questions. LINK is tradable at the large venues that hold a licence under the MiCA regulation in the European Union. MiCA is the single European legal framework for crypto assets; a licence under it means the provider is supervised and has to meet certain obligations to protect client funds.
On custody the familiar trade-off remains. Leaving the coins at the trading venue is more convenient and carries the provider's risk. Moving them to a wallet of your own means taking responsibility for securing the keys yourself.
For tax, private sales in Germany fall under the one-year holding period set out in section 23 of the Income Tax Act. Hold for at least a year and no income tax is due on the gain from the sale. Staking income has to be treated separately. On the deadlines in Chainlink staking, cryptoticker.io reported on 12 October ahead of the 29 October date.
Our assessment: the reach is documented, demand for the token is not
In this newsroom's view the Stellar launch is a good day for Chainlink as a company and a neutral one for the token. Three documented points support that. First, the foundation behind Stellar carries the operating cost, which aids distribution but triggers no per-call payment in LINK. Second, the target market, with a stock between $3.54 billion and a good $4 billion, is smaller than LINK's market capitalisation. Third, the price has not reacted lastingly to comparable announcements in recent weeks.
Against that stands the fact that the value of infrastructure only shows over years. If lending and trading applications do emerge on Stellar that need these feeds permanently, business will follow later. That is not measurable today, and selling it as a price argument claims more than the figures support. This is an assessment of the situation, not a recommendation to buy or sell; with crypto assets a total loss is possible.
Chainlink on Stellar: only fees turn reach into demand
- Check the terms before buying. Venue, fee model and withdrawal costs differ markedly. The terms are set out in the crypto exchange comparison.
- Look for the EU licence. A provider with a MiCA licence is supervised. Which venues meet that is shown in the overview of regulated crypto exchanges.
- Record the purchase date. The one-year holding period can only be proven if the data is captured cleanly. The tax software and portfolio trackers help with that.
(As of October 15, 2026. This article is not investment advice. Prices and fee structures change; check the terms with the provider before you buy.)
On October 25, 2026, 227,777,777 XPL become free at Plasma. That is around 5.0 percent of the circulating supply and, at the current price of $0.077, about $17.6 million. The more important figure, though, is not in that single day's calendar entry: the same tranche falls every month afterwards, for 24 months, until September 25, 2028. From that date on, the XPL unlock is no longer a single event but a rhythm.
That is exactly what separates October 25 from September 25, when the one-off cliff tranche for the team and investors fell. Treat the September date as settled and you miss that only a third of the team and investor supply was released there. The remaining two thirds follow in even monthly tranches. This article works through the schedule, sets it against the circulating supply and answers what follows from it for you as an investor in Germany.
XPL unlock on October 25: these three items become free
The release is made up of three parts, all of which take effect on the same day. The official documentation on XPL distribution describes the rules from which every single figure follows:
- Ecosystem and growth: 88,888,889 XPL. This tranche has already been running every month for a year.
- Team: 69,444,444 XPL. The first monthly tranche at all.
- Investors: 69,444,444 XPL. Likewise the first monthly tranche, on the same schedule as the team.
Together that comes to 227,777,777 XPL. At a price of $0.077129, the tranche corresponds to around $17.6 million and to 5.02 percent of the circulating supply of 4.53 billion XPL. Measured against the total supply of 10 billion tokens, it is 2.28 percent.
From cliff to standing schedule: what changes against September
A cliff is a lock-up period at the end of which a large block is released in one go. At Plasma that point came one year after the mainnet beta launch of September 25, 2025. On that day a third each of the team and the investor supply became free, so 833.3 million XPL twice over. How the date was to be judged at the time was set out by cryptoticker on September 1, 2026, in the analysis of the XPL lock-up period; the launch of the network itself is covered in the report on the mainnet beta of September 25, 2025.
Vesting is the name for the schedule under which the remaining supply is then released in portions. For the team and investors it spreads the remaining two thirds across 24 equally sized monthly tranches. October 25 is the first of them.
In practice that changes the order of magnitude of the monthly inflow. Between October 2025 and September 2026, 88.9 million XPL came in month after month from the ecosystem pot. From October 2026 it is 227.8 million, around 2.6 times as much. That jump belongs to the picture when the calendar entry for October 25 crosses your path.
The maths behind the 227.8 million tokens
Both figures can be recalculated from the parameters in the documentation, and they add up exactly:
- Team and investors: 2,500,000,000 XPL total allocation each. A third of that was the cliff, leaving 1,666,666,667 XPL. Divided by 24 months, that gives 69,444,444 XPL per tranche and group.
- Ecosystem and growth: 4,000,000,000 XPL total allocation, of which 800 million were immediately free at launch. The remaining 3,200,000,000 XPL are spread over 36 months, so 88,888,889 XPL per tranche.
The schedules end on the same day, September 25, 2028. The team and investors need 24 months for that because their schedule starts a year later; the ecosystem pot runs over 36 months from the network launch. Three years after the mainnet beta, the full supply is released in all three cases.

What 5.02 percent of the circulating supply means in proportion
An absolute token figure says little as long as it is not set in proportion. XPL currently weighs in at around $350 million in market capitalisation, with 4.53 billion tokens in circulation. That is 45.3 percent of the total supply of 10 billion. More than half of all XPL is therefore still locked.
If the schedule continues unchanged, the released supply twelve months later stands at around 7.27 billion XPL. That would be an increase of about 60 percent against today, spread across twelve equally sized steps. This calculation describes supply only, however. How much of it actually arrives at a trading venue depends on what the recipients do with their tokens, and that cannot be read off the unlock schedule.
The roadmap to September 2028 in figures
Once you have grasped the rhythm, you can work out every coming date yourself. The tranches are constant, only the total grows:
- October 25, 2026: first joint monthly tranche, 227.8 million XPL. Circulating supply afterwards around 4.76 billion.
- Every 25th thereafter: the same 227.8 million XPL, unchanged in size.
- October 25, 2027: circulating supply around 7.27 billion XPL, so just under 73 percent of the total supply.
- September 25, 2028: final tranche. After that, all 10 billion XPL are released.
Two items are no longer part of this schedule. The public sale covered 1 billion XPL and is fully unlocked: buyers outside the US received their tokens at the network launch, and the lock-up for US buyers ended on July 28, 2026. No further inflow comes from that direction.
Staking and emissions: why one important clause currently runs into nothing
One sentence in the documentation is usually missing from pure date announcements: locked XPL held by the team and investors are excluded from staking rewards. With every monthly tranche, the amount allowed to take part in future emissions therefore grows as well.
Emission here refers to the reward that a proof-of-stake network creates anew and distributes to those who post tokens as security. Plasma plans a start at 5 percent annual inflation, decreasing by 0.5 points a year down to a floor of 3 percent. The counterweight comes through transaction fees: the base fee is permanently destroyed, following Ethereum's example.
For holders, one detail dampens expectations here. This inflation is not active yet. According to the documentation, the start only follows once external validators and the delegation of stakes are enabled, and both are still outstanding. Buy XPL today and you cannot currently delegate the tokens to a validator, and you receive no network reward for them either. The network is opening its validator circle in stages, and the documentation names no fixed date for it.
Where XPL can be traded and what matters in choosing a venue
XPL is listed at several large international trading venues, among them Binance, OKX, Kraken, Coinbase, Bybit and Bitget, as well as at decentralised exchanges. For you as an investor in Germany, the number of venues matters less than their legal standing.
Since the European crypto regulation MiCA, providers targeting clients in the EU need authorisation in a member state. Plasma has published a MiCA white paper for XPL, bringing together the mandatory disclosures on the token. That concerns the token itself and says nothing about the authorisation of the venue where you buy. Which providers can show a European licence is set out in the overview of regulated crypto exchanges; fees, selection and deposit routes are in the crypto exchange comparison.
One practical point with a token of this size is market depth. At around $350 million in market capitalisation, XPL sits well below large assets such as Bitcoin. With thin order books, even a medium-sized order moves the price noticeably. A limit order, where you set the maximum price yourself, protects you better here than a market order, which is executed at the next available price.

Tax in Germany: your purchase date beats the unlock schedule
Gains from the sale of cryptoassets are a private disposal in Germany under section 23 of the Income Tax Act. If more than a year lies between purchase and sale, the gain remains tax-free under the law as it stands. Below that it counts towards other income as soon as the exemption threshold for all private disposals in a year is exceeded.
For XPL that means concretely: the token has existed since September 25, 2025. Anyone who bought in the first few days and has held since has already met the one-year period. Anyone who entered later reaches it on their own respective date. The project's unlock schedule has no bearing on that whatsoever, because the only thing that matters is your acquisition date for each tranche.
This connection matters because an unlock date regularly tempts investors into short-term reshuffling. A sale shortly before your own one-year period expires can turn a tax-free gain into a taxable one. On top of that comes the reform under way: a draft bill provides for a cut-off date at the end of 2026, from which newly acquired cryptoassets are to be treated differently. The state of that discussion is summarised in the article on grandfathering and the cut-off date for the crypto holding period.
What an unlock date says about the price and what it does not
An unlock increases the freely available supply. It does not force a sale, though. Team tokens are additionally subject to individual vesting schedules tied to joining dates, and funds from the ecosystem pot flow into liquidity, partnerships and incentive programmes rather than landing on an exchange without a detour.
To place the starting position: XPL trades around 95 percent below the peak of $1.68 that the token reached on September 27, 2025, shortly after launch. Over the week it is down a good 10 percent. Part of the expectation around the monthly schedule is therefore likely to be in the price already, because the schedule has been publicly documented since the network launch and is no surprise.
No serious statement about the price can be derived from this, in either direction. The only robust part is the mechanics: supply grows in known steps on known dates, and from October 25 those steps are considerably larger than in the year before.
Three questions that deserve an answer before October 25
Not every one of these questions concerns every holder, but each can be answered in a few minutes:
First, when did you buy? Without that date for each tranche, the tax position cannot be judged. Exchanges provide transaction overviews for export, and portfolio tools sort purchases by holding period automatically.
Second, how liquid is your trading venue? A look at the order book shows how far the buy and sell sides are apart. The wider that spread, the more expensive an order executed at the market price becomes.
Third, what share of your portfolio does XPL make up? With an asset sitting 95 percent below its peak and whose circulating supply can rise by around 60 percent within a year, position size is the most effective lever.
XPL unlock: the same tranche falls every month until September 2028
October 25 is the first of 24 identical dates. To get a handle on it, proceed in this order:
- Compile your purchase dates. Export the transaction overview from your exchange and sort the purchases by date, so that you know for each tranche when your one-year period expires. Which programmes handle that automatically is set out in the overview of crypto tax software and portfolio trackers.
- Check your trading venue. Verify whether your provider holds a European authorisation and what fees apply at your order size. The terms are in the crypto exchange comparison.
- Correct your expectations on income. There is no staking yield on XPL until delegation starts. If you are looking for running income, compare it where it is already being paid out today, for instance through the overview of staking platforms.
(As of October 15, 2026. This article is not investment advice. Prices and fee structures change; check the terms with the provider before you buy.)
Solana costs $102.99, or 91.79 euros, on Thursday morning, October 15. That is 3.8 percent less than 24 hours earlier, and over seven days it leaves a loss of 10.4 percent. The figure alone explains little. More revealing is who buys and who sells at this level, because that is where the market's biggest addresses are visibly pulling in two directions.
Solana price at $102.99: where things stand on Thursday morning
The market data come from CoinGecko. The daily high was $107.74, the daily low $101.04. Solana thus weighs in at $60.7 billion and ranks seventh among the largest cryptocurrencies. In 24 hours, $4.10 billion changed hands. Of a total 635.84 million SOL, 589.27 million are in circulation.
Over longer horizons the picture turns contradictory, and that is exactly where the tension of this week sits. Over 30 days Solana is up 2.6 percent, over 60 days 36.6 percent. Over a year, by contrast, 49.8 percent is missing, and 64.9 percent separates the price from its peak of $293.31 on January 19, 2025. October has cost more than 13 percent so far. Anyone who entered in August is sitting on a clear gain; anyone who bought a year ago on half their stake.
Grayscale has been buying for 20 days, VanEck is selling
Among the US spot ETFs on Solana, a pattern has emerged over the past three weeks that was not there before. According to data from the analytics firm Arkham, Grayscale's GSOL fund has taken in $20.2 million of SOL across 20 days, with a single outflow day in between. On October 12, a day on which Grayscale gave up nothing, VanEck sold around $700,000 through its VSOL fund.
A spot ETF does not buy out of conviction. It mirrors what its shareholders do: subscribe to units and you trigger a purchase in the market, redeem them and you trigger a sale. That one provider adds for 20 days while another gives up therefore proves no special knowledge at Grayscale. It shows that the two houses' client bases are currently acting differently. Grayscale traditionally serves long-term holders who come from the older trust product, VanEck more active allocators with a shorter horizon.
For the price it remains a zero-sum game with a sign attached. As long as the sum across all funds is negative, they are net sellers into a falling market, regardless of how convinced individual providers are as they accumulate.

Eighth straight day of outflows: what the ETF figures measure
Summed across all providers, the Solana ETFs saw outflows on Wednesday for the eighth trading day in a row, most recently $1.29 million. In the week of October 5 to 9 they had lost $24.81 million net, according to figures from SosoValue, ending a run of 14 weeks of inflows. Our report of October 11 has already covered that week.
What has changed since is the length of the run, not its size. At $4.10 billion in daily turnover, $1.29 million in a day is not an amount that moves a price. The duration is the signal: eight trading days without a single inflow day mean that no fresh money is currently arriving via the fund route. That route is precisely what carried the price in August and September.
$97.95 and the 50-day line at 107: this week's levels
On the chart, Solana turned at the 50-day line at $107.13 on Wednesday and fell back from there. That line has stopped every attempt at recovery since the start of October. To the downside, market observers name $97.95 as the next catching line, just below the round 100.
The round number itself was discussed in our article of October 14, at $103.82 at the time. The price has fallen by just under a dollar since, the 100 has held, and the daily low of $101.04 has tested it once. What is new is the direction of the pressure: no downside break is pending, but a third rejection at the 107 line from above.
The analyst 0xSweep points to a bullish divergence in the four-hour chart and compares it with a constellation near $96 that was followed by a move up to $124. That is a single opinion with one comparable case, not a law. The relative strength index stood at 38.28 on October 13, below its average of 41.72, so in the lower range but not yet where traders speak of oversold.
USDC on Solana: $3.5 billion newly minted in seven days
While the price falls, use of the blockchain is picking up. The data service SolanaFloor reported on October 12 that around $3.5 billion of USDC had been newly issued on Solana within seven days, in repeated tranches of $250 million each. That is the largest weekly issuance on this blockchain this year. USDC holdings on Solana now stand at about $8.64 billion, and over 30 days new issuance adds up to more than $10 billion. The individual mints can be traced in the Solscan block explorer.
A mint means the issuer Circle has accepted dollars and issued tokens in return. That money then sits on the blockchain and waits for a use, whether trading, payment or custody. It is not a buy order for SOL, but it is liquidity that can flow into Solana applications without a detour through an exchange.
Total holdings of all stablecoins on Solana reached a peak of $17.3 billion in September, as measured by Solana Compass and DeFiLlama. This is where the apparent contradiction with our report of October 11, which described a 6.4 percent decline in reserves, resolves itself: total holdings can fall while a single currency gains. That is exactly what has happened, with USDC winning share against the other dollar tokens on the same blockchain.
Tokenised equities: $786.3 million in volume and first place after 13 weeks
The second area where Solana is gaining ground is tokenised equities. In the week of October 5 to 11, the blockchain settled $786.3 million of spot volume in this segment according to figures from SolanaFloor, putting it back in front for the first time in 13 weeks. Behind it came Robinhood with $663.0 million, BNB Chain with $623.3 million and Base with $445.5 million. Ethereum reached $12.0 million, HyperCore $7.9 million. Of the $2.54 billion across all the venues named, around 31 percent therefore fell to Solana.
A product launch provided the impetus. On October 8, the issuer Securitize brought twelve tokenised US equities to Solana, among them Apple, Nvidia and Tesla. According to the company, each token is backed one-to-one by a real share, settlement is in USDC, and Jump Trading acts as market maker. CoinDesk described the structure and legal form in detail on the day of the launch.
For investors in Germany this part is for now an observation and not an offer. Securitize speaks of eligible investors in the US, the EU and other approved markets, but does not define the term more closely. Anyone wanting to acquire tokenised equities needs a provider in the EU with the appropriate MiFID II authorisation, and a decentralised exchange does not hold one.

Alpenglow on October 21: Firedancer and Frankendancer are not joining the migration
On October 21 the Alpenglow consensus protocol starts on mainnet beta, a date confirmed by the core developers at Anza. Alpenglow replaces the existing interplay of Tower BFT and Proof of History with a procedure meant to shorten considerably the time to a block's final confirmation. Final confirmation means the point from which an entry can no longer be reversed.
One footnote to the schedule matters now. The validator software Firedancer and its intermediate stage Frankendancer do not support the initial changeover. Operators running these clients have to switch temporarily for the transition. That affects a relevant share of network capacity and, indirectly, everyone who has delegated their SOL to one of these operators. crypto.news has gathered the details.
At present, 438.97 million SOL are delegated according to data from Staking Rewards, 74.6 percent of the circulating supply, at a yield of around 4.92 percent a year. If you have delegated, you can ask your validator which client it will run on October 21. Should a validator fail during the changeover, the delegator misses that epoch's rewards, while the balance itself is unaffected.
ETFs in the US, ETPs in Germany: the difference in access
The fund flows discussed above arise in the US. A German retail investor cannot buy the spot ETFs there, because they lack the key information document required under the PRIIPs Regulation. The route in this country runs through exchange-traded cryptoassets, usually structured as an ETP or ETN and tradable via Xetra. These securities are physically backed with SOL, but legally they are debt instruments and therefore set up differently from a fund with segregated assets.
In practice that means: the costs sit in the annual flat fee and in the bid-ask spread, and both differ between venue and time of day. In thin market phases such as this week, the spread widens. If you intend to buy anyway, place the order between 15:30 and 17:30, when US trading is running and spreads are tightest. An overview of the trading venues helps with comparing fees.
Staking, the holding period and December 31
For tax purposes in Germany, section 23 of the Income Tax Act applies: a sale within one year of the purchase is a private disposal, after that the gain remains tax-free. In a circular of May 10, 2022, the Federal Ministry of Finance clarified that staking does not extend this period to ten years; it stays at one year even then.
With an annual loss of 49.8 percent, that leads to a calculation which suggests itself. Losses from a sale within the one-year period can be offset against gains from other private disposals in the same year. Sell a position at a loss after the year has elapsed and the loss cannot be used for tax, because the transaction falls outside the period. The cut-off date for offsetting is December 31. The purchase dates of individual positions are in the exchange's transaction report or can be compiled with a portfolio tracker. This is no substitute for tax advice.
Stake instead and you take the 4.92 percent as running income. These rewards count as other income under section 22 no. 3 and are taxable from 256 euros a year, in the year they are received, regardless of whether the SOL are later sold at a profit or a loss.
Our assessment: the price is not following network load right now
In the view of our editorial team, this week's figures show a decoupling that can be named. On one side stands the price: minus 10.4 percent in seven days, eight consecutive outflow days at the funds, a third rejection at the 107 line. On the other stand $3.5 billion of freshly minted USDC in the same week, $786.3 million of volume in tokenised equities and a protocol change with a fixed date.
What argues against reading this decoupling as a case for buying: minted USDC is liquidity and no evidence of demand for SOL, and the volume in tokenised equities accrues mainly at the trading venues, not at the token. On top of that, DEX volume on Solana has been declining lately, with $12.88 billion over seven days meaning 27.0 percent less than in the previous week. So network load is not growing across the board, it is shifting. The only robust statement is that fund flows are currently setting the short-term direction and the usage data are not supporting it.
Solana at $103: the next week is decided above 107
Three things are concrete in the coming days:
- October 21. If you have delegated SOL, ask your validator about the client. If you want to judge the reward independently of the operator, the terms are in our overview of staking platforms and at Staking Rewards.
- The 107 line. Only a daily close above it ends the run of rejections. Until then, $97.95 remains the next catching line to the downside.
- The purchase date in your portfolio. If you want to close or add to a position, check it first against the one-year period and against the December 31 cut-off.
(As of October 15, 2026. This article is not investment advice. Prices and fee structures change; check the terms with the provider before you buy.)
Decrypt
Ledger says the Android-based Atom will carry anti-tamper protections and be sold only on its site, as it probes tampered resold wallets.
Experts blame a build up in leverage for Zcash's drop in value, as well as growing concerns about AI breaking crypto encryption.
Alpenglow is coming next week, slashing Solana finality from 12.8 seconds to a target of about 150 milliseconds—some 85 times faster.
Odds of an October Fed hike have climbed to 29% from 18% a week ago, and analysts see Bitcoin range-bound until the picture clears.
The scammers also ran a fake recovery service, contacting victims weeks later with promises to get their stolen crypto back.
U.Today - IT, AI and Fintech Daily News for You Today
XRP crashes to $1.31 under US macro pressure, but heavy fund inflows suggest a massive institutional buy-the-dip window ahead of November.
Starknet targets a 2027 quantum upgrade by severing ties with Ethereum, sparking an immediate 25% surge in STRK token markets.
The number of XRP holders on Binance is rising little too rapidly which might be a reflection of a bearish dynamic on the market for now.
Arthur Hayes has made a mysterious Ethereum move as he dumps nearly $20 million worth of ETH to an unlabeled wallet address.
SHIB holders get a chance at free coins as Japanese crypto exchange plans giveaway.
Blockonomi
TLDR
- BNY stock rebounds 2.44% premarket after Q3 earnings rise 24% from a year ago.
- BNY reports $5.68 billion in Q3 revenue as fee income and lending gains grow.
- BNY’s diluted earnings per share jump 24% to $2.34, as net income rises 20%.
- BNY custody and administration assets reach $63.4 trillion after 10% growth.
- BNY returns $1.4 billion to shareholders through dividends and stock buybacks.
Bank of New York Mellon (BNY) shares recovered in Thursday’s premarket session after the bank reported stronger third-quarter earnings. The stock advanced 2.44% to $141.00, following Wednesday’s 2.40% decline to a $137.64 close. The results showed 12% annual revenue growth and a 24% increase in diluted earnings per share.
Bank of New York Mellon Corp, BNY
BNY Reports Higher Revenue and Stronger Quarterly Earnings
BNY generated $5.68 billion in third-quarter revenue, compared with $5.08 billion a year earlier. Fee revenue increased 12% to $4.08 billion as new business and client activity supported growth. Meanwhile, net interest income rose 15% to $1.42 billion on higher reinvestment yields and balance sheet expansion.
Net income available to common shareholders increased 20% to $1.61 billion from $1.34 billion. Diluted earnings per share climbed to $2.34 from $1.88, extending the bank’s annual profit growth. However, earnings per share declined 4% from the second quarter, when BNY reported $2.45.
BNY reported a 38.5% pretax operating margin, compared with 36.4% a year earlier. Return on common equity improved to 16%, while return on tangible common equity reached 29%. Meanwhile, operating expenses increased 8% to $3.49 billion as revenue-related costs and investments grew.
Asset Servicing and Issuer Services Support BNY Revenue Growth
BNY’s Securities Services business reported $2.82 billion in revenue, up 15% from the prior year. Asset Servicing generated $2.13 billion, reflecting 12% annual growth across the business. Issuer Services contributed $690 million, an increase of 27% from the same quarter last year.
Investment services fees rose 19% to $1.71 billion, supported by both operating divisions. Securities lending revenue increased 48% to $92 million, while foreign exchange revenue climbed 20% to $171 million. However, the Securities Services segment recorded higher costs, with noninterest expense rising 10% to $1.81 billion.
BNY ended September with $63.4 trillion in assets under custody or administration, up 10% annually. Assets under management reached $2.2 trillion, representing 2% growth despite outflows and currency effects. Higher market valuations and fresh client business helped increase custody assets across its operating platforms.
BNY Returns $1.4 Billion to Shareholders as Deposits Grow
The bank returned $1.4 billion to common shareholders during the quarter through dividends and share repurchases. Those distributions included $436 million in dividends and $937 million in share buybacks. Its year-to-date payout ratio reached 86%, reflecting the scale of ongoing capital distributions.
Average deposits totaled $311 billion, a 4% increase from the corresponding quarter of 2025. However, deposits declined 1% from the previous quarter, while average loans climbed 19% annually. The bank also reported a $1 million provision for credit losses during the period.
BNY’s Common Equity Tier 1 ratio stood at 10.9%, down from 11.7% one year earlier. Its Tier 1 leverage ratio declined to 5.7%, while the average liquidity coverage ratio reached 111%. Chief Executive Robin Vince attributed quarterly progress to broader platform growth, client demand, and product development.
The post The Bank of New York Mellon (BNY) Stock: Rebounds as Q3 Revenue Rises 12% and Earnings Jump 24% appeared first on Blockonomi.
TLDR
- TSM stock slides 2.81% to $417.99 despite TSMC’s powerful quarterly earnings.
- TSMC’s quarterly profit jumps 68.7%, while revenue surges 50.9% year over year.
- Advanced chipmaking nodes account for 79% of wafer revenue, led by 3nm chips.
- TSMC projects Q4 revenue of 52.3B–54.3B as demand for leading-edge chips grows.
- TSMC’s 2nm chip process accounts for 8% of wafer sales during its early ramp-up.
Taiwan Semiconductor Manufacturing Company reported strong quarterly earnings, yet its U.S.-listed shares declined ahead of Thursday’s market opening. TSM stock fell 2.81% to $417.99 in pre-market trading, shedding $12.09 after an uneven early session. The decline came alongside a 68.7% profit surge and 50.9% annual revenue growth.
Taiwan Semiconductor Manufacturing Company Limited, TSM
TSMC Third-Quarter Earnings Show Sharp Annual Growth
The Taiwanese chipmaker recorded NT$1,494.24 billion in consolidated revenue for the quarter ending September 30, 2026. Net income reached NT$763.06 billion as demand for advanced manufacturing processes remained strong. Meanwhile, diluted earnings per share reached NT$29.43, equivalent to US$4.60 for each American depositary receipt unit.
Compared with the same period last year, revenue climbed 50.9%, while net income increased 68.7%. Diluted earnings per share also grew 68.7%, matching the increase in the company’s reported profit. On a sequential basis, revenue rose 17.6%, while net income advanced 8.0% from the second quarter.
TSMC reported third-quarter revenue of US$46.72 billion when measured in U.S. dollars. That figure marked 41.2% annual growth and a 16.2% increase from the previous quarter. Additionally, the company posted a 66.4% gross margin, 58.7% operating margin, and 51.1% net profit margin.
Advanced Chip Technologies Account for Most Wafer Revenue
TSMC’s advanced production processes generated most of its wafer revenue during the third quarter. Chips manufactured using 3-nanometer technology contributed 33%, while 5-nanometer processes added another 28%. Meanwhile, the newer 2-nanometer process accounted for 8% of total wafer revenue.
The company’s 7-nanometer technology generated 10% of wafer revenue during the reporting period. Together, processes measuring 7 nanometers or smaller represented 79% of total wafer revenue. This concentration reflected TSMC’s growing reliance on advanced nodes rather than older manufacturing technologies.
TSMC produces chips for other semiconductor companies instead of primarily selling its own branded processors. Its manufacturing services support products ranging from smartphones to data centers and artificial intelligence systems. Consequently, orders for advanced computing hardware play an important role in the company’s production mix.
TSMC Projects Higher Fourth-Quarter Revenue
TSMC expects fourth-quarter revenue between US52.3billionandUS54.3 billion, above its third-quarter dollar-denominated sales. The company based its margin forecasts on an assumed exchange rate of NT$31.8 per U.S. dollar. Management projects gross margins between 65% and 67% during the final quarter of 2026.
The chipmaker also expects its fourth-quarter operating margin to range between 56.5% and 58.5%. Finance chief Wendell Huang attributed the company’s third-quarter performance to strong demand for leading-edge manufacturing technology. He expects that demand to continue as TSMC accelerates production of its 2-nanometer chips.
Management’s outlook places advanced manufacturing processes at the center of the company’s year-end production plans. Its guidance also pairs higher sales expectations with gross and operating margins near third-quarter levels. TSM shares declined before regular U.S. trading despite the company’s strong financial results and higher revenue forecast.
The post TSMC (TSM) Stock: Slides 2.81% Despite 68.7% Profit Surge and 50.9% Revenue Growth appeared first on Blockonomi.
Bitcoin is often the first asset people name when they ask what a small sum could become. The data from the past decade shows a very large gain for buyers who held on. It also shows price drops that tested nearly every holder.
This article draws on figures from Bitbo, The Motley Fool, CNBC Make It, BitradeX and Pocket Option. Every number comes from those pages unless the text says it was calculated. Where the sources disagree, the article says so.
The sections below cover the current price, the 10-year result, returns by buy date, risk, and the math behind the next 10 years. The article is for information only and is not financial advice.
Where Bitcoin Trades Today
Bitbo lists the Bitcoin price at $81,005 on October 15, 2026. The Motley Fool showed $80,944 on the same day, down 3.3%, or $2,753.65, from the day before. The small gap likely comes from the time each site took its price.
The Motley Fool puts Bitcoin’s market value at about $1.6 trillion. The day’s trading range ran from $80,444 to $83,005, and volume was 40.4 billion. Over 52 weeks, the price has ranged from $57,945.16 to $116,041.09.
Using Bitbo’s price, Bitcoin sits about 39.8% above its 52-week low. It is also about 30.2% below its 52-week high. These two percentages were calculated for this article.
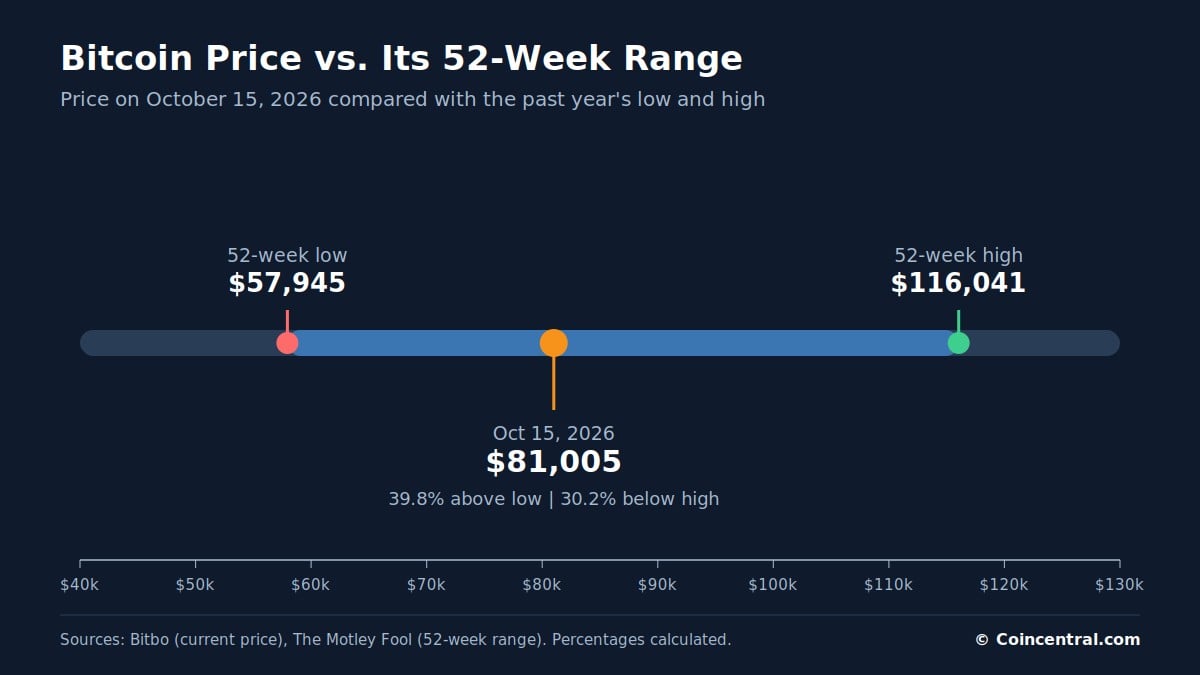
The high is roughly double the low, which shows how wide the range has been in one year. A Motley Fool headline from October 14, 2026 says Bitcoin just posted its best third quarter since 2017. The article text was not part of the material reviewed, so no further detail is given.
BitradeX reports that Bitcoin traded above $120,000 in October 2025. It says the price then fell below $60,000 by early June 2026. That peak is above the Motley Fool’s 52-week high of $116,041.09.
The sources do not explain the gap. The 52-week window starts in mid-October 2025, so an early October peak may fall just outside it. Readers who need exact highs should check a live price feed.
Table 1: Bitcoin price snapshot, October 2026
| Metric | Value | Source |
|---|---|---|
| Price, October 15, 2026 | $81,005 | Bitbo |
| Price, same day | $80,944 | The Motley Fool |
| One-day change | -3.3% (-$2,753.65) | The Motley Fool |
| Market value | $1.6 trillion | The Motley Fool |
| Day’s range | $80,444 to $83,005 | The Motley Fool |
| Volume | 40.4 billion | The Motley Fool |
| 52-week low | $57,945.16 | The Motley Fool |
| 52-week high | $116,041.09 | The Motley Fool |
| Price in October 2025 | Above $120,000 | BitradeX |
| Price in early June 2026 | Below $60,000 | BitradeX |
The 10-Year Result for a $1,000 Investment
The Motley Fool looked at a $1,000 purchase made on September 3, 2016. By its math, that sum would be worth about $126,810 today. The article says $1,000 bought about 1.7 Bitcoin at the time.
That is a gain of about 12,581%, which works out to an annual rate near 62%. The Motley Fool’s key points list the gain as 12,381%, but the text and the math support 12,581%. The figures leave out trading fees and taxes.
The Motley Fool compared that rate with other assets using YCharts data. Bitcoin’s 62% annual rate was well above the Nasdaq Composite at about 18%, the S&P 500 at about 14%, and gold at about 13%.
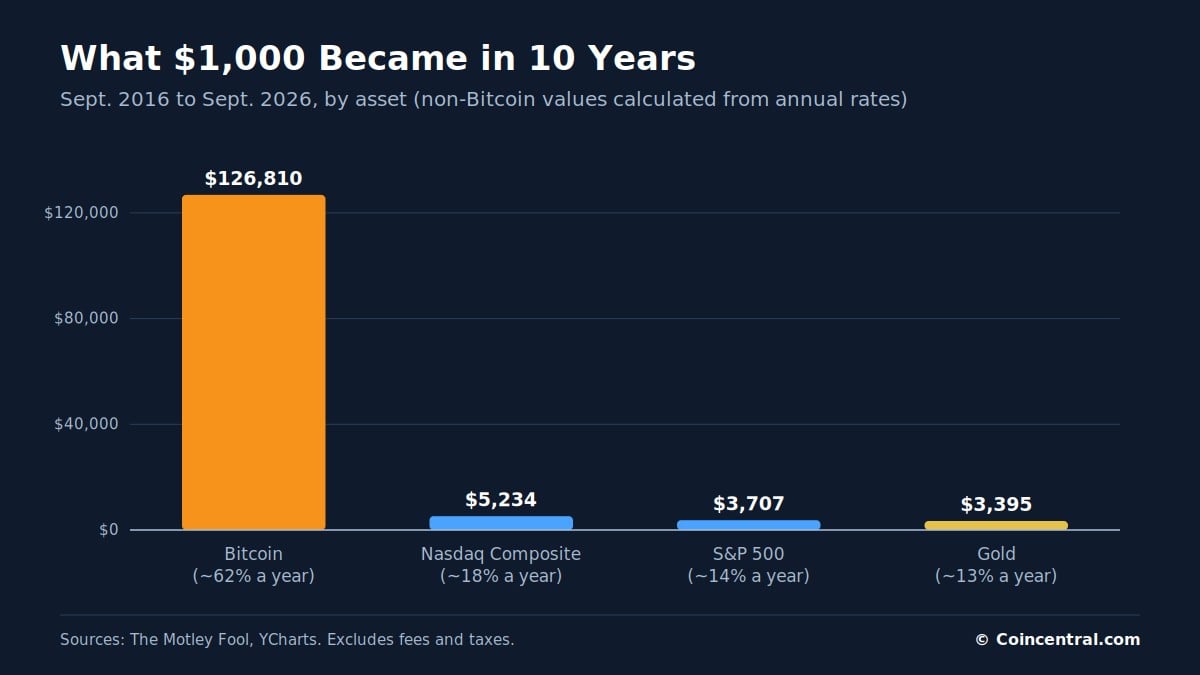
Applying those yearly rates for 10 years, $1,000 would grow to about $5,234 in the Nasdaq, $3,707 in the S&P 500, and $3,395 in gold. These figures were calculated for this article. Bitcoin’s result is about 24 times the Nasdaq figure.
Table 2: Annual returns and 10-year value of $1,000, September 2016 to September 2026
| Asset | Annual return | Value of $1,000 |
|---|---|---|
| Bitcoin | About 62% | About $126,810 |
| Nasdaq Composite | About 18% | About $5,234 (calculated) |
| S&P 500 | About 14% | About $3,707 (calculated) |
| Gold | About 13% | About $3,395 (calculated) |
Pocket Option gives a shorter-term view. It lists five-year returns of about 700% for Bitcoin, 70% for the S&P 500 and 30% for gold. It rates the risk of each as high, medium and low.
Table 3: Five-year returns and risk, as listed by Pocket Option
| Asset | Return (5 years) | Risk | Liquidity |
|---|---|---|---|
| Bitcoin | About 700% | High | High |
| S&P 500 | About 70% | Medium | High |
| Gold | About 30% | Low | High |
The Motley Fool author adds a warning. The same article says it is highly unlikely that future returns will come close to those of the past. The author still sees Bitcoin as a fit for a small part of a balanced portfolio.
Returns by Purchase Date
The date of purchase changes the result a great deal. Bitbo’s calculator shows what $1,000 invested at different dates would be worth at today’s price of $81,005. It also reports an all-time compound annual growth rate of 191.4%.
A $1,000 purchase in January 2015 would be worth $257,199, a gain of 25,619.9%. A purchase in January 2017 would be worth $81,151. A purchase in January 2013 would be worth about $6.1 million.
Bitbo’s headline example goes back further. $100 invested in July 2010 would be worth $137.3 million, a return of 137,296,289.8%. Its table shows the same purchase as $1.4 billion for $1,000, which is the same result scaled to a larger amount.
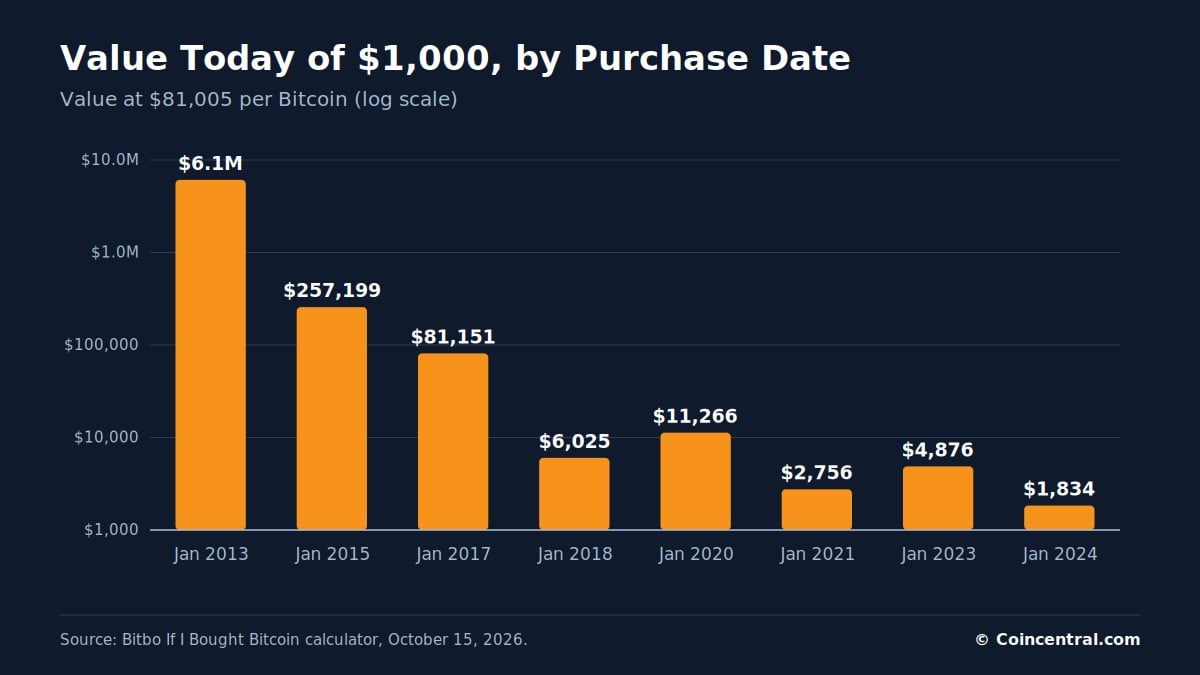
Later buyers saw smaller gains. A January 2018 purchase at $13,444.88 is worth $6,025, a gain of 502.5%. A January 2021 purchase at $29,388.94 is worth $2,756, a gain of 175.6%.
The smallest gain in Bitbo’s table belongs to a January 2024 buyer. That $1,000 purchase at $44,161.95 is now worth $1,834, a gain of 83.4%. Every start date in the table shows a profit at today’s price.
Table 4: Value today of $1,000 invested on each date (Bitbo)
| Date | BTC price | BTC bought | Value today | Return |
|---|---|---|---|---|
| Jul 2010 | $0.06 | 16,949.1525 | $1.4B | +137,296,289.8% |
| Jan 2013 | $13.22 | 75.6430 | $6.1M | +612,644.9% |
| Jan 2015 | $314.95 | 3.1751 | $257,199 | +25,619.9% |
| Jan 2017 | $998.20 | 1.0018 | $81,151 | +8,015.1% |
| Jan 2018 | $13,444.88 | 0.0744 | $6,025 | +502.5% |
| Jan 2020 | $7,189.94 | 0.1391 | $11,266 | +1,026.6% |
| Jan 2021 | $29,388.94 | 0.0340 | $2,756 | +175.6% |
| Jan 2023 | $16,613.87 | 0.0602 | $4,876 | +387.6% |
| Jan 2024 | $44,161.95 | 0.0226 | $1,834 | +83.4% |
The table also shows how fast the price moved between dates. The January 2018 price was about 13.5 times the January 2017 price of $998.20. This ratio was calculated from Bitbo’s figures.
These are January snapshots. They do not show the drops that happened between those dates, which the later section on price swings covers.
One, Five and Ten Year Windows
CNBC Make It ran a similar test in February 2024. It used a Bitcoin price of $51,793 on February 14. At that price, $1,000 invested a year earlier would have grown 133% to about $2,331.
A five-year hold would have grown 1,352% to about $14,524. A 10-year hold would have grown 7,644% to about $77,443. Someone who bought on January 11, 2024, the day spot Bitcoin ETFs launched, would have had $1,113.
CNBC compared these results with the S&P 500. The index was up about 21% over 12 months, about 82% since 2019 and about 172% since 2014. On $1,000, that equals about $1,210, $1,820 and $2,720, using values calculated for this article.
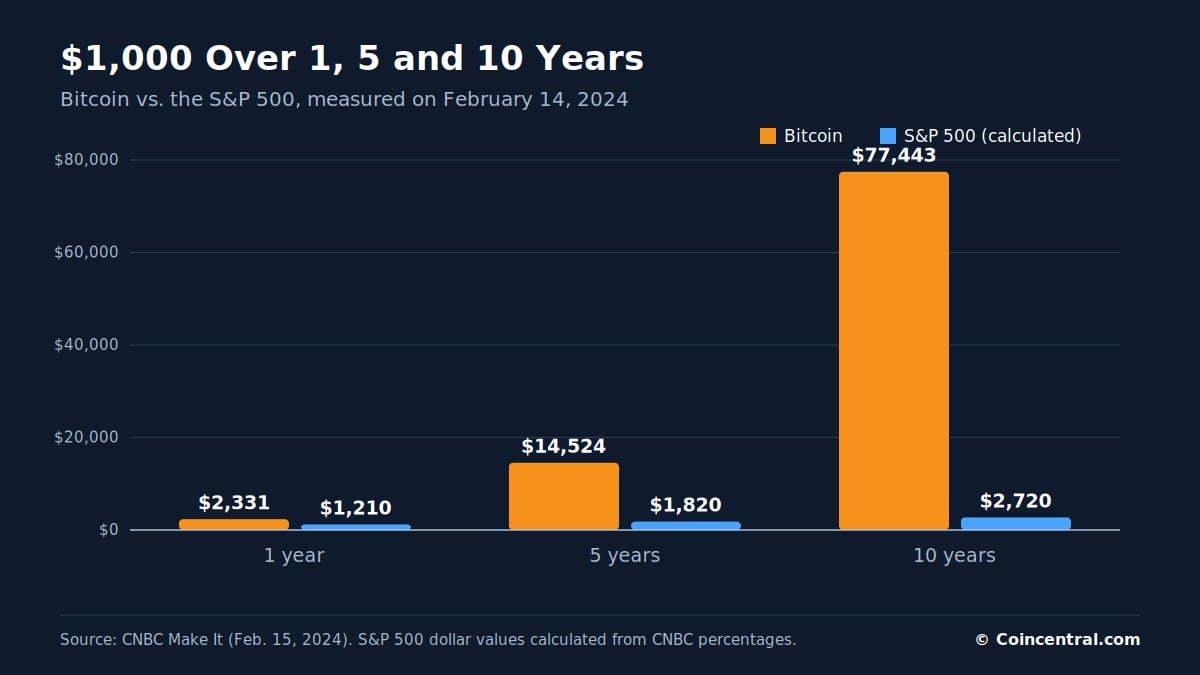
Table 5: Bitcoin and the S&P 500 over three windows, February 14, 2024
| Window | Bitcoin gain | Bitcoin value | S&P 500 gain | S&P 500 value |
|---|---|---|---|---|
| Since ETF launch (Jan 11, 2024) | +11.3% | $1,113 | Not given | Not given |
| 1 year | +133% | $2,331 | +21% | $1,210 |
| 5 years | +1,352% | $14,524 | +82% | $1,820 |
| 10 years | +7,644% | $77,443 | +172% | $2,720 |
The 10-year figure has changed with time and with the start date. CNBC’s 10-year value was $77,443 in February 2024, and the Motley Fool’s was $126,810 in September 2026, about 64% higher. The two windows start on different dates, so they are not an exact match.
CNBC also gave context for the 2024 price. Bitcoin passed $52,000 for the first time since November 2021. In November 2022 it traded at less than a third of that level, after losing more than 75% of its price following the collapse of FTX.
CNBC said the rise was largely tied to the ETF launch. The approval made it easier to buy Bitcoin on regulated stock exchanges. The total value of all Bitcoin passed $1 trillion for the first time since 2021.
Price Swings and Drawdowns
Bitcoin’s gains came with sharp falls. Using Bitbo’s January prices, the price dropped from $13,444.88 in January 2018 to $7,189.94 in January 2020, a fall of about 46.5%. From January 2021 to January 2023 it fell from $29,388.94 to $16,613.87, or about 43.5%.
The price then rose about 166% to $44,161.95 by January 2024. These are January snapshots, so they understate the full peak-to-low drops. These percentages were calculated for this article.
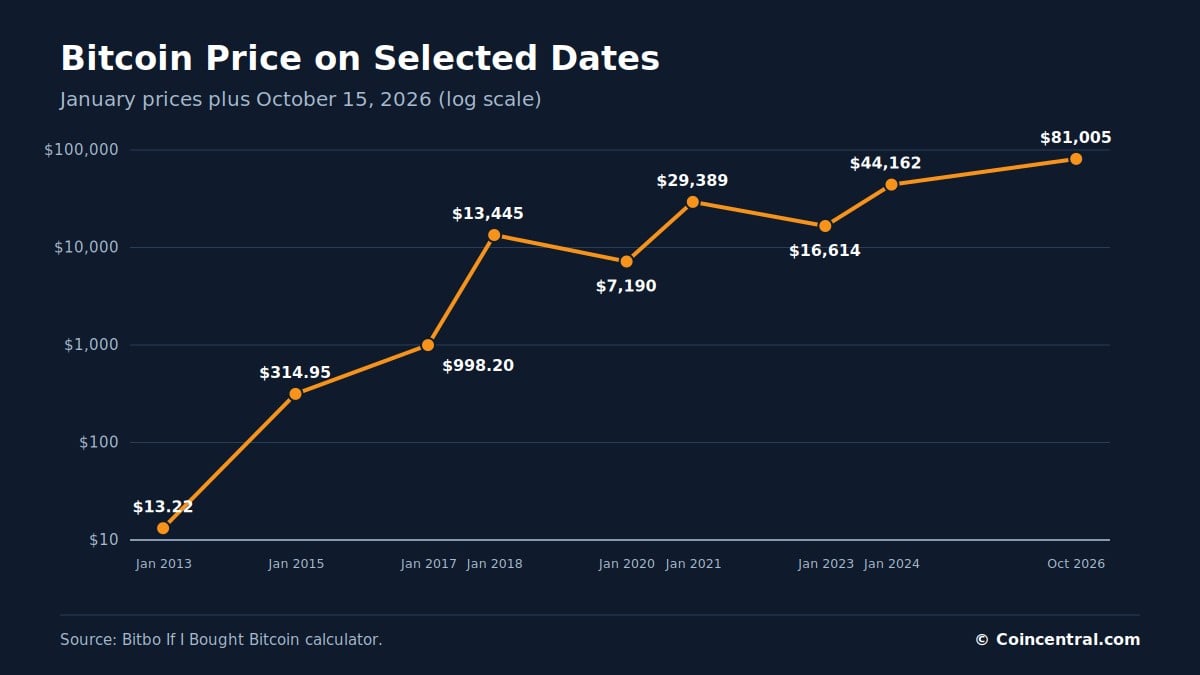
Other sources describe deeper falls. CNBC says Bitcoin peaked near $69,000 in November 2021, then lost more than 75% after FTX failed. Pocket Option lists about $69,000 for 2021 and about $16,000 for 2022.
The Motley Fool says Bitcoin had drawdowns of more than 70% over the decade, and that most investors sold during them. BitradeX says the price fell from above $120,000 to below $60,000 between October 2025 and June 2026. That is a drop of at least half.
Table 6: Selected price events
| Date | Event | Source |
|---|---|---|
| Nov 2021 | Price peaks near $69,000 | CNBC Make It |
| Nov 2022 | Price falls more than 75% after FTX collapse | CNBC Make It |
| 2022 | Price near $16,000 | Pocket Option |
| Jan 11, 2024 | Spot Bitcoin ETFs launch | CNBC Make It |
| Oct 2025 | Price above $120,000 | BitradeX |
| Early Jun 2026 | Price below $60,000 | BitradeX |
| Oct 15, 2026 | Price at $81,005 | Bitbo |
Table 7: January-to-January changes (calculated from Bitbo prices)
| Period | Start price | End price | Change |
|---|---|---|---|
| Jan 2018 to Jan 2020 | $13,444.88 | $7,189.94 | -46.5% |
| Jan 2021 to Jan 2023 | $29,388.94 | $16,613.87 | -43.5% |
| Jan 2023 to Jan 2024 | $16,613.87 | $44,161.95 | +165.8% |
Pocket Option names four drivers of volatility. They are market mood and media, economic data such as inflation and interest rates, crypto rules and technology, and large holder moves and trading volume. It also lists halvings in 2012, 2016, 2020 and 2024, China’s mining ban in 2021 and the 2024 spot ETF approvals as past events.
The sources do not always agree on prices. Pocket Option lists Bitcoin at about $100 in 2013, while Bitbo shows $13.22 in January 2013. Pocket Option shows less than $0.01 for 2010, while Bitbo shows $0.06 in July 2010.
Pocket Option also says Bitcoin traded near $65,000 in June 2025. The page was last edited on August 7, 2025, so its price levels are dated. Readers should not use its $65,000 base for current math.
Entry Price and the Math Behind $1,000
BitradeX offers a simple formula. Future value equals $1,000 divided by your entry price, multiplied by Bitcoin’s price in 10 years. The percentage move matters more than the headline price.
At today’s Bitbo price of $81,005, $1,000 buys about 0.0123 BTC. This was calculated for this article. If Bitcoin doubles from that level, the position is worth about $2,000 before fees and taxes.
The next table shows BitradeX’s sensitivity check. A 75% fall leaves $250 and a 50% fall leaves $500. A fivefold rise gives $5,000 and a tenfold rise gives $10,000.
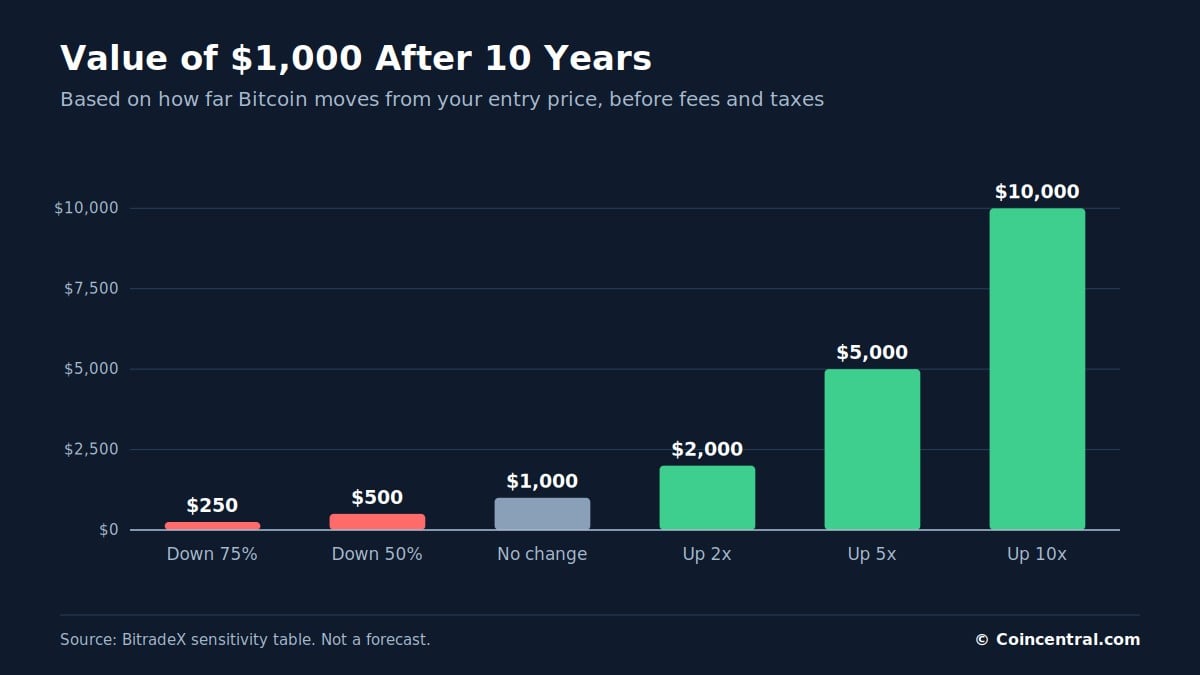
Table 8: Value of a $1,000 purchase by price change (BitradeX)
| Price in 10 years vs. entry | Approximate value |
|---|---|
| Down 75% | $250 |
| Down 50% | $500 |
| No change | $1,000 |
| Up 2x | $2,000 |
| Up 5x | $5,000 |
| Up 10x | $10,000 |
Entry price changes the result for any future price, and BitradeX tests three entries: $50,000, $100,000 and $150,000. A buyer at $50,000 who sells at $250,000 gets $5,000. A buyer at $150,000 who sells at the same price gets $1,667.
Table 9: Value of $1,000 by entry price and exit price (BitradeX)
| Entry price | BTC bought | Exit $25,000 | Exit $100,000 | Exit $250,000 | Exit $500,000 | Exit $1,000,000 |
|---|---|---|---|---|---|---|
| $50,000 | 0.020000 | $500 | $2,000 | $5,000 | $10,000 | $20,000 |
| $100,000 | 0.010000 | $250 | $1,000 | $2,500 | $5,000 | $10,000 |
| $150,000 | 0.006667 | $167 | $667 | $1,667 | $3,333 | $6,667 |
Costs also change the final number. BitradeX lists trading fees and spreads, taxes, custody mistakes, panic selling and overtrading. Each can shrink a gain or turn a long hold into a short-term loss.
Table 10: Factors that change the final value (BitradeX)
| Factor | Why it matters |
|---|---|
| Trading fees and spreads | They reduce the Bitcoin bought or the cash value when selling. |
| Taxes | Treatment depends on the country, holding period and type of sale. |
| Custody mistakes | Lost passwords or weak security can lock up a gain. |
| Panic selling | Selling in a deep drop turns a 10-year plan into a short-term result. |
| Overtrading | Frequent trades add costs that a buy-and-hold table ignores. |
BitradeX says a 10-year holder may face several drops of 30%, 50% or more. It also says the money should not be needed for rent, debt or emergencies. Those points are about behavior, not math.
Forecasts and How to Read Them
Pocket Option published price scenarios based on a $65,000 starting price. For 2025, it showed $40,000, $75,000, $100,000 and $150,000, worth about $615, $1,154, $1,538 and $2,308 per $1,000. For 2030, it showed $150,000, $250,000 and $500,000, worth about $2,308, $3,846 and $7,692.
Bitcoin now trades above that $65,000 base, so the dollar values are out of date. Using Bitbo’s price of $81,005, a $150,000 price would turn $1,000 into about $1,852, $250,000 into $3,086, and $500,000 into $6,172. These were calculated for this article.
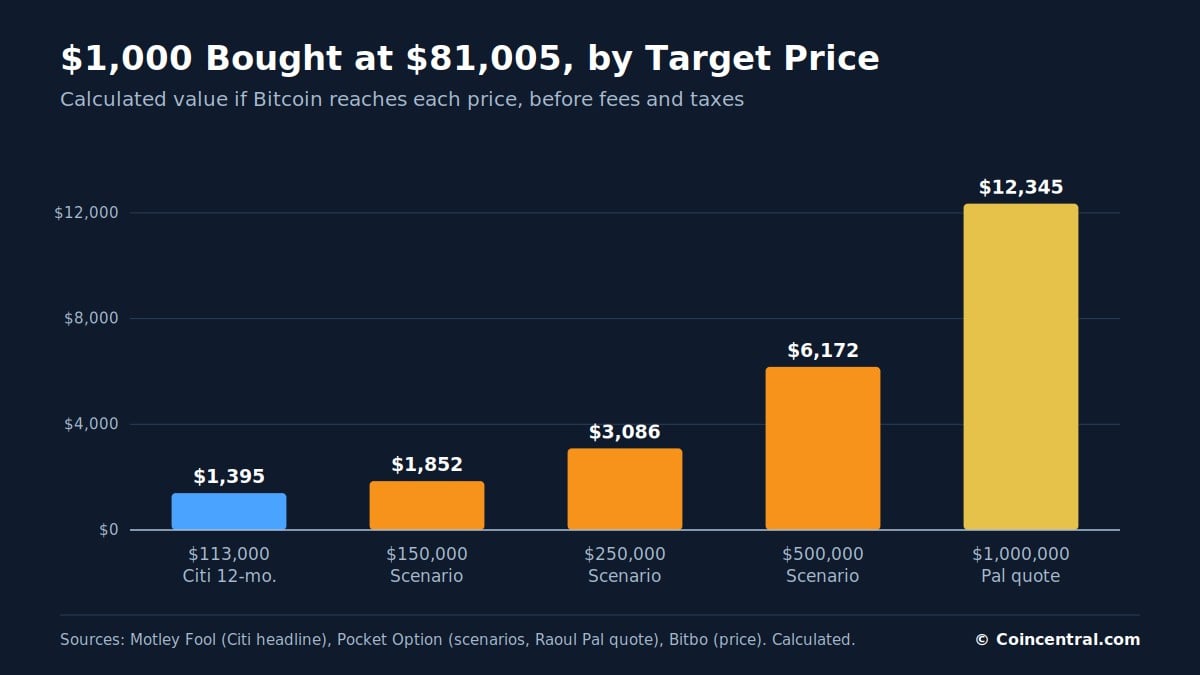
Table 11: Value of $1,000 bought at $81,005, by target price (calculated)
| Target price | Value of $1,000 | Where the target comes from |
|---|---|---|
| $113,000 | About $1,395 | Citigroup 12-month target, per a Motley Fool headline |
| $150,000 | About $1,852 | Pocket Option 2030 scenario |
| $250,000 | About $3,086 | Pocket Option 2030 scenario |
| $500,000 | About $6,172 | Pocket Option 2030 scenario |
| $1,000,000 | About $12,345 | Raoul Pal quote, via Pocket Option |
Pocket Option also quotes macro investor Raoul Pal, who said a $1 million price by 2030 is not unrealistic if crypto reaches mass adoption. At $1 million, a $1,000 purchase at today’s price would be worth about $12,345. The page gives no model behind the quote.
A Motley Fool headline from October 15, 2026 says Citigroup raised its 12-month Bitcoin price target to $113,000. That target would turn $1,000 at today’s price into about $1,395. Only the headline was available for this article.
Planners urge limits. CFP Chris Diodato told CNBC it makes sense for most people to hold 1% or 2% of a portfolio in crypto. He said he is hesitant to suggest more because Bitcoin is volatile and produces no cash flow.
BitradeX says no AI tool can know Bitcoin’s price in 10 years. Its advice is to write down the entry price, the amount bought, the reason for holding and the most you can afford to lose. The Motley Fool author also says past returns are unlikely to repeat.
Readers should note who published these sources. Pocket Option and BitradeX are trading platforms, and their pages promote their own services. The Motley Fool says it holds positions in and recommends Bitcoin.
In short, $1,000 invested in Bitcoin on September 3, 2016 grew to about $126,810 by the Motley Fool’s math. Buyers in later years saw smaller gains, and the data shows drops of 43% to more than 75%. No source can say what the next 10 years will bring.
This article is for information only. It is not financial, legal or tax advice.
Sources
- Bitbo: If I Bought Bitcoin Calculator
- Pocket Option: If I Invest $1000 in Bitcoin Today, How Much Is It Worth 2025?
- BitradeX: What $1,000 in Bitcoin Could Be Worth in 10 Years
- The Motley Fool: If You’d Invested $1,000 in Bitcoin 10 Years Ago, Here’s How Much You’d Have Today
- CNBC Make It: Here’s how much money you’d have if you invested $1,000 in bitcoin 10 years ago
The post How Much Could $1,000 Invested in Bitcoin Be Worth in 10 Years? appeared first on Blockonomi.
Bitcoin has a market value of more than $2 trillion, yet some experts still ask what would happen if it fell to nothing. The question sounds extreme, but it helps show how closely Bitcoin now connects to the wider financial system.
This article looks at the numbers behind that question. It draws on four published sources that cover market size, expert opinions, and step-by-step crash scenarios.
A crash to zero would not erase the Bitcoin network. It would mean that the price of each coin drops to nothing while the software keeps running. Keeping that difference in mind makes the rest of the numbers easier to read.
How Big Is Bitcoin Today?
Bitcoin had a market value of $2.31 trillion in August 2025, according to GOBankingRates. That is the total value of every coin in circulation at the price on that day.
The coins are no longer held only by individual traders. The same report says Bitcoin sits on the balance sheets of asset managers, institutions, and even national treasuries. Millions of people hold it directly, and others have exposure through exchange-traded funds (ETFs), futures, and retirement accounts.
Size matters because a larger market has more people tied to it. A fall of a few percent affects a small group. A fall to zero would reach pension funds, asset managers, and everyday savers.
The crypto market as a whole has also grown fast. In 2021, The Economist reported that all cryptocurrencies together had a market value of $1.6 trillion, up from $330 billion a year earlier. The magazine noted that this was roughly equal to the nominal GDP of Canada.
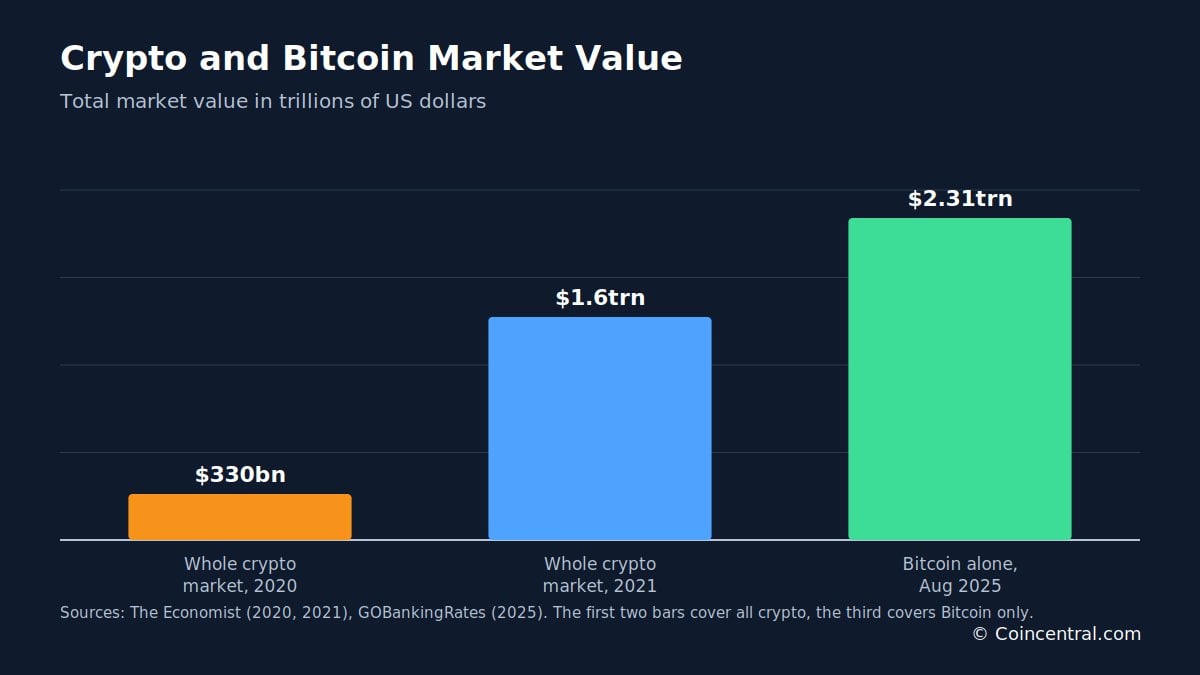
The table below puts the main size figures side by side. Note that the first two rows cover all crypto, while the last row covers Bitcoin alone.
Table 1: Market value figures from the source articles.
| Date | What was measured | Value | Source |
|---|---|---|---|
| 2020 | Whole crypto market | $330 billion | The Economist |
| Aug 2021 | Whole crypto market | $1.6 trillion | The Economist |
| Aug 2025 | Bitcoin only | $2.31 trillion | GOBankingRates |
| Aug 2025 | Bitcoin held by the world’s largest asset manager | $90 billion | GOBankingRates |
The jump from $330 billion to $1.6 trillion in one year is a gain of almost five times. Bitcoin alone has since passed the 2021 value of the entire crypto market.
These numbers do not predict a crash. They only show how much value would be at stake if one happened.
GOBankingRates also notes that Bitcoin now trades alongside products such as ETFs and futures. Each product adds another way for losses to spread, so analysts treat Bitcoin as part of the wider market and not a niche asset.
How Fast the Crypto Market Has Grown
The Economist described the growth of the crypto universe in 2021 as a thing of wonder. The numbers support that view.
A year earlier, CoinMarketCap listed about 6,000 currencies. By August 2021, the site listed 11,145. That is an increase of roughly 86% in twelve months.
The number of people involved grew as well. More than 100 million unique digital wallets held crypto in 2021, about three times the number in 2018. That puts the 2018 figure at around 33 million wallets.
One wallet does not always mean one person, so these counts are an estimate of reach rather than a head count. Still, they show how far crypto had spread beyond a small group of early users.
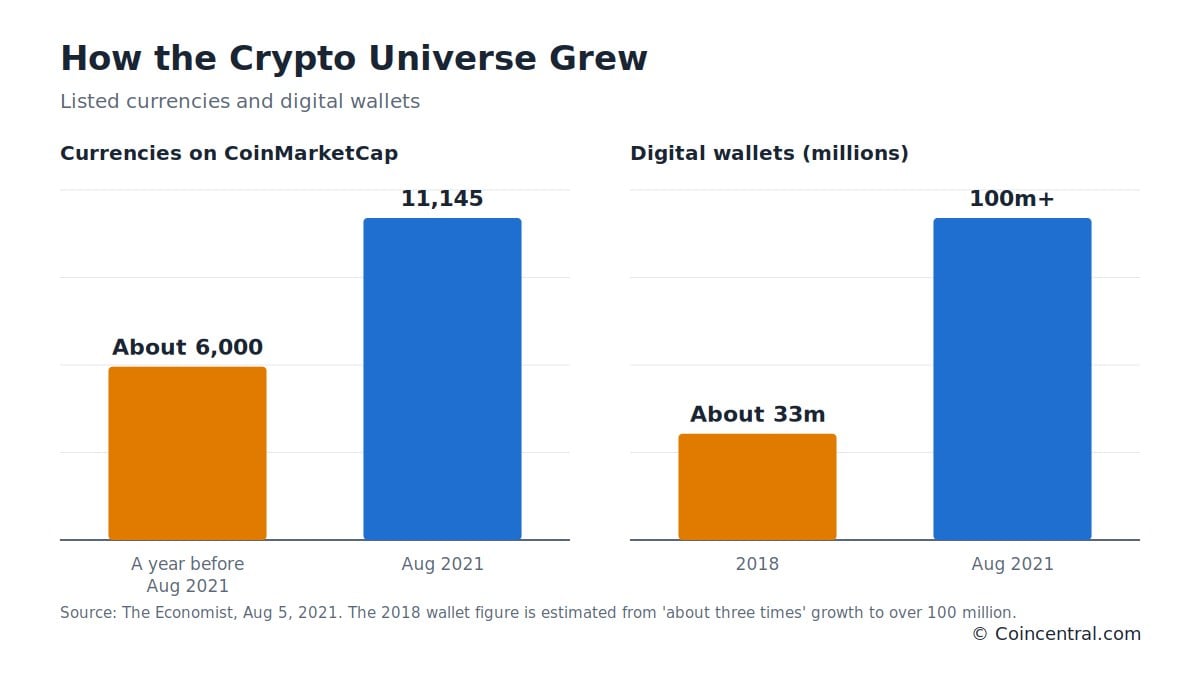
Growth in the number of coins does not mean growth in quality. CoinSwitch points out that many cryptocurrencies have become inactive or lost nearly all value over time. The site says it is hard to give an exact count of how many have reached zero.
This is a useful point for the Bitcoin debate. A crypto asset going to zero is not a new idea, since smaller coins have faded before. The open question is whether the largest coin could follow the same path.
Table 2: Growth of the crypto market, based on The Economist (2021). Percent changes are calculated.
| Measure | Earlier figure | Aug 2021 figure | Change |
|---|---|---|---|
| Listed currencies | About 6,000 | 11,145 | Up about 86% |
| Digital wallets | About 33 million (2018, estimated) | More than 100 million | About three times higher |
| Total market value | $330 billion | $1.6 trillion | Up almost five times |
Rapid growth can also bring rapid shifts in mood. When many new buyers arrive in a short time, prices can depend heavily on confidence.
If that confidence fades, the same buyers can leave just as fast. That is the kind of pattern behind the crash scenarios discussed later.
CoinSwitch lists scarcity as one factor in value. Some coins have a limited supply, which can lift prices as demand rises, while coins with an unlimited supply may lose value over time. Market capitalization, the total value of all coins in circulation, is used as a sign of popularity and demand.
Can Bitcoin Really Fall to Zero?
Changelly says a fall to zero is possible but extremely unlikely. A complete collapse would mean buyers disappear and bids thin out until the price stalls near nothing.
The article also draws a clear line between a price crash and a network shutdown. The network could still process blocks and confirm transactions even if each coin had no market value. People who hold their own private keys would still control their coins, though the coins might not be worth anything.
Some of the doubt about Bitcoin comes from finance theory. Nobel laureate Eugene Fama, known for the efficient-markets theory, argues that Bitcoin has no intrinsic value because it pays no interest, pays no dividends, and has no backing.
In Fama’s view, an efficient market should push the price toward zero over time. Changelly notes that some secondary reports say he expects this within a decade. The article does not confirm that timeline directly.
Critics reply that his argument overlooks Bitcoin’s technical role and its place in global finance. Whether or not the market agrees with Fama, his logic shows why a zero outcome is more than a thought game.
The other side of the debate points to structure. Changelly lists four reasons a total collapse is hard to imagine.
Fama calls Bitcoin a speculative bubble asset. Changelly adds that if enough investors reviewed the same data and decided Bitcoin was worthless, the drop could come very quickly.
Table 3: Reasons a collapse to zero is considered unlikely (Changelly).
| Factor | Why it makes zero less likely |
|---|---|
| Deep liquidity | Trading runs 24/7 on major exchanges, and millions of holders worldwide would need to give up at once. |
| Institutional demand | Asset managers, ETFs, and balance sheets add steady buying, though they also add linked risks. |
| Decentralization | No single entity controls most coins, so coordinated selling or manipulation is harder. |
| Proof-of-work security | The difficulty adjustment lets mining continue even when prices swing. |
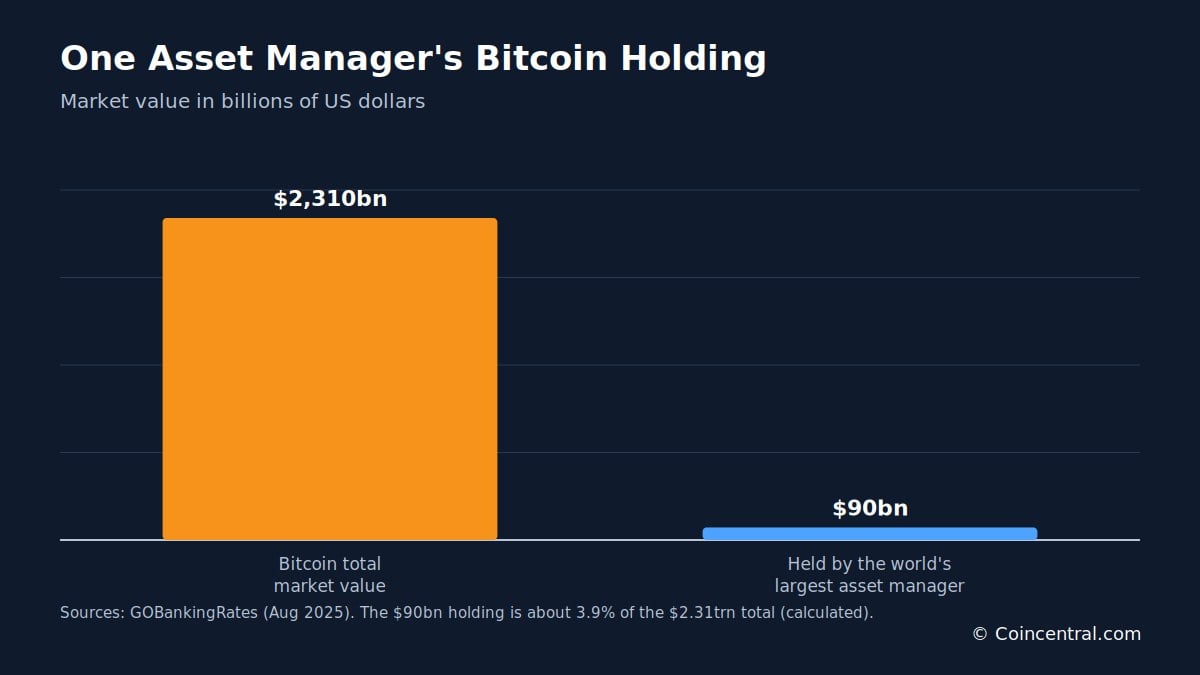
Institutional exposure is a double-edged point. GOBankingRates reports that the world’s largest asset manager holds $90 billion of Bitcoin. That equals about 3.9% of the total market value of $2.31 trillion.
The holding gives the market a large, long-term buyer. It also means a collapse would hit that firm and its clients.
Changelly adds that Bitcoin’s value rests on three things: scarcity, utility, and demand. Supply is fixed at 21 million coins, the network allows censorship-resistant and cross-border payments, and ETFs and custodians have brought steady demand from pension funds, asset managers, and family offices.
Five Routes to Zero and the Mining Math
Changelly lists five ways Bitcoin could lose all of its market value. None is described as likely, but each shows a weak point.
CoinSwitch gives a wider list of forces that move crypto prices. These include supply and demand, investor sentiment, regulation, technology changes, inflation, and interest rates. It also names node count, exchange news, production cost, and scarcity.
The five routes below combine the main themes in the sources.
CoinSwitch also says a coin can fall if its production cost, including mining, is higher than its market value. This links the mining route to the price route, since each one can feed the other.
Table 4: The five routes to zero described by Changelly.
| Route | What it means |
|---|---|
| Loss of public trust | Falling prices cause more selling and thinner liquidity. This feedback loop is called reflexivity. |
| Protocol failure or quantum attack | A break in the network rules, or in its signature system, could allow theft across the network. |
| Global regulatory ban | Limits on banking access, harsh taxes, or a mining ban could cut both retail and institutional demand. |
| Exchange meltdown | Exchanges may halt withdrawals, and prices on some platforms could briefly print near zero. |
| Mining collapse | If mining pays too little, miners switch off rigs, and network security weakens. |
The mining route has the most measurable details. Mining profit is tracked with a figure called hashprice. If prices fall fast and hashprice drops with them, miners may stop work.
The hash rate is the total computing power that secures the network. When it falls, blocks arrive more slowly than the usual 10 minutes.
Bitcoin adjusts for this every 2,016 blocks, which is about every two weeks. Changelly stresses that the adjustment only happens after those blocks are found, so a slow network must wait for it.
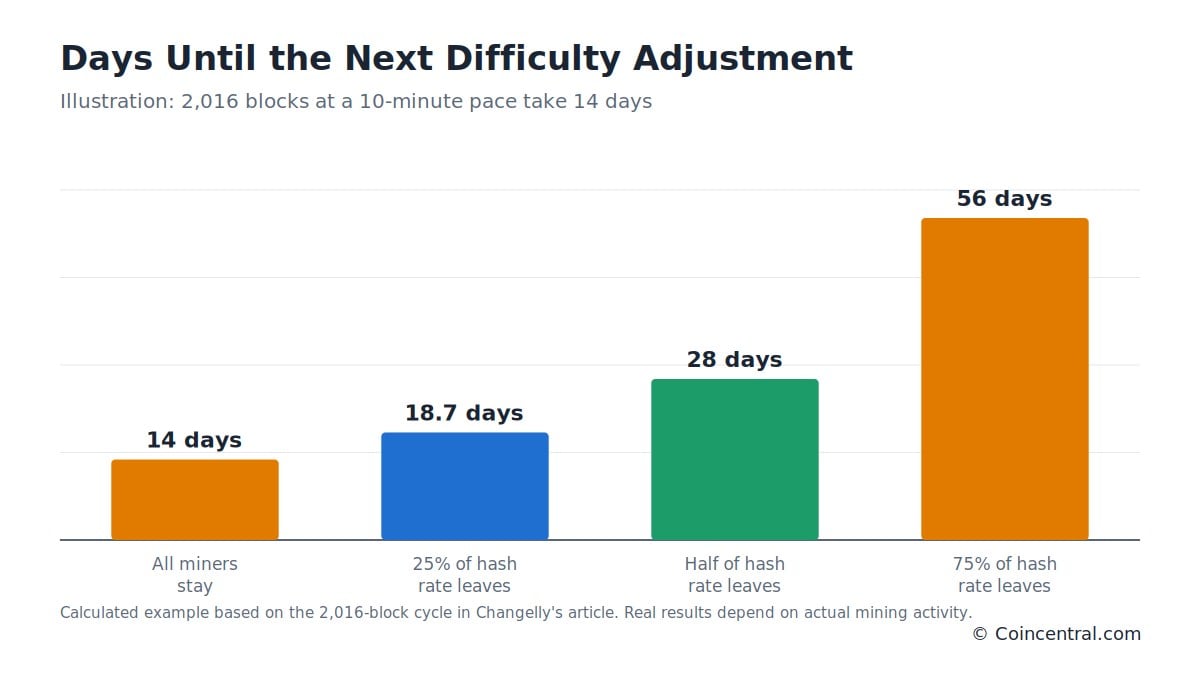
The chart shows a simple calculation. If a quarter of the hash rate leaves, the next cycle takes about 18.7 days instead of 14. If half leaves, it takes 28 days, and if three quarters leave, it takes 56 days.
These figures are an illustration, not a forecast. Changelly also warns that a weak hash rate could open the door to 51% attacks, where bad actors rewrite recent transactions or double-spend coins.
The Five Phases of a Collapse
Changelly says a complete collapse would likely unfold in five overlapping phases. They may play out differently across platforms and regions.
Phase 1 is the price plunge. Order books widen, which means the gap between the highest bid and the lowest ask grows, and even small trades can move the price a lot.
Stablecoins may also wobble. In 2022, USDT dipped to $0.92 before it recovered, a drop of about 8% from its $1 peg.
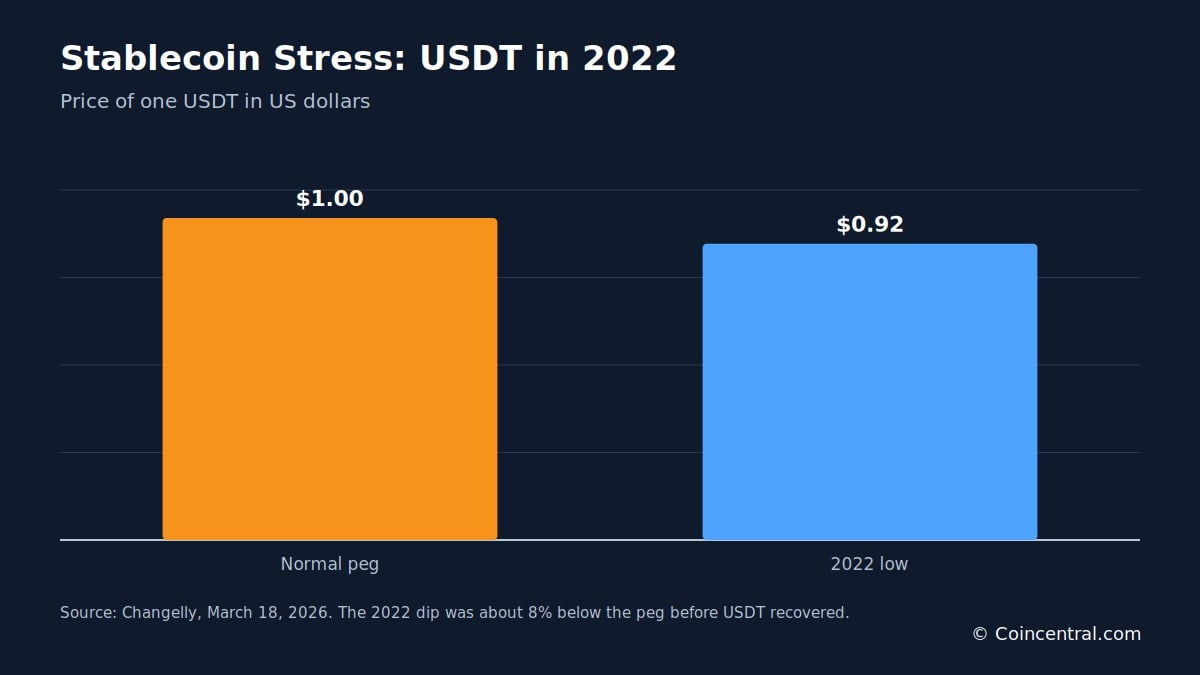
Leverage speeds things up. As prices fall, margin calls and forced sales trigger more selling, which pushes prices lower still.
Phase 2 brings withdrawal suspensions and frozen custody. Centralized exchanges may stop withdrawals, and asset managers, brokers, and lenders may freeze assets by choice or by court order.
People who hold coins on exchanges would feel this most. Those with their own wallets keep control no matter what the market does. Changelly sums up the lesson as not your keys, not your coins.
Changelly says these steps may overlap. A freeze at an exchange can feed more selling, and more selling can feed more congestion on the network.
Phase 3 is network congestion. With many people trying to move coins at once, transactions pile up in the mempool, and users bid higher fees.
Changelly says fees could climb from cents to $50 or more. Confirmation times would also become hard to predict.
Phase 4 is the mining stress described above. Miners turn off rigs, the hash rate drops, and the difficulty retarget arrives only after 2,016 blocks.
Phase 5 reaches traditional finance. Spot Bitcoin ETFs depend on a creation and redemption process to keep their prices in line with Bitcoin. A crash could disrupt that process, push ETF shares to steep discounts or premiums, and in extreme cases lead to trading halts.
Table 5: The five phases of a Bitcoin collapse (Changelly).
| Phase | Main event | Key detail |
|---|---|---|
| 1 | Price plunge, wider order books | USDT fell to $0.92 in 2022 |
| 2 | Withdrawal suspensions, custody freezes | Self-custody keeps control |
| 3 | Network congestion | Fees could rise from cents to $50 or more |
| 4 | Miners shut down rigs | Difficulty resets every 2,016 blocks |
| 5 | ETF and bank stress | Creation and redemption may strain |
Who Would Feel the Loss?
GOBankingRates asked experts what a total crash would mean. Their answers focus on how tied Bitcoin has become to the wider economy.
Kevin Rusher, founder of RAAC, said that with the world’s biggest asset manager holding $90 billion of Bitcoin, a fall to zero would bring a crisis magnitudes bigger than 2008 and 2009.
Vince Stanzione, author of The Millionaire Dropout, said the next crash will likely feel worse because the market is larger and has many products built on Bitcoin, such as ETFs and futures.
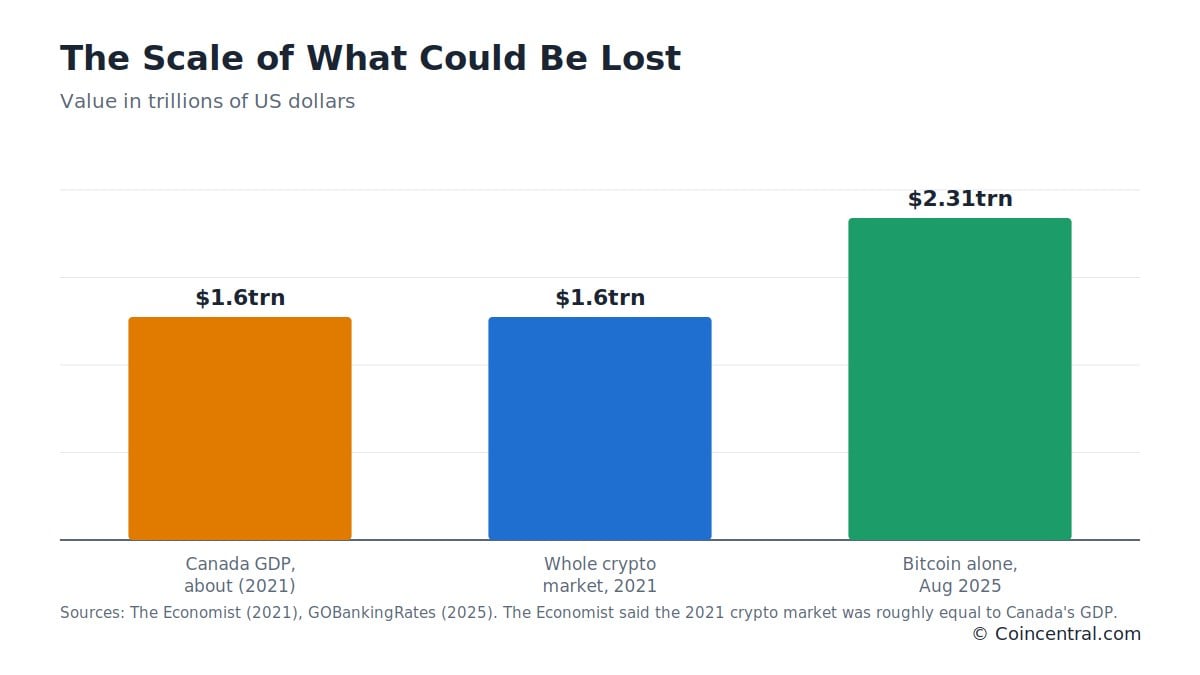
The scale helps explain the concern. The 2021 crypto market was already about the size of Canada’s economy, and Bitcoin alone was worth more than that in 2025.
The experts also pointed to who holds Bitcoin. Robert Johnson, founder of Economic Index Associates, said studies show Bitcoin buyers tend to be younger than stock and bond investors.
For some of them, Bitcoin was a first real investment. A crash could lead them to lose faith in financial markets and step away from investing entirely.
Johnson also expects a drop in retirement assets for Gen Y and Gen Z. He said these groups hold a larger share of their wealth in crypto than baby boomers and Gen X.
Regulation is the third area. Stanzione expects more rules, because investors who lose money tend to blame brokers, exchanges, and issuers such as BlackRock.
Changelly’s FAQ gives a similar view. It expects stricter know-your-customer checks, more tax monitoring, and more disclosure rules, and it says a crackdown could reach decentralized finance too.
Changelly also notes that large asset managers with ETFs and futures tied to Bitcoin could face sharp swings in market mood. That could reach retirement accounts and other products that carry Bitcoin exposure.
Table 6: Groups that could be affected by a total Bitcoin crash.
| Group | Expected effect | Source |
|---|---|---|
| Large investors | Losses tied to ETFs, futures, and balance sheets | GOBankingRates |
| Younger investors | Loss of trust in markets, and less investing | GOBankingRates |
| Retirement savers | Lower retirement assets for Gen Y and Gen Z | GOBankingRates |
| Exchanges and issuers | More blame and tighter regulation | GOBankingRates, Changelly |
| Exchange users | Frozen funds and delayed access | Changelly |
What Holders Keep, and What They Lose
If Bitcoin went to zero, holders would not automatically lose their coins. Changelly says that people who hold their own private keys still own their BTC, but the coins may have no tradable value.
CoinSwitch is more direct about the financial result. Holders of a crypto that reaches zero lose their whole investment and cannot sell for any value. The site also says a collapse could hurt confidence across the wider market and push other prices lower.
Both sources suggest the same basic habits. Know where your coins are, do not keep more on an exchange than you can afford to lose, and store your seed phrase safely. CoinSwitch adds that holders should research what they buy and spread money across other assets.
Changelly rates a total collapse as possible but extremely unlikely. The numbers in this article show why people still study it: the market is large, the holders are many, and the links to traditional finance keep growing.
This article is for information only and is not financial advice.
Sources
- What Happens If Bitcoin Crashes to Zero? The Worst-Case Scenario (Changelly, March 18, 2026)
- What if bitcoin went to zero? (The Economist, August 5, 2021)
- What happens when crypto value goes to zero? (CoinSwitch, July 27, 2023)
- What Would Happen If Bitcoin Totally Crashed? (GOBankingRates, August 24, 2025)
The post What Happens If Bitcoin Crashes to Zero? Key Statistics and Scenarios appeared first on Blockonomi.
TLDR
- The European Banking Authority has placed Circle’s USDC stablecoin in a higher-tier e-money token category under the EU’s MiCA rules.
- USDC will now be jointly supervised by the EBA and France’s Autorité de Contrôle Prudentiel et de Résolution.
- USDC is the second-largest stablecoin with a market cap of about $73 billion, behind Tether’s USDt at $184 billion.
- EU-based token issuers have been pushing for regulated US dollar-pegged stablecoins in the region.
- The European Central Bank is still exploring a digital euro, which could be issued in 2029.
The European Banking Authority has given Circle’s USDC stablecoin a higher-tier classification under the European Union’s Markets in Crypto Assets rules. The decision was announced in a notice on Wednesday, October 14.
Under the MiCA framework, USDC now falls into a higher category of e-money tokens. This label means the stablecoin will face closer supervision than smaller tokens.
The EBA said USDC is the first e-money token in the EU to receive this classification. Cointelegraph reported that only 45 other projects hold e-money token status in the region.
How USDC Will Be Supervised
With the new classification, USDC will be overseen jointly by two regulators. The first is the EBA itself, which is the EU’s banking authority.
The second is France’s Autorité de Contrôle Prudentiel et de Résolution. This French agency supervises banks and insurance firms in the country.
The two bodies will now share responsibility for monitoring the stablecoin. Their oversight will follow the standards set out under MiCA.
USDC is the second-largest stablecoin in the world by market value. It has a market capitalization of about $73 billion.
The largest stablecoin is Tether’s USDt, which is valued at around $184 billion. Both tokens are pegged to the US dollar.
Push for Dollar Stablecoins in Europe
The EBA’s decision came as many token issuers based in the EU have pushed for regulated stablecoins tied to the US dollar. These issuers say demand for dollar tokens remains strong.
James Bennett, CEO of Stable Mint, spoke to Cointelegraph about the issue. He said Europe could not “wish away” dollar stablecoins.
Bennett added that regulators can still control the safeguards and rules that issuers must follow. Under MiCA, EU authorities have the power to set those standards.
Alexander Höptner, CEO of AllUnity, shared a similar view. “For European corporates to make cross-border payments globally, offering only a euro stablecoin isn’t enough,” he told Cointelegraph.
While issuers and regulators move closer to accepting dollar stablecoins, the European Central Bank is still working on its own digital currency. Policymakers continue to explore the launch of a digital euro.
The EU first proposed the central bank digital currency in 2020. The digital euro could be issued in 2029, once lawmakers finish the required legislation and a pilot program is completed.
For now, USDC enters a new phase of supervision in the EU following Wednesday’s notice. The $73 billion stablecoin will remain under the joint watch of the EBA and France’s regulator.
The post EU Regulator Classifies Circle’s USDC Stablecoin Under MiCA Oversight Rules appeared first on Blockonomi.
CryptoPotato
September’s hotter-than-expected CPI report reignited fears that inflation is rising again, especially since the 3.7% annual increase was considerably larger than the 3.4% in August. Core CPI also rose to 2.6% year over year, above expectations and up from 2.4% the month prior. Gasoline jumped 9.1% in September alone, while shelter, airline fares, medical care, apparel, and other categories also moved higher.
This is what experts mean by sticky inflation: price pressures aren’t disappearing even after years of restrictive monetary policy. More importantly, they are spreading beyond one volatile category such as energy.
Why So Bad for Markets
Analysts at the Kobeissi Letter noted that US inflation has stayed above the Federal Reserve’s 2% target for 67 consecutive months. It was last below that level during the COVID-19-induced lockdown in January 2021. The KL also outlined particularly sharp annual increases in several sectors: fuel oil up 74.2%, gasoline up 34.2%, airline fares up 22.4%, car repairs up 5.8%, hospital services up 5.6%, and electricity up 4.4%.
Persistent inflation creates a difficult environment for financial markets because it gives the central bank less room to lower rates and can even force it to raise them further, as it did at the September FOMC meeting.
Higher rates increase returns on relatively safe assets such as government debt while raising borrowing costs throughout the economy. Highly valued growth stocks in particular are hurt by this because future earnings are discounted at a higher rate and debt-funded expansion becomes more expensive.
The reaction was telling yesterday: the S&P 500 lost over 1%, the Nasdaq fell almost 2%, and technology and AI-linked companies saw a brutal sell-off. The Kobeissi Letter estimated that roughly $800 billion in S&P 500 market capitalization disappeared during the trading session, making it the worst day since late July.
BREAKING: The S&P 500 officially posts its worst day since July 29th, erasing -$800 billion of market cap.
Inflation is rising again in the US, now nearly double the Fed’s long-term target. https://t.co/aVXLApZrQA
— The Kobeissi Letter (@KobeissiLetter) October 14, 2026
Additionally, Asian markets fell sharply, with South Korea’s KOSPI down 8%.
BTC Was Hit Hard Too
Bitcoin wasn’t exempt from the broader market crash. The asset plunged to a monthly low of $80,200 earlier this morning after reacting negatively immediately after the CPI release. The concern is pretty straightforward: hotter and more persistent inflation means higher-for-longer interest rates and tighter liquidity, both of which tend to hurt risk-on assets.
Expectations for another rate hike during the upcoming October meeting skyrocketed after the CPI data went live. That shift matters for BTC because it doesn’t generate yield. When Treasury yields rise and cash becomes more attractive, investors have a stronger incentive to reduce exposure to volatile assets.
After it was rejected at $87,000 last week, bitcoin now fights to stay above $80,000 but the increasingly hostile macro environment spells further trouble ahead: sticky inflation, elevated rates, falling equities, ETF outflows, and leverage are all applying pressure at the same time.
The post Why Markets Are Dumping: Sticky Inflation Is the Problem Bitcoin Can’t Ignore appeared first on CryptoPotato.
The cryptocurrency market took a significant step back over the past 24 hours after US inflation came in higher than expected (among other reasons).
Bitcoin (BTC) dipped 3% on a daily basis, while popular altcoins like Zcash (ZEC) posted double-digit declines. However, several analysts remain optimistic about the privacy coin and see the pullback as a buying opportunity.
New Rally Incoming?
ZEC is down approximately 15% for the day and currently trades below $1,100 (per CoinGecko). Its market capitalization fell to nearly $18.3 billion, yet the asset remains one of the 10 biggest cryptocurrencies. Interestingly, its recent downfall doesn’t seem like bad news to some analysts. X Finance Bull said he sold his entire ZEC position earlier this year when the price hit $1,500.
“My reason was simple: there had been almost no real correction since $500, and I didn’t see the utility expanding enough to justify chasing it higher,” he explained.
The latest correction, though, has changed the analyst’s plans, and he said he’s going back to the ZEC chart and fundamentals because he sees a potential setup developing.
“We prepared before the fear came. Now the market is giving us the prices. The next leg of this bull market is coming. We’re ready,” he concluded.
Altcoin Sherpa – a popular X user with over 260,000 followers also chipped in. The analyst closely watched the privacy coin’s price chart, describing a slump to $1,000 or lower as a “gift.” Jesse Olson joined the topic, too. He predicted the asset’s valuation could head south toward $900 in the short term, then stage a major recovery to as high as $1,600.
Monitoring These Indicators
ZEC’s Relative Strength Index (RSI) favors the rebound scenario. The ratio fell to 30, suggesting the asset is in oversold territory and could be on the verge of a pump. The index runs from 0 to 100, where anything above 70 typically signals an impending correction.

On the other hand, ZEC’s exchange netflow signals that the red wave may intensify in the near future. According to CoinGlass, inflows have surpassed outflows over the past few weeks, meaning some investors have moved holdings from self-custody to centralized platforms, increasing immediate selling pressure.

The post Zcash (ZEC) Slips 15% Daily, Yet Analysts View the Correction as a ‘Gift’ appeared first on CryptoPotato.
Bitcoin’s latest rejection at $84,000 resulted in another major leg down on Thursday morning, with the asset plummeting to a fresh monthly low of $80,200.
This substantial correction didn’t spare the altcoins as well, with many plummeting by over 5% from top to bottom. The total crypto market cap dumped by over $100 billion at one point.
BTC Crashed Toward $80K
It was precisely a week ago — last Thursday — when the primary cryptocurrency was sliding hard and slumped to a then-multi-week low of $80,400. The bulls finally intervened after this major $6,500 decline in just days and helped the asset recover some ground to $83,000 over the weekend.
They even pushed it to $84,000 at the start of the business week, but that was short-lived, and BTC tumbled below $81,000 on Tuesday morning as South Korea’s KOSPI plummeted. Nevertheless, bitcoin rebounded again and went into the Wednesday CPI announcement trading close to $84,000.
As inflation in September turned out to be slightly higher than expected, the cryptocurrency slipped again toward $82,000. It remained there for a while, but the growing tension in the Asian markets pushed it further south, and it bottomed, at least for now, at $80,200 earlier today.
Although it has recovered around a grand since then, it’s still 2.4% down on a 24-hour scale. Its market cap has slumped to $1.630 trillion on CMC, while its dominance over the alts has climbed above 60%.

All Aboard the Red Train
ETH led in terms of daily liquidations as it plunged the hardest from the top alts, going to a two-month low of $2,315 before it rebounded slightly to $2,370. Yet, it’s still 5% down on the day. XRP, SOL, BNB, and ADA are also down by 2%-4%, while DOGE and LINK have plummeted by 5% and 6%, respectively.
ZEC has nosedived by 10.5% as of press time, dropping to $1,100. NEAR (-7.5%), RAIN (-11.5%), BTW (-18.5%), TAO (-6%), and QNT (-6%) are also well in the red. PUMP, CC, RAY, ENA, LIT, and STX have all marked double-digit losses. In contrast, STRK has pumped by 10% to $0.087.
Overall, though, the crypto market cap has shed around $100 billion as of now daily and it’s down to $2.710 trillion on CMC.

The post $100B Gone From Crypto Markets as BTC, ETH, XRP Nosedive: Market Watch appeared first on CryptoPotato.
Machi Big Brother’s Hyperliquid trading account fell to about $21,800 on October 15 after a series of liquidations wiped out most of a fortune that had climbed from roughly $56,000 to $12.25 million in four months.
The collapse followed another round of Ethereum price declines, leaving the trader with a fraction of his previous balance after repeated attempts to cut losses and keep positions open.
Machi’s $12.25M Trading Run Ends in Liquidation
Blockchain tracker Lookonchain documented the account’s decline in two posts on October 15. In its first update, published just before the liquidation report, it noted that Machi was closing positions as the market fell in an effort to reduce losses and avoid forced closure.
“His account is now down to just $129K,” the tracker wrote.
That attempt did not prevent a further collapse. An hour later, Lookonchain reported that Machi had been “fully liquidated,” with his remaining account value falling to $21,800.
Hypurrscan data for the wallet identified as Machi Big Brother’s showed four recent liquidation transactions involving ETH-USD perpetual futures with the transactions covering positions of 380 ETH at $2,379, 270 ETH at 2,374, 200 ETH at $2,355, and 800 ETH at $2,331.
The displayed values of those positions ranged from roughly $471,000 to $1.87 million. They were recorded within minutes of one another as the account was being liquidated. The account-value chart traced the scale of the reversal, showing an initial balance of about $56,132 on June 25, followed by a climb to nearly $12.5 million before the subsequent fall.
A Familiar Pattern of High-Leverage Trading
This is not the first time the trader has suffered heavy losses on Hyperliquid, a decentralized exchange that supports leveraged derivatives trading. Public blockchain trackers have documented hundreds of liquidations tied to the account, with losses running into tens of millions of dollars.
The scale of Machi’s repeated losses becomes clearer when viewed against earlier account snapshots. For example, in February this year, on-chain data showed his holdings going from close to nine figures to $28 million in the red in just five months.
A month later, Akham reported that his losses across the preceding six months had reached $75.19 million, after he had previously been up $44.84 million. In May, the tracker reported another major setback, with $545,000 lost in 24 hours and cumulative perpetual-future losses reaching $77.32 million.
However, there have been recoveries between those setbacks, including on June 15, when the same Arkham reported that Machi’s account was worth $1.2 million, with a leveraged ETH long above $20 million showing a profit of just over $1 million following news of a US-Iran peace deal.
The trader has also faced substantial losses outside perpetual futures. In August, he proposed buying Friend.tech for $1 million and relaunching its FRIEND token, of which he had bought 11 million units for about $16.7 million, only to see their value drop to less tha $500,000.
The post Machi Big Brother Wiped Out on Hyperliquid After $12M Run appeared first on CryptoPotato.
It was another major week for Ripple and its native token, albeit not moving in the same direction. While the company announced a big partnership with Standard Chartered, XRP slumped hard during the Thursday market crash.
We will also review a major fix that was implemented in the XRP Ledger. Let’s dive in.
Ripple Partnership and Wall Street Push
One of the biggest pieces of news from the end of last week was Ripple’s expansion into the leveraged ETF market on Wall Street. Through its prime brokerage platform, Ripple Prime, the company now offers swap financing.
This followed its doubling down on its partnership with Brevan Howard, which expanded its services for hedge funds and investment managers. Leveraged ETFs use derivatives and pose significant risks and costs for investors, which could reduce long-term returns due to financing charges.
Separately, Standard Chartered launched custody support for Ripple’s native stablecoin, RLUSD, strengthening its integration into institutional trading with LMAX Group. The bank’s DIFC Branch in Dubai, regulated by the Dubai Financial Services Authority, operates the service.
The collaboration aims to improve operational efficiency and risk management for institutions using stablecoins in global markets.
XRP on Wall Street
Speaking of Ripple’s presence on Wall Street, we need to mention Evernorth’s successful debut. The XRP-holding company with 473 million tokens in its stash debuted on Nasdaq on October 12 after merging with Armada Acquisition Corp. II. On its launch day, the XRPN stock fluctuated between $16.40 and $19.40. However, the broader market correction pushed it below the lower boundary, and it closed at $15.26 yesterday.
A day later, Evernorth announced how it plans to put its XRP fortune to work as it partnered with Ripple, Kraken, Coinbase, and BitGo to deploy the millions of tokens into institutional strategies starting in Q4 2026.
The partnership aims to manage XRP investments with effective risk controls and oversight, enhancing institutional investment strategies.
Ripple ETFs Demand Dries
As we reported over the weekend, demand for the spot XRP ETFs remained positive. The funds tracking the cross-border token were among the very few ending the week in the green, attracting $11.31 million. At the same time, the Bitcoin and Ethereum ETFs bled out heavily.
However, this trend has changed. Although there are no significant outflows from the spot XRP ETFs during the current business week, demand has disappeared. SoSoValue data shows net flows of $0.00 on Monday and Tuesday, while Wednesday saw a modest $740,410 pour in.
For comparison, the ETFs gained over $75 million during the last full week of September, but have been in a clear downtrend since then.
Critical XRPL Issue Fixed
The XRP Ledger Foundation clarified on October 11 that a critical integer overflow bug in the ledger’s payment engine was fixed. The significance here was that this vulnerability dated to 2015 and could have allowed an attacker to mint large amounts of new XRP beyond the fixed 100 billion supply.
However, the team reassured that no extra XRP was ever created, and the current circulating supply remains about 99.986 billion (deflationary due to burned fees).
The bug required hundreds of deliberately crafted operations and was not triggerable by normal activity. It was reported by Cayden Liao and Veria AI, then fixed in xrpld 3.4.1 on September 25. To avoid publicly exposing the vulnerability for weeks, developers shared the patched software directly with validators via social consensus rather than the usual amendment process, after which the fix was enforced through a standard vote.
XRP Price Slumps
Despite the partnerships, Evernorth’s debut on Nasdaq, and the ETF flows until the end of last week, XRP’s price has failed to produce any meaningful rallies. On the contrary, the asset was rejected at $1.50 last week and dipped below $1.35 within days.
Although it rebounded to over $1.40 at the start of the current week, the latest market-wide pullback pushed it south yet again. This time, XRP dipped below $1.30 for the first time in a month.
As of now, the cross-border token trades slightly above that level, while analysts are adamant that it has shown strong signs of an upcoming recovery. Ali Martinez, for instance, noted that a successful rebound from the $1.25 support could push it toward $1.42 and potentially $1.60.
The post Important Ripple News and XRP Price Update: October 15 appeared first on CryptoPotato.