Cryptocurrency Posts
Crypto Briefing
USV's streamlined approach and larger funds position it to lead significant early-stage investments, impacting AI-driven sectors and VC dynamics.
The post Union Square Ventures raises $900 million and trims its partnership for the AI era appeared first on Crypto Briefing.
The surge in AI chip demand signals a transformative shift in the semiconductor industry, potentially reshaping global tech dynamics and economies.
The post Applied Materials posts record $9.12 billion quarter as AI chip demand surges appeared first on Crypto Briefing.
A 6% Treasury yield could destabilize financial markets, challenging stock valuations and exposing vulnerabilities in leveraged sectors.
The post Fundstrat’s Tom Lee warns a 6% 10-year Treasury yield would pressure stocks appeared first on Crypto Briefing.
This lawsuit highlights growing tensions between AI developers and content creators, potentially reshaping copyright law and AI training norms.
The post USA Today Co. sues OpenAI for more than $250M over AI training data appeared first on Crypto Briefing.
Trump's terminology shift to "super intelligence" may influence federal policy and tech industry dynamics, highlighting geopolitical tensions.
The post Trump calls anyone saying ‘artificial intelligence’ ‘the enemy’ as White House keeps using the term appeared first on Crypto Briefing.
Bitcoin Magazine
Bitcoin Magazine
Bitcoin Falls Below $81,000 as Oil Spikes, Fed Talks Tough
Bitcoin’s price has dropped further, sliding with other assets as the oil price continued to climb and the Federal Reserve made a hawkish statement.
The price of the leading asset recently stood at $81,203 after dropping as low as nearly $80,922 at one point on Thursday morning in New York.
Over the past day, bitcoin’s price has shed nearly 3% of its value; over a seven-day period, it’s down by 4%.
Just last week, the coin seemed to be closing in on the $90,000 mark after a phenomenal September rally and one of its best quarters in years.
But so-called Uptober — the month of October typically gives bitcoin investors good returns — is starting slow on a surging oil price.
This week, the price of Brent crude has jumped following renewed attacks on tankers in the Strait of Hormuz. U.S. President Trump also hinted that talks with Iran weren’t going the way he wanted.
A surging oil price this year has — at least in the short-term — hurt the price of bitcoin and other “risk-on” assets because it increases the chances of the U.S. central bank raising interest rates. Bitcoin has in the past done well with low interest rates because of increased liquidity.
In a speech Thursday, Federal Reserve Governor Christopher Waller also said further interest-rate hikes will likely be needed to slow inflation. He did add that there was “flexibility” about the pace of increases.
Oil prices have jumped since the U.S. and Israel attacked Iran in February, which resulted in the closure of the Strait of Hormuz in retaliation by Iran. Higher oil prices have meant sticky and climbing prices around the world — including in the States.
But bitcoin’s price in September appeared to shrug off comments by the new Federal Reserve Chair, Kevin Warsh, and jumped despite the central bank raising interest rates.
Despite the bitcoin price dip, the coin, according to some analysts, has entered a bull market again. The biggest cryptocurrency spent most of 2026 in a bear market after reaching record highs in October 2025. It is currently more than 30% below its record of $126,080.
This post Bitcoin Falls Below $81,000 as Oil Spikes, Fed Talks Tough first appeared on Bitcoin Magazine and is written by Mathew Di Salvo.
Bitcoin Magazine

EDX Markets and VerifiedX Partner to Bring Verified Bitcoin (vBTC) to Institutional Markets
VerifiedX (verifiedx.io), a programmable layer for Bitcoin and other crypto assets, and EDX Markets (“EDX”), a Chicago-based digital asset technology firm that combines an institution-only trading venue with a central clearinghouse, announced a strategic partnership to bring Verified Bitcoin (vBTC), a tokenized form of Bitcoin, to EDX for institutional spot trading.
vBTC, VerifiedX’s flagship product, is designed to be a programmable, one-to-one backed Bitcoin asset, enabled by their layer-two protocol. As part of the partnership, EDX will join the VerifiedX network as a validator, providing EDX with direct participation in network validation and governance. The partnership will extend the relationship beyond asset trading into the underlying infrastructure supporting vBTC, while unlocking the asset for institutional traders and investors, according to a press release shared with Bitcoin Magazine.
“Bitcoin has become a globally recognized institutional asset, yet much of its financial utility remains fragmented across exchanges, custodians, wrappers, bridges and application-layer protocols,” they wrote. The press release explained how VerifiedX works to address that fragmentation by making the bitcoin backing vBTC verifiable on-chain at a more granular level, avoiding the pooling of funds and using more advanced Bitcoin technologies than other alternatives. In turn, this makes the asset easier to program for trading, payments, treasury management, lending, and other financial applications.
The partnership is expected to support a range of institutional strategies, including:
- Bitcoin trading and price discovery through institutional spot markets;
- Cross-market arbitrage and liquidity strategies between BTC and vBTC markets;
- Treasury and balance-sheet mobility, allowing Bitcoin capital to move between trading and programmable environments;
- Borrowing, lending and yield strategies built around Bitcoin-backed capital;
- On-chain liquidity and financial applications native to VerifiedX;
- EVM composability through vBTC.b, the canonical representation of vBTC for supported EVM environments, allowing Bitcoin capital to participate in broader decentralized financial markets while preserving a direct redemption path to underlying Bitcoin.
Through EDX, market participants will gain a new venue for trading vBTC within an institutional market structure designed around aggregated liquidity, central clearing and capital-efficient settlement.
“Bitcoin does not need another financial abstraction. It needs infrastructure that allows the asset itself to do more,” said Jay Pollak, Head of Strategy at the VerifiedX Foundation. “Bringing vBTC to EDX is important because it connects programmable Bitcoin capital with market infrastructure purpose-built for sophisticated institutions. An allocator should be able to trade Bitcoin, deploy it, move it across financial environments, and ultimately redeem back to Bitcoin without losing the fundamental ownership characteristics that made Bitcoin valuable in the first place.”
“EDX joining as a validator makes this partnership even more meaningful. This is not simply about adding another trading pair. It connects institutional trading infrastructure directly with the network infrastructure underneath the asset,” Pollak added. As a validator, EDX gets maximum sovereignty over the signing and governance of the vBTC they are responsible for, while also becoming a node in Bitcoin and the VerifiedX layer.
Aside from their home page at VerifiedX.io, the company has a dedicated block explorer as well as a Discord, X profile, and GitHub repo. They can also be contacted via email at info@verifiedx.io.
Bitcoin Magazine has a financial relationship with VerifiedX. This article was not commissioned or reviewed by VerifiedX and reflects the independent judgment of the author.
This post EDX Markets and VerifiedX Partner to Bring Verified Bitcoin (vBTC) to Institutional Markets first appeared on Bitcoin Magazine and is written by Juan Galt.
Bitcoin Magazine
Standard Chartered to Offer Digital Asset Custody in Singapore
Standard Chartered plans to offer crypto custody services for institutional clients in Singapore, the British multinational has said.
Institutional and corporate clients increasingly want secure, regulated, bank-grade custody for digital assets, the bank said Thursday. Standard Chartered already offers the service in the United Arab Emirates, Luxembourg, and Hong Kong.
“Singapore is an important centre for financial innovation, with a strong institutional ecosystem and growing demand for trusted digital asset solutions,” Patrick Lee, CEO, Singapore and CEO, ASEAN & South Asia, Standard Chartered, said.
JUST IN:
— Bitcoin Magazine (@BitcoinMagazine) October 8, 2026Standard Chartered Bank announced its plans to provide custody services for Bitcoin and digital assets today
pic.twitter.com/Ynmdd5VEtP
“Robust infrastructure will be critical to supporting the secure movement, safekeeping, and servicing of tokenised assets at an institutional scale.”
Banks worldwide are integrating or offering bitcoin-related products and services. A number of U.S. and European banks have started offering crypto-related services by custodying assets for institutions.
Standard Chartered added the custody service would be for “selected cryptoassets, stablecoins and tokenized real-world assets.”
Tokenization is a hot topic on Wall Street as a number of traditional finance firms do deals with crypto companies, mostly to bring stocks on the blockchain to allow for 24-7 trading. Other assets are also being considered or debuted.
In 2025, Standard Chartered set up a trading desk for bitcoin and other cryptocurrencies in London, making it one of the first global banks to enter spot cryptocurrency trading.
The crypto desk became part of the forex trading operation. The bank the same year launched a blockchain unit called Libeara to help institutions tokenize traditional assets.
Last month, the bank debuted bitcoin trading in the UAE for institutional clients.
Crypto custody is often a starting point for banks moving into the digital asset space. BNY Mellon in 2022 became the first major U.S. bank to offer digital asset custody services.
And last month, Germany’s Deutsche Bank said it plans to launch a custody service for bitcoin, ether and select stablecoins for European corporate and institutional clients later in 2026, pending regulatory approval.
This post Standard Chartered to Offer Digital Asset Custody in Singapore first appeared on Bitcoin Magazine and is written by Mathew Di Salvo.
Bitcoin Magazine

Understanding Digital Money and Digital Yield
The new business model of building on top of digital credit to create digital money and digital yield can be roughly categorized into two different architectures.
- Debt-based, tranching structures
- Full-reserve, spendable balance structures
This article gives a general overview of these models, with an analysis of economic implications.
Digital Credit, Digital Money and Digital Yield
To get started, I will define these terms. Digital Credit is the credit-like instruments issued by corporations with large Bitcoin balance sheets. Today they are five Nasdaq-listed perpetual preferred equity—STRC, SATA, STRK, STRF, STRD—and all five are the top five most liquid preferred equity securities in the United States. Digital Credit is L2 because it is built on top of Bitcoin, which is L1.
Digital Money and Digital Yield are the L3 products that could be built on top of Digital Credit.
Now obviously, Bitcoin is Digital Money. In this article I am using the terms popularized by Michael Saylor in corporate bitcoin discourse to describe the economic ecosystem that is emerging on top of public company issuance of Bitcoin-linked securities.
Under that paradigm, Digital Money refers to something that holds a very stable fiat-denominated value that is built on top of Digital Credit. And Digital Yield refers to something that concentrates and amplifies the yield of Digital Credit. Both Digital Money and Digital Yield are L3, since they exist on top of L2 Digital Credit.
Now that we know Digital Money and Digital Yield, we will move on to the different architectures for them.
Debt based tranching
The first and primary one is a debt-based tranching structure in which the digital credit is used as the base collateral asset. The junior tranche is effectively leveraged long digital credit, and the senior tranche is effectively principal protected via the junior tranche’s permanent capital. Right now this is by far the most common structure because we see quite a lot of AUM inside these types of systems. For example, Saturn is a tokenized protocol that holds a lot of STRC, and the financial engineering built on top of Saturn is Strata, which uses the same tranching approach (the name “Strata” likely refers to stratifying the different financial layers within the setup).
Another very important example is UTXO Management’s Preferred Income Strategies LP. This is a dual-class fund: a junior fund share class and a senior fund share class. The juniors are effectively leveraged long the underlying digital credit portfolio and the seniors receive a highly principal-protected 7.5% annual yield. Now, the caveat is the portfolio value cannot fall below the invested capital representing the senior’s original principal. Seniors must get all their principal back before the juniors can get paid. UTXO is able to run some other alpha-generating strategies which may reduce downside risk of the digital credit portfolio or employ relative value trades to capture market mismatches. Such actions increase the returns of the total portfolio. And since the juniors are leveraged long this portfolio, they have the potential to outperform. Meanwhile, the seniors have the entire principal protection cushion. Tranching using the two share classes therefore matches different parties’ risk preferences and desires for total return in a way that services both investor profiles.
You might notice that this basic structure is quite similar to what a digital credit issuer like Strategy or Strive does with their own capital structure. If the issuer raises capital using preferred equity or debt, they have created a more senior layer—that becomes the principal protected layer, albeit it is asset value coverage rather than encumbered, callable protection—while the common equity becomes the junior tranche that is effectively leveraged beyond the underlying asset. In other words, the digital yield and digital money products built on top of digital credit using this tranching structure is a higher order retelling of the same digital credit and digital capital maneuvering done one layer below.
Now, it’s important to realize that any kind of leveraged system that borrows money and then invests the borrowed money into digital credit, is effectively engaging in the Layer 3 methodology of tranching, because that person is now leveraged long, and his counterparty is another person who becomes principal protected. Outside of raw asset coverage ratios, the specific degree of principal protection depends on whether the collateral asset—in this case the digital credit instrument—is sitting in some kind of custody that can be enforced.
Put differently, should the digital credit position go underwater, the creditor is able to possess the assets, liquidate the collateral, and be made whole. Enforceability depends on the exact parameters of these structures. Within the case of something like Strata, it is enforced by a blockchain consensus dependent smart contract. The successful execution of that smart contract is where the trust resides. Within the UTXO Preferred Income Fund, you have an enforceable structure within the confines of a regulated hedge fund that all LPs partake in.
One key insight is that such a debt-based structure is far broader and more general than one might initially suspect. Let’s say somebody takes out a mortgage against their house and buys digital credit with it. They have somewhat created that L3 concept because money is being created via the traditional fractional reserve banking process, and collateral has been encumbered. Now, in this case, digital credit isn’t exactly the collateral because the house is the collateral. However, the entire economic setup would not be possible without the presence of digital credit serving as an investable asset and a location to deploy borrowed capital. In a sense, there is a bit of a shadow banking condition that emerges if a widespread group of people take out loans of various forms that might be secured by other assets or even unsecured, and then use the borrowed capital to invest in digital credit in order to be leveraged long digital credit.
The assets that emerge out of this type of behavior is basically conventional credit. It is not tokenized, and there is nothing special about it. It takes the form of an asset-backed security, and frankly, you wouldn’t even know that digital credit was on the other side of it most of the time. And for this reason, it’s not completely precise to call it the L3 digital yield concept, because it does not deal directly with digital credit. At the same time, it is a meaningful market mechanism which may emerge, and we should actively monitor the emergence of this behavior as digital credit scales.
Now I will go into the potential problems and current shortfalls of this type of debt-based, tranching method. The most obvious one is that there is no backstop besides the debtors’ own balance sheets and there is a constant need for debtors to take the leveraged long side for this to work. This is a persistent issue that caps the scalability of L3 digital money and digital yield solutions. If it is the case that you always need a leveraged long party in order to create the principal protection for the senior tranche, then you become constrained by the availability of leveraged long parties. First, there may be much better things to be leveraged long, so you might not have junior capital if there are more compelling opportunities out there. Second, there is always a push-pull relationship between the seniors and the juniors. Because the entire thing exists within a tranche structure, the total portfolio is a zero-sum game. Whatever the seniors gain, the juniors must lose, and vice versa. And because of this, the seniors can only demand yield up to a certain level before the juniors leave. Concurrently, the juniors must receive a return at least to a certain level before they would be willing to take the risk. This relationship needs to reach an equilibrium clearing price. But even at that clearing price, it is doubtful that there will be enough demand for leveraged long digital credit to persistently create the senior principal protected position.
This exact challenge is supported by the anecdotes of the tranching structures I am aware of: there appears to be a relative shortage of folks willing to be juniors and a relative surplus of folks willing to be seniors.
Now, the way the fiat system solves this problem actually presents a very interesting case study for L3’s current shortcomings. You see, fiat solves this problem by having an elastic public balance sheet behind the private credit system. Commercial banks can create credit and deposit money, while the central bank supplies the ultimate settlement asset (which is often called: M0, base money, or bank reserves). When systemwide deleveraging threatens the monetary system, the central bank can create reserves and replace disappearing private liquidity, while the Treasury, deposit insurer, or other public institutions can absorb or redistribute credit losses where policymakers choose to do so. This means the fiat system does not require a private actor to remain willing to be the marginal leveraged long investor during a panic: the public sector can temporarily take that role and prevent forced deleveraging. Thus fiat money can remain present even when the leverage behind it disappears. (Digital Money implemented via the tranching architecture cannot do this.)
Equity and creditors can still be wiped out in fiat. But the distinctive feature of fiat is that there is no hard nominal constraint on the public sector’s ability to manufacture the settlement asset needed to stabilize the financial system. The ultimate macroeconomic constraint on sustained use of that capacity is the availability of real resources and the ability for individuals to tolerate the inflationary impact of such currency debasement. This is the true limit of fiat’s debt-based system at a societal level; and indeed this is also the core conclusion of Modern Monetary Theory.
Now, it should be easy to see that digital credit does not have this type of backing today. It is doubtful that any central bank today would consider buying digital credit when it is underwater to make investors whole (even though central banks do this often with traditional forms of credit like mortgages and other bank loans). And so in that sense, the concept of a fiat-banking-like system that is constructed on top of digital credit to serve as widespread L3 digital money is dubious at best within the next few years. Certain things need to happen—the main one being better Basel risk weights for Bitcoin—and even then meaningful progress would likely be quite slow.
Lacking the support of the commercial banking system or the central banking system, the only capital that can come in as the leveraged Digital Yield juniors to support the creation of the Digital Money seniors is private capital willing to take the risk.
Full reserve, spendable balance
This now brings us to the second form of L3 digital money. These are full-reserve, spendable balances. (A quick disclaimer here is that just because this one is “full reserve” does not imply that the tranching structure is “fractional reserve”. Full reserve just means that the available spendable balance is fully supported by unencumbered shares held on the spot.)
This concept is to combine digital credit with a basket of other credit instruments to create a composite benchmark that is both highly liquid and yields over the risk-free rate (here the risk-free rate just means the short-term U.S. T-bill rate). And if this asset also had daily liquidity and could accrue interest on a daily basis, then you have what is like a money market fund with added risk premium and volatility. If this thing could then be tokenized or turned into a spendable balance, then you now have what could be considered a digital currency that pays higher yield. Note that the composite benchmark is not required: one could have only digital credit in the balance and make it spendable too. Since the volatility of digital credit is higher than short duration credit instruments like FLOT or FLTR (floating rate note ETFs) or JAAA or CLOA (AAA-rated CLO tranches), purely digital credit will be a more volatile albeit higher yielding spendable balance.
The real hurdle for this concept is regulatory acceptance. Consider the recent plight over stablecoins and the Clarity Act, and how banks rejected Clarity because stablecoins serve as a big competitor to them. One of the most contentious issues was stablecoins paying yield, which would compete with traditional bank deposits. Now if we had a spendable balance with relatively stable par value that pays a higher-than-risk-free yield due to a credit risk premium, then this would probably create even more of an issue. In that sense, the idea of using relatively-stable-value securities (of which digital credit is just one group) as spendable balances is something that is sensitive when considering the different parties that need to be satisfied for this to become legally possible.
A softer version of the spendable balance concept is something like Castle: businesses can hold reserves in STRC, liquidate STRC into cash on demand, and then use that cash for operating expenses. The conversion follows normal securities T+1 settlement. This is like a brokerage account connected to a payment provider. Neither the shares nor representation of the shares (like a token) are being transferred to the final recipient of the payment.
Of course, there are far less obstacles to creating a simple fund that holds digital credit without making the fund interests peer-to-peer transferable. OranjeBTC has done exactly this with their Digital Credit ETF launched in Brazil. In this specific case, OranjeBTC has even employed a currency hedge procedure to deliver yields denominated in Brazilian Real. Even though this return stream can probably be replicated without much difficulty, it is nevertheless far more convenient for most people to buy a single ticker that takes care of everything.
Conclusion
The existing developments and current regulatory parameters suggest that the debt-based tranching solution will likely be more of the activity within the L3 field. There are several different variations of both archetypes: within this article we’ve gone through a few different versions.
I aim to explore such models—existing and theoretical—in greater depth in the future. Stay tuned.
Disclaimer: This content was prepared on behalf of Bitcoin For Corporations for informational purposes only. It reflects the author’s own analysis and opinion and should not be relied upon as investment advice. Nothing in this article constitutes an offer, invitation, or solicitation to purchase, sell, or subscribe for any security or financial product.
This post Understanding Digital Money and Digital Yield first appeared on Bitcoin Magazine and is written by Allard Peng.
Bitcoin Magazine

Why Bitcoin’s Liquidity Advantage Matters as Institutions Move In
Bitcoin’s portability, divisibility and accessibility could increasingly distinguish it from traditional stores of value as more institutions enter the market, according to SALT Lending CEO and Co-Founder Shawn Owen.
Speaking on BMTV, Owen pointed to Bitcoin’s resilience while gold and other long-duration assets sold off, arguing that some of Bitcoin’s most basic characteristics give it advantages over competing assets.
“It is easier to buy Bitcoin than gold,” Owen said.
That advantage becomes even more apparent when mobility matters.
“It’s easier to move Bitcoin out of, say, somewhere where you need to leave quickly because there’s unrest in the area than gold,” Owen said. “It’s far more portable and divisible and easy to use than real estate.”
Bitcoin’s Liquidity Advantage
Gold, real estate and bitcoin can all serve as long-term stores of value, but accessing and moving that value looks very different.
Physical gold requires storage and transportation. Real estate is tied to a specific location and can take time to buy or sell. Bitcoin can be transferred globally and divided into small units without those same physical constraints.
Those characteristics can also give Bitcoin holders more flexibility when they need liquidity.
Rather than selling bitcoin to access dollars, holders can potentially use it as collateral and borrow against its value while maintaining exposure to the underlying asset.
That model becomes particularly relevant if Owen’s longer-term outlook for Bitcoin adoption proves correct.
Institutional FOMO Is Arriving
Owen believes the experience many individual Bitcoin holders have already gone through, discovering Bitcoin and wishing they had gotten involved earlier, may eventually play out among much larger institutions.
“Every human goes through this experience where you learn about Bitcoin and wish you’d been earlier,” Owen said. “I think that will be true of sovereigns and banks and institutions of all sizes.”
Banks have taken considerably longer to enter the market, but Owen believes that is beginning to change as many of the hurdles surrounding Bitcoin have been addressed.
“Banks have been slow, but are now getting in after all the boxes have been checked,” he said. “FOMO is real.”
JUST IN: Salt Lending CEO says sovereign wealth funds and banks are realizing the importance of Bitcoin
— Bitcoin Magazine (@BitcoinMagazine) October 7, 2026
"Every human goes through this experience where you learn about Bitcoin and wish you'd been earlier…I think that will be true of sovereigns and banks of all sizes."

Owen cautioned that adoption and price appreciation will not necessarily happen in a straight line. As Bitcoin matures and more capital enters the market, he expects some dampening of its historic volatility.
That does not change his longer-term outlook.
“Adoption depends on the time horizon we’re talking about,” Owen said. “Dampening of volatility, and we will continue to see that, but that doesn’t mean over the next decade we won’t see serious adoption and increase in price.”
“Never Sell Your Bitcoin”
That long-term view also shapes how Owen thinks holders should approach their bitcoin.
“I have always said never sell your bitcoin,” Owen said. “Long term we will continue to see prices increasing significantly in comparison to fiat currencies.”
For holders who share that outlook, selling bitcoin to cover a large purchase, business expense or other liquidity need means giving up future exposure to the bitcoin they sell.
Bitcoin-backed lending provides an alternative.
SALT allows eligible borrowers to use bitcoin as collateral to access cash without selling the underlying bitcoin. Once the loan is repaid, the collateral is returned to the borrower.
The model aligns closely with Owen’s broader thesis. If Bitcoin continues becoming easier to access and more widely adopted by banks, institutions and potentially sovereigns, long-term holders may become increasingly reluctant to sell simply because they need liquidity.
Instead, they can potentially maintain their bitcoin position while accessing the value stored within it.
As Bitcoin adoption expands, the conversation may increasingly move beyond how to acquire bitcoin and toward how holders can use the wealth they have accumulated without necessarily selling the asset.
SALT Lending is the Official Liquidity Sponsor of BMTV. Learn more about borrowing against your bitcoin and explore SALT’s BMTV offer at https://saltlending.com/bmtv/?utm_source=bmtv&utm_medium=article&utm_campaign=52783658-BMTV%20article&utm_term=BMTV
Disclaimer: SALT Lending is a paid sponsor of BMTV and serves as BMTV’s Official Liquidity Sponsor. This article is sponsored content and does not necessarily reflect the views or opinions of Bitcoin Magazine. The information provided is for promotional purposes and should not be considered financial advice. Readers are encouraged to conduct their own research before making any investment decisions related to Bitcoin or other financial products mentioned herein.
This post Why Bitcoin’s Liquidity Advantage Matters as Institutions Move In first appeared on Bitcoin Magazine and is written by Josh Plischke.
CryptoSlate
Bitcoin slid below $81,000 on Oct. 8, with an intraday low near $80,800, even as traders expect the Fed to hold in October.
The September FOMC minutes, released Oct. 7, said most participants viewed another rate increase by year-end as probable and left decisions dependent on data.
December remains an expectation inferred from the policy path, and Fed Governor Christopher Waller's Oct. 8 remarks showed how far that path extends.
A pause delays the next hike
Waller cited futures pricing as of Oct. 7 that assigned an 85% chance to at least one hike by December. The same pricing put nearly 80% on at least two hikes by March 2027 and 33% on three or more.
The probabilities are cumulative and market-implied, with Waller adding that further hikes are probable if data evolve as expected and that they can skip meetings. An October hold moves the next increase later on the calendar while the path into 2027 stays steep.
The 10-year Treasury yield reached 5.305%, and the 2-year was at 4.821% on Oct. 8, with Brent crude at $104.87. Oil keeps inflation risk alive, and higher yields keep the cost of capital elevated for risk assets even if the Fed skips a meeting.
Glassnode's Oct. 7 report found combined spot-exchange and US Bitcoin spot ETF volume near $6.8 billion a day, below roughly 90% of observations since January 2024. Estimated new money from ETFs, stablecoins, and corporate treasury buying totaled $4.9 billion, while realized cap rose $12.8 billion over 30 days, less than 40% of the total.
The prior move higher leaned on existing capital repricing coins, and the buying depth to absorb selling was shallow.
As of press time, CoinGlass registered over $1 billion in liquidations for the past 24 hours, with $930 million tied to longs.
Bitcoin's $81,000 zone gave way
A day earlier, Glassnode flagged a modeled cluster of long liquidations between $81,700 and $83,300, along with large Binance bids around $81,000 to $81,250.
The modeled zones show where positioning sat, and the low shows that price crossed them. Liquidations amplified the move, and macro forces as the initiating cause is a supported interpretation. Proving that sequence would take intraday spot-flow and liquidation data.
If buyers rebuild above the $85,500 reclaim threshold with higher spot volume, Bitcoin meets a sell-order concentration at $86,500 to $86,750.
Beyond it sits Glassnode's largest one-year cluster of liquidations above price, from $87,100 to $95,900 and heaviest near $92,000, where a reclaim could force short covering and turn the pause into a catalyst.
If buyers fail to rebuild, Glassnode's next modeled liquidation cluster sits near $75,000, a reference level for the downside. The next macro tests are September CPI on Oct. 14, the Oct. 27-28 FOMC meeting, and the Dec. 8-9 meeting.
An October pause delays the next hike, and Bitcoin has to hold its structure through CPI and two Fed meetings on a thin base of buyers.
The post Bitcoin’s slide below $81,000 exposes why a Fed pause may not save the crypto market appeared first on CryptoSlate.
US government-linked wallets moved over $1 billion in Bitcoin on Oct. 8 as BTC prices fell and more coins reached Coinbase Prime.
On Oct. 8, Galaxy Research flagged the transfer of 12,267 BTC, valued at approximately $1 billion, from a government-controlled address holding assets recovered from the 2016 Bitfinex hack.
The Bitcoin initially moved to an unidentified intermediary wallet before blockchain analyst EmberCN reported that 9,000 BTC, worth about $739 million, had reached Coinbase Prime, Coinbase's institutional trading and custody platform.
The transactions extended three consecutive days of government-linked Bitcoin movements, coinciding with a roughly $4,000 decline in the cryptocurrency's price. During the period, Bitcoin's price fell from about $86,500 when the transfers began late on Oct. 6 to around $82,500 on Thursday, according to EmberCN.
Meanwhile, the timing has renewed concerns about potential government selling.
However, transfers to Coinbase Prime do not prove the Bitcoin was liquidated or that the transactions contributed to the price decline. The platform provides custody and trading services, allowing assets to be deposited without an immediate sale.
Government transfers expose previously unidentified Bitcoin holdings
The Oct. 8 movement followed substantial transfers that Galaxy Research had documented over the preceding two days.
On Oct. 7, the firm reported that government-linked wallets sent approximately 8,428 BTC to Coinbase Prime, following another 834 BTC the previous day. Together, those transactions involved about 9,261 BTC, valued at roughly $770 million.
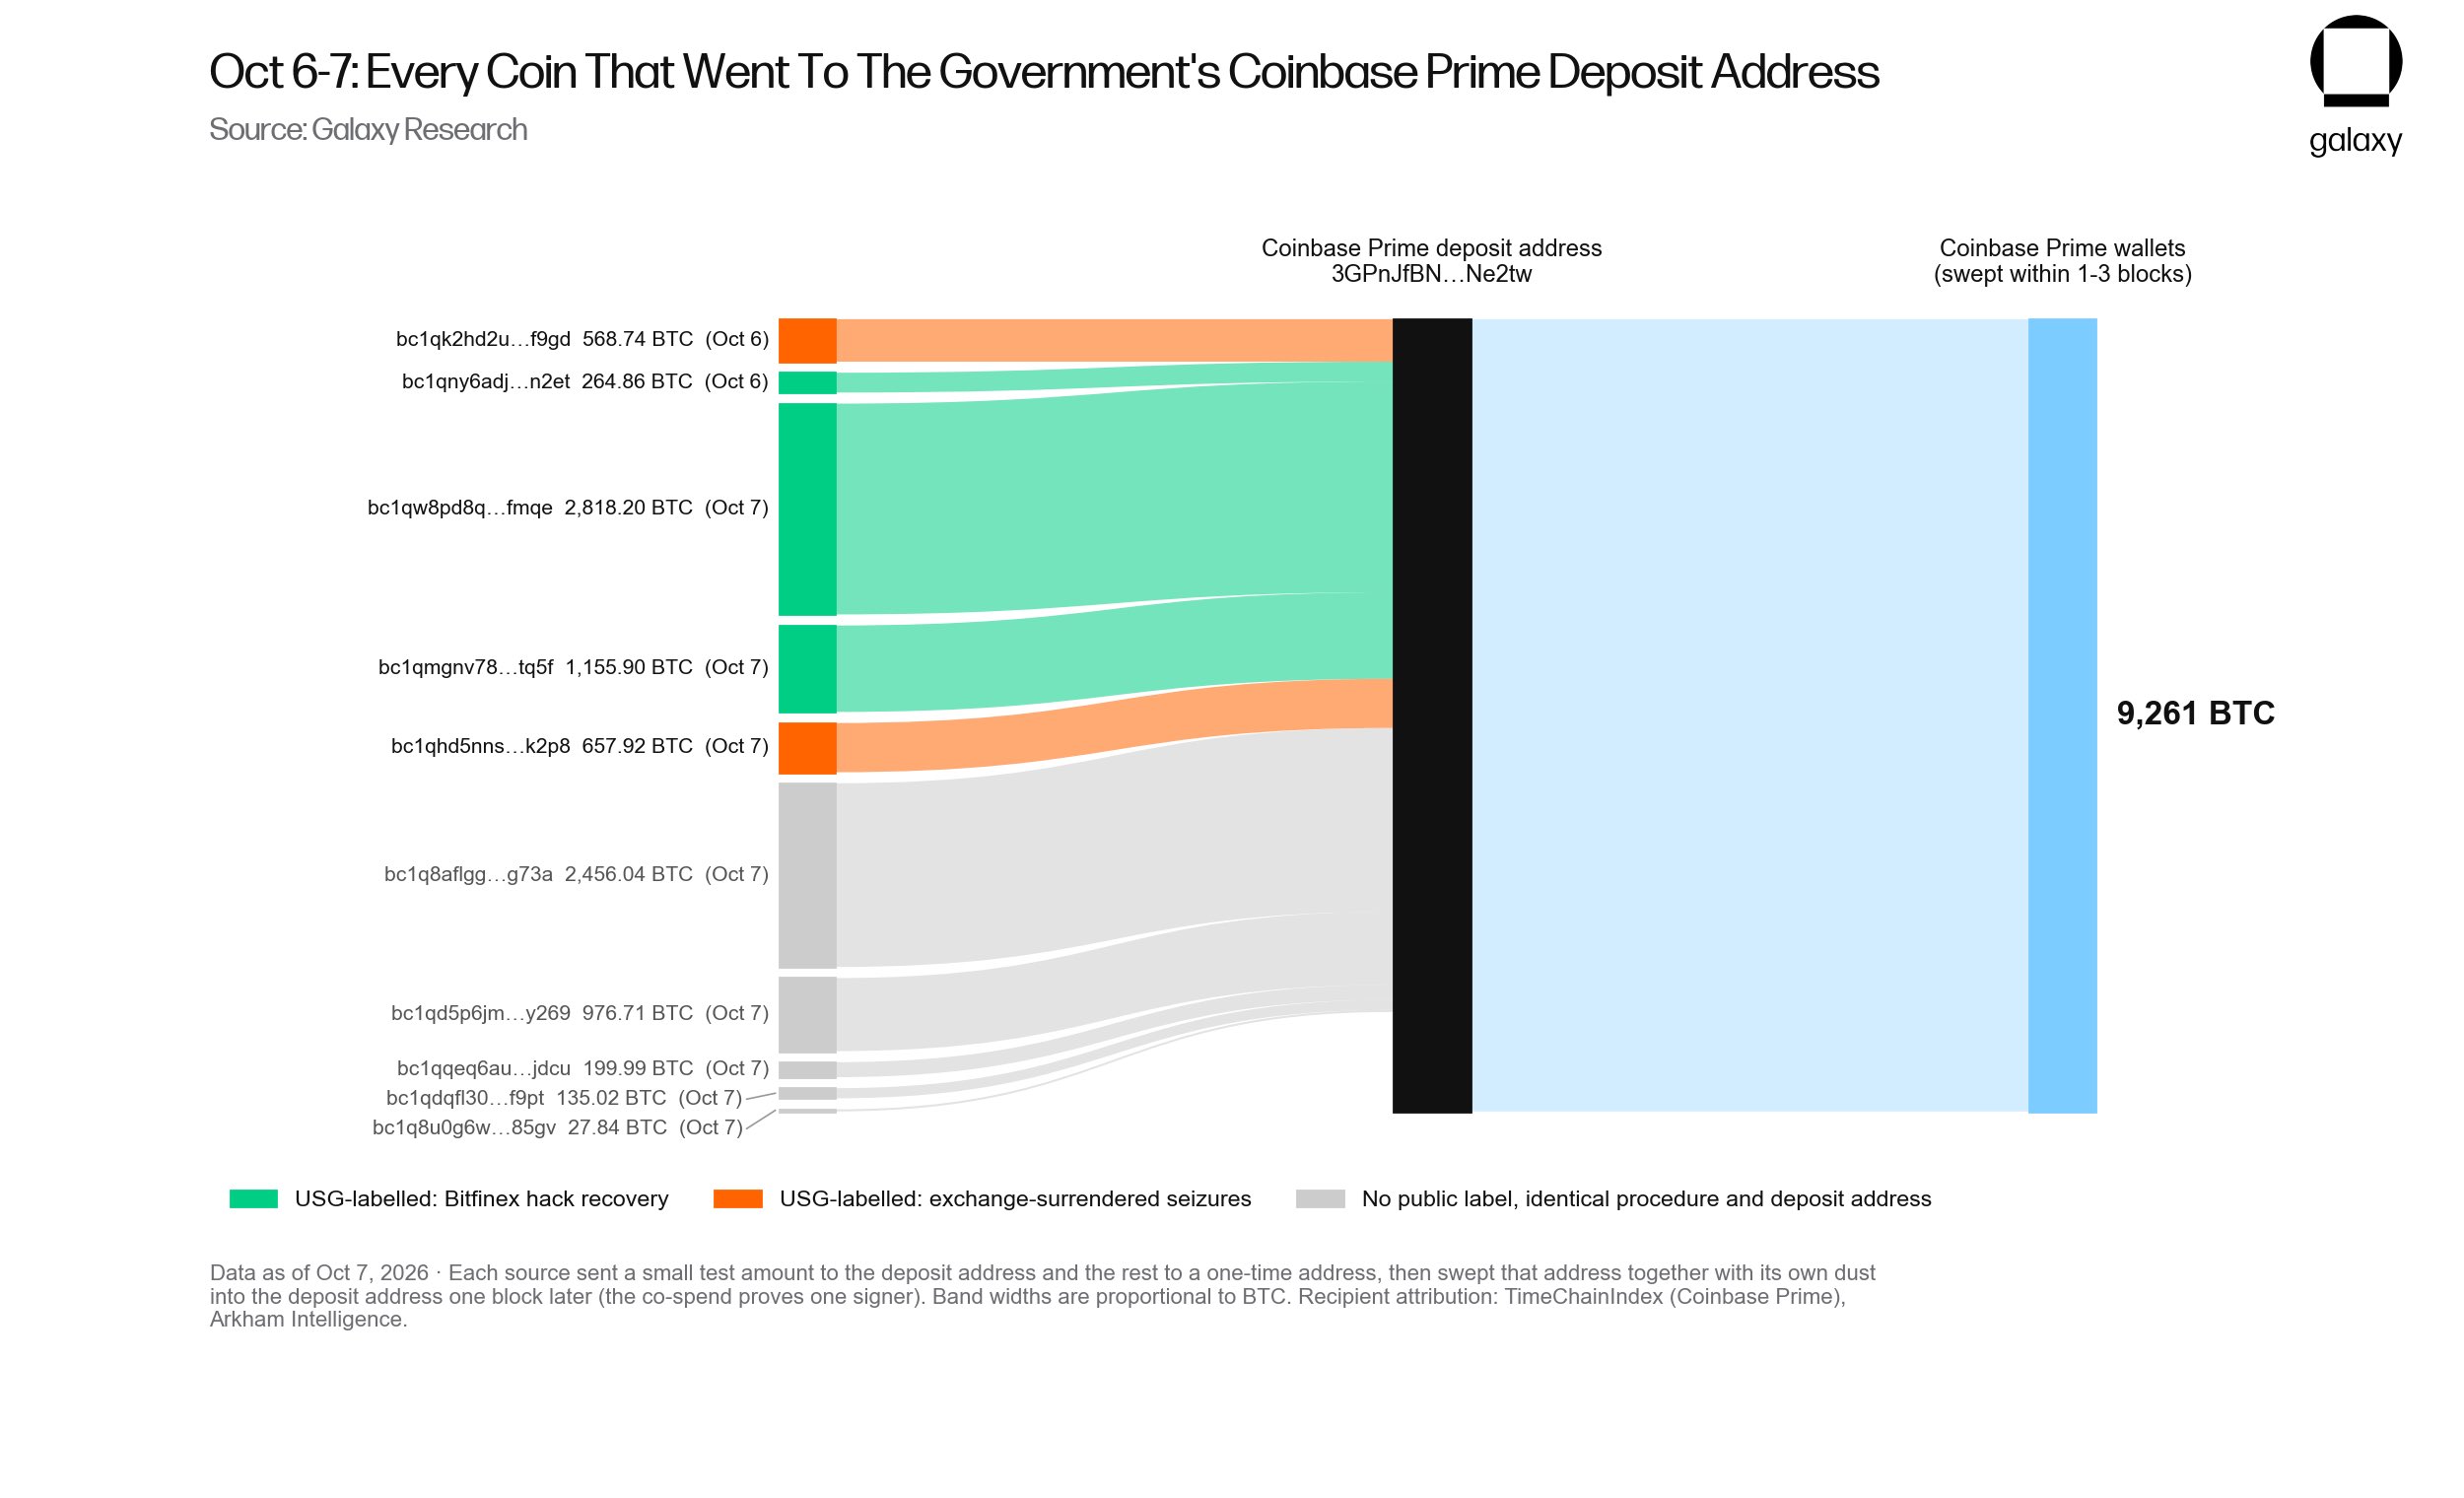
Nearly half of those assets originated from Bitcoin recovered following the Bitfinex hack, while another portion was linked to previously identified cryptocurrency seizures involving Binance.
However, Galaxy's analysis also identified 2,456 BTC originating from wallets not previously classified as government holdings.
The researchers attributed those assets to US authorities because they followed the same transfer procedures as known government wallets and reached an identified federal Coinbase Prime deposit address.
The discovery suggests that publicly labeled government wallets may understate how much Bitcoin Washington controls.
Galaxy said the Coinbase Prime deposit address had received approximately 11,567 BTC since its first recorded use in December 2025. About 6,406 BTC came from identified government wallets, while another 5,160 BTC originated from previously unlabeled addresses.
The firm also classified the Oct. 7 activity as the ninth-largest single-day Bitcoin outflow from identified US government wallets since 2013, excluding internal transfers, and the largest since Dec. 2, 2024.
Galaxy estimated that government-attributed wallets held approximately 319,086 BTC in its earlier assessment, down from a peak of 352,587 BTC in August 2024.
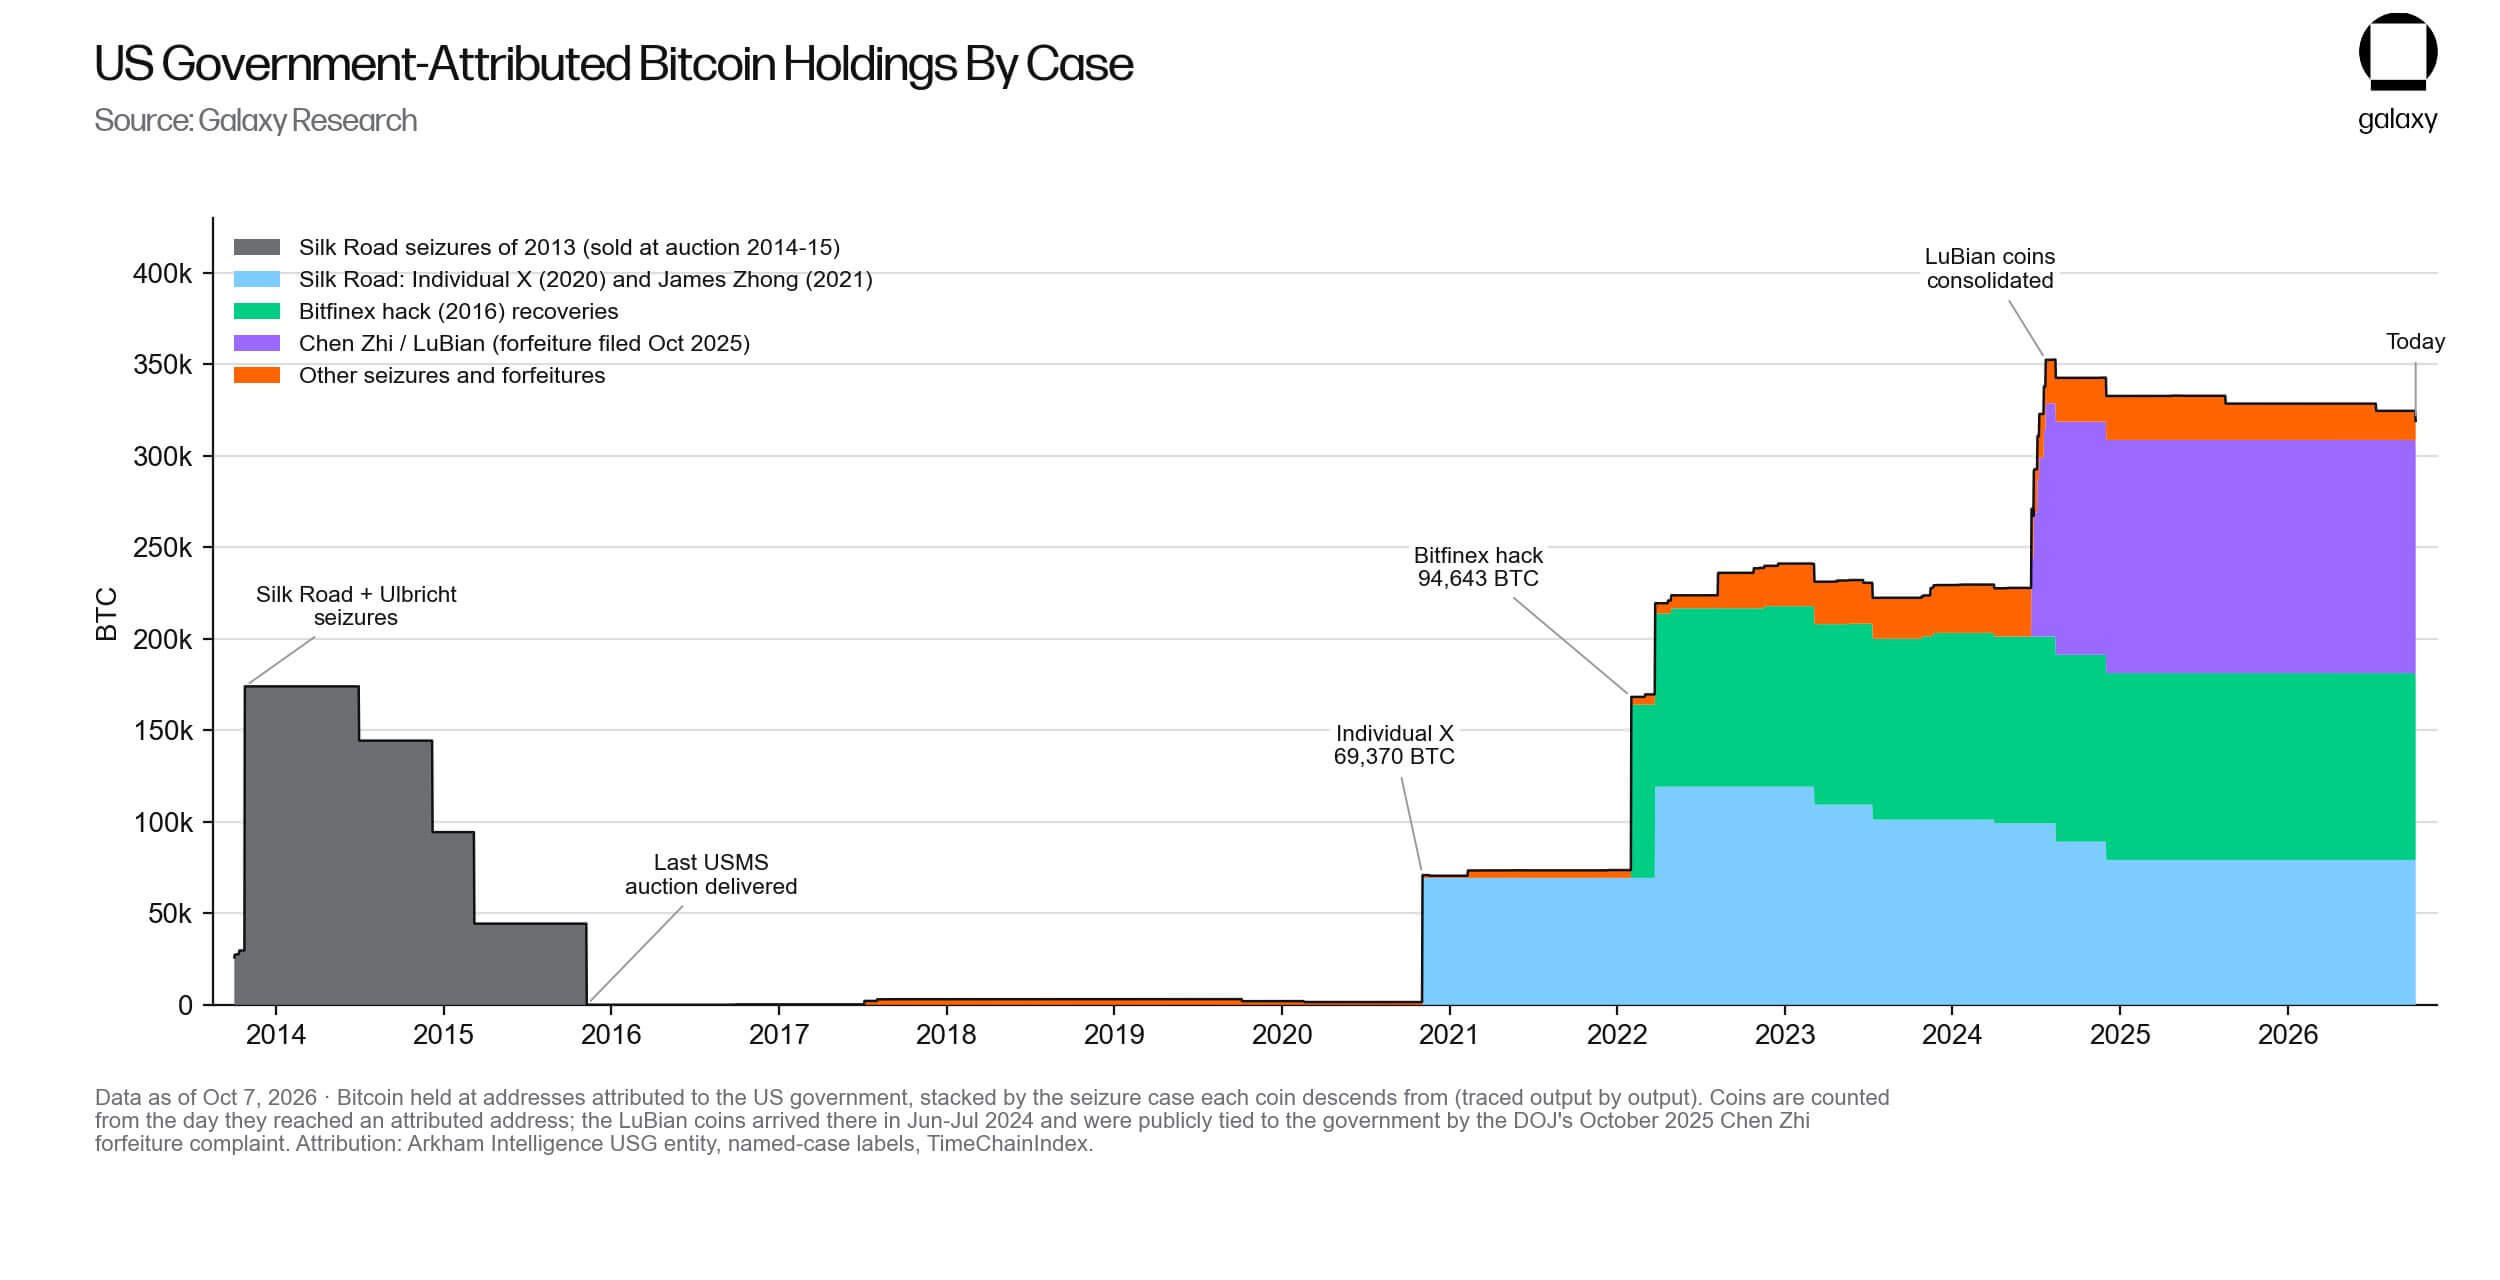
The latest movements add to a series of transactions that have raised questions about Washington's cryptocurrency management practices.
As CryptoSlate previously reported, government-linked wallets had already moved about $470 million in seized digital assets to likely Coinbase Prime addresses, including funds tied to the Bitfinex hack and Alameda Research.
Bitfinex ownership dispute complicates Bitcoin reserve policy
The origin of the latest Bitcoin transfers adds another complication: some of Washington's largest cryptocurrency holdings remain tied to legal proceedings that could ultimately determine whether the government retains them.
Galaxy identified two particularly significant asset groups in its estimate of the government's holdings.
The first consists of approximately 94,643 BTC held in a principal wallet containing assets recovered from the Bitfinex hack. The second involves roughly 127,271 BTC associated with LuBian and Cambodian businessman Chen Zhi.
The Justice Department filed a civil forfeiture complaint in October 2025 seeking to permanently confiscate Bitcoin allegedly connected to cryptocurrency fraud and money laundering.
Together, the two groups represent more than 66% of the government's previously estimated holdings, although their legal status differs from Bitcoin definitively available for federal reserve purposes.
The Bitfinex recovery has faced competing ownership claims.
Federal prosecutors initially proposed returning recovered Bitcoin to the exchange through in-kind restitution. However, an April 2025 federal court ruling awarded Bitfinex no direct restitution in the criminal proceedings and directed competing claims over the forfeited assets into a separate ancillary proceeding.
Some former Bitfinex customers have asserted ownership claims against portions of the recovered cryptocurrency, challenging the exchange's entitlement to the full amount.
Galaxy said the principal Bitfinex recovery wallet, which holds about 94,643 BTC, remained untouched as of its assessment, leaving the latest movement involving another recovery address to be evaluated separately.
The dispute carries implications for President Donald Trump's Strategic Bitcoin Reserve.
Under the March 2025 executive order, Bitcoin finally forfeited to the government and meeting specified eligibility requirements can be transferred into the reserve, where it generally cannot be sold.
The order nevertheless permits certain disposals required by courts or law, including transfers involving verified crime victims and other specified forfeiture obligations.
That distinction means a government-controlled Bitcoin wallet is not automatically treated as part of the Strategic Bitcoin Reserve.
A confirmed sale of qualifying reserve assets outside the order's permitted exceptions would raise questions about compliance with the administration's policy. Transfers made to satisfy legitimate restitution or forfeiture obligations would carry different legal implications.
For the recovered Bitfinex assets, ownership proceedings could determine whether successful claimants receive substantial quantities of Bitcoin or the government retains them.
Meanwhile, where the remaining 3,267 BTC from Thursday's reported movement go, and how the government treats assets already deposited at Coinbase Prime, could provide further evidence of Washington's immediate intentions.
Any subsequent disposal would also renew scrutiny of how federal agencies classify recovered Bitcoin, particularly when assets held in government wallets remain subject to competing claims rather than being available for permanent retention in the reserve.
The post US government moves another $1 billion in Bitcoin as BTC slides $4,000 appeared first on CryptoSlate.
Bitcoin.de is rebuilding its operating model after German regulators rejected its MiCA authorization, forcing it to outsource trading and custody to outside partners.
BaFin refused the application filed by Futurum Bank AG, the Bitcoin.de operator, to become an authorized crypto-asset service provider under the European Union’s Markets in Crypto-Assets (MiCA) regime.
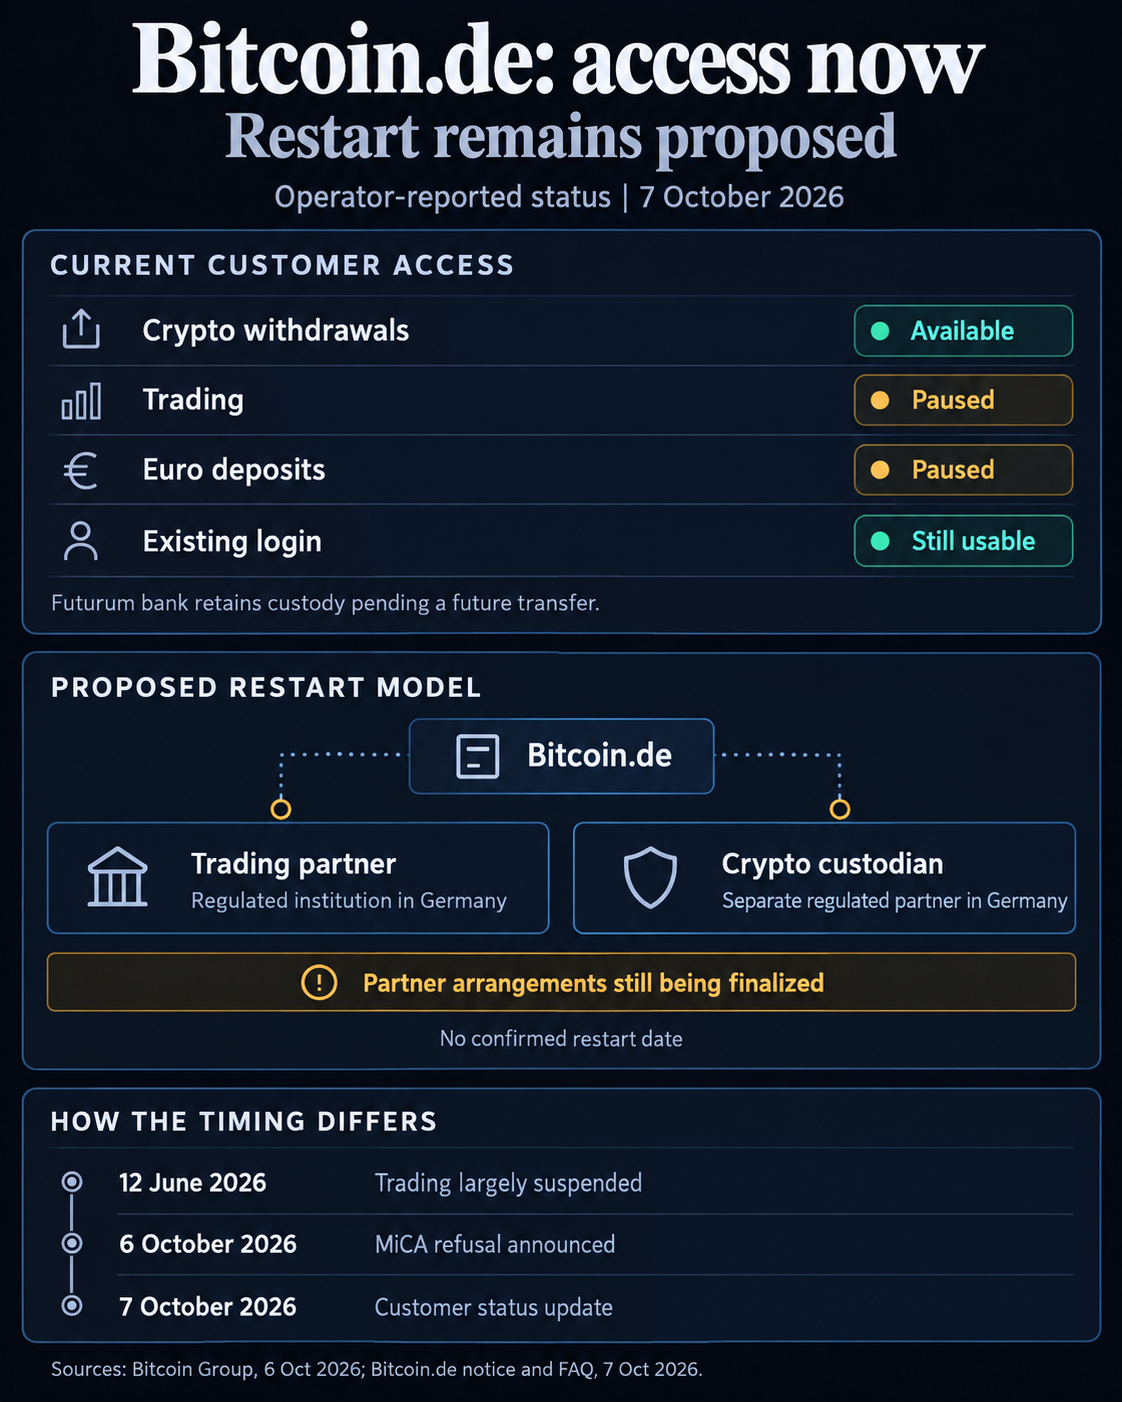
The decision also ended the regulator’s previous tolerance of Futurum Bank’s crypto services, while trading on the platform has already been largely suspended since June 12.
Customers can still withdraw crypto, though trading and euro deposits remain suspended. Futurum Bank will continue holding assets until they are transferred to a new custodian, while existing logins and customer claims remain unaffected.
Bitcoin Group said Futurum Bank had applied for MiCA authorization in June 2025, leaving the process unresolved for more than 15 months.
MiCA rejection forces a structural reset
After BaFin's rejection, the firm's management said it had prepared an alternative structure that would let it move quickly.
As a result, Bitcoin.de plans to keep its platform running through two regulated German institutions, with one acting as customers’ trading counterparty and another taking over crypto custody. The platform would retain its app, brand and customer interface while the licensed partners handle the regulated functions.
The shift would leave Bitcoin.de focused more heavily on technology, distribution and customer relationships, while regulated partners take responsibility for execution and custody. That structure could preserve the marketplace without requiring Futurum Bank itself to perform the activities BaFin declined to authorize.
The company, which says it serves more than 1.1 million customers, has not identified either partner or given a firm date for trading to resume. It said the agreements are being finalized and restoring service remains a priority.
Bitcoin Group and Futurum Bank are still reviewing the regulator’s decision and can object within one month of formal notification. A fresh authorization application also remains possible.
For now, the commercial pressure is on completing the partner agreements before the prolonged trading halt pushes more users elsewhere. Bitcoin.de says the technical work for the relaunch is complete, leaving regulatory implementation as the main barrier to restoring full service.
The next milestones are a restart date, the return of euro deposits and the transfer of customer assets to the new custodian.
The post MiCA rejection forces German crypto platform into operational overhaul appeared first on CryptoSlate.
US spot Bitcoin and Ethereum exchange-traded funds saw their steepest withdrawals in months as the cryptocurrency market continued to decline.
Data from SoSoValue shows that the 12 listed US Bitcoin ETFs lost $484.9 million on Oct. 7, their largest single-day outflow since June 25. BlackRock's iShares Bitcoin Trust (IBIT) led the withdrawals with $207.7 million, followed by Fidelity's FBTC at $105.1 million and ARK 21Shares' ARKB at $101.7 million.
Meanwhile, Ethereum ETFs recorded $160.9 million in withdrawals, bringing their five-session losses to $506.3 million, the largest since January.
BlackRock's ETHA accounted for $116.1 million of Wednesday's redemptions, while Grayscale's ETHE lost $25.8 million. The funds have now experienced seven consecutive trading sessions of outflows, totaling approximately $569 million.
Together, the two ETF categories lost about $646 million on Wednesday as Bitcoin fell to its lowest daily close in the last 20 days, below $83,000, while Ethereum retreated toward $2,500 during the reporting period.
Notably, the price action coincided with rising US Treasury yields, a stronger dollar, and elevated oil prices, adding to pressure on risk assets.
ETF demand was weakening before the latest withdrawals
The latest withdrawals followed signs of weakening institutional demand that Bitfinex analysts had identified before Wednesday's selloff.
In an Oct. 7 report, the analysts noted that Bitcoin ETF flows had become increasingly uneven, with investment slowing sharply after the buying spree that supported September's recovery.
Daily inflows averaged $341.7 million during Bitcoin's mid-September rally from $76,000 to $87,000. However, that figure fell to about $35 million per day over the five trading sessions through Oct. 6, totaling $172.9 million in cumulative net inflows.
The remaining demand was also heavily concentrated in BlackRock's IBIT, which attracted $536.2 million during those five sessions while competing Bitcoin ETFs collectively lost $363.3 million.
That divergence left the market increasingly reliant on a single fund to offset redemptions elsewhere, a source of support that weakened when IBIT joined Wednesday's selling.
The reversal comes as Bitcoin has fallen below the estimated average acquisition price of ETF investors.
Citing Checkonchain data, Bitfinex placed the flow-weighted average ETF cost basis at $84,318. The analysts observed that daily inflows historically moderated toward approximately $65 million as Bitcoin approached investors' aggregate breakeven level.
Wednesday's close under $83,000 has pushed Bitcoin below that threshold, raising the possibility that further declines could prompt additional redemptions as investors seek to limit losses.
Although the estimate does not reflect individual investors' entry prices, it gauges the profitability of capital deployed through the funds.
Ethereum is showing additional signs of weakening demand. Beyond its persistent ETF withdrawals, CryptoSlate previously reported growing demand for short exposure in the derivatives market, with traders holding short positions paying longs through negative perpetual futures funding rates.
The positioning suggests that bearish traders are increasingly willing to incur costs to maintain exposure to further price declines, adding to the pressure reflected in Ethereum ETF redemptions.
Bitfinex also warned that weaker institutional inflows were leaving the broader altcoin market increasingly dependent on capital rotating among existing cryptocurrency positions.
That could leave smaller tokens especially exposed if Bitcoin's decline accelerates, as investors seeking to reduce risk withdraw capital from altcoins instead of rotating into other digital assets.
The post Bitcoin ETFs suffer biggest exodus since June as Ethereum withdrawals hit nine-month high appeared first on CryptoSlate.
MetaMask's precautionary validator exits are turning a roughly $1,000 reward diversion into a test of Ethereum's staking capacity. Lido expects its affected ETH to return gradually to Ethereum staking; the entry backlog was worth about $3.59 billion in the Oct. 7 snapshot.
Lido had expected its final affected validators to exit by the end of October 7. The deadline covers exits, with full withdrawals and re-entry taking longer. The protocol estimates that the complete cycle could take up to about 45 days.
Bitquery measured 0.36 ETH in diverted block tips across 18 blocks on September 30. At the October 7 ETH price used below, that amounts to about $923.
Its October 1 snapshot identified 16,965 MetaMask-operated validators holding 565,056 ETH that had exited or joined the exit queue. MetaMask has not confirmed that total. The company said in its October 1 update that its investigation to date had found no indication wallets or customer funds were affected and described the exits as precautionary.
The larger economic exposure comes from withdrawing and restaking the balances behind the precautionary exits.
Bitquery's two Lido groups held 252,288 ETH, already included in the wider total. Lido expects that portion to return to its protocol; its statement does not establish what every other MetaMask client will do.
An October 5 contributor proposal would stop new deposit allocations to MetaMask operators in Lido's two curated modules. The forum describes calls intended for the next on-chain vote, without confirming adoption. Return to the protocol does not guarantee return to the same operator.
What a $5 billion workload would mean
Validator Queue showed 1,398,922 ETH awaiting entry at about 14:18 UTC on October 7, with an estimated wait of 24 days and seven hours. Another 822,405 ETH awaited exit. About 43.7 million ETH, or 35.78% of supply, was staked.
The dashboard's entry limit was 256 ETH per 6.4-minute epoch, equivalent to 57,600 ETH a day. At that throughput, fully restaking the identified Lido cohort would use 4.4 days of entry capacity. The wider 565,056 ETH cohort represents 9.8 days if all of it seeks fresh activation.
If the entire wider cohort returns as new demand beyond the observed backlog, the static combined workload is 1,963,978 ETH. At ETH's $2,564.19 price observed at the same time, it is worth about $5.04 billion.
The following scenarios hold that backlog fixed and assume returning ETH is entirely additional to it:
| Hypothetical net new return | Combined workload (ETH) | Value | Capacity days | Added capacity days |
|---|---|---|---|---|
| None: observed backlog | 1,398,922 | $3.59 billion | 24.29 | 0 |
| 25% of wider cohort | 1,540,186 | $3.95 billion | 26.74 | 2.45 |
| 50% of wider cohort | 1,681,450 | $4.31 billion | 29.19 | 4.91 |
| 75% of wider cohort | 1,822,714 | $4.67 billion | 31.64 | 7.36 |
| 100% of wider cohort | 1,963,978 | $5.04 billion | 34.10 | 9.81 |
Actual delays depend on the backlog clearing, the pace of Lido's gradual return and other deposits. How much of the wider cohort has already returned or is included in the entry queue remains unknown.
Ethereum's exit and activation queues are independent. Leaving does not directly consume entry capacity. The pressure on onboarding arises when withdrawn ETH is deposited again alongside other demand.
The cost depends on time spent inactive
Validators can keep earning while waiting to exit if they remain online and perform their duties. Rewards cease at the exit epoch; shutting down earlier can incur losses or penalties. Lido has warned of foregone rewards and possible downtime penalties.
Using the dashboard's 2.59% APR and the same ETH price, if the entire wider cohort were inactive, it would forgo about $1.54 million over 15 inactive days, $3.08 million over 30, or $4.63 million over 45. For the included Lido portion, those figures are about $0.69 million, $1.38 million and $2.07 million.
These simple-return estimates assume constant price and APR and exclude fees and alternative earnings. They model time spent inactive; actual incident losses depend on how long each validator stops earning during the exit, withdrawal and re-entry cycle.
CryptoSlate's October 1 coverage established the exit backlog. The recovery now depends on completed withdrawals, subsequent deposits and how much returning stake reaches the entry queue as new demand. Whether those deposits and other demand exceed 57,600 ETH a day will determine how quickly the entry backlog clears.
The post A $1,000 MetaMask incident could turn Ethereum’s staking queue into a $5 billion traffic jam appeared first on CryptoSlate.
CryptoTicker.io
Kraken is removing 14 more crypto assets. Trading in them ends on October 23, 2026 at 4 p.m. German time, withdrawals stay open until January 29, 2027, and after that the exchange liquidates whatever is still sitting in customer accounts. If you hold one of these tokens, two doors are open to you: sell while trading is still running, or withdraw while the payout window is still open. Let both pass and you end up with whatever the forced liquidation leaves behind, and Kraken itself writes that this proceed may be "significantly below recent reference prices" and "in some cases minimal or zero".
The affected tickers are BMB, ELX, APU, BDXN, DUCK, BOS, U, OBOL, IDEX, FIS, COPM, UXLINK, ALTHEA and NOBODY. Eleven of them have a euro pair on Kraken, which puts them directly in the accounts of European investors. We looked at how much is actually still traded in those euro pairs and which token can still be bought somewhere else after the cut-off date. The answer changes the order of the steps for several of the 14 assets.
The 14 crypto assets Kraken is removing on October 23
The exchange names fourteen tickers in its notice: BMB (Beamable), ELX (Elixir), APU (Apu Apustaja), BDXN (Bondex), DUCK (DuckChain), BOS (BitcoinOS), U, OBOL (Obol), IDEX, FIS (StaFi), COPM, UXLINK, ALTHEA and NOBODY. The notice carries an October 7 date, so it is current, and for that date it is the only authoritative source there is: an exchange decides for itself what it lists, and announces it on its own help page.
Delisting does not mean a token disappears. It continues to exist on its blockchain exactly as before. What disappears is only the one place where you could buy, sell and store it at Kraken. That distinction carries the whole decision you now face: from here on, the value of your holding depends on whether another trading venue exists, not on whether Kraken still lists it.
The mix is typical of a removal cycle. It includes two meme tokens, a staking protocol, a bridge infrastructure, an older decentralised exchange and several projects whose trading volume has melted away over months. Kraken does not justify each choice individually in the notice, but does point explicitly to "limited or inactive markets" for several of the assets.
Three dates, three consequences: trading halt, withdrawal deadline and forced liquidation
The sequence is staggered, and each of the three dates takes a different option away from you:
- October 23, 2026, 4 p.m. German time: deposits and trading are switched off. From that moment you can no longer sell the tokens at Kraken, nor deposit any more. Your holding stays visible in the account.
- January 29, 2027, 4 p.m. German time: withdrawals are switched off. Until then you can still send the tokens to your own wallet or to another exchange. After that you cannot reach them at all.
- February 1 to 12, 2027: Kraken liquidates all remaining holdings automatically and credits the proceeds.
A good three months sit between the first date and the second. That span is the real buffer, and it is routinely underestimated because the first date is so much closer. After October 23 you are not in trouble, you have only lost the option to sell at Kraken. The exchange itself advises moving affected holdings out "as early as possible", and for the assets with thin markets that is more than boilerplate.
We described what the last stage of this sequence looks like in practice during the previous cycle: how forced liquidation works at Kraken explains the mechanics step by step.
Eleven of the 14 tokens have a euro pair on Kraken
For European investors the first question is whether the token trades against the euro at all, or only against the dollar. A look at Kraken's trading pair list on Wednesday midday shows that eleven of the 14 assets have a euro pair, namely ELX, APU, BDXN, DUCK, BOS, U, OBOL, IDEX, FIS, ALTHEA and NOBODY. Only BMB, COPM and UXLINK trade exclusively against the dollar.
One detail stands out: the euro pair for BOS is already set to post only. In that state the exchange accepts only orders that will not execute immediately. Selling at the market price is therefore already impossible there, even though the official trading halt does not take effect until the end of October. If you wanted to sell BOS against the euro, you have to go through the dollar pair or withdraw the token.
All ten remaining euro pairs were still trading normally on Wednesday. That is the good news at this point, because it means the selling door is technically open. How far open it really stands only becomes clear in the next section.

22,300 euros in 24 hours: how thin the euro pairs really are
We added up a full trading day's turnover for all eleven euro pairs, as of Wednesday, October 8. Together they came to roughly 22,300 euros, spread across 436 individual trades. For comparison: that is the daily take of a single busy market stall, divided across eleven trading pairs on one of Europe's largest crypto exchanges.
The distribution behind that figure is even more lopsided than the total. The strongest pair, APU against the euro, contributed roughly 12,300 euros on its own, more than half. Behind it come BDXN at around 2,600 euros and FIS at around 2,550 euros. At the other end sits OBOL against the euro with about twelve euros of turnover from five trades across an entire day. BOS against the euro recorded not a single one.
These numbers answer the question behind every delisting notice: can I get rid of my holding at all before trading closes? In a pair where five trades come together in a day, a sale of a few hundred euros is no longer something that goes through at the quoted price. A larger order eats its way down the order book, and the closer October 23 comes, the more sellers meet the same thin demand. So if you plan to sell, sell early and in parts rather than dumping everything on the final day.
Which exchange is suitable for the move depends less on the name than on whether the token is listed there at all and whether the exchange is licensed in the EU. Our crypto exchange comparison ranks the providers by fees, licensing and withdrawal routes.
What forced liquidation means and why the proceeds can be "minimal or zero"
Forced liquidation means the exchange sells your remaining holding without your involvement and credits you the proceeds. Kraken has scheduled this for the period from February 1 to 12, 2027. Formally, then, you do get money, and that is exactly what misleads people.
Kraken itself puts it unusually plainly in the notice: the proceeds may be "significantly below recent reference prices" and "in some cases minimal or zero", because several of these assets have "limited or inactive markets". The figures from the previous section show why. When twelve euros change hands in a pair on a normal day, there will be no buyer in February 2027 who takes over the pooled remaining holdings of every customer at the quoted price. In that situation the price on your account overview is an accounting figure, not a price you can actually realise.
There is also a timing effect that is easy to overlook: the liquidation falls in February 2027, and therefore in a different tax year than a sale in October 2026. What that means for you is covered in the tax section further down.
U and COPM: why two of the 14 assets cannot be pinned down cleanly
For twelve of the fourteen tokens, market value, daily turnover and trading venues can be assigned unambiguously through the usual market data sites. For U and COPM that does not work, and that is a signal rather than an omission.
Several projects use the ticker "U". A search for it leads to a token with a market value in the billions that has nothing to do with the asset traded at Kraken. Kraken's own price for U stood at $0.000262 on Wednesday. At the unit volumes traded there, that works out to a daily turnover in the low four-figure dollar range. A micro-cap, in other words, not a billion-dollar project. For COPM the price is $0.00030 and the daily turnover under a thousand dollars.
The practical lesson is a simple one: with small-cap assets, always check the contract address and not the ticker before you send a token anywhere. Two projects sharing the same ticker is the rule in crypto markets, not the exception, and a transfer to the wrong contract address cannot be reversed.

ALTHEA, BMB and NOBODY: three tokens have no second centralised exchange
The follow-up question after every delisting is: where to, then? For the twelve assets that can be identified we checked which trading venues still listed them on Wednesday. For nine of them the answer is reassuring; for three it is not.
- ALTHEA is currently listed at exactly one trading venue, and that is Kraken. After October 23 no public market remains for this token at all, neither centralised nor decentralised.
- BMB and NOBODY each sit at two venues: Kraken and one decentralised exchange. Once Kraken drops out, the only route left runs through a decentralised exchange with your own wallet.
- ELX has a second centralised exchange in Gate, and DUCK likewise. IDEX, FIS and UXLINK reach three centralised venues, BDXN four, OBOL and BOS five. APU, with thirteen trading venues, is the broadest asset in the field.
That produces a clear order of priority. With ALTHEA you decide before October 23 whether to sell the holding at Kraken or keep it afterwards as a pure blockchain position with no market access. With BMB and NOBODY you have to plan a token move to your own wallet if you want to hold them, because the route via a decentralised exchange necessarily runs through a wallet you control yourself. For the other eight, a transfer to an exchange that already lists the asset is enough.
We already worked through exactly this gap between "removed" and "not tradable anywhere else" during the 21-token cycle in September: 16 of 21 Kraken assets had no fallback exchange at the time. At three out of twelve, the October cycle is considerably milder.
Your own wallet or another exchange: the difference for the holding period
There are two routes for the move, and they differ in effort, risk and tax treatment.
The route to another exchange is the more convenient one. You need a verified account there, the right deposit address and the correct network. The most common and most expensive mistake is the wrong network: a token issued on Ethereum is lost if you send it to an address on a different chain. So always send a small test amount first, and the rest only after it arrives. Check as well whether the destination exchange holds an EU licence, because with a provider lacking European authorisation you carry the enforcement risk alone in a dispute.
The route to your own wallet is the only one that preserves your ability to trade for BMB, NOBODY and every other asset with a decentralised market. It asks more of you: you hold the access yourself, and a lost recovery phrase means total loss. Which devices are suitable and what they cost is set out in our hardware wallet comparison.
For tax purposes both routes are identical and harmless: a transfer between accounts and wallets that belong to you is not a disposal. The holding period continues unbroken and the acquisition date stays the same. All that matters is that you document the transfer, so that you can later prove to the tax office that no sale took place here.
Sale, transfer and forced liquidation: the tax consequences under section 23 of the Income Tax Act
In Germany, crypto assets count as other assets. A sale within one year of purchase is a private disposal under section 23 of the Income Tax Act; once a year has passed the gain remains tax-free. For gains inside that window an exemption threshold of 1,000 euros per year has applied since 2024: stay below it and you pay nothing, go above it and the entire amount is taxable.
That leaves three distinct situations for the 14 removed assets:
- Selling at Kraken up to October 23, 2026. If you have held the token for less than a year, the result counts towards the 2026 tax year. For most of these small-cap assets that will be a loss, and losses from private disposals can be offset against gains from other private disposals in the same year. So if you realised gains inside the one-year window elsewhere in 2026, a sale now may well be worth using.
- Transferring to your own wallet or another exchange. Not a taxable event; the holding period keeps running. You postpone the decision without triggering anything for tax.
- Forced liquidation in February 2027. This counts as a disposal as well, but it falls in the 2027 tax year and at a price you do not set. If you want to offset a loss deliberately in the current year, do not wait for it.
Each of these situations needs documentation: acquisition date, acquisition cost and the transaction itself. Kraken makes the trading history available for export, and you should pull it before the account ends rather than after. A portfolio tracker takes the matching work off your hands by merging exchange exports and wallet addresses into one continuous history. For larger amounts or an unclear acquisition history, a tax adviser is the better investment than any piece of software.
July, August, October: three Kraken cycles running with their own deadlines
This cycle is not the only one currently running, and the deadlines are easy to mix up. Kraken has announced several removal rounds since the summer; they are being processed in parallel and each carries its own cut-off dates.
The July cycle and the August cycle covered 21 assets each; their withdrawal deadlines fall in November and December 2026. We described what the August cycle looks like in an individual case using one affected token: withdrawals for VANRY are already blocked. There is no September cycle; no separate notice falls in that month. The trading halt on September 11 belonged to the previous cycle, which we reported on here: Kraken removes 21 tokens.
So always check which cycle your token belongs to before you write down a deadline. October 23 applies exclusively to the fourteen tickers named here. An asset from an earlier round may well have a different cut-off date, and a glance at the exchange's notice costs less time than a missed withdrawal.
The full breakdown with all three dates is in Kraken's own notice on the October cycle.
Kraken delisting: after October 23, withdrawal is the only option
The selling door closes on October 23, the withdrawal door only on January 29. Miss the first and you lose the choice of price; miss the second and you lose access altogether. Work through it in this order:
- Check your holdings and decide, by October 23. Look in your Kraken account to see whether any of the fourteen assets is in there. If you decide to sell, place the order early, and in parts for the thin pairs. You will find another exchange for the later move in the exchange comparison.
- Prepare the move, by mid-January at the latest. Set up the destination account or the wallet, check network and address, send a test amount and only then the rest. Which providers hold an EU licence is shown in our overview of regulated exchanges; for the route into self-custody, the hardware wallet comparison helps.
- Secure your records before the account is empty. Export the trading history as a file from your account and assign an acquisition date and cost to every position. A tax tool brings exchange exports and wallet addresses together and saves you the manual work in the spring.
A total loss is possible with small-cap assets of this size, even without anyone making a mistake. A market in which five trades come together in a day can stop existing altogether at any time.
(As of October 8, 2026. This article is not investment advice. Prices and fee structures change; check the terms with the provider before you buy.)
Crypto Crash Reason Hunt: What Actually Happened Today?
The crypto market is deep in the red on Thursday, 8 October 2026, and almost nothing in the top 13 escaped. $Bitcoin is trading at $80,986, down 2.9% in 24 hours, 3.7% over seven days and now 7.5% below where it started the year. Total Bitcoin market cap has slipped to $1.62 trillion.
Altcoins took the harder hit. $Ethereum is at $2,432 after a 5.3% daily drop and a brutal 9.3% weekly slide, pushing its year-to-date loss to 18%. XRP is down 6.2% on the day and 27% for the year. Solana sits at $108, Dogecoin at $0.083, and Chainlink lost 7.9% in a single session. Even Zcash, the year's breakout privacy coin, gave back 15.6% in 24 hours and 18.6% on the week, though it remains up 119% since January.
The only green on the board is the stablecoin pair, with USDT and USDC flat as expected. That pattern, with Bitcoin falling less than everything around it, is the classic signature of a risk-off rotation rather than a Bitcoin-specific problem. So what is the crypto crash reason this time? There is not one answer but three, and they stack on top of each other. You can track all of these prices live on the CryptoTicker crypto prices page.
Crypto Crash Reason #1: Did the Fed Just Kill the Rate Cut Dream?
The biggest crypto crash reason sits in Washington, not on a trading screen. The Federal Reserve raised its target range by 25 basis points to 3.75% to 4.00% on 16 September, and the minutes of that meeting landed on Wednesday, 7 October. The message was not what risk assets wanted to hear: most participants expect another hike to be appropriate before year-end, depending on incoming data.
That single line reframes the whole year. Markets had spent months treating the September move as a one-off. The minutes suggest it could be the start of a tightening cycle instead. HashKey Group researcher Tim Sun warned that a second hike in October would make investors read September as the opening act rather than a blip.
Higher rates hit crypto through two channels. First, Treasury yields rise, and a risk-free 4%+ return makes a volatile, zero-yield asset like Bitcoin less attractive by comparison. Second, the dollar strengthens, and Bitcoin has historically moved inversely to the greenback. Add elevated oil prices driven by renewed US and Iran tensions, which feed inflation expectations and reinforce the case for tighter policy, and you get the macro cocktail that pushed every asset on your screen into the red.
The next checkpoints are already circled: the US CPI print on 14 October and the FOMC meeting on 27 and 28 October. Until those pass, the market is trading the fear of a hike as much as the hike itself.
Crypto Crash Reason #2: How Did Half a Billion in Leverage Vanish in 20 Minutes?
The macro news explains the direction. Leverage explains the speed. Bitcoin spent the first week of October trapped between $83,000 and $87,000, failing at the top of that range again and again. Each rejection stacked more leveraged long positions underneath the market, and traders kept betting on an Uptober breakout that never came.
On Friday, 3 October, a rejection at $87,000 wiped out $433 million in positions. Then early on Wednesday, 7 October, Bitcoin dropped roughly $1,765 in about 20 minutes, from $85,341 to $83,790, taking more than $400 million in longs with it in a single hour. Over the full 24 hours, CoinGlass counted around $546 million in liquidations across the market, with 88% of them longs and more than 100,000 traders wiped out.
This is what analysts call a leverage flush. LVRG Research's Dan Khus described it as crowded long bets being mechanically forced out rather than a genuine change in trend. The important detail from Bitfinex is that open interest stayed stable even as longs were liquidated, which means fresh short positions were opening at the same pace. The market did not just deleverage. It flipped net short.
The timing adds a psychological layer. Friday, 10 October, marks one year since the largest liquidation day in crypto history, and traders remember it. Liquidation heatmaps had already flagged a dense cluster of leveraged longs near $82,600 before Wednesday's drop. Thursday's slide to $80,986 ran straight through it, which is exactly why the second leg down was so sharp.
Crypto Crash Reason #3: Why Are ETFs and Uncle Sam Both Selling?
The third crypto crash reason is about who is on the other side of the trade. For most of 2026, spot Bitcoin ETFs have been the structural buyer that absorbed every dip. In late September they were still pulling in nearly $1 billion in a single day. That bid has now reversed.
US spot Bitcoin ETFs recorded roughly $487 million in net outflows on 7 October, their heaviest single-day withdrawal in weeks, according to SoSoValue data. ARK 21Shares and Fidelity led the redemptions, while BlackRock's IBIT was the only major fund still attracting money. Ethereum ETFs are bleeding too, with about $161 million leaving on the same day. When the institutional buyer steps back at the exact moment leveraged longs are being liquidated, there is nobody left to catch the falling knife.
On top of that came an unwelcome on-chain signal. Arkham data shows wallets linked to the US government moved more than 11,000 BTC, worth roughly $900 million at current prices, to Coinbase Prime over two days. Transfers to an exchange do not automatically mean a sale, but the market has learned to treat government wallet activity as a selling risk, and it reacted accordingly.
None of these three reasons would have produced a crash on its own. A hawkish Fed with no leverage in the system is a slow grind. A leverage flush with ETFs still buying is a 20-minute wick that recovers. It is the combination that turned a pullback into Thursday's broad-based selloff.
Crypto Crash Reason for Altcoins: Why Did Ethereum and XRP Fall Twice as Hard?
Look at the 24-hour column on your market table and a pattern jumps out. Bitcoin lost 2.9%. Ethereum lost 5.3%, XRP 6.2%, Solana 7.0%, Dogecoin 7.0%, Chainlink 7.9%. Almost every major altcoin fell roughly twice as far as Bitcoin, and the gap is even wider on the weekly and year-to-date numbers.
There are three mechanical reasons for this. Altcoins have thinner order books, so the same dollar amount of selling moves the price further. Altcoin perpetual markets carry proportionally more retail leverage, so liquidation cascades hit harder. And in a risk-off rotation, capital does not just leave crypto; it also consolidates within crypto, flowing from smaller tokens into Bitcoin and stablecoins first. Bitcoin dominance rises during a crash precisely because it is treated as the least risky crypto asset.
Ethereum carries an extra burden. ETH is now down 18% on the year while Bitcoin is down only 7.5%, and the ETH ETF outflows on Wednesday were proportionally larger than Bitcoin's. XRP, down 27% year-to-date, has been losing the $1.50 battle for weeks and failed there again before this drop. For anyone looking for the altcoin-specific crypto crash reason, it is simple: altcoins never built the institutional floor that Bitcoin did, so when that floor cracks, they fall through it faster. Track the dominance shift on the CryptoTicker charts page.
Which Coins Are Beating the Crypto Crash in 2026?
Not everything on the board is a loser. Four names in the top 13 are still green on the year, and they tell you where the market's conviction actually lives.
$Hyperliquid is the standout at +228% year-to-date, even after a 5.9% daily drop. HYPE is the native token of the dominant on-chain perpetuals exchange, and ironically a leverage flush is good for its business: more liquidations mean more fees.
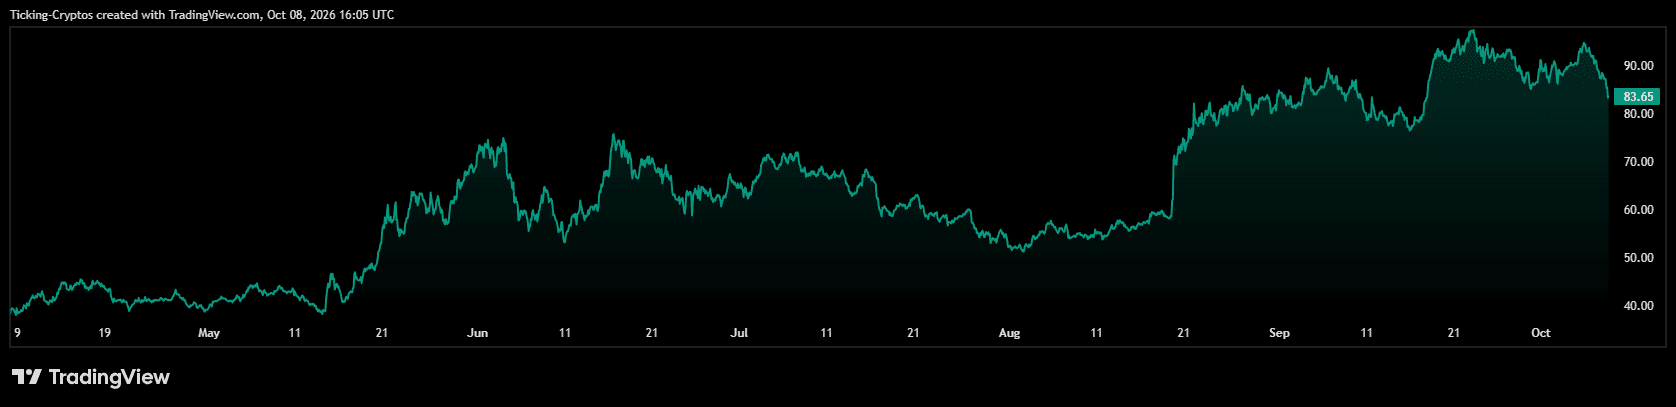
$Zcash is up 119% in 2026 on the privacy coin revival, though it is also the most volatile name here with an 18.6% weekly drop, a reminder that what rallies hardest also corrects hardest.
$Monero, the other privacy heavyweight, is up 22% and fell just 2.2% on the week, the smallest decline of any non-stablecoin in the table.
$TRON rounds out the list at +17% and down only 0.7% on the day. TRX benefits from stablecoin settlement volume, which does not care whether the market is up or down, and that makes it behave like a defensive asset in a crash.
The common thread is clear. The coins that held up are the ones with real, measurable revenue or a strong narrative independent of Bitcoin's price. The coins that fell hardest are the ones whose main story was "beta to Bitcoin." That is worth remembering the next time someone asks what the crypto crash reason is for their particular bag.
Dogecoin costs around $0.087 on Thursday afternoon. That puts the price 1.3 percent below the previous day and 8.1 percent below where it stood a week ago. The more important number is not on the price ticker but in the blockchain: over the past 24 hours, 13.55 million new Dogecoin came into existence, every day anew, with no cap and no end. This article works out what that issuance costs a holder, and which checks in Germany hang on it.
Dogecoin Price Now: $0.087 and 8.1 Percent Down Over Seven Days
On Thursday, October 8, Dogecoin trades at $0.0870. The day's range ran from $0.0852 to $0.0897, measured against data from the exchange OKX. Over seven days that is a loss of 8.1 percent, and over 30 days one of 2.7 percent. A week ago the price still stood at about $0.0946.
Market capitalisation comes to $13.62 billion. The price is 88.1 percent away from the all-time high of $0.7316 reached on May 7, 2021. Trading volume on OKX added up to 421.2 million DOGE within one day, equivalent to $36.9 million.
Reading only these figures, you see a quiet downtrend in a weak overall market. Bitcoin lost 2.0 percent in the same period and Ethereum 6.5 percent. Dogecoin therefore falls harder than both, and there is a structural reason for that which has nothing to do with the state of the day.
13.55 Million New DOGE per Day: How the Issuance Works
Dogecoin is mined, much like Bitcoin, but under different rules. Every block rewards the miner with 10,000 DOGE. The target time between two blocks is one minute, which arithmetically yields 14.4 million new coins a day.
Over the past 24 hours the miners found 1,355 blocks, somewhat fewer than the 1,440 of the target. The actual block time was 1.06 minutes. That gives 13.55 million new DOGE, worth around $1.18 million at the current price. The chain data comes from the block explorer Blockchair, and the most recent block carries the height 6,548,803.
By comparison, 17,896 transactions moved across the chain in the same period. That works out at roughly 757 freshly created DOGE for every transaction. The network's issuance therefore clearly exceeds its use, and it runs on regardless of whether anyone uses Dogecoin or not.
Issuance describes the quantity of new coins a network pays out under fixed rules. The process is neither a sale nor a market event but a protocol operation: the coins come into existence in the block and belong from then on to the miner who found it. Whether they hold or sell them is up to them.
Dogecoin Circulating Supply: Why Two Sources Are 15 Billion DOGE Apart
At this point the data gets messy, and that belongs in an honest article. The chain itself shows a circulating supply of 171.95 billion DOGE. The data service CoinGecko, by contrast, puts it at 156.24 billion. Between the two figures yawns a gap of 15.7 billion coins, around ten percent.
The difference arises because aggregators make assumptions of their own, for instance about lost or permanently unmoved balances, while the block explorer simply adds up what the protocol has paid out. Which number is the right one cannot be decided from outside. Only the range is therefore defensible, and that is exactly how this article goes on calculating.

2.9 to 3.2 Percent Dilution a Year: the Calculation for Holders
Extrapolated over a year, 13.55 million DOGE a day amounts to around 4.95 billion new coins. Measured against the chain's circulating supply that is 2.88 percent, and measured against the CoinGecko figure 3.17 percent. The honest statement is therefore: between 2.9 and 3.2 percent a year.
What does that range mean concretely? Anyone holding 10,000 DOGE today holds roughly 0.0000064 percent of all coins. In a year's time, with the same number of coins, it is only around 0.0000062 percent. The share shrinks although not a single coin was sold.
Counted in dollars, the market has to muster around $430 million in new demand every year just for the price to stand still. Daily that is $1.18 million, which corresponds to about 3.2 percent of the daily turnover on a large exchange such as OKX. Anyone expecting a stable Dogecoin price is implicitly expecting that inflow to arrive reliably.
Dogecoin Against Bitcoin and Ethereum: Three Issuance Models Compared
The figure alone says little, the comparison says more. Bitcoin has a hard cap of 21 million coins, of which 20.10 million have already been created, so 95.7 percent. The remaining issuance halves every four years and is therefore visibly running out.
Ethereum has no cap in the protocol but two counterweights: part of the transaction fees is destroyed, and anyone staking their coins gets a share of the newly issued quantity back. The circulating supply stands at 122.12 million ETH.
Dogecoin has neither a cap nor a halving nor any fee burning. The 10,000 DOGE per block have been fixed since 2015, as the network's project page describes it. In absolute terms the quantity stays the same, while in relative terms the inflation rate falls slowly, because the circulating supply grows. Going from three to under two percent will take roughly another two decades at this pace, though.
| Coin | Cap | Annual new issuance | Compensation for holders |
|---|---|---|---|
| Bitcoin | 21 million, 95.7 percent reached | falling, halving every four years | none needed |
| Ethereum | none | variable, partly offset by fee burning | staking |
| Dogecoin | none | around 4.95 billion DOGE, 2.9 to 3.2 percent | none |
No Staking on Dogecoin: the Difference From Ethereum and Solana
Dogecoin runs on proof of work, the same basic mechanism as Bitcoin. New coins go to miners who expend computing power, not to holders. The network's hash rate stood most recently at 3.40 petahashes per second.
Staking means depositing coins in the network to secure transactions and receiving part of the new issuance in return. With Ethereum and Solana the dilution can be offset partly or wholly along this route. With Dogecoin that route does not exist, because the protocol does not provide for it.
So anyone offered a Dogecoin yield somewhere is not getting protocol staking but a lending arrangement: a provider lends your coins on and gives you a share of the interest. You share in that provider's default risk, and it is not the same risk as holding the coin. This difference regularly disappears behind the word staking in advertising.
Holding Period Under Section 23 EStG: What Is Left of the Gain When You Sell Dogecoin
Suppose the calculation above convinces you and you want to reduce your holding. Then in Germany it is the calendar that decides first, not the price. Gains from selling crypto assets held privately fall under private disposal transactions in accordance with Section 23 of the Income Tax Act.
If you sell within a year of buying, the gain is taxable and carries your personal income tax rate. If more than a year lies between purchase and sale, the gain stays tax free. On top of that comes an exemption limit of 1,000 euros a year for all private disposal transactions together. An exemption limit is not an allowance: exceed it by one euro and you pay tax on the full amount, not only on the part above it.
In practice this means: before a sale, check which tranche you are actually selling and when you bought it. Anyone who has bought in instalments over years has holdings on both sides of the one-year line in their portfolio. A portfolio tracker that records purchases with dates settles that question in minutes, while searching through old exchange exports takes an evening.
Whether the one-year period will remain is under political discussion. Nothing has been decided so far, and as long as that is the case, the text of the law applies in its current form.

Buying Dogecoin Under MiCA: How to Recognise a Regulated Exchange
Since the European regulation on markets in crypto-assets took effect, providers addressing retail clients in Germany need authorisation as a crypto-asset service provider. BaFin lists the authorised companies in a public register, and the providers name their authorisation in their legal texts, usually under the imprint or legal notices.
How to recognise an authorised provider: it names the seat of the supervisory authority granting the licence, it holds client funds separately from its own assets, and it issues you an annual statement listing your purchases with date and price. That last point is underestimated until the tax return comes due. An overview of the trading venues authorised here is in the crypto exchange comparison.
Storing Dogecoin: Which Wallet Really Supports the Dogecoin Chain
Dogecoin runs on a chain of its own, not on Ethereum. A wallet that only handles Ethereum standards can do nothing with real DOGE. If you come across a Dogecoin entry in a pure Ethereum wallet, it is a token that tracks the price, and not the coin itself.
For self-custody you need either the project's reference software or a hardware device whose manufacturer explicitly lists the Dogecoin chain. Check that in the device's support list before you buy it, not afterwards.
The fees argue for moving on chain: a Dogecoin transaction most recently cost $0.0100 at the median and $0.0393 on average. Withdrawing from an exchange to your own wallet is therefore not a question of cost with Dogecoin, unlike on some other chains.
Leverage on Dogecoin: a Funding Rate of 0.01 Percent and the Liquidation Risk
Part of Dogecoin trading runs through perpetual futures contracts, known as perpetuals. Their price is tied to the spot price through the funding rate: a payment that flows between buyers and sellers every eight hours, depending on which side is driving the contract away from the spot market.
On OKX this rate stood most recently at 0.01 percent per period, the neutral standard value. Three times a day that makes 0.03 percent, extrapolating to just under eleven percent a year that a long position carries in running costs alone. The exchange's framework allows up to 0.75 percent per period when the market becomes one-sided.
More important than the costs is liquidation. At tenfold leverage a price decline of around ten percent suffices to close the position. Dogecoin has lost 8.1 percent in the past seven days alone, and that in a market without any particular event. Anyone working with leverage should know the relationship between leverage and weekly swing before opening the position; the terms of the trading venues are in the perp DEX comparison.
Levels at $0.085 and $0.09: What the Dogecoin Price Measures Itself Against Now
On the downside the next measured level sits at the daily low of $0.0852. If the price falls below it, the round level of $0.0800 is the next orientation that traders keep in their books.
On the upside the daily high of $0.0897 bounds the range, and behind it stands the round level of $0.0900. The week's starting point of $0.0946 would only be reached if the price gained 8.8 percent. These levels are observation points from the trading of the past few days, not a forecast; a reasoned outlook is carried by the prediction page further down.
Either way, none of these levels changes anything about the calculation in the fourth section. The issuance runs on independently of the price, 13.55 million coins a day, and it is the only part of this article that can be predicted with certainty.
Dogecoin Issuance: 4.9 Billion New DOGE a Year, No Staking
The question in the headline cannot be answered in general terms, but it can be sharpened. Anyone holding Dogecoin for the liquidity and the low fees has reasons that the issuance leaves untouched. Anyone holding it as a long-term store of value is calculating against 2.9 to 3.2 percent dilution a year, without a protocol that gives any of it back. Three steps help with the decision:
- Gather your purchase dates. Establish which of your tranches have already passed the one-year period under Section 23 EStG and which have not. Without that list, every sale is a bet on your own tax assessment. Tools that keep it automatically are in the comparison of crypto tax tools.
- Settle your custody. Check whether your wallet carries the Dogecoin chain itself or only tracks a price. At a median fee of $0.01, moving to your own keys is cheap; suitable devices are listed in the hardware wallet comparison.
- Check your trading venue. If you buy more, do it with a provider authorised under the European regulation and with a usable annual statement. The candidates are in the crypto exchange comparison.
(As of October 8, 2026. This article is not investment advice. Prices and fee structures change; check the terms with the provider before you buy.)
Justin Drake, a researcher at the Ethereum Foundation, wrote on X on October 7, 2026 that artificial intelligence may break the signatures of Bitcoin and Ethereum sooner than a quantum computer will. He called on the industry to plan a “bunker mode” for large holdings: an orderly move to addresses that have never signed a transfer.
The short answer to the question hanging on this: your coins are not under acute threat today. There is no demonstrated attack on the signature scheme, Drake is describing a worst case, and clear objections came out of the cryptography world within hours. The point matters all the same, because it touches a property of blockchains that most holders have never noticed: an address only reveals its public key once something leaves it for the first time. Knowing that, you can lower your risk without haste and without new technology.
“Bunker Mode”: What Justin Drake Wrote on October 7
Drake names a concrete yardstick in his post for what he counts as a break. For him the scheme is broken once a private key can be computed back in about a week on available hardware, for instance on a large cluster of graphics processors. That is a different threshold from the theoretical vulnerability cryptographers have been discussing for years, and it sits considerably lower.
He put the time frame in the formula that in the worst case this is a matter of months, not years. In the original he wrote of a break “in the worst case in months not years”. As the trigger he cited a series of 722 mathematical results that OpenAI had published the Tuesday before. His reasoning for why elliptic curves of all things should be susceptible, he put like this: “Elliptic curves feel especially vulnerable to superintelligence.” Decrypt has documented the wording of the post. Curves carry a rich mathematical structure, and structure is what clever attacks can work their way along. Hash functions are built precisely to offer as little of it as possible.
For Ethereum, Drake announced that he would push for “maximum defensive acceleration” in the switch to hash-based cryptography. He addressed a separate appeal to the custodians: Binance, Bitbank, Robinhood, Bitfinex and Tether should harden their cold storage. That is notable, because together these houses hold a substantial share of traded balances and have been signing from their addresses for years.
ECDSA: the Signature With Which Bitcoin and Ether Authorise Every Transfer
ECDSA stands for Elliptic Curve Digital Signature Algorithm. It is the scheme with which both Bitcoin and Ethereum check whether a transfer comes from the entitled party. Two numbers belong to every account: a private key that only you know, and a public key that can be computed from it. The computation works in one direction only. The public key follows from the private one in fractions of a second, while the reverse path is considered practically impossible as things stand.
That one-way street is the foundation. Were it to fall, anyone knowing an address's public key could derive the private one from it and move the coins. Neither a hardware wallet nor a passphrase nor an exchange with two-factor protection would change anything about that, because the attack would not take place at your device but at the mathematics behind it.
One restriction makes the difference between panic and planning. Your Bitcoin address is not the public key but a hash of it. A hash cannot be computed backwards, not even by a machine that cracks elliptic curves. As long as an address has only ever received, nothing but that hash stands in the blockchain. The public key becomes visible only when you send something away from it for the first time, because the signature carries it along.

Why an Address Becomes Attackable Only Through Its First Transfer
From this mechanism follows a division you can trace on your own holdings. Addresses that have never sent anything count as protected, because their public key sits behind the hash. Addresses that have already sent once count as exposed. There is nothing in between, and the line does not run along the question of how secure your wallet is, but along the question of whether it has already signed.
For Ethereum the picture is worse. There the account itself is derived from the public key, and every interaction with a smart contract involves signing. Anyone who has held Ether for years and swapped, staked or granted an approval even once is sitting on an exposed address. With Bitcoin the position is mixed: anyone who sent their coins to a fresh address once and has only held since then is on the better side.
The practical snag: spending necessarily exposes the address. A wallet you use regularly cannot be kept in the protected state permanently. Drake's proposal therefore targets the holdings that are going to sit still anyway, not the money you trade with. How to separate custody and use cleanly is shown in our hardware wallet comparison, which also ranks the devices by how well they manage several separate accounts under one seed.
Satoshi's Shield: 20,000 Old Addresses Holding 50 BTC Each as the First Target
Drake makes an argument that has drawn little attention in the debate so far and that sounds reassuring for small holders. Around 20,000 exposed addresses are attributed to the inventor of Bitcoin, each holding 50 BTC, the reward of the earliest blocks. These addresses have been untouched for a decade and a half and are visible to everyone.
An attacker who really could break ECDSA would face a question of sequence. Computing time is finite, every key costs about a week on a large cluster by Drake's own estimate, and at the top end of the field sit those twenty thousand addresses with the highest value per attack. He calls this, in effect, a shield: anyone holding less than 50 BTC on one address is not the first target, because the effort pays off better elsewhere.
This shield is a time buffer and not security. It assumes that the attacker thinks economically, that they do not parallelise, and that nobody would rather damage a chain for political reasons than enrich themselves. As a planning figure it serves all the same: it tells you that you have days and weeks to act cleanly, not hours.
Buterin Applies the Brakes: Botched Moves Cost Him More Than All Hacks Combined
The most prominent reaction came from Vitalik Buterin, and it fell into two parts. On substance he agrees with Drake that AI-driven advances in mathematics deserve more attention than the industry has given them so far. On the pace he clearly disagrees. Nobody, he says, should start shoving balances onto new wallets in a hurry today.
He draws his reasoning from his own experience, and it is the strongest argument against acting too fast: by his own account, botched moves have cost him more than all the hacks he has lived through put together. A mistyped destination, a clipboard manipulated by malware, a seed that ends up in a photo while the new wallet is being set up: these mistakes happen in haste, and unlike a mathematical breakthrough they are real today.
There is also a risk that surfaces in every wave of migration. As soon as a headline moves holders to switch, guides, helper services and supposed checking tools appear that harvest precisely what they promise to protect. Signing an approval in such a phase without having read it loses your money to a drainer, not to a superintelligence.
Objection From Cryptography: Coinbase's Chief Cryptographer Sees No Evidence
Yehuda Lindell, who runs cryptography at Coinbase, was more pointed than Buterin. In his own words he sees “no evidence whatsoever” that the assumptions behind elliptic curve cryptography are close to falling. The mathematical advances that AI systems have achieved this year are no argument against ECDSA, he says, because they concern different classes of problem.
Samson Mow, head of the company Jan3, likewise told his readership to stay calm and thought little of the warning. The specialist coverage classified the episode consistently as a risk scenario: OpenAI has presented no practical attack on ECDSA, and Drake's months-long horizon is an upper bound of the conceivable, not a forecast.
What remains notable is that the lines do not sort along the usual camps. In March of this year, after a widely noted paper from Google, Drake himself put the probability of a quantum breakthrough by 2032 at ten percent or more. That he now considers AI the faster route is a sharpening within his own argument, not a reversal.

Hash-Based Signatures: WOTS and SPHINCS as the Goal of the Ethereum Roadmap
The technical answer to the scenario has been on the table for years and is called a hash-based signature. Instead of relying on the structure of elliptic curves, it rests on hash functions alone, on exactly the components Drake considers comparatively robust. Buterin names WOTS and SPHINCS as candidates and argues for avoiding lattice-based schemes where alternatives exist.
What That Means for the Timetable
A switch of this kind is not a software update rolled out overnight. It affects the signature format of every transfer, every wallet, every exchange and every service that builds transactions. With Bitcoin, a change of this magnitude would come about only through a consensus of developers, miners and the industry, and that is exactly where it sticks: proposals that would invalidate old signatures after a deadline meet the charge that they expropriate everyone who does not move in time. The other side counters that unmoved old balances otherwise become a quarry for the first successful attacker.
For you this means the protocol layer will not rescue you in the coming months. What lies in your hands is the choice of the address your holding sits on.
What a Move to a Fresh Address Means for Your Holding Period
At this point a cryptography debate turns into a German tax question, and it is the reason many holders hesitate. The worry runs: if I send my coins to a new address, does the one-year holding period start again, and do I thereby lose the tax exemption on a gain?
The answer is reassuring. A transfer between two wallets that both belong to you is not a sale. No beneficial owner changes, no price is realised, and neither gain nor loss arises. The holding period on your coins therefore runs on as though nothing had happened. The case is different only if you take the detour of a swap for the move, by selling and buying anew: that is a disposal with all the tax consequences.
What really matters with a transfer between your own wallets is the documentation. The tax office sees a transfer in the blockchain and cannot tell whether two of your own wallets or a sale to a stranger stands behind it. So record which address you moved how much from, to which address, and when, and keep the original purchase receipt with it, because that carries the acquisition date that counts. With larger holdings or nested transactions, your tax adviser decides in the end, not a rule of thumb from an article.
Custody at an Exchange, on a Hardware Wallet or in Multisig: Where Your Public Key Sits
Whether you can act at all depends on who holds your keys. If your coins sit at an exchange, you own no address of your own but a claim against the house. Whether its cold storage sits on exposed addresses cannot be told from outside, and it was precisely these houses that Drake's appeal addressed. What is left to you is the choice between trust and self-custody.
With your own wallet the decision is in your hands. Every common hardware wallet generates any number of addresses from a single seed, and one of them can stay untouched while you trade with another. You need no second device and no new seed for that, only a fresh account in the software you already use.
With multisig constructions a closer look pays off, because several public keys are in play there and the setup alone can expose them. Anyone running such a solution should look at which of the participating keys have already signed.
Old Bitcoin Addresses: as Long as No Signature Is Out There, Time Remains
The finding of this day is unspectacular and therefore usable: a break of ECDSA has not occurred, has not been demonstrated and, in the judgement of several cryptographers, is not foreseeable either. What has occurred is an occasion to take a look at which addresses your own money sits on. That work costs half an hour, is useful for every future risk, and can be done without any haste at all.
- Look at which of your addresses have already sent. Every blockchain explorer shows you the outgoing transactions for an address. If none is to be seen there, your public key sits behind a hash. If you have no address of your own at all because everything sits at an exchange, the first step is the decision about custody: which software solutions are suited to it is set out in our software wallet comparison.
- Set up a separate account for the part that stays put. Separate the holding you do not touch from the one you trade with, and move it in a single, calmly checked operation to an address that has never signed. Document the date, the amount and both addresses while you are at it; a portfolio tracker takes that off your hands, and which of them carry the holding period correctly is in our overview of tax tools and portfolio trackers.
- Let your exchange know you are watching. If a substantial part of your holding sits at a trading venue, the question about its custody practice is a fair one, and it will be asked more often. How the large houses stand on custody, regulation and transparency is shown in our overview of the best crypto exchanges.
What remains is the sentence that sticks from this week, and it comes not from Drake but from Buterin: the most expensive part of a move is almost never the attack it is meant to protect against.
(As of October 8, 2026. This article is not investment advice. Prices and fee structures change; check the terms with the provider before you buy.)
The US central bank published the minutes of its September 15 and 16 meeting on October 7. They contain the sentence the crypto market has been pricing in since Wednesday evening: most participants considered a further increase in the target range for the federal funds rate by the end of the year to be appropriate. Bitcoin stood at $82,439, or 73,739 euros, on Thursday midday, down 1.51 percent within 24 hours.
What has changed since last week is not the price but the direction of expectations. At the start of October many market participants still read the weak US labour market report as an argument for a pause. The minutes now show that the majority on the committee thought otherwise in September. For holders in Germany, three very concrete things hang on this: the distance to liquidation on leveraged positions, the holding period for tax, and the question of where the coins sit.
The Fed Minutes of October 7: a Majority Considers a Further Rate Hike by Year-End Appropriate
The minutes of an FOMC meeting appear around three weeks after the meeting and are the most detailed public document on the committee's stance. They are neither a forecast nor a commitment, but a summary of the discussion.
The decisive passage, in the Fed's own wording, is that most participants judged a further increase in the target range by the end of the year to be likely appropriate. Alongside it, the document records that participants approach every meeting with an open outcome and that their decision depends on the incoming data. Both sentences belong together, and reading only the first overstates how far the committee has committed itself.
What the Minutes Say About Inflation
On prices the minutes note that inflation remains elevated relative to the committee's two percent objective. At the same time, market-based and survey-based expectations for the medium and longer term stood at levels consistent with precisely that objective. The central bank therefore sees a current price problem but no unanchored expectations. That is why the rest of the document is worded so cautiously.
Federal Funds Rate at 3.75 to 4.00 Percent: What the Unanimous 12-0 Decision of September 16 Tells You
On September 16 the committee raised the target range by a quarter point to 3.75 to 4.00 percent. The minutes record that all members agreed; the vote went 12 to 0, with no dissent.
A unanimous increase is a stronger signal than a narrow one. It means that the members who understood the step more as a precaution went along with it too. Both readings sat side by side in the discussion: some participants saw the September step as insurance against a risk, others as the beginning of a tightening cycle. That difference is the reason the minutes do not lay down a path.

Bitcoin at $82,439: the 24-Hour Range Between $82,318 and $83,713
On Thursday midday, Bitcoin stands at $82,439, or 73,739 euros. The daily low is $82,318 and the daily high $83,713. Over seven days that makes a loss of 1.28 percent, and within 24 hours one of 1.51 percent.
The range of around $1,400 between low and high is remarkably narrow for a day without a crypto event of its own, and it argues against a panic move. According to the specialist service bitcoinbasis.de, the price had already fallen on October 7 from around $85,500 to roughly $83,900, steadied briefly at about $83,400 after the release at 8 p.m. German time, and eased to around $82,800 by Thursday morning. The larger part of the move therefore ran ahead of the document, not after it.
Ethereum follows the pattern more weakly: Ether trades at $2,535.89, or 2,268.27 euros, in the same reading, down 1.64 percent in 24 hours and down 5.19 percent over seven days.
Real Interest Rates and Opportunity Cost: the Term That Ties Bitcoin to the Central Bank
The real interest rate is the nominal rate less expected inflation. It describes what an investor keeps after the loss of purchasing power when putting money into an interest-bearing investment instead of an asset that pays no interest.
This is exactly where a document from Washington connects to a Bitcoin holding in a German portfolio. Bitcoin pays neither interest nor a dividend. When the real interest rate rises, the amount a holder forgoes grows, and that opportunity cost is the channel through which rate policy works on the price. It is also why the market reacts more strongly to minutes than to many project-specific news items.
Why Minutes Move More Than an Analyst's Voice
A rate decision is already priced in the moment it is taken. What is new each time is the information about the next step, and the minutes deliver that. A price target from a research house, by contrast, changes nothing about opportunity cost.
Futures Markets Against the Minutes: an October Pause and a December Hike as the Base Case
The minutes describe the September meeting. The futures markets trade the future, and they contradict it in part. The available analyses cite different figures: FXStreet reports expectations for an October hike having fallen below 22 percent, while the provider Raisin cites a hold probability of around 81 percent for the October meeting, against roughly 54 percent a month earlier. The two values measure different questions and cannot be set against each other directly; they nevertheless point the same way.
Then there is the labour market. The most recently reported gain of 29,000 jobs with an unemployment rate of 4.2 percent suggests a cooling employment picture, which argues against a quick further increase. The bank ING, according to FXStreet, sees a December hike as its base case. Between the minutes and the market there is therefore no contradiction about the destination, but one about the timing.
Anyone buying regularly on fixed dates meets this uncertainty in any case: a savings plan on Bitcoin buys on its execution day at whatever price applies then, regardless of which meeting comes next.

Holding Period Under Section 23 EStG: One Year of Holding and the 1,000-Euro Exemption Limit
For private investors in Germany, the sale of crypto assets is a private disposal transaction under Section 23 of the Income Tax Act. If more than twelve months lie between purchase and sale, no income tax falls due on the gain. Within that period the gain is taxable, and at your personal rate rather than the flat withholding rate.
Alongside it stands an exemption limit: if the total gain from private disposal transactions in the calendar year comes to less than 1,000 euros, it stays tax free. An exemption limit is not an allowance. Once it is exceeded, the entire gain is taxable, not merely the part above the threshold.
The connection to the rate path is direct. A sale driven by fear of rates can destroy an almost expired one-year period and turn a tax-free gain into a taxable one. The purchase date of every single position is therefore a number that should be on the table before December 9.
Liquidation and Leverage: How to Check Your Distance to a Margin Call
A liquidation is the forced closing of a leveraged position as soon as the collateral no longer suffices. It affects positions on margin, not the holding in your own wallet.
At a price of $82,439 and a daily low of $82,318, the distance to the low is less than a sixth of a percent. Working with tenfold leverage, a fall of around ten percent wipes out the entire collateral; with twentyfold leverage five percent is enough. Two meeting dates with an open outcome are still ahead this year, and swings of several percent within minutes are documented on days like those.
The Three Numbers That Count on Leverage
First, the liquidation price, which every exchange shows for each position. Second, the percentage distance of that price from the current price. Third, the question of whether your platform permits a loss beyond the deposit or cuts off at zero. Under the European rulebook, retail clients enjoy negative balance protection on CFDs; on crypto derivatives on unregulated platforms it does not apply.
Custody in a Rate Cycle: Your Own Keys Against an Exchange Account
A rate cycle changes nothing about the custody question technically, but it does change its urgency. Phases with high trading volume and fast price moves are precisely the phases in which withdrawals are delayed and platforms come under load.
Holding your coins on a trading platform lets you react quickly but leaves you carrying the custodian's risk. Running your own keys removes that risk but requires time for a transfer, and on a volatile day that time is not always there. Splitting by purpose resolves the conflict in practice: the part that is traded stays reachable, the long-term holding does not.
October 27 and December 9: the Two Dates That Set the Rate Path
According to the Open Market Committee's calendar, two meetings remain in 2026: on October 27 and 28, and on December 8 and 9. The December meeting carries a note in the Fed's calendar, because an updated round of projections belongs to it.
That note makes the December date the more important of the two. A projection round publishes the individual participants' rate expectations and is therefore the next occasion on which the wording from the September minutes translates into figures. The decision itself falls on the second day of each meeting.
Fed Rate Path: December 9 Is the Next Hard Date
- Check the purchase date of every position against the one-year period and note which holdings drop out of taxability and when. An overview of tools that track purchase dates and holding periods automatically is in the comparison of crypto tax tools and portfolio trackers.
- Read off the liquidation price on every leveraged position and work out the percentage distance from the current price. Which providers offer which leverage and which loss protection is shown in the comparison of the best crypto brokers.
- Decide before December 9 which part of your holding has to stay tradable and which does not, and arrange custody accordingly. Which venues are licensed in Germany and how they settle is set out in the comparison of the best crypto exchanges.
The source for the wording and the decision is the minutes of the FOMC meeting of September 15 and 16, 2026.
(As of October 8, 2026. This article is not investment advice. Prices and fee structures change; check the terms with the provider before you buy.)
Decrypt
Solana DEX Orca and lending platform Loopscale will operate as Formation, a New York company aiming to finance AI, energy, robotics and defense assets and eventually reach regulated U.S. markets.
Investors yanked $484.9 million out of spot Bitcoin ETFs in a single day. Oil is near $100, bond yields are at their highest since 2002, and the Fed isn't done hiking.
Ethereum co-founder Vitalik Buterin thinks the crypto industry needs to make sure encryption is both quantum and AI-resistant.
A government wallet holding Bitcoin seized from the Bitfinex hacker sent 12,267 BTC to a new, unlabeled address, according to Arkham data.
Day traders are selling, leveraged longs are getting flushed and ETF money is heading for the door. The daily chart still holds the line, but its cushion is shrinking.
U.Today - IT, AI and Fintech Daily News for You Today
David Schwartz confirmed for Ripple's main stage comeback at Swell 2026 to present the next generation of XRP architecture featuring AI and privacy.
Solana has scored another major institutional win as Securitize launches tokenized shares of Apple, Nvidia, Tesla and other U.S. corporate giants.
XRP whale activity across all exchanges weakens as the asset begins to see massive sell-offs, dropping by 27% in eight days.
Jameson Lopp warns that crypto is fighting the wrong AI battle as code bugs trump math breaks.
Bullish traders caught on wrong side of the market move as Dogecoin price drops.
Blockonomi
TLDR
- Haemonetics stock surged nearly 16% after CSL Plasma announced plans to expand equipment use across U.S. centers.
- CSL expects to complete the rollout across more than 300 U.S. plasma collection centers by December 2027.
- BTIG raised its Haemonetics price target to $130, following Citi’s earlier upgrade to Buy.
- Haemonetics reported $339.38 million in quarterly revenue and $0.72 in diluted earnings per share.
- Investors await November 5 earnings for further details on the CSL agreement and expected revenue growth.
Haemonetics (HAE) stock rose 15.96% on Thursday, October 8, 2026, after CSL Plasma detailed a wider rollout of its plasma collection systems. Shares approached $118 during morning trading, compared with Wednesday’s $101.71 close. The announcement renewed attention on the medical equipment maker’s U.S. plasma business.
Haemonetics Corporation, HAE
CSL Plasma Sets Nationwide Rollout
CSL told Haemonetics it plans to introduce NexSys PCS devices with Persona PLUS technology at all its existing U.S. plasma centers. The company expects to finish the switch by December 2027. Its network includes more than 300 centers.
The update followed an August supply agreement that allowed CSL to buy Haemonetics equipment without minimum purchase requirements. The contract remains non-exclusive, and both companies must finalize rollout details. Earlier this week, European healthcare stocks gained, driven partly by clinical trial news.
Analysts Raise Haemonetics Stock Targets
BTIG raised its Haemonetics price target from $110 to $130 on Thursday while keeping a Buy rating. In September, Citi upgraded the stock from Neutral to Buy and increased its target from $92 to $123. The two decisions came weeks apart.
Citi estimated that each 10% recovery in CSL business could add $0.13 to annual earnings per share. Other analysts previously projected $183 million to $223 million in yearly sales if CSL completes a broad transition. Those figures remain estimates, not company guidance.
Quarterly Results and Vivasure Deal
Haemonetics reported $339.38 million in revenue for its June quarter, alongside diluted earnings of $0.72 per share. Revenue grew 5.6% from last year. Free cash flow reached roughly $39.1 million. Separately, U.S. stock indexes set records this week, although rising bond yields weighed on some healthcare shares.
Haemonetics also made progress with Vivasure Medical. A $6.1 million payment went to Orchestra BioMed after a milestone, bringing related consideration to $11 million. Future payments could reach another $10 million, depending on Vivasure revenue targets.
Valuation and November Earnings Update
Haemonetics carried around $1.17 billion in long-term debt and traded near 50 times earnings during Thursday’s rally. Its latest surge adds attention to that valuation. A recent retail investor survey also showed unusually high stock allocations across the broader market.
The company has not changed its fiscal 2027 forecast because rollout timing remains uncertain. Haemonetics plans to publish second-quarter results on November 5 and explain the expected CSL sales contribution.
The post Haemonetics (HAE) Stock Breaks Higher With November Test Looming appeared first on Blockonomi.
TLDR
-
Uber (UBER) stock gains 0.39% to $68.72 as London robotaxi testing plans advance
-
Uber and Pony.ai plan to test Gen-7 autonomous vehicles in London within weeks
-
Uber targets autonomous ride-hailing services across 15 global cities by late 2026
-
Pony.ai and Uber plan to deploy 2,000 robotaxis across European markets
-
Uber expands its driverless vehicle network through Wayve, Baidu, and WeRide
Uber Technologies is expanding its autonomous vehicle operations into London through a partnership with Chinese robotaxi developer Pony.ai. The companies will begin testing seventh-generation driverless vehicles in the coming weeks before launching commercial services. Meanwhile, Uber (UBER) stock gained 0.39% to $68.72 during midday trading, recovering from earlier losses.
Uber Technologies, Inc., UBER
Uber and Pony.ai Expand Robotaxi Operations Into London
The London project marks another step in Uber’s efforts to expand autonomous transportation across international markets. Pony.ai will provide its Gen-7 autonomous driving technology, while Uber will support passenger access through its platform. However, the companies have not identified the operator responsible for managing the London fleet.
Uber has established partnerships with more than 30 autonomous vehicle companies across different markets. These agreements cover passenger transportation and delivery services as the company expands its driverless technology operations. Furthermore, Uber expects autonomous rides to become available in up to 15 cities worldwide by December 2026.
The planned expansion includes American cities and international markets across Europe and the Middle East. Uber also maintains partnerships with several autonomous driving developers to support regional deployment strategies. These agreements allow the company to access different vehicle technologies without developing every autonomous driving system internally.
Pony.ai Partnership Builds on European Expansion
Uber and Pony.ai established their partnership in May 2025, initially targeting autonomous transportation services across the Middle East. The companies subsequently expanded their agreement into Europe and outlined plans to deploy 2,000 robotaxis. Croatia’s capital, Zagreb, became their first European operating location under the expanded arrangement.
In August 2026, Uber and Pony.ai launched autonomous ride-hailing services in Zagreb alongside Croatian mobility company Verne. Pony.ai supplies autonomous driving technology, while Verne manages the vehicle fleet and daily operations. Meanwhile, Uber connects passengers with the service through its existing ride-hailing platform.
The Zagreb operation uses Arcfox Alpha T5 vehicles developed through Pony.ai’s collaboration with Chinese automaker BAIC. Verne oversees fleet operations, while the partners coordinate technology integration and passenger services. The London deployment will follow a similar commercial structure, although fleet management details remain undisclosed.
Uber Strengthens Autonomous Vehicle Partnerships
Uber has also partnered with British autonomous driving company Wayve to develop robotaxi services in London. Wayve secured $1.2 billion in February 2026 through a funding round involving Microsoft, Nvidia, and Uber. The financing could reach $1.5 billion through additional funding from Uber tied to robotaxi deployment.
Uber maintains separate agreements with Baidu and WeRide to introduce autonomous ride-hailing services in Dubai. Pony.ai currently operates robotaxi services in four Chinese cities and continues developing international transportation partnerships. The company is also pursuing expansion opportunities in Qatar and other European and Middle Eastern markets.
The post Uber (UBER) Stock: Rises as London Robotaxi Launch Plans Advance appeared first on Blockonomi.
TLDR
- Trump administration freezes Microsoft’s green-card labor certifications, citing concerns over alleged misuse of employment visa programs.
- MSFT stock falls toward $525 as investors assess new immigration restrictions and broader technology market weakness.
- Adobe and six major IT outsourcing companies also face restrictions on employment-based permanent residency applications.
- Nine leading universities face investigations into alleged J-1 visa misuse and possible wage suppression.
- Microsoft’s OpenAI ties attract attention following reports of lower annualized revenue than previously communicated.
Microsoft (MSFT) stock fell on October 8 as the Trump administration suspended Microsoft’s access to a green-card process. Other technology firms faced restrictions over alleged visa misuse. Microsoft shares traded near $531 before sliding to $525.06. The stock recovered to $525.64 on the intraday chart, while broader technology shares faced selling pressure.
Microsoft Corporation, MSFT
MSFT Stock Faces New Hiring Restrictions
Vice President JD Vance urged Microsoft to hire more American workers. Labor Secretary Keith Sonderling said officials would stop accepting new permanent labor certification applications from the affected businesses.
The suspension also covers Adobe, Cognizant, Infosys, Tata Consultancy Services, Wipro, HCL Technologies and Capgemini. Authorities have not announced findings of wrongdoing against the companies.
Green-Card Freeze Reaches Universities
The PERM process requires employers to show that hiring foreign workers will not disadvantage qualified American applicants. Existing H-1B visa holders are not directly barred from working.
The crackdown comes as AI-related hiring continues across American software and data-center businesses. A recent report cited more than 750,000 AI-linked jobs created since 2023.
Officials also launched investigations into nine universities, including Harvard, Yale, Stanford, Brown and MIT. Investigators are examining whether J-1 exchange visas were used to reduce wages.
The administration previously introduced a $100,000 fee for certain new H-1B petitions. Its latest action targets the separate process that supports permanent residency applications.
OpenAI Report Adds Pressure to Technology Shares
A Financial Times report said OpenAI’s annualized revenue was about $20 billion below an earlier reported figure. Separately, AI data-center revenue growth remained strong at Applied Digital.
The report appeared during a wider selloff in AI-linked shares. Microsoft maintains close commercial ties with OpenAI, making the reported revenue gap relevant to shareholders.
Neither news item confirms why Microsoft shares declined. Investors also faced changing expectations for AI spending, cloud demand and company earnings during Thursday’s trading session.
The intraday chart showed selling below $530 and $528, with increased volume during the decline. The $525 area became the nearest watched support level.
A separate retail investor allocation report showed US stock exposure reaching 71.8% in September. That broader positioning provides context but does not explain Microsoft’s price movement.
The post Microsoft (MSFT) Stock Slides as Trump Freezes Microsoft Green-Card Filings appeared first on Blockonomi.
TLDR
- PepsiCo (PEP) stock jumps 2.23% to $126.50 following strong Q3 earnings results.
- PepsiCo’s Q3 revenue climbs 5.6% to $25.27 billion as organic sales accelerate.
- Operating profit surges 19% to $4.26 billion as quarterly margins improve.
- PepsiCo’s earnings per share rise 17% to $2.23, supported by higher profits.
- International growth strengthens PepsiCo’s sales as North America shows recovery.
PepsiCo (PEP) stock climbed 2.23% to $126.50 during intraday trading, gaining $2.76 following strong third-quarter 2026 financial results. The company reported higher revenue, stronger operating profits, and improved earnings per share compared with the previous year. Meanwhile, growth across international markets and improved North American sales supported its quarterly performance.
PepsiCo, Inc., PEP
PepsiCo Q3 Revenue Climbs as Organic Growth Accelerates
PepsiCo reported third-quarter net revenue of $25.27 billion, representing a 5.6% increase from $23.94 billion a year earlier. Organic revenue increased 3.1%, supported by stronger sales volumes and effective pricing across several business segments. Furthermore, acquisitions and divestitures contributed 1.7 percentage points, while foreign exchange added another 0.7 percentage points.
The company’s North American beverage division recorded 5% revenue growth, primarily supported by acquisitions completed during 2025. Meanwhile, convenient foods reported stronger sales trends as savory snack volumes increased alongside improvements in market share. However, lower effective pricing partly offset these gains within the North American food business.
International operations also contributed to PepsiCo’s quarterly expansion, with several regions reporting higher revenue and stronger product demand. Latin America Foods achieved 14% reported revenue growth, while Asia Pacific Foods recorded a 10% increase. Similarly, the Europe, Middle East, and Africa division delivered 8% growth, supported by beverage volume expansion.
PepsiCo Operating Profit Rises as Earnings Strengthen
PepsiCo’s operating profit increased 19% to $4.26 billion, compared with $3.57 billion during the corresponding quarter last year. Consequently, operating margin expanded to 16.9% from 14.9%, representing an improvement of approximately 195 basis points. Favorable commodity derivative gains and acquisition-related adjustments contributed to the stronger reported profitability.
Meanwhile, core operating profit increased 3% to $4.28 billion, compared with $4.14 billion in the previous year. However, core operating margin declined 35 basis points to 16.9% as operating expenses and marketing investments increased. Productivity savings, effective pricing, and tariff refunds helped offset part of these additional costs.
PepsiCo also reported earnings per share of $2.23, representing a 17% increase from $1.90 in third-quarter 2025. Core earnings per share reached $2.34, rising 2% from $2.29 during the comparable reporting period. Meanwhile, stronger operating profits supported earnings growth despite persistent cost pressures across several operating divisions.
PepsiCo Advances North American Strategy After Strong Nine-Month Results
For the first nine months, PepsiCo generated $68.90 billion in revenue, representing 6.7% growth from the previous year. Operating profit increased 45% to $11.50 billion, while earnings per share climbed 47% to $6.10. Additionally, core earnings per share rose 5% to $6.15, reflecting continued growth across the business.
PepsiCo continues to strengthen its North American operations through product innovation, affordability initiatives, and broader distribution across sales channels. The company also plans further structural cost reductions to support marketing investments and address rising input costs. Meanwhile, management aims to sustain international growth while improving execution across its domestic beverage and snack businesses.
The company operates major beverage and convenient food brands across North America, Europe, Latin America, and Asia Pacific. Its international divisions contributed stronger revenue growth as regional demand and distribution improvements supported quarterly sales. Going forward, PepsiCo plans to combine cost savings, product development, and brand investment to strengthen operating performance.
The post PepsiCo (PEP) Stock: Surges as Q3 Revenue and Profits Rise appeared first on Blockonomi.
TLDR
- Starbucks stock fell 4.94%, trailing a sector that gained 0.34% during the reported trading session.
- Chipotle shares advanced 6.09% as reports emerged that Starbucks explored a takeover of the chain.
- Neither Starbucks nor Chipotle confirmed an agreement, leaving the potential acquisition’s future uncertain for investors.
- Starbucks raised its quarterly dividend to 63 cents per share, with payment scheduled for November.
- Investors await fiscal fourth-quarter results for updates on customer traffic, operating costs, and store profitability.
Starbucks (SBUX) stock fell about 4.94% on Thursday, October 8, despite a 0.34% rise in the cyclical consumer services sector. Shares of Chipotle Mexican Grill climbed 6.09%, while McDonald’s gained 1.31%. The split followed reports of a possible deal involving two major restaurant chains.
Starbucks Corporation, SBUX
Starbucks Stock Trails Restaurant Peers
Shares of Starbucks (SBUX) faced selling pressure as traders weighed new reports about its plans. The stock ranked among the sector’s most actively traded names by turnover, alongside Chipotle and McDonald’s. Its decline contrasted with gains across both competitors.
The Financial Times reported that Starbucks had explored acquiring Chipotle. Reuters said Starbucks had worked with advisers on a possible proposal. Neither company confirmed any agreement. Chief Executive Brian Niccol previously led Chipotle before joining Starbucks in 2024.
Possible Deal Meets Cost Concerns
A takeover would add another spending decision to Starbucks’ strategy. Higher borrowing costs have already made large deals more expensive. Recent consumer demand concerns also show how retailers are tracking household budgets amid uncertainty.
The reported talks remain at an early stage, and no formal offer has been announced. Starbucks has invested in staffing and faster service under its turnaround program. A purchase could require new financing, but the companies have provided no deal terms.
Store Changes Keep Attention on Margins
Starbucks continues to adjust its North American store network, including closing weaker locations and improving others. Management wants stronger customer visits and better service across its coffeehouses. The changes bring renovation costs and can temporarily reduce sales at affected stores.
Spending across consumer businesses remains uneven. A separate report on slower direct-to-consumer growth at Levi Strauss showed another company facing questions about demand. For Starbucks, investors will examine labor costs, store traffic, and sales per location as the next quarter approaches.
Dividend Increase Comes Before Earnings
Starbucks announced Wednesday that it would raise its quarterly dividend from 62 cents to 63 cents per share. The payment is due November 27 for shareholders of record on November 13. Meanwhile, a survey of retail stock allocations showed high equity holdings among respondents.
The company’s fiscal fourth-quarter earnings report is expected later in October, although the date remains unconfirmed. Results will offer new figures on comparable sales, store costs, and operating profit. Traders will also look for any company statement addressing the reported Chipotle discussions.
The post Starbucks (SBUX) Stock Faces a New Test Before Earnings appeared first on Blockonomi.
CryptoPotato
Ethereum’s prolonged consolidation beneath resistance has pushed the asset lower, sending it toward $2.42K. The breakdown has weakened short-term structure, while the broader recovery now depends on buyers defending the support areas below.
Ethereum Price Analysis: The Daily Chart
On the daily timeframe, Ethereum has fallen sharply after repeatedly failing to clear the $2.68K–$2.77K resistance zone. The large bearish candle marks a departure from the recent consolidation, suggesting that sellers have gained control of the immediate price action.
Momentum has also deteriorated, with the daily RSI dropping to approximately 44 and moving below neutral. Nevertheless, Ethereum remains above both major moving averages. The 100-day average, near $2.21K, has already crossed above the 200-day average around $2.13K, preserving a constructive longer-term backdrop despite the current correction.
The highlighted $2.36K–$2.42K demand zone is the next major daily support area. The ascending trendline approaches this region, creating a potential confluence where buyers may attempt to stabilize the price.
Holding this area would keep the broader recovery structure intact, while a sustained breakdown would expose the moving-average region around $2.13K–$2.21K. On the upside, reclaiming the $2.68K–$2.77K supply zone remains necessary to restore a stronger bullish outlook.
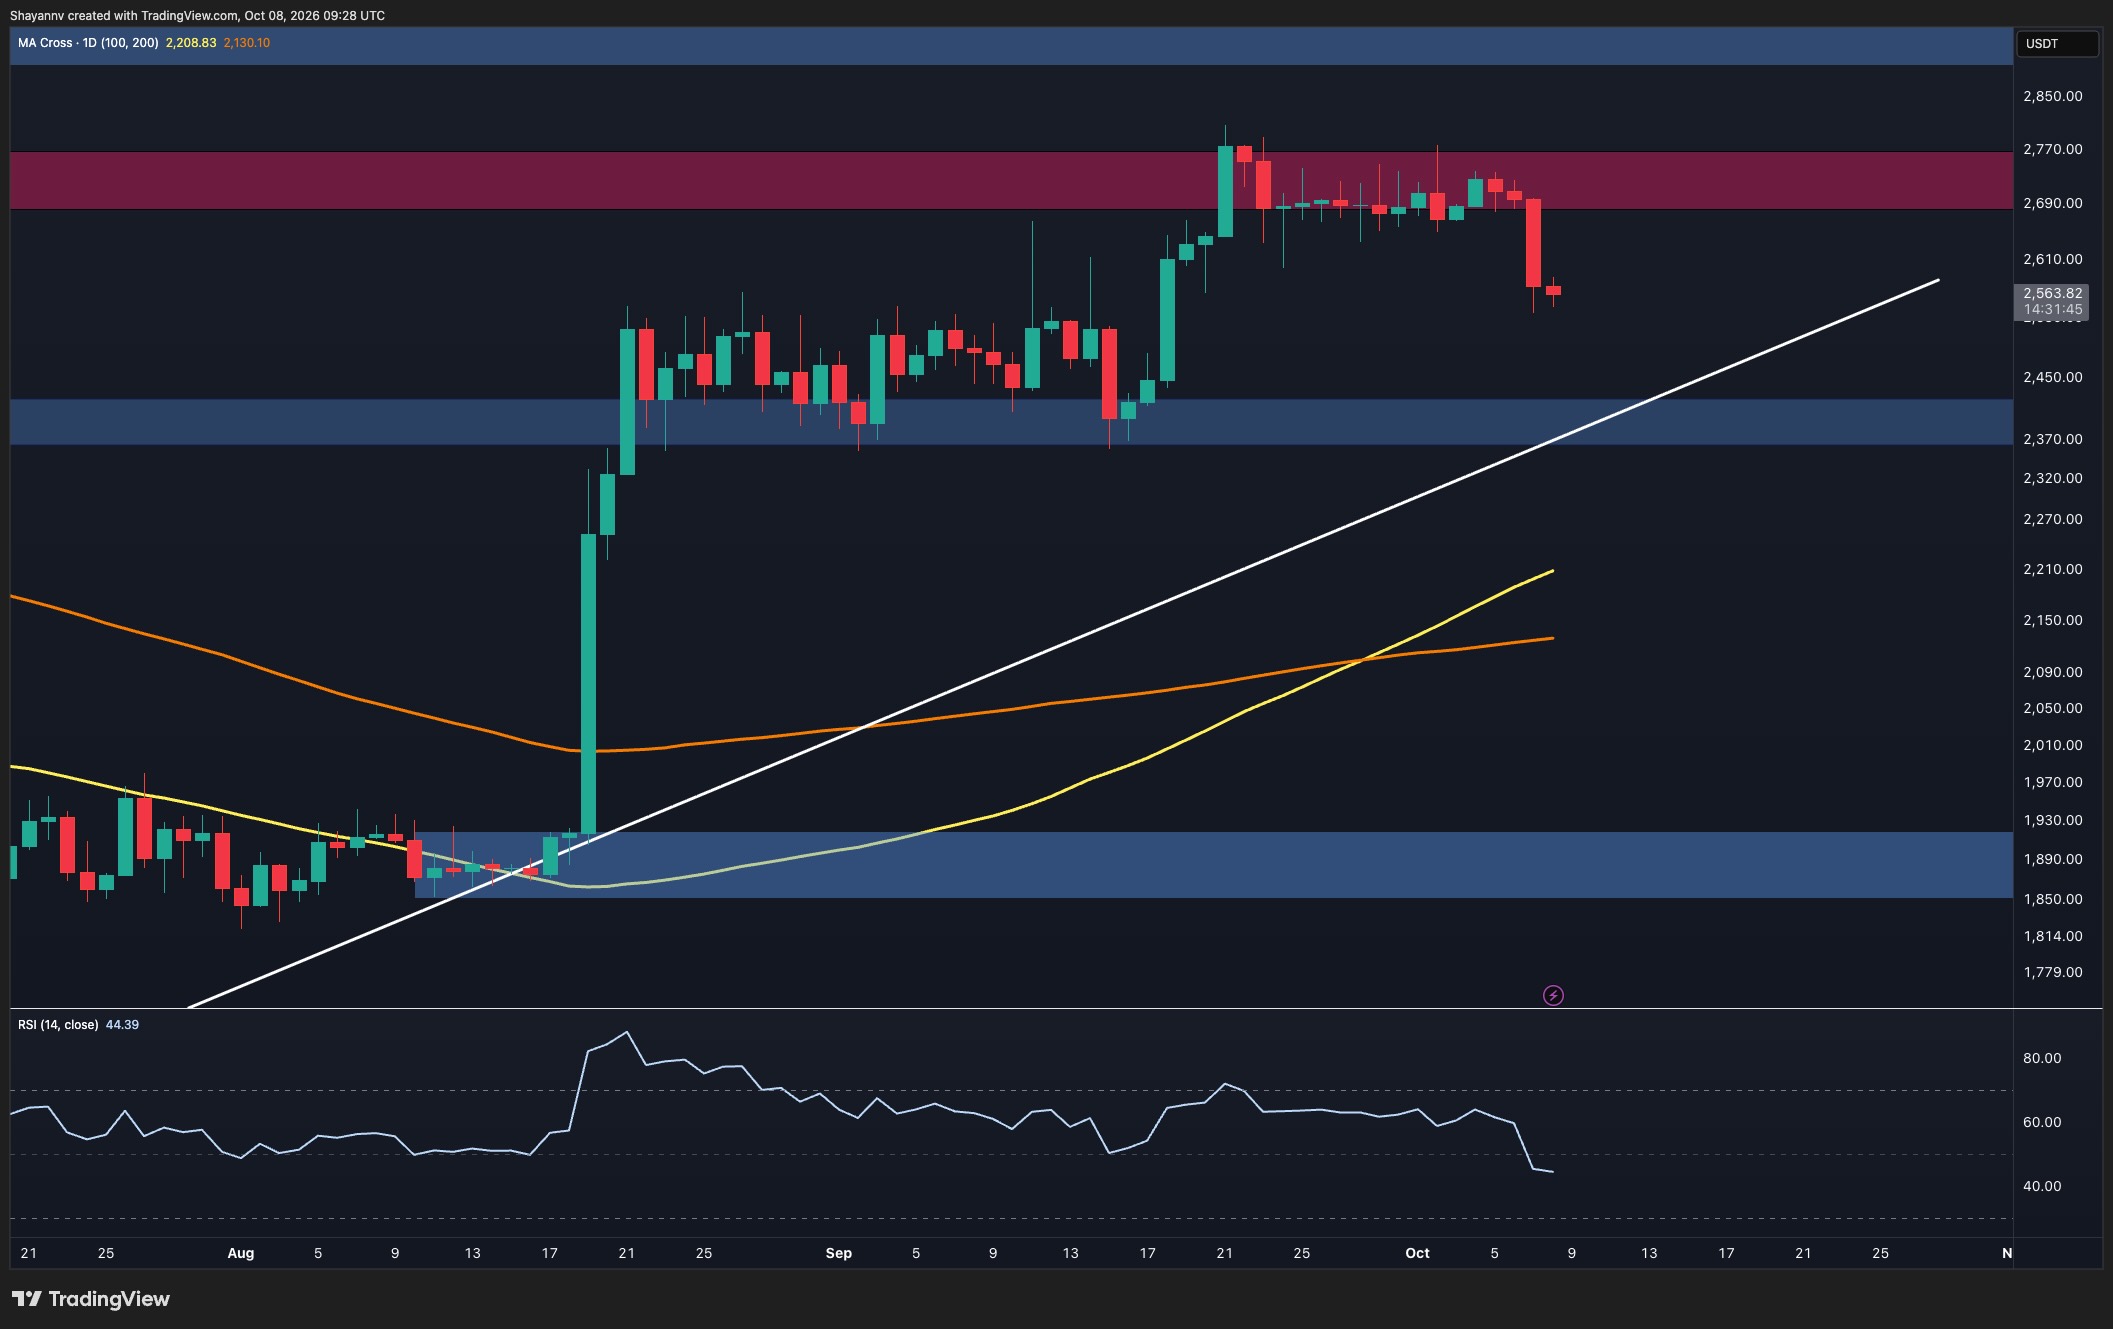
ETH/USDT 4-Hour Chart
The 4-hour chart shows a decisive bearish break from a symmetrical triangle. After compressing between descending resistance and ascending support, Ethereum fell beneath the lower boundary near $2.68K and extended its decline toward $2.42K. The limited rebound following the selloff suggests that buyers have yet to establish a convincing recovery.
The RSI is now around 26, placing short-term momentum in oversold territory. This could support a temporary relief bounce, although oversold conditions alone do not confirm a reversal. Any recovery would initially face resistance around $2.6K–$2.62K, followed by the broken triangle boundary and supply zone near $2.68K–$2.7K.
As selling pressure persisted, the highlighted $2.40K–$2.42K demand zone became the next important support area. Failure to defend it would increase the risk of a move toward the September lows around $2.36K–$2.38K. Conversely, sustained acceptance back above the triangle’s former support would weaken the bearish breakdown scenario and allow another challenge of $2.77K.

Sentiment Analysis
The two-week Binance ETH/USDT liquidation heatmap shows that the latest decline has moved through the previously dense estimated liquidation bands around $2.6K–$2.65K. These bands fade behind the falling price, consistent with leveraged positions being cleared as Ethereum moved lower, although the heatmap does not quantify actual executed liquidations.
With Ethereum now near $2.56K, the remaining nearby downside concentrations appear around $2.52K–$2.54K, with additional bands toward $2.48K–$2.5K. These areas could become relevant if the correction continues, particularly as the lower clusters approach the technical demand zone.
Above price, a nearby band remains around $2.63K–$2.64K, while the most prominent overhead concentration sits around $2.78K–$2.84K. A sustained recovery could bring these pools into focus, but the current technical breakdown favors caution until Ethereum reclaims its lost support. The liquidation distribution highlights potential areas of accelerated volatility rather than guaranteeing the next direction.

The post Ethereum Price Analysis: ETH Crashes 10% Weekly – How Low Can It Go? appeared first on CryptoPotato.
Bitcoin has nosedived again in the past hour or so, dumping below $81,000 for the first time since September 21 when it broke out.
The liquidations have skyrocketed once again, exceeding $480 million in the past hour alone. As expected, the majority is from long positions.
Cryptopotato reported yesterday that BTC crashed by $2,000 within 20 minutes, which was rather unexpected. It came after the US government transferred a portion of its crypto holdings to Coinbase Prime.
At the time, the cryptocurrency fell below $84,000 and managed to hold at around that level for hours.
However, the landscape worsened in the past several hours, with the asset tanking below $81,000. This also coincided with a new BTC transfer from the US government, according to data from Lookonchain.
The altcoins have followed suit. ETH, which traded above $2,700 until 48 hours ago, is now down to $2,450.
XRP was rejected at $1.50 and has dumped to $1.34 as of now. Notable losses also come from SOL, HYPE, DOGE, and others.
Naturally, the total value of wrecked positions has jumped a lot. Data from CoinGlass shows that over $450 million has been wiped-out in the past hour alone. Almost all of it was from longs.
The amount is up to nearly $900 million on a 24-hour scale. The total number of liquidated traders is over 150,000.
The post Liquidations Hit $480M In an Hour as Bitcoin Plunges Below $81K appeared first on CryptoPotato.
Solana appears to be pulling in users at a much faster rate. Since early September, network growth has risen 124%, with about 1.71 million new wallets being created each day.
Activity is rising too.
Network Growth Accelerates
According to Santiment’s latest findings, daily active addresses are up 58% over the same period, having reached around 4.27 million unique wallets. In other words, more people are not just creating wallets but actually using the network. The growth gives SOL a stronger long-term case if the trend continues.
Santiment explained,
“Networks that attract more users and real utility have historically had greater potential to support higher market caps over time. If Solana keeps expanding its active user base, rising network value can eventually follow.”
At the time of writing, SOL is trading near $115 after a fresh 3% decline over the past day. The crypto asset broke its own channel support on the four-hour chart after a rejection near $120 this week. The breakdown has put $114 in focus. If that level fails, Ali Martinez believes that $111 could be next. According to trader ‘Wick,’ on the other hand, corrections can become opportunities.
Long-term projections remain firmly bullish. Tracer has projected a break above $300 during the bull market. Martinez is even more optimistic. He pointed to a possible cup-and-handle pattern on SOL’s monthly chart, with the neckline around $295. A monthly close above that level could strengthen the setup. Interestingly, the pattern points toward a potential target near $2,744.
Institutional Demand Takes a Hit
The institutional side of things has slowed down. September was a strong month for US-listed spot SOL ETFs, which collectively pulled in more than $271 million, making it their second-best month so far. October, however, has started on a very different note. The funds have seen just one day of inflows, with only $1.30 million entering on October 2. So far this month, more than $22 million has flowed out of these investment vehicles.
Separately, Solana’s stablecoin activity is hitting new highs as the network pushes further into institutional settlement. More than 14 million addresses now hold stablecoins on Solana, according to the data compiled by Blockworks. That’s a big jump from fewer than 4 million in late 2024.
The network now has over $15 billion in stablecoin supply.
The post Solana Network Growth Jumps 124%: Here’s Why It Could Matter for SOL appeared first on CryptoPotato.
Managing your crypto taxes can become increasingly complicated as your activity starts spreading across multiple exchanges, wallets, blockchains, and DeFi protocols.
CoinTracking is designed to bring that activity into one place, combining crypto portfolio tracking with transaction analysis and tax reporting.
Launched in 2012, it’s one of the longest-running platforms in the market. It now serves over 2.2 million active users, supports over 400 integrations across exchanges, wallets, and blockchains, and offers dedicated tax reports for 22 countries.
The platform combines two main functions: portfolio management and crypto tax reporting.
On the portfolio side, users can import transaction histories from exchanges, wallets, and various networks to monitor balances, trades, realized and unrealized gains, and overall portfolio performance in a single unified dashboard.
On the tax side, CoinTracking analyzes that transaction history and then uses it to generate tax reports. It currently provides country-specific reports for 22 jurisdictions, including the United States, United Kingdom, Germany, France, Canada, Australia, and Switzerland. Users in other jurisdictions can use CoinTracking’s configurable General Tax Report option.
The platform supports 13 methods to calculate taxes, including FIFO, LIFO, HIFO, ACB, AVCO, and HMRC, alongside some additional options for selecting different calculation methods across tax years, giving users and CPAs plenty of flexibility.
One of the more distinctive areas of CoinTracking is transaction validation. Before the user generates their final tax reports, tools such as the Missing Transactions Report, ValiCheck, Account Check, and the Transaction Flow Report can help identify gaps or inconsistencies when it comes to the imported data. This matters because incorrect tax calculations often stem from inconsistent or incomplete transaction history.
CoinTracking Verdict at a Glance
CoinTracking is one of the most established crypto portfolio tracking and tax reporting platforms. It’s aimed at users who want detailed transaction records, tax calculations, and portfolio analysis in a single platform. It supports over 400 integrations across exchanges, wallets, and blockchains. It also provides country-specific tax reports for 22 jurisdictions.
One of its core strengths is the depth of its reporting and validation tools. Features such as Account Check, ValiCheck, the Missing Transactions Report, and the Transaction Flow Report are designed to help users identify incomplete or inconsistent data before generating tax reports.
The trade-off, however, is complexity. Because of the wide range of reports, settings, and tax methods supported by CoinTracking, it might not be immediately clear for beginners. However, the team has done a great job in providing all the necessary materials that will guide you through all features and processes.
Overall, the platform is best suited to investors and traders who have more detailed or complex crypto history and value reporting depth, accuracy, and data validation. CoinTracking has also devised various pricing options so that even those who have very scarce transaction histories can benefit from their reporting tools instead of having to crunch numbers manually.
CoinTracking Pros and Cons
Pros:
- Broad tax-report coverage
- Wide integration support
- Multiple tax calculation methods
- Built-in transaction validation tools
- Support for more complicated crypto activity
- Flexible import options
Cons:
- Can be a bit challenging for beginners
- No monthly billing
- Transaction limits are cumulative and not per fiscal year
- Automated daily sync is limited by plan
Who is CoinTracking Best For
CoinTracking is likely to be a much better fit for users who need detailed transaction records, tax reporting, and a unified portfolio view rather than a lightweight crypto portfolio tracking app.
Best for:
- Active crypto investors using multiple platforms: those of you who have transaction histories spanning several exchanges, wallets, and blockchains may benefit from the platform’s 400+ integrations and its various methods to import your data.
- Investors with complicated transaction histories: if you dabble in DeFi, automated market making, NFTs, meme coins, liquidity provision, and more, then CoinTracking’s tooling, which is designed to identify missing or inconsistent transaction data, can be a great fit.
- Users who need jurisdiction-specific tax reporting: CoinTracking provides dedicated tax reports for 22 countries, as we mentioned above. It also supports 13 calculation methods, which may be very useful for those of you whose jurisdictions have more specific reporting requirements.
Not ideal for:
- Users with small and straightforward portfolios: if you bought Bitcoin once this year and you’ve never sold, or you don’t have any other transaction history, even the basic plan of CoinTracking might be overkill.
- Beginners looking for the simplest interface: because CoinTracking attempts to provide all the necessary features, its interface can feel a bit challenging at first. It can take time to get used to everything the platform offers.
CoinTracking Pricing
CoinTracking offers a Free plan, alongside Starter, Pro, Expert, and Unlimited paid tiers. Additionally, those of you interested in corporate options can contact the team for custom pricing based on your needs.
One important point is that each transaction limit applies to the total number of transactions that are stored in the account over its lifetime – they do not reset at the start of each tax year. In practice, one subscription covers every tax year stored in the account, including previous years, which is especially useful if you are catching up on several years at once.
Two examples:
- Three tax years with around 1,000 transactions each (3,000 in total) fit into one Pro subscription at $169. Tools priced per tax year typically charge around $99 per year at this volume, so $297 for the same three years.
- Three tax years with around 3,000 transactions each (9,000 in total) fit into one Expert S subscription at $259. Per-tax-year pricing at this volume typically starts at $199 per year, so at least $597 for the same three years.

Free Plan
The free plan offers a view-only mode in the dashboard and can be used mainly for tracking your portfolio. You can import up to 200 transactions via manual entry, CSV files, blockchain addresses or exchange APIs, and use the mobile app. New accounts also start with a 7-day free trial with unlimited imports, although downloading a full tax report requires a paid plan.
Starter Plan
Tax reporting starts with this plan. It supports up to 200 transactions, but you can also rely on tax reports and backups. It also supports manual API imports, although the automatic daily sync is not included.
This plan starts at €39 per year, €69 for two years or a one-time payment of €199 for a lifetime subscription.
Pro Plan
The Pro plan includes everything the Starter plan does, but it includes 3,500 total transactions; you get 5 backups, automatic sync, access to the CoinTracking Data API, and source-of-funds tracking, a new feature.
It costs €129 per year, €209 for two years, or €569 for lifetime access.
Expert Plan
With the Expert plan you can customize how many transactions you need, starting with 20K, 50K, or 100K. You get 10 backups, everything included in the Pro plan but on top of it you also get a file converter, which allows you to convert any file you upload into a ready-to-import format.
The pricing starts at €219 per year
Unlimited Plan
As the name suggests, this plan gives you an unlimited number of transactions as well as all the features that CoinTracking has to offer.
It starts at €769 per year, €1,179 for two years, and €5,999 as a one-time payment for lifetime access.
How CoinTracking Works
In essence, CoinTracking works by allowing you to import transaction data from various sources such as exchanges, wallets, and blockchains. It then uses this data to enable portfolio tracking, performance analysis, and tax reporting.
The typical workflow is rather straightforward: you import your transactions (through one of many available means), review the data for errors, and then generate the reports you need for tax purposes.
Creating an Account
Creating an account is as simple as it gets. Once you are on the creation page, simply opt in to create an account with your Google or Apple profile, or generate one via email.

Importing Transactions
Once your account is created, you will land on a welcome screen which allows you to select a platform that you wish to import your data from. This could be an exchange, a wallet, a blockchain, and so forth. Use the search option if you cannot immediately find your provider. CoinTracking supports more than 400 different platforms, meaning that the odds of finding your particular one are rather high.

For the purpose of this demonstration, we have selected a MetaMask wallet connected to Ethereum. This is what the screen would look like:

As you can see, all you need to do is paste your wallet’s address. A cool feature of CoinTracking is that even if you’ve selected Ethereum (or any other network for that matter) as the one you want to import from, the platform detects if that address holds crypto on other blockchains and asks you if you want to import it as well.

API and CSV Imports
If a platform is not among the 400+ dedicated integrations, the Custom Exchange Importer lets you map the columns of almost any export file yourself, and Excel or bulk imports, a standard CSV format and the AI File Converter offer further ways to bring data in.
Naturally, the appropriate method is likely to vary based on your particular needs and the platform that you use.
Automatic Sync
As mentioned above, this is a feature that comes with the Pro plan. In essence, this feature will reduce the need for manual updates. That said, it is recommended that you continue reviewing the data for missing, duplicated, or incorrectly categorized transactions.
CoinTracking Data Validation Tools
CoinTracking also comes with multiple tools that allow you to check whether imported transaction data is complete and consistent before it is used to generate tax calculations.
This is important because the tax calculation itself depends entirely on the accuracy of the underlying transaction history. For example, if a relevant transaction is missing or gets duplicated during the importing process, the recorded cost basis is also going to be wrong.
Account Check
Account Check is designed to help identify potential issues with imported transaction data, including incorrect balances and inconsistencies.
Its main purpose is to serve as a diagnostic tool. It can flag entries that still need to be reviewed and, if necessary, corrected by the user.
ValiCheck
This one is designed to help the user compare imported transaction data with the records from their exchanges or wallets.
It can be very useful, and it is aimed at identifying missing or duplicated transactions, particularly when CoinTracking’s calculated balances do not match the balances that are shown on the original platform.
Missing Transactions Report
As the name suggests, the Missing Transactions Report feature focuses mainly on the transfers between wallets and exchanges. It looks for withdrawals and corresponding deposits that do not match correctly.
It can help you identify transfers where one side may be missing from the transaction history. It’s suitable for users who frequently move assets between exchanges and self-custody wallets.
Transaction Flow Report
This feature displays transactions chronologically and shows how balances change over time. It’s helpful to trace where a balance discrepancy or negative balance first appears. However, it’s most useful when applied alongside the platform’s other validation tools.
CoinTracking Tax Reports
It goes without saying that tax reporting is one of the platform’s main functions. Once the transaction data has been imported and checked for inconsistencies, CoinTracking can then transform that data and generate tax calculations based on your jurisdiction and selected accounting method.
Currently, CoinTracking provides dedicated tax reports for 22 countries, while users in other jurisdictions can use its configurable General Tax Report, which I will get to in a moment.
Country-Specific Tax Reports
CoinTracking provides country-specific reports for Austria, Australia, Belgium, Canada, Czechia, Denmark, Finland, France, Germany, India, Ireland, Italy, the Netherlands, New Zealand, Norway, Poland, Portugal, Spain, Sweden, Switzerland, the United Kingdom, and the United States.
For US filers, CoinTracking generates Form 8949, Schedule D, FBAR and Form 8938. It supports wallet-by-wallet cost basis under Rev. Proc. 2024-28 through its Reallocation Report, lets users assign transactions to the correct Form 8949 section to reconcile against broker-issued Form 1099-DA, and offers a direct TurboTax export. For UK filers, the dedicated HMRC method applies the same-day and 30-day rules before pooling the remaining assets at average cost.
It’s worth noting that the country coverage is constantly expanding, with France and the Czech Republic being the latest additions.
General Tax Report
If you reside outside of the 22 supported jurisdictions, you can use CoinTracking’s General Tax Report feature.
This is a configurable report that’s intended for exactly those jurisdictions where the platform doesn’t have a dedicated country-specific format. It allows users to apply the available calculation settings to their transaction history and produce tax-related data that can be then used for their records or reviewed with a local tax professional.
Supported Tax Calculation Methods
CoinTracking supports a total of 13 calculation methods. These include FIFO, LIFO, HIFO, ACB, AVCO, and HMRC. It also offers OPTI and MULTI options for selecting calculation approaches across different fiscal years.
This is an important consideration. Some countries have specific requirements as to the calculation method you have to use, and in certain cases using one over the other could result in some tax deductions and savings. You can read more about this in our article on the matter.
What the Tax Report Includes
At a high level, the tax reporting of CoinTracking is largely based on the transaction history that’s stored in the account and the calculation method that you’ve selected.
It’s critical to note that the output would heavily depend on the quality of the underlying data. Therefore, missing transfers, incorrect transaction types, duplicated entries or incomplete reports can significantly affect the calculations in the reports.
Fortunately, as I mentioned earlier, CoinTracking has quite the suite of tools that you can use to double check numbers, although manual review is always recommended.
CoinTracking Support for DeFi, NFTs and Complex Transactions
If you have been around for a while, chances are that at some point in your crypto journey, you have traded or minted NFTs, provided liquidity on Uniswap, or staked a token on-chain. Well, the bad news is that all of this activity also has to be accounted for in your annual tax reports. The good news is that CoinTracking offers plenty of tools for that too.
Decentralized Finance (DeFi)
CoinTracking supports a wide range of DeFi-related transaction types. These include loans, collateral, liquidity provision, liquidity-pool rewards, repayments, and whatnot. These transactions can be categorized so that they are treated appropriately within your portfolio and on the tax report.
DeFi activity can still require more manual review than standard exchange trades. This is because they involve multiple tokens, bridges, and liquidity pools, to name but a few.
For users with substantial DeFi activity, the transaction validation tools that I talked about earlier can become very relevant.
Non-Fungible Tokens (NFTs)
The platform can also record transactions related to NFTs, as well as display the NFTs within its NFT center. If a price is not assigned to your assets automatically, you can do that manually where necessary.
For instance, NFTs that were purchased with crypto can be record as trades so that the value of the crypto you used in the purchase is reflected in the transaction history.
Staking
You can record staking rewards and assign them to the relevant exchange or wallet within CoinTracking’s interface.
The platform also supports transaction types associated with staking and liquidity-pool rewards, allowing you to separate these activities in the transaction history.
The exact tax treatment of staking rewards varies a lot by jurisdiction. This is why correctly recording the transaction type doesn’t necessarily determine by itself how the activity should be reported for tax purposes.
Margin Trading and Futures
Undoubtedly one of the main concerns for many crypto users, CoinTracking supports dedicated transaction types for margin profits and losses, derivatives, and futures profits and losses.
Now, it’s very important to note that there is a certain limitation here: the data that CoinTracking handles is the one derived from the platform that you use. Some exchanges are known for not providing complete realized profit-and-loss data for margin and futures through their APIs or standard CSV exports. In those cases, CoinTracking won’t be able to reconstruct the result, so you might have to enter the information manually.
Fees and funding payments can also be recorded separately but, again, the way they ultimately appear in the tax report will depend on your reporting settings based upon your jurisdiction.
Portfolio Tracking
As I mentioned earlier, portfolio tracking was CoinTracking’s original core functionality before tax reporting was added. Today, users are able to monitor balances, gains, losses, transaction history, as well as portfolio performance across connected exchanges, wallets, and networks in a unified dashboard view.

The platform supports over 400 integrations, which makes it possible to consolidate activity from a bunch of different sources rather than having to review each one individually.
Portfolio tracking is also available in view-only mode on the Free plan.
Now, for users with relatively simple portfolios, the amount of data that’s being displayed could feel a bit unnecessary. The portfolio tools are definitely more useful for investors with activity that spreads across several platforms or have longer transaction histories.
CoinTracking’s Full-Service
CoinTracking also offers a separate full service for those of you who don’t want to manage the entire process yourself.
The service is available in more than 25 countries and it can include assistance with importing transactions, validating account data, and preparing tax reports. It is billed separately from the standard subscription plans. Filing is not part of the service. Users can submit the reports themselves or, in most countries, be referred to one of CoinTracking’s partner tax advisors. In the US, these are independent, US-based CPA partners.
There is no fixed public price list. The process starts with a free consultation, after which the team provides an individual quote based on factors such as the scope of work and transaction volume.
Is CoinTracking Safe in 2026?
Yes, CoinTracking is safe to use in 2026. The platform has put several security and privacy controls in place, including ISO/IEC 27001 certification, EU-based data hosting, GDPR compliance, encrypted API credentials, and support for read-only exchange API connections.
CoinTracking’s ISO 27001 Certification
First things first, CoinTracking is certified to ISO/IEC 27001:2017. This is an international standard for information security management systems. In essence, this certification covers areas including company processes, encryption, APIs, infrastructure, as well as internal security procedures.
The certification also means that the company has implemented and undergone audits of a formal information security management system. Of course, this doesn’t mean that it’s immune to security incidents, but it provides considerable insight into how security risks are managed.
EU Data Hosting and GDPR
User data is stored on servers within the European Union and it is handled in accordance with the rigorous standards set forth in the General Data Protection Regulation (GDPR).
Moreover, users are also able to create accounts without providing an email address, which reduces the amount of personal information required to use the service.
Account Privacy and Read-Only APIs
Another important thing to consider is the fact that the platform uses read-only APIs. This means that the permissions that are granted allow it to only retrieve transaction and balance information without allowing it to execute any further actions like executing trades or withdrawing cryptocurrency.
Moreover, CoinTracking states that it encrypts stored API secrets and that employees cannot view or decrypt them.
CoinTracking Limitations
CoinTracking offers a very broad range of portfolio and tax tools, but that depth might actually impose a few trade-offs.
For instance, the first thing that comes to mind is the ease of use. Now, don’t get me wrong, the software is not challenging to use and, by all means, no accounting software is actually easy to use. That said, the large number of report types, settings, transaction types, validation tools, and everything in between that is designed to optimize for as many possible user needs as there are also makes it a bit challenging for a beginner.
As I mentioned earlier, though, CoinTracking has done a good job posting various tutorials that explain most features in depth.
Naturally, as with most automated import systems, when you are uploading a list of transactions, especially if those transactions are actually coming from complex DeFi activity, manual verification is downright mandatory.
Remember, your final report is only as good as the data you support, so make sure that everything checks out.
Conclusion: Is CoinTracking Worth It?
If you’re a user who does hundreds of transactions regularly, if you trade on a daily basis or dabble in the intricate world of DeFi, CoinTracking is worth it. It provides all sorts of reporting capabilities, making it suitable for different types of crypto users, spanning from futures traders to margin users and DeFi aficionados.
The availability of 22 country-specific tax reports, 13 calculation methods, and dedicated validation tools also gives users a lot more control over how transaction data is reviewed before reports are generated.
If you’re a regular investor who buys something once a year and forgets about it, then CoinTracking might be rather unnecessary, as you can probably create the report on your own in a few minutes.
CryptoPotato readers get a special 10% discount using the following link.
The post CoinTracking Review 2026: Pricing, Features, Pros & Cons appeared first on CryptoPotato.
[PRESS RELEASE – Tallinn, Estonia, October 8th, 2026]
SaaS and eCommerce increased their combined share from 48.26% to 55.54%, while Trading moved from 14.07% to 13.15%.
Businesses can build stablecoin infrastructure around the wrong problem.
The mistake is treating stablecoins primarily as a coin-and-network decision. For a digital business, they may need to support a much broader set of operating workflows, including billing, checkout, settlement, payouts, and reconciliation.
Which of those workflows matters most depends on the business model.
New aggregated data from NOWPayments shows the industry mix shifting toward businesses that use payments as part of their day-to-day operations. Between January 16 and July 16, 2026, SaaS and web services accounted for 27.78% of classified partners. eCommerce Marketplaces followed at 27.76%. Together, the two sectors represented 55.54% of the sample. During the same period in 2025, their combined share was 48.26%. The increase of 7.28 percentage points represents a 15.08% year-over-year rise in their combined share.
Trading remained an important part of the sample, but its share moved in the opposite direction. It declined from 14.07% in 2025 to 13.15% in 2026, leaving trading in third place behind SaaS and eCommerce.
The clearest upward shift came from SaaS. Its share increased from 15.58% to 27.78% in one year, closing a gap of 17.10 percentage points with eCommerce. The emerging picture is not stablecoins replacing trading. It is stablecoin adoption expanding into the operating infrastructure of digital businesses.
Unless otherwise stated, industry-distribution figures compare January 16 to July 16, 2025, with January 16 to July 16, 2026.
The Partner Mix Is Shifting Toward Operational Use Cases
In 2025, eCommerce marketplaces led the dataset at 32.68%. SaaS and Web Services followed at 15.58%, with Trading close behind at 14.07%.
One year later, SaaS had increased its share by 12.20 percentage points to 27.78%. eCommerce stood at 27.76%, leaving only 0.02 percentage points between the two sectors. Their combined share rose from 48.26% to 55.54%. More than half of the classified partners in the 2026 sample therefore came from two sectors built around digital transactions, recurring services, and online customer relationships.
The rest of the partner mix changed more gradually.
Financial Services moved from 9.00% to 6.35%. Gambling and iGaming increased from 6.20% to 6.87%, and adult platforms rose from 4.99% to 5.89%. Charity declined from 2.27% to 1.40%, while TGE/Presale moved from 2.12% to 1.35%.
These figures measure changes in each industry’s share of the sample. They do not measure absolute partner growth. A category may lose share because another category expanded faster.
 Methodology: Each percentage represents an industry’s share of the full aggregated partner sample classified across the same nine categories. The comparison covers January 16 to July 16 in both 2025 and 2026. Each period was normalized independently. Absolute partner counts are not disclosed, and percentages are rounded to two decimal places. The findings describe partner distribution within the NOWPayments dataset, not payment volume, transaction value, or market-wide industry share.
Different Business Models Need Different Stablecoin Workflows
The industry data becomes useful when it is translated into the operating questions each business model may need to solve.
For a SaaS company, stablecoin payments may need to connect with recurring billing, invoice matching, account activation, renewals, settlement, and financial reconciliation.
A marketplace may need stablecoins to work across a longer flow. The payment can begin at checkout and continue through refunds, seller settlement, affiliate commissions, and other payouts.
Trading platforms face a different set of requirements. Their priorities may include asset and network coverage, confirmation policies, liquidity, and treasury controls.
These are potential workflow drivers, not a universal description of every company in each category. The point is that the same stablecoin can serve all three sectors while performing a different operational job in each one.
This is why a business should define the workflow before choosing the asset and network.
The Network Mix Also Changes by Industry
The successful-payment data shows that industry differences extend to network usage.
USDT on TRON accounted for 54.58% of the measured successful-payment sample within eCommerce marketplaces. Its share was 12.04% in trading and 9.60% in SaaS and web services.
Within this dataset, USDT TRC20 was about 4.5 times as prominent in eCommerce as in Trading and 5.7 times as prominent as in SaaS.
The corresponding shares were 4.76% in Gambling and iGaming, 1.85% in Financial Services, 1.49% in Other, and 0.60% in Charity. Adult Platforms and TGE/Presale each recorded a 0% share in the analyzed sample.
The difference supports the same conclusion as the industry data. A stablecoin setup that fits one business model may not fit another.
For an eCommerce business, USDT on TRON may play a visible role in checkout activity. A SaaS company may see a different asset and network mix. Trading platforms may need broader coverage across both.
Businesses should validate these decisions against their own successful-payment data instead of importing the preferences of another industry.

Methodology: Each percentage represents USDT TRC20’s share of the aggregated successful-payment sample within the corresponding industry. Absolute transaction counts are not disclosed. Failed, expired, refunded, and test transactions are excluded. The figures describe activity within the NOWPayments ecosystem and should not be interpreted as market-wide currency shares. A 0% result means that no successful USDT TRC20 payments were recorded in the analyzed sample for that category.
Build the Workflow Before Choosing the Rails
The five operating areas introduced at the beginning provide a practical framework for evaluating stablecoin infrastructure.
- Billing: Does the payment need to connect with invoices, subscriptions, renewals, or account access?
- Checkout: Which assets and networks produce completed payments for the company’s actual customers?
- Settlement: Which asset should the business receive, and when should funds become available?
- Payouts: Will funds need to move to sellers, affiliates, contractors, or customers?
- Reconciliation: How will the finance team match transactions with invoices, orders, and internal reporting?
Not every business needs all five. A SaaS platform may focus on billing and reconciliation. A marketplace may need checkout, settlement, and payouts. A trading platform may prioritize network coverage, liquidity, and treasury controls.
The company should first identify which workflows apply. Asset and network selection comes after that.
“The mistake is asking which stablecoin is best. The better question is: best for what?” said Kate Lifshits, Commercial Director at NOWPayments. “Businesses should define the billing, checkout, settlement, payout, and reconciliation flow first. The coin and network should serve that workflow – not the other way around.”
Lifshits explores the commercial side of crypto payments in her Cryptopolitan series, Crypto That Works for Business. The first column, The 22% Sales Boost Hiding in Your Crypto Checkout, examined how payment infrastructure can affect checkout performance. Future installments will continue looking at where crypto payments can increase revenue, lower costs, and remove operational friction.
Stablecoin strategy starts with the job the money needs to do. The coin and network come next.
About NOWPayments
NOWPayments is a crypto business ecosystem designed to help companies accept payments, automate mass payouts, manage stablecoin treasury, and scale global digital asset operations through a single infrastructure. The platform supports more than 350 cryptocurrencies, over 30 stablecoins, flexible settlement options, and enterprise-grade APIs.
The post Stablecoins Are Quietly Becoming Business Infrastructure, NOWPayments Data Shows appeared first on CryptoPotato.