Cryptocurrency Posts
Crypto Briefing
Bitcoin's current range reflects macroeconomic pressures and ETF interest, highlighting the need for stablecoin growth and easing yields for a breakout.
The post Bitcoin slips toward $82,000 as QCP Capital eyes $80K-$90K fourth-quarter range appeared first on Crypto Briefing.
The policy shift could enhance PYTH token value by increasing demand, but it limits flexibility and requires sustained revenue growth for impact.
The post Pyth Network DAO approves sending 100% of product revenue to PYTH buybacks appeared first on Crypto Briefing.
Tokenized finance's reliance on multiple blockchains could enhance resilience and innovation, fostering a more diverse financial ecosystem.
The post Securitize’s Chongwu Du says tokenized finance will run on a few blockchains, not one appeared first on Crypto Briefing.
The collaboration could revolutionize drug discovery, enhancing AI's role in life sciences and potentially accelerating medical breakthroughs.
The post Nvidia and Eli Lilly commit up to $1B to AI drug discovery lab appeared first on Crypto Briefing.
The merging of traditional and onchain finance could redefine investment landscapes, enhancing accessibility and expanding market opportunities.
The post Fidelity’s Matthew Horne says the line between TradFi and onchain finance may vanish appeared first on Crypto Briefing.
Bitcoin Magazine
Bitcoin Magazine

Why Bitcoin’s Liquidity Advantage Matters as Institutions Move In
Bitcoin’s portability, divisibility and accessibility could increasingly distinguish it from traditional stores of value as more institutions enter the market, according to SALT Lending CEO and Co-Founder Shawn Owen.
Speaking on BMTV, Owen pointed to Bitcoin’s resilience while gold and other long-duration assets sold off, arguing that some of Bitcoin’s most basic characteristics give it advantages over competing assets.
“It is easier to buy Bitcoin than gold,” Owen said.
That advantage becomes even more apparent when mobility matters.
“It’s easier to move Bitcoin out of, say, somewhere where you need to leave quickly because there’s unrest in the area than gold,” Owen said. “It’s far more portable and divisible and easy to use than real estate.”
Bitcoin’s Liquidity Advantage
Gold, real estate and bitcoin can all serve as long-term stores of value, but accessing and moving that value looks very different.
Physical gold requires storage and transportation. Real estate is tied to a specific location and can take time to buy or sell. Bitcoin can be transferred globally and divided into small units without those same physical constraints.
Those characteristics can also give Bitcoin holders more flexibility when they need liquidity.
Rather than selling bitcoin to access dollars, holders can potentially use it as collateral and borrow against its value while maintaining exposure to the underlying asset.
That model becomes particularly relevant if Owen’s longer-term outlook for Bitcoin adoption proves correct.
Institutional FOMO Is Arriving
Owen believes the experience many individual Bitcoin holders have already gone through, discovering Bitcoin and wishing they had gotten involved earlier, may eventually play out among much larger institutions.
“Every human goes through this experience where you learn about Bitcoin and wish you’d been earlier,” Owen said. “I think that will be true of sovereigns and banks and institutions of all sizes.”
Banks have taken considerably longer to enter the market, but Owen believes that is beginning to change as many of the hurdles surrounding Bitcoin have been addressed.
“Banks have been slow, but are now getting in after all the boxes have been checked,” he said. “FOMO is real.”
JUST IN: Salt Lending CEO says sovereign wealth funds and banks are realizing the importance of Bitcoin
— Bitcoin Magazine (@BitcoinMagazine) October 7, 2026
"Every human goes through this experience where you learn about Bitcoin and wish you'd been earlier…I think that will be true of sovereigns and banks of all sizes."pic.twitter.com/2pxKVh1Q2O

Owen cautioned that adoption and price appreciation will not necessarily happen in a straight line. As Bitcoin matures and more capital enters the market, he expects some dampening of its historic volatility.
That does not change his longer-term outlook.
“Adoption depends on the time horizon we’re talking about,” Owen said. “Dampening of volatility, and we will continue to see that, but that doesn’t mean over the next decade we won’t see serious adoption and increase in price.”
“Never Sell Your Bitcoin”
That long-term view also shapes how Owen thinks holders should approach their bitcoin.
“I have always said never sell your bitcoin,” Owen said. “Long term we will continue to see prices increasing significantly in comparison to fiat currencies.”
For holders who share that outlook, selling bitcoin to cover a large purchase, business expense or other liquidity need means giving up future exposure to the bitcoin they sell.
Bitcoin-backed lending provides an alternative.
SALT allows eligible borrowers to use bitcoin as collateral to access cash without selling the underlying bitcoin. Once the loan is repaid, the collateral is returned to the borrower.
The model aligns closely with Owen’s broader thesis. If Bitcoin continues becoming easier to access and more widely adopted by banks, institutions and potentially sovereigns, long-term holders may become increasingly reluctant to sell simply because they need liquidity.
Instead, they can potentially maintain their bitcoin position while accessing the value stored within it.
As Bitcoin adoption expands, the conversation may increasingly move beyond how to acquire bitcoin and toward how holders can use the wealth they have accumulated without necessarily selling the asset.
SALT Lending is the Official Liquidity Sponsor of BMTV. Learn more about borrowing against your bitcoin and explore SALT’s BMTV offer at https://saltlending.com/bmtv/?utm_source=bmtv&utm_medium=article&utm_campaign=52783658-BMTV%20article&utm_term=BMTV
Disclaimer: SALT Lending is a paid sponsor of BMTV and serves as BMTV’s Official Liquidity Sponsor. This article is sponsored content and does not necessarily reflect the views or opinions of Bitcoin Magazine. The information provided is for promotional purposes and should not be considered financial advice. Readers are encouraged to conduct their own research before making any investment decisions related to Bitcoin or other financial products mentioned herein.
This post Why Bitcoin’s Liquidity Advantage Matters as Institutions Move In first appeared on Bitcoin Magazine and is written by Josh Plischke.
Bitcoin Magazine

Shawn Owen: Bitcoin’s First Institutional Cycle Has Arrived
Banks and credit unions are racing to adopt Bitcoin, and SALT Lending CEO Shawn Owen says the FOMO is real. In this interview, Shawn Owen joins Grace Remington and Sean Hagan to talk about Bitcoin as pristine collateral, compressing volatility, and why institutions can no longer ignore Bitcoin. He explains how the barriers holding back banks and registered investment advisors have finally come down. If you want to understand where Bitcoin-backed lending is headed, this conversation is a must-watch.
Chapters:
0:00 – SALT Lending CEO Shawn Owen on Bitcoin Volatility and Loan-to-Value
1:38 – Bitcoin as Pristine Collateral for Banks and Wealth Advisors
3:20 – Why Credit Unions and Banks Have Bitcoin FOMO
4:38 – Dampening Volatility and Bitcoin’s Long-Term Upside
6:16 – Bitcoin vs. Real Estate for Younger Generations
7:21 – Building a Secondary Market for Bitcoin-Backed Loans
8:56 – Bitcoin Regulation, the Clarity Act and Stablecoins
10:31 – Bitcoin Strength as Bonds and Gold Sell Off
13:11 – How Bitcoin ETFs Changed SALT’s Borrower Base
15:40 – Never Sell Your Bitcoin: When to Borrow Instead
DISCLAIMER: The views and opinions expressed in this show are those of the participants and do not necessarily reflect the official policy or position of BTC Inc., Bitcoin Magazine, or any affiliated entities. This content is provided for informational and educational purposes only and should not be construed as investment, legal, tax, or accounting advice. Nothing contained in this show constitutes a solicitation, recommendation, endorsement, or offer to buy or sell any securities or financial instruments. Viewers should consult their own advisors before making financial or business decisions.
This post Shawn Owen: Bitcoin’s First Institutional Cycle Has Arrived first appeared on Bitcoin Magazine and is written by Patrick Green.
Bitcoin Magazine

Josh Young: “Massive” Currency Debasement to Come From Oil’s Run Higher
Global oil inventories are running out faster than most people realize. Josh Young, founder and CEO of Bison Interests, says less than 10% of global stockpiles may be usable, and the market has almost no room left for another supply shock. He explains why WTI’s fair value sits near $105 a barrel, why an Iran peace deal might not bring lasting relief, and which part of the energy market he believes is deeply undervalued.
Chapters:
00:00 Saudi Aramco Warns Rebuilding Oil Stockpiles Could Take Two Years
02:00 Would an Iran Peace Deal Crash Oil? Why WTI’s Fair Value Is $105
04:03 How Long It Takes to Restore Damaged Middle East Energy Infrastructure
05:33 Strait of Hormuz Flows, Misleading Data and Wartime Propaganda
08:18 Diesel at $200 a Barrel: Why Refined Products Matter Most
10:40 Russia, China and the Real Drivers of the Diesel Squeeze
12:38 Why a US Diesel Export Ban Is Very Unlikely
14:41 Undervalued Small-Cap Oil Producers and Trump’s Midterm Price Promise
17:40 The Fed, Rate Hikes and What Milton Friedman Got Right
20:37 Kevin Warsh, Government Inertia and Massive Currency Debasement
DISCLAIMER: The views and opinions expressed in this show are those of the participants and do not necessarily reflect the official policy or position of BTC Inc., Bitcoin Magazine, or any affiliated entities. This content is provided for informational and educational purposes only and should not be construed as investment, legal, tax, or accounting advice. Nothing contained in this show constitutes a solicitation, recommendation, endorsement, or offer to buy or sell any securities or financial instruments. Viewers should consult their own advisors before making financial or business decisions.
This post Josh Young: “Massive” Currency Debasement to Come From Oil’s Run Higher first appeared on Bitcoin Magazine and is written by Patrick Green.
Bitcoin Magazine

James Van Straten: BTC Bull Market Has Begun – Rotation from Gold Driver Back to $126K
Where will the money for Bitcoin’s next rally come from? CoinDesk’s James Van Straten looks at rotation out of gold, which sits about 25% below its all-time high, and what a correction in record-high US equities could mean for Bitcoin. He explains how stablecoin inflows have historically trickled into Bitcoin and why that could repeat. The discussion also covers Scott Bessent’s bond buybacks and the strong Bitcoin and gold rally that followed.
Chapters:
00:00 Bitcoin one year after its $126K all-time high
00:41 Why February was the Bitcoin bottom
01:24 Volatility and time compression in the Bitcoin cycle
02:06 Options overwriting and the institutional cycle
03:07 Will institutional demand make the bull market less violent?
04:22 Bitwise report: are Bitcoin holders becoming long-term?
06:20 Rate hikes, 10-year yields and the fiat system
08:35 Where Bitcoin’s next leg higher comes from: gold and equities
10:05 Euro contagion risk and the French bond market
12:09 Tokenization, altcoins and the 24/7 liquidity problem
DISCLAIMER: The views and opinions expressed in this show are those of the participants and do not necessarily reflect the official policy or position of BTC Inc., Bitcoin Magazine, or any affiliated entities. This content is provided for informational and educational purposes only and should not be construed as investment, legal, tax, or accounting advice. Nothing contained in this show constitutes a solicitation, recommendation, endorsement, or offer to buy or sell any securities or financial instruments. Viewers should consult their own advisors before making financial or business decisions.
This post James Van Straten: BTC Bull Market Has Begun – Rotation from Gold Driver Back to $126K first appeared on Bitcoin Magazine and is written by Patrick Green.
Bitcoin Magazine

StoneX Global Macro Director: French Bond Market Contagion & BTC Market Outlook | Vincent Deluard
Treasury yields, oil prices and the yen carry trade are all reaching a breaking point, and Vincent Deluard warns that equities could be next. The StoneX strategist argues that markets will hold up through the midterms and the Anthropic IPO, but that AI capex can’t keep doubling forever. After November, he plans to turn bearish on stocks while staying bullish on Bitcoin and gold.
Chapters:
00:00 Why Rising Treasury Yields Point to Long-Term Dollar Debasement
02:01 Can AI and Robotics Grow the US Out of Its Debt Problem?
03:48 Bitcoin vs. Gold: Which Is the Better Debasement Hedge?
05:36 What Daily Tax Collection Data Reveals About the US Economy
09:34 Inside France’s Bond Market Crisis and Its Debt Problem
12:21 Eurozone Contagion Risk and the Case for Shorting the Euro
15:02 Yen, Oil and Treasury Yields: Three Signals at a Breaking Point
17:15 Top-Heavy Stocks, the Anthropic IPO and a Post-Midterm Sell-Off
19:52 The Return of QE and Why It’s Bullish for Bitcoin and Gold
21:27 Bitcoin Price Outlook for the Next Two Years
DISCLAIMER: The views and opinions expressed in this show are those of the participants and do not necessarily reflect the official policy or position of BTC Inc., Bitcoin Magazine, or any affiliated entities. This content is provided for informational and educational purposes only and should not be construed as investment, legal, tax, or accounting advice. Nothing contained in this show constitutes a solicitation, recommendation, endorsement, or offer to buy or sell any securities or financial instruments. Viewers should consult their own advisors before making financial or business decisions.
This post StoneX Global Macro Director: French Bond Market Contagion & BTC Market Outlook | Vincent Deluard first appeared on Bitcoin Magazine and is written by Patrick Green.
CryptoSlate
Citi's $113,000 Bitcoin target would require a roughly 36% rise from the Oct. 7 reference price, keeping it below its previous record. The harder question is whether buying can sustain that recovery. Onchain analytics firm Glassnode's fresh analysis shows new money entering the market alongside unusually thin trading.
The bank raised its twelve-month Bitcoin forecast from $82,000 on Oct. 1, citing stronger activity, supportive macro conditions and renewed ETF inflows, Reuters reported. Citi also forecast $5 billion of crypto inflows over the following year as advisers and brokerages gradually increase allocations. That horizon points to approximately autumn 2027.
How large is the required move?
The calculation starts with the Bitcoin price quote on Oct. 7: $83,085. Reaching $113,000 requires a 36% gain, equivalent to approximately 2.6% compounded monthly over twelve months.
The target also sits about 10.5% below Bitcoin's prior $126,198.07 record. It would therefore be a recovery within a previously traded price range.
Holding the page's rounded circulating supply of 20.09 million BTC fixed, the target implies approximately $2.27 trillion in quoted market capitalization, an increase of about $601 billion. This approximate valuation comparison excludes subsequent coin issuance.
Market capitalization multiplies the latest price by circulating supply, revaluing coins that have stayed in holders' wallets. The $601 billion increase describes that change in valuation; the cash needed to move prices depends on actual trading.
Historical volatility supplies another scale check. Glassnode's point-in-time data put one-year annualized realized volatility at 43.97% as of Oct. 6. Using logarithmic returns to match the volatility measure, the required gain is about 30.8%, or 0.70 times that annualized scale. A probability or direction forecast would require additional assumptions.
What the ETF assumption can establish
Citi published a historical association in its January 2025 outlook: roughly 4.7% Bitcoin returns associated with each $1 billion of ETF inflows. The bank said flows explained about 46% of price-action variance in that analysis.
Its public summary leaves the observation frequency and complete regression equation undisclosed. Reuters' latest report also leaves the $5 billion flow category unspecified. Those gaps limit any calculation to an arithmetic illustration using an older relationship.
Assuming the entire reported $5 billion became Bitcoin ETF net inflows, applying the old association linearly to the Oct. 7 reference price gives 23.5% upside and a price near $102,600. This calculation cannot reproduce Citi's current model, establish that $5 billion is insufficient or identify a necessary annual inflow threshold.
Macro conditions and holders' willingness to sell can change how much a given amount of buying moves prices.
What the current data show
The Oct. 7 Glassnode report puts combined Bitcoin spot-exchange and US spot ETF trading volume at approximately $6.8 billion a day on a seven-day average. That is below the level on nine in ten days since January 2024. Volume measures trading activity; net flows measure the balance of money entering and leaving funds.
For the thirty days through Oct. 5, Glassnode estimated about $4.9 billion from ETF flows, stablecoin growth and corporate treasury buying. Bitcoin's realized capitalization rose about $12.8 billion over that period.
The inflow estimate combines several kinds of new money. Realized capitalization values coins at the prices when they last moved, so its increase measures a change in coins' aggregate cost basis. Both figures differ from the quoted market-cap increase calculated above.
US spot Bitcoin ETFs recorded net inflows of $118.8 million on Oct. 6, followed by net outflows of $484.9 million on Oct. 7, Farside's daily table shows.
The macro readings offer recent context rather than year-ahead thresholds. The Federal Reserve's broad dollar index, which differs from DXY, rose about 0.34% from Sept. 30 to Oct. 2. The ten-year Treasury yield increased seven basis points, from 5.24% on Oct. 1 to 5.31% on Oct. 5.
Meanwhile, DefiLlama's Oct. 7 dashboard showed about $308 billion of stablecoin capitalization and roughly 1% growth over thirty days. That stock of tokens has several uses, so its impact on Bitcoin depends on how holders deploy it.
Recurring net ETF purchases accompanied by stronger spot activity would strengthen the demand case for $113,000. Renewed fund redemptions would weaken that evidence of sustained buying. Glassnode's composite estimate shows new money arriving, while thin turnover leaves broad participation uncertain. The required price move has historical precedent; whether buyers can sustain it remains the open question.
The post Citi predicts Bitcoin going back to $113,000. Here’s what the buying data shows appeared first on CryptoSlate.
Bitcoin’s US-session weakness is deepening as BTC prices on Coinbase trade at a $64 discount to Binance, the largest global crypto exchange
Bitcoin has lost a compounded 3.24% during US stock-market hours since Sept. 21, while prices outside that window advanced 6.07%, according to a CryptoSlate analysis of Binance BTC/USDT trading.
During this period, CryptoQuant’s Coinbase Premium Gap fell to -$64, pointing to weaker demand or heavier selling on the US-focused exchange.
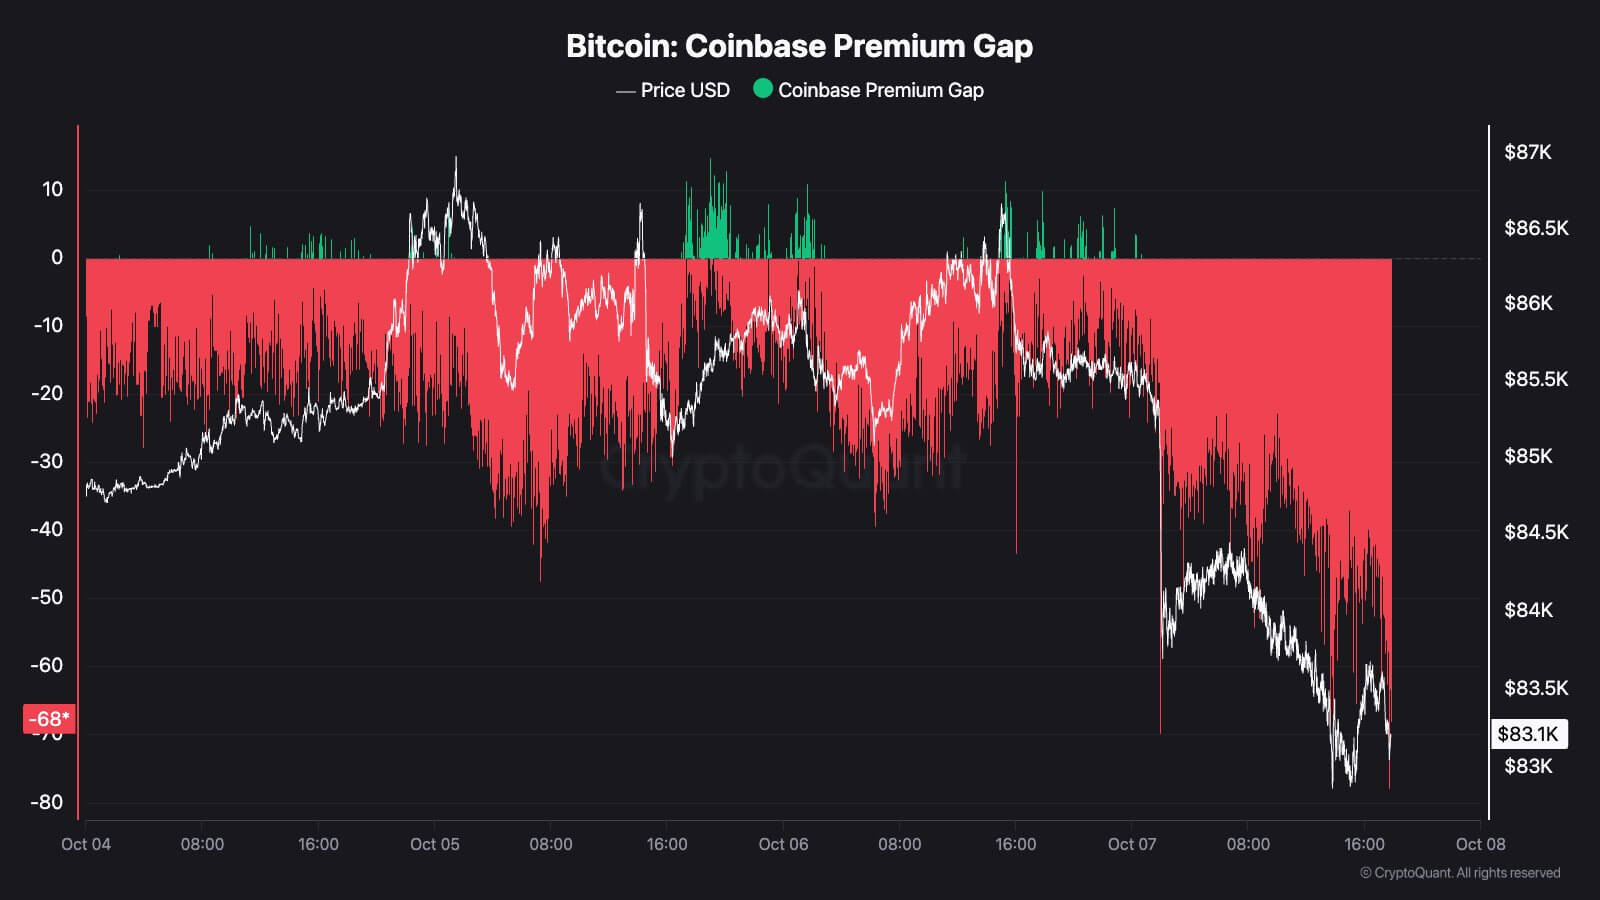
The pattern supports Glassnode’s view that the American trading session has become a source of pressure. But the losses were heavily concentrated in two sessions, while ETF flows on those dates moved in opposite directions, complicating claims of persistent institutional selling.
Two sessions drove most of the decline
Across 13 Wall Street cash sessions from Sept. 21 through Oct. 7, Bitcoin fell during eight. According to CryptoSlate's analysis of Binance's data, the largest declines came on Sept. 30 and Oct. 2, when prices dropped 1.86% and 2.65%, respectively, during the 9:30 a.m.-to-4 p.m. New York window.
Remove those two dates and the remaining 11 sessions produce a compounded 1.28% gain.
That influence matters because the headline 3.24% loss can otherwise suggest a steadier deterioration than the data shows. The US session was frequently weak, but much of the cumulative damage came from two sharp moves rather than a uniform pattern of selling.
The data also show that the result changes when the trading window shifts.
Starting the US session at 9 a.m. instead of 9:30 a.m. produces a compounded 4.94% loss through 4 p.m. over the same period. Starting at 10 a.m. results in a 5.41% decline.
After excluding Sept. 30 and Oct. 2, those alternative windows still show losses of 0.16% and 1.68%, respectively. That leaves the positive 1.28% remainder dependent on the exact 9:30 a.m. opening boundary.
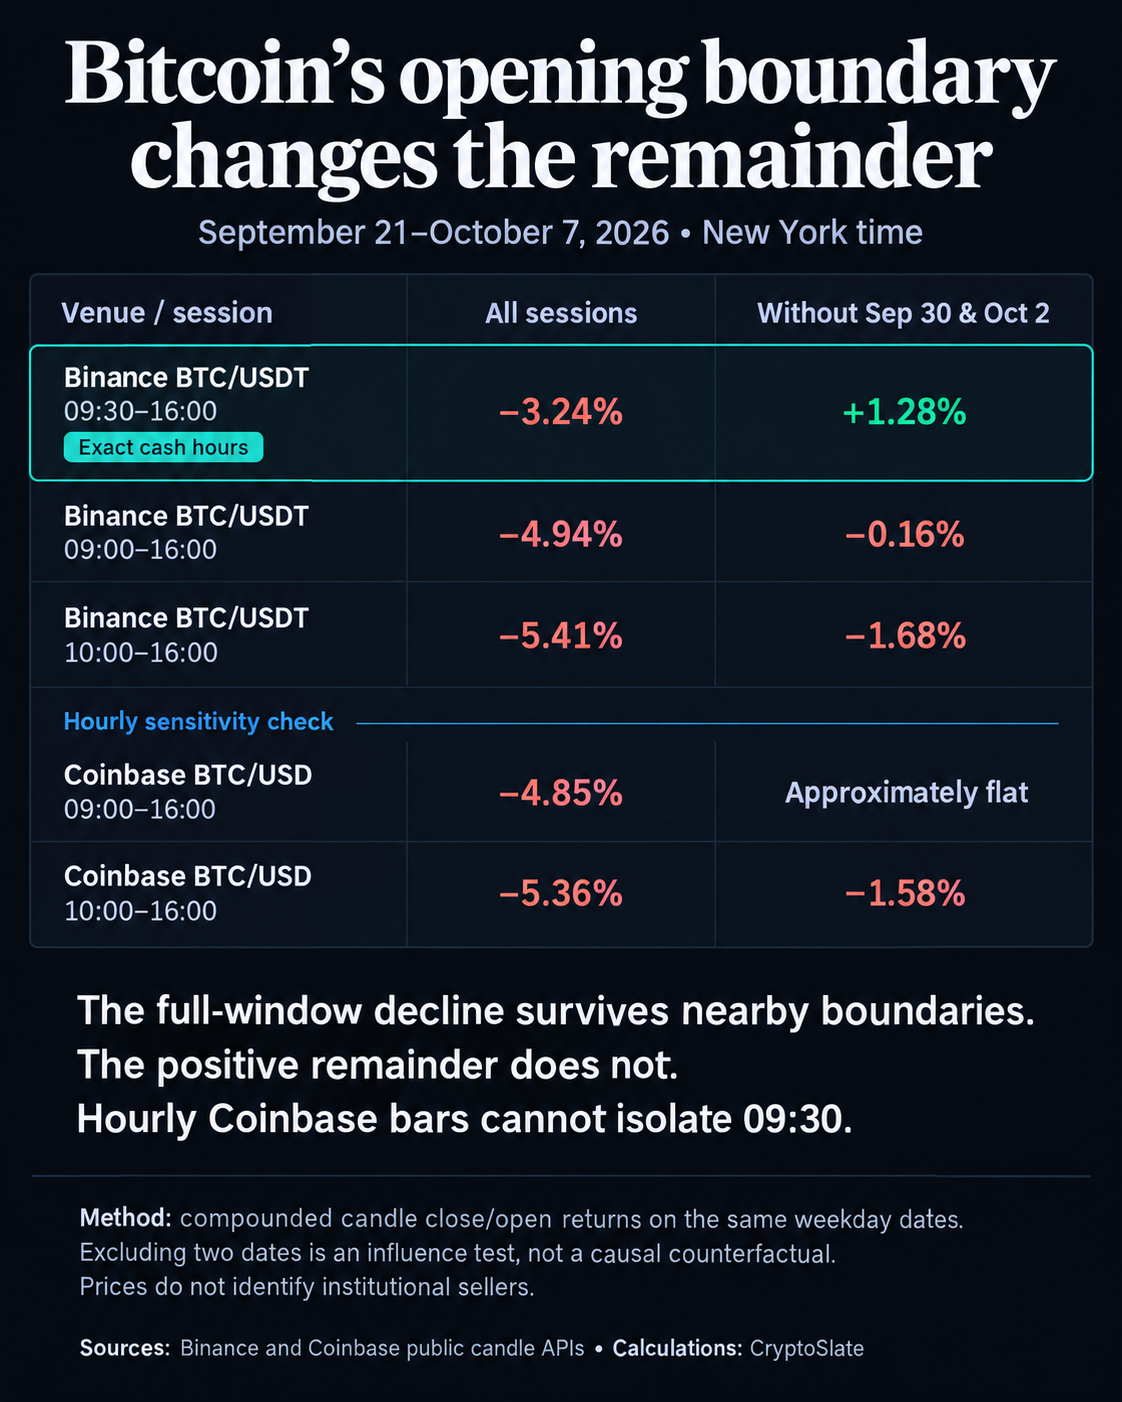
Coinbase price data points to a similar broader pattern. Bitcoin declined about 4.85% between 9 a.m. and 4 p.m. and 5.36% from 10 a.m. to 4 p.m. over the same period.
The agreement across Binance and Coinbase strengthens the timing signal while leaving participant identity unresolved.
Binance tracks Bitcoin against USDT and Coinbase against dollars, and neither venue reveals whether sellers are US institutions, retail traders, market makers or global investors active during American business hours.
Glassnode said this week that Bitcoin’s net gains since Sept. 21 have largely come outside the US session, reversing an earlier stretch when American trading hours contributed more strongly to the advance.
ETF flows fail to identify the seller
Fund flows provide the clearest challenge to a simple institutional-selling explanation.
US spot Bitcoin ETFs recorded $148.7 million of net outflows on Sept. 30, aligning with the first major US-session decline. Two days later, however, the funds attracted $189.9 million even as Bitcoin fell 2.65% during Wall Street hours.
The divergence suggests that ETF investors alone cannot explain the session weakness.
Outflows became more pronounced on Oct. 7, when the products recorded $484.9 million in net withdrawals. That shows demand from the funds has weakened at times, but daily totals still do not reveal when underlying Bitcoin was sold or which investors drove the market lower.
The mechanics of redemptions add another layer. Since regulators allowed in-kind creations and redemptions for crypto ETFs in 2025, withdrawals can involve transferring Bitcoin rather than an immediate cash sale.
That leaves the Coinbase discount as an important supporting signal rather than definitive proof of institutional selling. A sustained negative premium suggests weaker pricing on a venue closely associated with US investors, but it cannot identify the beneficial owners behind individual trades.
The next several sessions will test whether the pattern is becoming more persistent.
If Bitcoin continues to lose ground during Wall Street hours while the Coinbase discount remains deeply negative and ETF outflows build, the case for sustained deterioration in US demand would strengthen.
A recovery in US-session returns without a corresponding rebound in ETF flows would point elsewhere, potentially toward market makers, derivatives positioning, or other participants supplying Bitcoin during the American trading day.
The post Bitcoin keeps losing ground when Wall Street opens as Coinbase discount deepens appeared first on CryptoSlate.
THORChain’s September income surged as Bitget-linked flows drove the protocol’s busiest stretch in more than a year.
The cross-chain exchange generated $3.01 million in system income last month, its highest since March 2025, while swap volume climbed to $2.40 billion, the most since June 2025.
Much of that activity was compressed into five days following the Bitget hack. About $1.37 billion, or 57% of September’s swap volume, crossed THORChain between Sept. 25 and Sept. 29, while the network generated roughly $1.9 million of income during the same period, equivalent to about 63% of the monthly total.
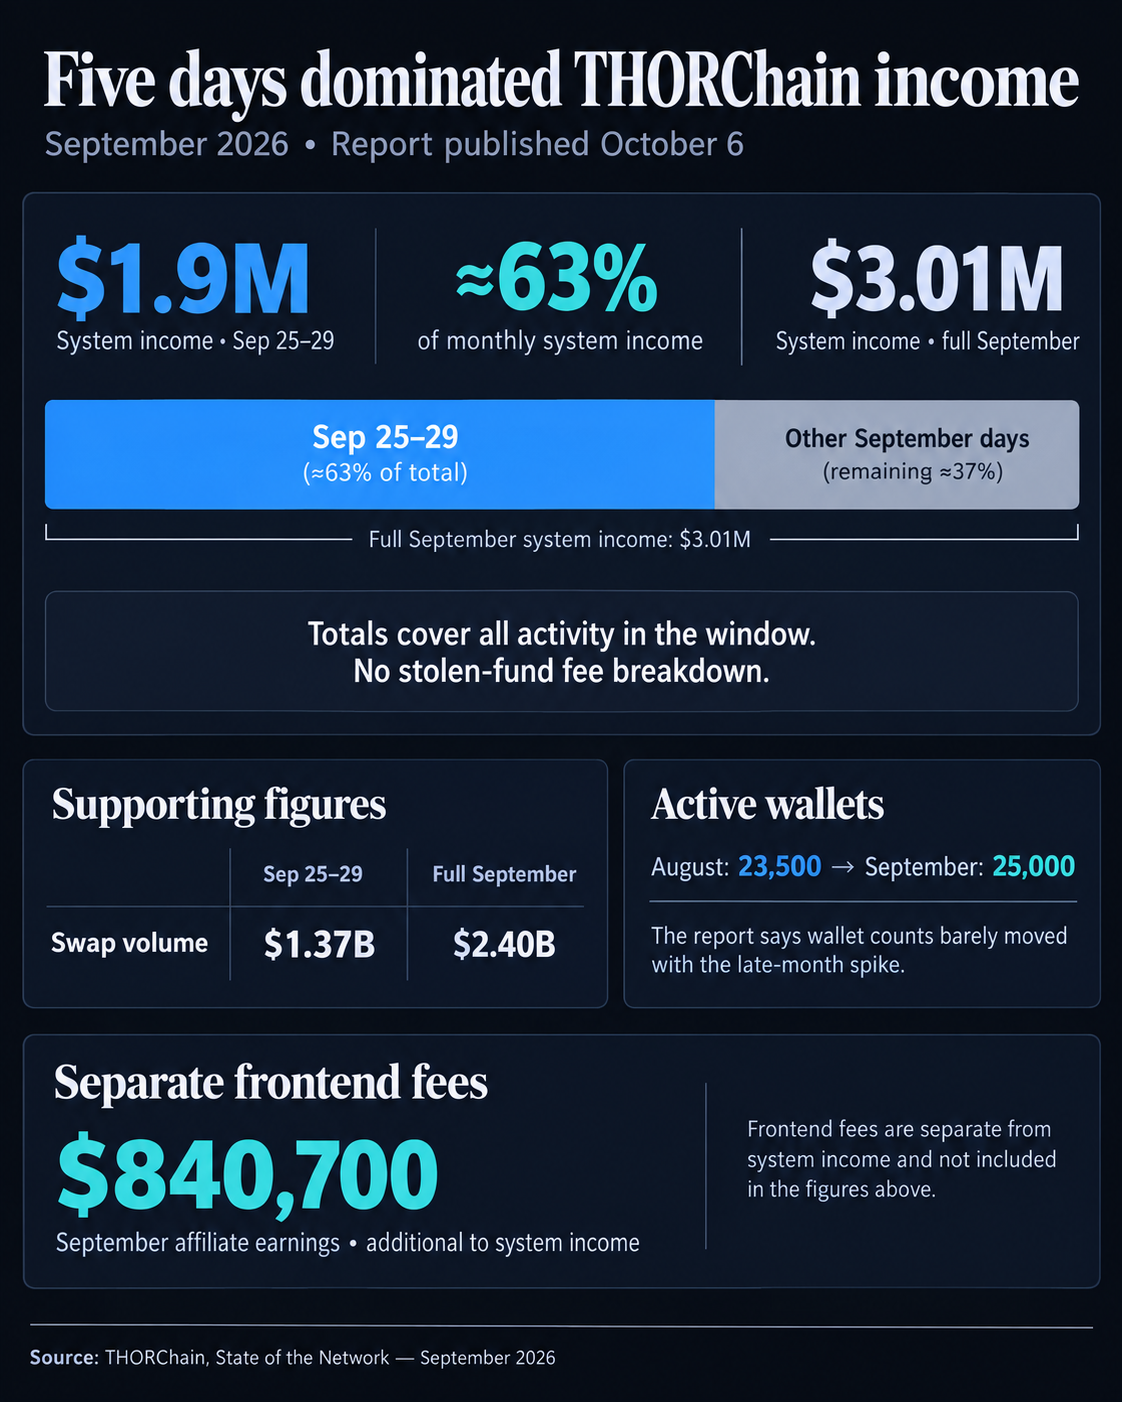
THORChain said the surge coincided with funds linked to the Bitget exploit moving through the network. It explained:
“Between September 25 and 29, daily volume ran between roughly $190M and $460M as funds linked to the Bitget exploit moved through the network.”
The concentration nevertheless highlights the economic consequences of a position THORChain defended as Bitget sought to limit the movement of stolen funds.
After the exchange was hacked, THORChain rejected calls for selective intervention, arguing that the protocol is decentralized and permissionless in the same way as Bitcoin, Ethereum and BNB Chain.
It also distinguished a network halt, an emergency mechanism designed to protect THORChain itself, from censoring individual addresses or transactions. The protocol pointed to its own May exploit, when attackers stole $10.7 million from liquidity pools but were not blacklisted from swapping assets through the network afterward.
Bitget said roughly $387.5 million was ultimately transferred to attacker-controlled addresses during the September breach.
THORChain's record activity came without a user boom
THORChain’s wallet data suggests the revenue jump reflected unusually large flows rather than a comparable expansion in its user base.
Active wallets increased to 25,000 in September from 23,500 in August, while new wallets edged up to 22,400 from 21,800. THORChain said wallet activity barely responded to the late-month volume spike, pointing to concentrated transactions from a relatively small number of participants.
That distinction complicates the headline improvement in protocol economics.
September income was almost five times August’s $615,000, while swap volume nearly quadrupled from $613 million. Yet most of the incremental activity came during the same narrow period when hack-linked assets moved across chains.
The burst also inflated trailing yield measures. RUNE’s seven-day annualized return reached 69.03% on Sept. 29, while TCY’s climbed to 29.74%. THORChain expects those readings to decline as the high-fee days roll out of the calculation window.
Frontend affiliates separately earned about $840,700 during September, with roughly $669,000 going to unidentified affiliates.
For liquidity providers and token holders, the next test is whether ordinary trading can replace the exceptional activity that lifted September’s returns.
If volume normalizes toward pre-hack levels while wallet growth remains modest, income and trailing yields could retreat sharply. A sustained improvement would require THORChain to convert September’s visibility into recurring flow from traders and integrators rather than rely on episodic bursts generated by unusually large transactions.
The post THORChain made 63% of its record $3 million September income during the Bitget hack-linked trading surge appeared first on CryptoSlate.
BitMine Immersion Technologies Chairman Tom Lee said the company will stop accumulating Ethereum once its holdings reach 5% of the cryptocurrency’s supply, capping the strategy that made it ETH’s largest corporate holder.
Speaking at TOKEN2049 in Singapore, Lee said BitMine was already close to that limit and would not pursue an open-ended accumulation campaign. He said:
“We only need to get another 100,000 ETH to get to 5%.”
Notably, the company is actually slightly closer than Lee’s rounded estimate suggests. BitMine held 6,016,414 ETH as of Oct. 4, equal to about 4.9% of the 122.1 million ETH supply cited in its latest disclosure.
This means BitMine would need roughly 88,586 ETH to reach 5% of the 122.1 million ETH supply used in its calculations.
At an illustrative ETH price of $2,500, acquiring the remainder could cost roughly $221 million. BitMine reported $643 million in cash and marketable securities, giving it enough disclosed liquidity to cover the gap while retaining most of that liquidity.
BitMine could reach its 5% ceiling within weeks
BitMine’s latest official purchase rate puts Lee’s 5% ceiling within reach before the end of the year, even if the company slows its accumulation.
The company added 15,112 ETH in the week through Oct. 4, its latest disclosed weekly purchase. At that pace, acquiring the remaining 88,586 ETH would take about 5.9 weeks, putting the threshold within reach around mid-November.
A faster buying program would shorten the timeline. If BitMine increased purchases to 20,000 ETH per week, it could close the gap in roughly 4.4 weeks. At a slower rate of 10,000 ETH per week, the process would take about 8.9 weeks, pushing the milestone into early December.
Those scenarios are projections rather than company guidance. BitMine has not committed to a fixed weekly purchase schedule, and changes in Ethereum’s total supply could alter the number of tokens corresponding to a 5% stake.
Meanwhile, there are also signs that BitMine may have already made further progress beyond its latest disclosure.
On Oct. 7, blockchain analysis platform Lookonchain reported that the company appeared to acquire another 12,500 ETH worth $33.65 million through BitGo. BitMine has not yet incorporated that transaction into an official holdings update, so it is excluded from the projections above.
If confirmed as an additional purchase, however, it would reduce the remaining gap to about 76,086 ETH, meaning the company could reach Lee’s ceiling sooner than the timetable implied by its latest reported holdings.
That leaves BitMine approaching a point where the mechanics of its Ethereum strategy will have to change. Once purchases are constrained by the 5% limit, further growth in its ETH position would increasingly come from staking rewards rather than continued market accumulation.
ETH staking takes over from accumulation
BitMine is already positioning staking as a larger source of returns from its Ethereum treasury.
The company had about 5.07 million ETH staked as of Oct. 4, equivalent to roughly 84% of its holdings, and estimated that position could generate about $363 million in annualized revenue.
BitMine projects that staking its entire ETH balance could lift annualized revenue to roughly $431 million, based on a 2.63% annualized yield. That would make staking income increasingly important once the company can no longer expand its treasury through purchases.
But earning ETH also complicates Lee’s hard cap.
Staking rewards continuously add tokens to BitMine’s balance sheet. Once its holdings approach 5% of Ethereum supply, those rewards could push the company beyond the threshold even without another open-market purchase.
How BitMine intends to manage that excess has not been fully established. It could leave less room below the ceiling for purchases, change how it handles staking rewards, or dispose of some ETH if needed to stay below the limit.
The target itself will also move with Ethereum’s supply. A contraction would lower the number of ETH BitMine can hold while staying below 5%, while an increase would create additional capacity.
That leaves BitMine with a different capital-management challenge as the accumulation phase winds down. The company has spent more than a year focused on adding ETH; maintaining Lee’s ceiling could eventually require it to manage the tokens its existing treasury produces.
The post BitMine’s Ethereum buying spree could end in six weeks appeared first on CryptoSlate.
Bitcoin has fallen nearly 5% this week as weak trading volume and profit-taking blunt attempts to reclaim $85,000.
The largest cryptocurrency traded around $83,100 as of press time, extending a retreat that followed Sunday’s brief close above the key level. Bitcoin has since failed to sustain that breakout, slipping beneath newly placed sell orders before buyers around $85,000 also gave way.
On-chain data suggests the pullback is unfolding against two related pressures: unusually weak participation and a large pool of recent buyers with profits available to realize.
Combined Bitcoin trading across spot exchanges and US spot exchange-traded funds averaged about $6.8 billion a day over the seven days through Oct. 6, Glassnode said. That was lower than on 90% of trading days since January 2024.
The weakness persisted even as Bitcoin tried to break resistance. Sunday’s close above $85,000 came on roughly half the trading volume of a typical Sunday, while no session since Sept. 22 has recorded normal spot volume for its respective day of the week.
At the same time, sellers approaching the market have increasingly been recent buyers sitting on gains.
About 86% of all Bitcoin sent to exchanges on Oct. 4 came from short-term holders moving coins at a profit, according to Glassnode. This share was the highest in a year, compared with less than 40% on a typical day.
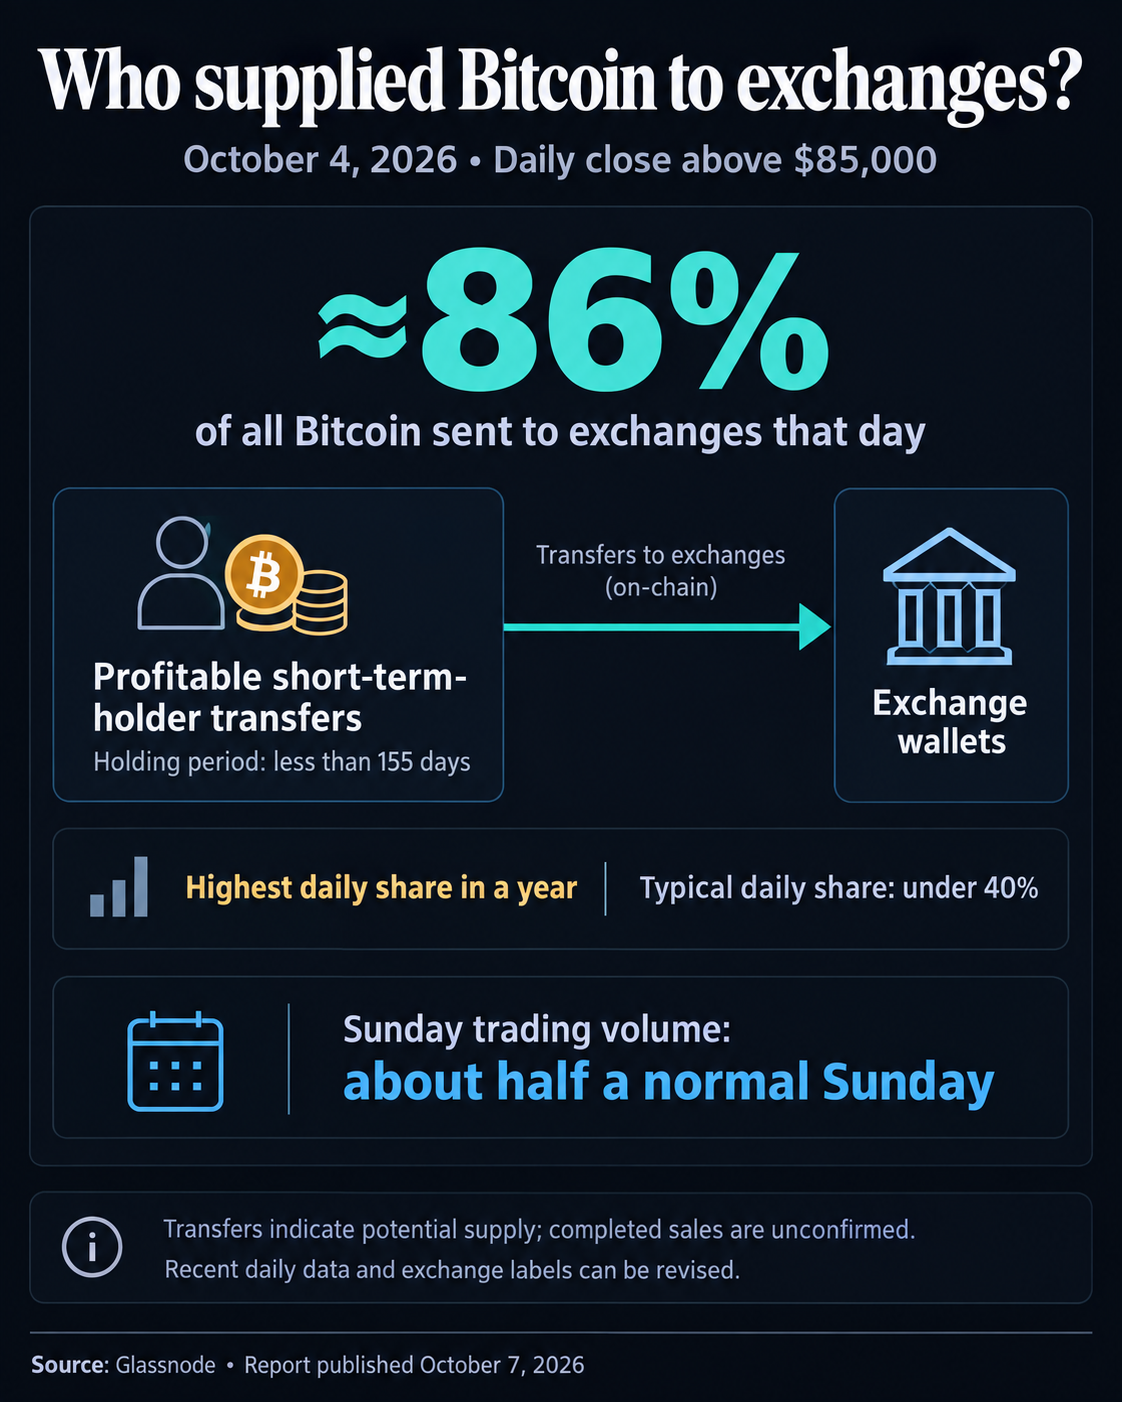
Glassnode classifies short-term holders as investors who have owned Bitcoin for less than 155 days. Transfers to exchanges can precede sales but do not establish that the coins were ultimately liquidated.
Profitable Bitcoin holders leave $81,900 as the next test
The potential supply extends well beyond the coins moved over the weekend.
Separate CryptoQuant data showed about 92% of all short-term holders are currently in profit, equivalent to roughly 3.27 million BTC. That means only a small portion of recent buyers are underwater even after Bitcoin’s nearly 5% decline this week.
The cushion, however, is narrowing for the market’s newest entrants.
Bitcoin acquired between one week and one month ago has an average cost basis of about $81,900, CryptoQuant data showed. That level, roughly 1.4% below the current price, represents the average entry point for some of the most recent market participants and could become an important support zone if the decline extends.
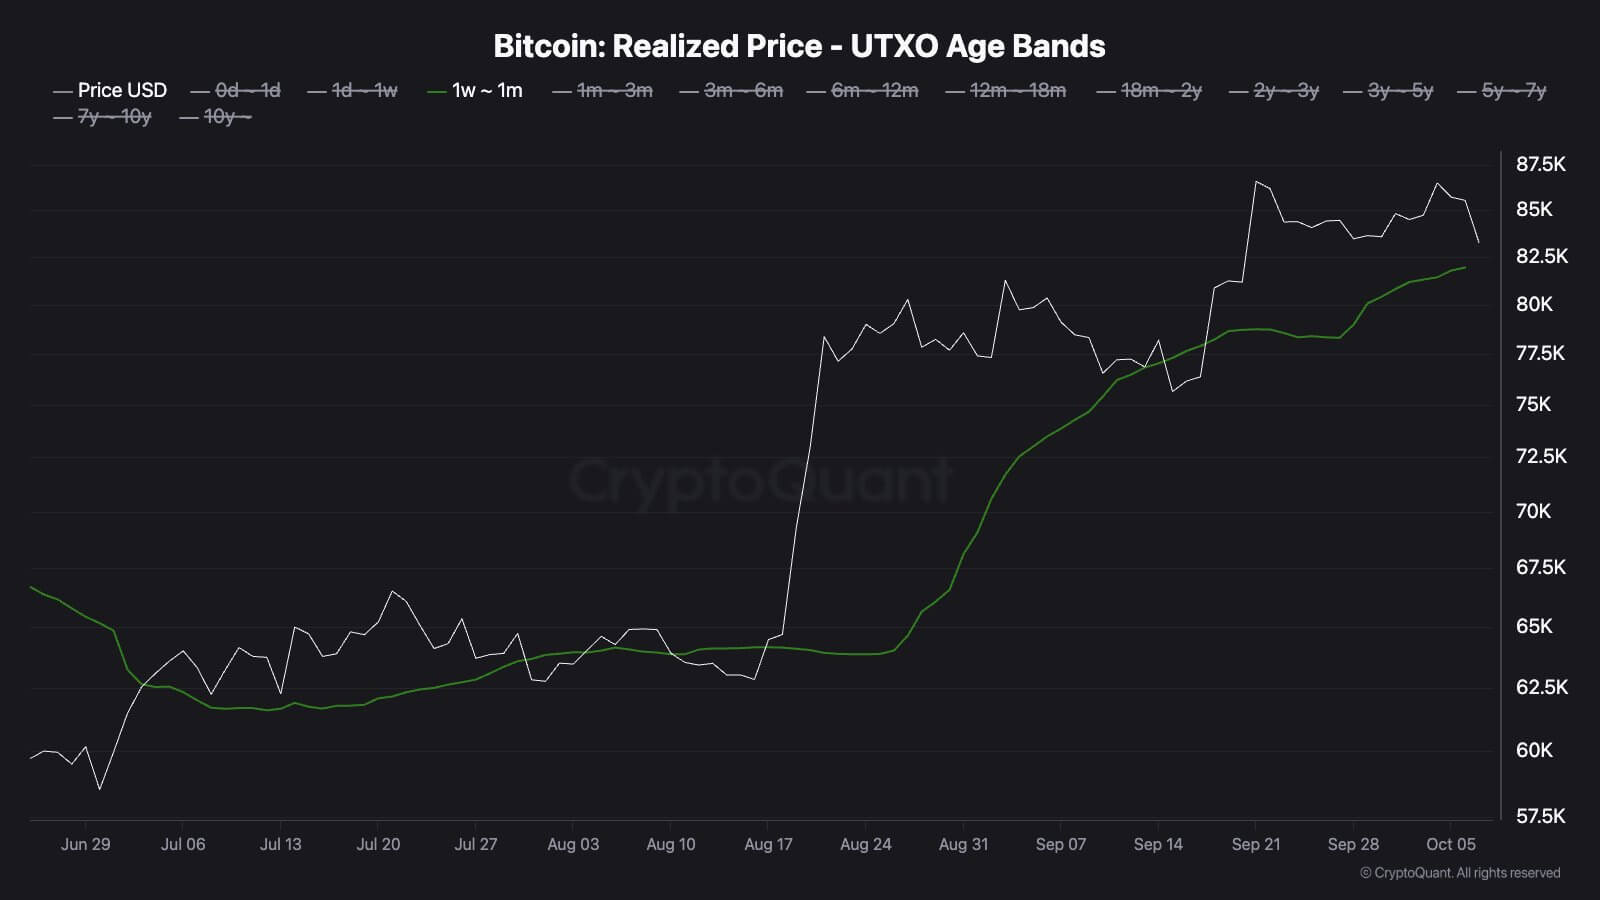
A break below it would push a larger share of those buyers into unrealized losses, potentially changing their behavior just as Bitcoin struggles to generate enough demand to clear $85,000. Holding above the level would preserve profits for much of the cohort, but also leave those investors with gains they could realize into another rebound.
That tension is amplified by weak liquidity. With trading activity depressed, the market may require a stronger influx of spot and ETF buyers to absorb coins from profitable holders near resistance.
Fresh capital has also struggled to keep pace with the increase in Bitcoin’s market value. Glassnode estimated that US spot ETF flows, stablecoin growth and corporate treasury purchases brought about $4.9 billion into the market during the 30 days through Oct. 5, while realized capitalization increased by roughly $12.8 billion.
The next move therefore leaves Bitcoin caught between two nearby thresholds. A recovery above $85,000 would test whether stronger demand can absorb profit-taking from recent holders, while a decline toward $81,900 would challenge the cost basis of buyers who entered during the past month.
How those holders respond around that level, alongside whether spot and ETF volumes recover, could determine whether this week’s decline remains a failed breakout or develops into a deeper reset of recent positioning.
The post Bitcoin’s failed breakout reveals a dangerous mix of thin volume and easy profits appeared first on CryptoSlate.
CryptoTicker.io
Around $487 million flowed out of the US spot ETFs on Bitcoin on net on October 7, 2026. It is the heaviest single day in weeks, and it hits a market that is already weak: Bitcoin traded between $82,650 and $82,860 on the morning of October 8.
The number still does not work as a sell signal, for two reasons. First, daily flows measure something other than most readers assume. Second, no investor in Germany can reach these funds; anyone betting on Bitcoin here holds either an exchange-traded certificate or the coins themselves. This article places both.
$487 Million in Net Outflows: the SoSoValue Tally for October 7, 2026
The data service SoSoValue reports net outflows of $487.07 million from all US spot Bitcoin ETFs for October 7, 2026. A net outflow is the difference between all shares a fund newly issued on that day and all shares it redeemed, counted in dollars. The figure thereby reverses the previous day's inflows.
For scale: the eleven US spot funds together hold net assets of some $107.4 billion, and cumulative net inflows since approval add up to around $57.3 billion according to SoSoValue. Both figures are in the SoSoValue Bitcoin ETF dashboard.
$484.9 Million or $487.07 Million: Two Data Providers, Two Daily Figures
Read the same tally at a second provider and you get a different number. The flows table from Farside Investors lists a daily balance of $484.9 million for October 7, 2026. The divergence comes to a good $2 million, so just under half a percent of the daily value.
The gap is method, not error. Daily flows are provisional estimates: providers back them out from published share counts and a reference price, and they set the cut-off time differently. Only the fund companies' monthly reports are final. For reading the data that means the order of magnitude of a day holds up, the second decimal place does not.
How to Recognise a Reliable Flow Figure
A flow figure is usable when three details come with it: the reference date, the data provider, and whether only spot funds or futures products too are counted in. If one of them is missing, you may be comparing two different things. Ether and Bitcoin funds get mixed up particularly often because both are reported on the same day; for Ether, a separate outflow run over six trading days was under way as of October 7, 2026.
Creation and Redemption: a Net Outflow Is Not Immediate Selling Pressure on the Spot Market
A spot ETF does not issue shares to retail investors one at a time. It works with authorised participants, large trading houses that create and return share packages against Bitcoin or against cash. The process is called creation on the way in and redemption on the way out.
When a participant returns shares, the fund has to hand over Bitcoin accordingly. Whether those coins are actually sold on the open market depends on how the participant is running its own position at the time. Part of the movement runs as a swap between balance sheets, without a single order reaching the order book. The flow figure therefore describes how much fund capital has left the wrapper, not how much Bitcoin was pushed into the market.
The number only becomes usable in practice over a sequence. A week with outflows on four of five trading days says more than a single large day. How fast that direction can flip is clear from the annual tally: as recently as mid-September, strong inflows had turned the Bitcoin funds' yearly balance positive.
IBIT Carries $208 Million of the Outflow
The largest single item of the day sits with BlackRock's iShares Bitcoin Trust, by far the biggest fund in the group. Around $208 million flowed out of it on October 7, 2026, roughly 43 percent of the daily balance.
That the market leader carries the largest outflow is hardly surprising: where the most money sits, the most also moves in absolute terms. The outflow relative to each fund's assets would be more telling, and that is precisely the ratio the data services do not publish consistently. Per-fund figures also diverge between providers here, more clearly than the daily balance does. Take single-fund values as a direction, then, not as a measurement.
Bitcoin at $82,653: the Support Zone From $82,000 to $83,000
On the morning of October 8, 2026, Bitcoin stood at $82,653 and thus 1.8 percent below the previous day; within 24 hours the price had swung between $82,318 and $84,340. A separate query of CoinGecko price data on the same morning returned $82,860, so the spread across sources comes to a good $200.
Jeff Ko of ViaBTC locates the support in the zone between $82,000 and $83,000. Lacie Zhang of Bitget Wallet names the $82,000 to $82,500 range as a liquidation zone and warns that losing that level could push the price towards $80,000; a sustained break below it would undo her bullish October scenario. To the upside, she argues, the price first has to reclaim $87,500 before $95,000 comes within reach. Both assessments are market expectations of individual houses, not documented quantities.
$546 Million in Liquidations in One Day, 88 Percent of Them Long Positions
Alongside the fund outflows, positions worth $546 million were closed by force on October 7, 2026, around 88 percent of them on the buying side. A liquidation is the automatic closure of a leveraged position as soon as the collateral no longer covers it. An earlier wave in the same week had cost $433 million after the rejection at the $87,000 level, measured by CoinGlass.
This chain explains why a price slide sometimes accelerates by itself even though no new piece of news arrives: every forced closure generates a sell order, which presses the price onto the next liquidation threshold. The week delivered two such waves.
Crypto ETP Instead of a US Spot ETF: German Investors Are Left With the Xetra Route
Here begins the part that makes the number practical for you. The funds discussed are approved in the United States and may not be marketed to retail investors in the European Union. A German brokerage account either does not display them at all or rejects the order.
What is tradable here are crypto ETPs and ETNs: exchange-traded debt securities that track a coin and are usually backed physically with it. Such paper trades on Xetra and on the regional exchanges. They do not constitute fund assets; they establish a claim against the issuer. Which products exist and how they differ is set out in our overview of buying a crypto ETF in Germany. Buying the coins directly runs through a trading platform instead; a MiCA-licensed address can be found in the comparison of the best crypto exchanges.
Expense Ratio, Spread and Issuer Risk: How to Check a Bitcoin ETP Before You Buy
A day of outflows changes nothing about an ETP. The points that genuinely move your return are in the product fact sheet, and two of them are routinely overlooked.
- Physical backing: is the corresponding quantity of Bitcoin held with a custodian for every certificate, or does the product replicate the price synthetically? The custodian and the degree of backing are stated in the product documents.
- Expense ratio: the annual flat fee is taken out of the product daily and works more powerfully over the years than any single trading fee.
- Spread and trading hours: the difference between the buying and selling price is wider in the evening and at the weekend, because the underlying market is thinner then. Bitcoin itself trades around the clock, the certificate only during exchange hours.
- Issuer risk: because an ETN is a debt security, your claim hangs on the issuer's solvency. Trust structures soften that, they do not remove it.
- Custody fees: some brokers charge separate safekeeping fees for crypto ETPs, running alongside the expense ratio.
Lay these points side by side for two products before you place an order. Differences in the expense ratio reach a good percentage point a year in this market, and that beats any forecast about the next fund flows.

Holding Period and Withholding Tax: the Classification for an ETP and for Direct Bitcoin Diverges
In tax terms the two routes are two different worlds, and that difference often weighs more heavily than the fees.
On a direct purchase, coins count as another economic asset. A gain on sale falls under the private disposal transaction set out in section 23 of the German Income Tax Act: after a holding period of more than a year it stays free of tax, within the year it is charged at the personal tax rate, above the exemption limit for such transactions.
An ETP or ETN, by contrast, is a security. Gains from it count as investment income and are subject to withholding tax of 25 percent plus the solidarity surcharge and, where applicable, church tax, settled through the saver's allowance and independent of the holding period. A one-year holding period does not exist there.
This section needs one caveat: German lawmakers are currently working on the taxation of crypto transactions. According to our report of October 8, 2026 on the crypto holding period, the deadline for comments on the draft expired on October 6, and the decision in the federal cabinet is scheduled for October 14. Do not rely on today's position alone for your own case, then, but clarify it with a tax adviser.
$107.4 Billion in Fund Assets: One Day of Outflows Equals 0.45 Percent
To close, the ratio calculation that is missing from the headlines. Set the $487 million against net fund assets of around $107.4 billion and about 0.45 percent of the assets leave the funds on that day. Against cumulative inflows of some $57.3 billion it is a good 0.85 percent.
Both values are small, and therein lies the actual news. In two years, ETF demand has grown from a headline into a holding that absorbs single trading days. Only a series of outflow weeks would visibly eat into that holding, and after one day it has not come to that.
What You Can Watch in the Coming Days
Two quantities deliver the next reliable signal: the daily balance of the spot funds across a full trading week, and the zone between $82,000 and $83,000 that Jeff Ko names as support. If the zone holds and the flows turn positive, October 7 was an episode. If the price falls below $80,000 and the flows stay negative, the figure from October 7 describes a beginning.

Bitcoin ETF Outflows: $487 Million Is One Day, Not a Trend
- Establish which wrapper you are actually invested through. A US spot ETF is not open to you in Germany, and whether your account carries crypto ETPs differs by provider: a check is worth it in the comparison of the best crypto brokers.
- Record the purchase date, purchase price and fees of every position, because the holding period and withholding tax bite differently. Tools for that are in the comparison of crypto tax software and portfolio trackers.
- For coins held directly, decide where the keys sit. The differences between the devices are in the hardware wallet comparison.
More detail on the price levels and analyst voices of that day is in the report by The Crypto Times.
(As of October 8, 2026. This article is not investment advice. Prices and fee structures change; check the terms with the provider before you buy.)
The largest single standing buyer of Ether switches itself off within weeks. BitMine holds 6,016,414 Ether by its own statement, around 4.9 percent of all 122.1 million coins in circulation. At five percent, roughly 6.105 million Ether, the programme ends. That leaves about 100,000 Ether, six to seven weeks of buying at last week's pace. For the Ethereum prediction that means the demand side loses a buyer who has stepped in every week since mid-2025, and it happens in a phase in which the funds are pulling money out as well. On Thursday morning Ether traded at $2,566.99, down 1.1 percent on the day and 4.5 percent on the week.
What you make of this depends less on the price than on three things you control yourself: your holding period, your buying route, and whether you leave Ether sitting or put it into staking. This piece takes Tuesday's and Wednesday's numbers apart and says which levels carry the coming weeks and which do not.
BitMine Holds 6,016,414 Ether, Around 100,000 Short of the Five Percent Cap
BitMine Immersion Technologies has built the largest Ether treasury in the listed world since mid-2025. The statement dated October 5 shows 6,016,414 Ether, alongside a purchase of around 15,112 Ether in the week before, worth some $41 million at market prices. Measured against the 122.1 million Ether in circulation, that is 4.9 percent.
Circulating supply refers to the coins that are actually tradable, as distinct from total supply including locked holdings. Five percent of that sits at roughly 6.105 million Ether. The gap of around 100,000 Ether is the entire remainder of the programme.
Convert that into time and the order of magnitude becomes tangible. At 15,112 Ether a week and an unchanged pace, the cap is six to seven weeks away. On today's basis the end of the buying programme therefore falls in the second half of November or in early December. A slower pace pushes the date back, a faster one brings it forward. Only the ceiling is fixed, not the date.
Tom Lee Calls the Five Percent Cap a Hard Ceiling in Singapore
It was BitMine chairman Tom Lee who said so on Wednesday at the TOKEN2049 conference in Singapore. He spoke of the alchemy of five percent and described the threshold as a hard ceiling. On the pace of the build-up he said: “We thought it would take five years.” And: “It cost us a good year.” Both remarks fell in a year in which Ether has lost substantially.
The reversal is the notable part. In August, in an interview on the Bankless format, Lee had explained that his company had no reason to sell: staking income of some $300 million a year covered the $30 million to $35 million preferred dividend on the 9.5 percent Series A several times over, and the five percent question would be revisited in 2027. Six weeks later the open horizon has become a ceiling.
The market repriced it immediately. BitMine stock gave up 7 percent on Wednesday, rival SharpLink 5 percent, and Michael Saylor's Strategy also lost 5 percent. For investors who take crypto exposure through listed treasury companies rather than through a regulated trading platform, the uncomfortable lesson of the week sits here: a treasury that stops growing loses its most important narrative.

Staking Income as a New Source of Selling: What Changes on the Ether Supply Side
The second part of the announcement weighs more heavily for supply than the first. Lee held out the prospect that BitMine could sell the Ether the company earns through staking in order to keep its own share below the five percent ceiling. A buyer would thereby turn into a seller.
The scale is in the company's own statement. Around 5,067,309 Ether, some 84 percent of the treasury and worth roughly $13.8 billion at market prices, sit in staking through the in-house validator network MAVAN and through partners. At a seven-day yield of 2.63 percent that extrapolates to about $363 million a year. Should that stream flow to the market in future instead of into the treasury, additional supply on that scale meets a market that is already under pressure.
Staking means posting your own Ether as collateral so that they help confirm blocks, with new coins paid out as the reward. If you do it yourself, know the lock-up periods and the withdrawal times before you choose a provider: our comparison of staking platforms sets yield, minimum amount and payout duration side by side.
ETF Outflows of $506.3 Million in Five Days, the Highest Total Since January
The second pressure point comes from the exchange-traded funds. On October 6 the US spot Ether ETFs saw net outflows of around $202 million, and $201.89 million of that, practically the entire sum, fell on BlackRock's ETHA. October 7 brought a further $160.8 million, again led by ETHA with $116.1 million, behind it Grayscale's ETHE with $25.8 million. Across five trading days the total comes to $506.3 million, the highest five-day figure since January 23, 2026.
For comparison: in September the same funds still gathered $832 million. The providers count differently because they use different fund groups and cut-off times; some houses describe October 7 as the sixth consecutive day of outflows, others as the seventh. The direction is the same in every count.
If you hold Ether inside a fund wrapper instead of directly, you carry this mechanism with you. Outflows force the issuer to sell the coins held in deposit, and that reinforces the very move that triggered the outflow. Which wrapper is physically backed and which runs through a debt security is set out in the issuer's key information document.
Ethereum Price at $2,566: the Supports at $2,548 and $2,500
On Thursday morning Ether stood at $2,566.99. That is around 8.5 percent below the weekly high at $2,806. The next widely watched support sits at $2,548, the round level beneath it at $2,500.
Technical analysts who published scenarios this week map the next catch zones between $2,330 and $2,355 on a sustained break of $2,500, and $2,200 after that. To the upside the zone around $2,800 counts as a hurdle, and in those presentations it only becomes reliable again once the funds turn from outflows back to inflows. These are external assessments and not an assurance; the span between $2,200 and $2,800 shows above all how far apart expectations lie.
For the prediction the sequence matters more than any single number. As long as BitMine buys, a buyer stands in the market every week. After that he is gone, and the staking stream can switch to the selling side on top. So if you watch a level, tie it to a date rather than to a feeling.

Glamsterdam Runs on Sepolia, Hoodi and Mainnet Have No Date
The supply side is only one half of it. The other is the next major network upgrade, named Glamsterdam, where there is one documented interim stage and one open deadline. On the Sepolia testnet the upgrade went active on October 6 at 15:53 German time, at epoch 353,024 and slot 11,296,768; seven epochs later the chain was finalised, and the fork identifier moved from 0x90000075 to 0x90000076.
For the next two stages the opposite of clarity applies. The Ethereum Foundation announcement states explicitly that the activation dates for the Hoodi testnet and for mainnet have not yet been decided. October 27 has come up in developer calls as a proposal for Hoodi, but it has not been agreed. The fourth quarter of 2026 remains the stated target for mainnet, without an epoch and without a date. As of Thursday, 84 days of it are left.
In substance Glamsterdam brings 18 improvement proposals. EIP-7732 anchors the separation of proposer and block builder directly in consensus and hands validators a new duty. EIP-7928 fixes a list of the accounts and storage slots touched by every block. EIP-8037 reprices gas against permanent growth of the state. The builder software from the Titan and Ultrasound teams has not yet followed the fork on Sepolia in full, and that is why the developers are taking their time with Hoodi.
What this means for the prediction: a date that is not fixed does not work as a price driver. Bet on the upgrade today and you are betting on a quarter, not on a day.
Holding Period and Exemption Limit: 365 Days Separate a Gain From a Tax Bill
The part you can settle regardless of the price is the tax side. In Germany the tax office treats Ether as another asset under section 23 of the Income Tax Act. Sell within a year of buying and the gain is taxable, charged at your personal rate. If more than a year lies between purchase and sale, the gain stays free of tax, whatever its size.
Two figures go with that. For gains inside the one-year window an exemption limit of 1,000 euros per calendar year has applied since 2024. An exemption limit, unlike an allowance, means that once it is exceeded the whole gain becomes taxable and not merely the part above it. Staking income falls under section 22 number 3 alongside, with an exemption limit of its own at 256 euros a year.
The burden of proof decides the case, and it rests with you. Without the purchase date, purchase price and quantity for each acquisition, the tax office cannot recognise the one-year window, and in the unfavourable case it then counts the full sale proceeds as a gain. Download your trading statements now, then, not in May; exchanges switch off accounts after migrations, and the record is gone with them. With many acquisitions, carry the allocation forward on a first-in, first-out basis and document it as you go. Which programmes build that out of exchange statements is shown in our comparison of tax software.
Buying Route Under MiCA: What to Watch When You Choose an Exchange
Since the European regulation on markets in crypto-assets came into full force, providers offering trading or custody in the EU need authorisation as a crypto-asset service provider. That authorisation can be looked up publicly: BaFin keeps a register of the companies licensed in Germany, and the European supervisor ESMA keeps one for the whole union.
Three points are worth a look before you buy Ether. First the authorisation itself, second whether the provider keeps your coins separate from its own holdings, third the total cost of trading fee and the spread between buying and selling price. The third is routinely underrated: a platform with no order fee can work out dearer through the spread than one with a stated fee. Our comparison of trading platforms for Germany adds the two together.
If you intend to hold the coins for the long run, custody is part of the decision. Ether in an exchange account legally sits with the provider; only the transfer to a wallet of your own makes you the holder of the keys. That is not a price question, it is a failure question.
Leverage and Liquidation: $102 Million Cleared Out in 24 Hours
On Tuesday and Wednesday the move took leveraged positions out of the market. In the 24 hours around the break of $2,600, Ether futures positions worth some $102 million were closed by force, predominantly bets on rising prices.
Liquidation means the exchange unwinds a leveraged position automatically as soon as the posted collateral no longer covers it. At five times leverage a counter-move of a good 20 percent is enough, at ten times around 10 percent. This week's move sat inside those ranges, and that is exactly why it caught so many positions.
In practice, leverage shortens the time your calculation has to come good. Betting over the coming weeks on the end of the BitMine programme or on an upgrade date means fighting an open deadline against a fixed collateral threshold. That is an unequal pairing.
BitMine Buying Cap: 100,000 Ether Before the Weekly Purchases End
The position fits into a single sentence: the most reliable buyer of the past fifteen months names a ceiling for the first time, the funds are withdrawing money, and the upgrade that could serve as a counterweight has no date for mainnet. Three steps you can draw from it:
- Secure the records. Download the trading statements for your acquisitions and note the date, price and quantity for each entry. What builds that automatically out of exchange statements is in the comparison of tax software.
- Recalculate the buying route. Put your provider's trading fee and spread against the licensed competition before you buy more. The numbers are in the overview of trading platforms.
- Look at staking if you are holding anyway. Leave Ether sitting for years and you should know the lock-up period, the withdrawal time and the provider risk; the staking comparison sets them side by side.
(As of October 8, 2026. This article is not investment advice. Prices and fee structures change; check the terms with the provider before you buy.)
In eleven days Bitcoin Cash gets a regulated futures market in the United States. The CME Group plans to introduce BCH futures on October 19, 2026, and the price going into it looks weaker than a week ago: $294.93, down 4.16 percent in a day and 4.14 percent over seven days, according to CoinGecko on Thursday morning. The weekly high of $319.62 sits 7.6 percent above the current level.
The contradiction is one only at first glance. A futures listing on a derivatives exchange is not a buying programme but an infrastructure decision: it makes hedging and short selling possible for desks that have had no access to BCH derivatives so far. What follows from that for the price is decided only after the launch.
Bitcoin Cash Price: $294.93 and 7.6 Percent Below the Weekly High
The week ran in two halves. Up to Sunday, October 4, BCH climbed to $319.62, the weekly high. After that it moved down in four stages: $318.72 on Monday, $316.78 on Tuesday, $311.82 on Wednesday, and on Thursday morning the price marked the weekly low at $293.57. The daily range ran from $293.57 to $308.68.
With a market capitalisation of $5.93 billion, Bitcoin Cash sits at number 22 among the largest cryptocurrencies. Daily turnover came to $194.4 million, spread across 20.1 million BCH in circulation. The price is 92.2 percent away from the all-time high of $3,785.82 set in December 2017.
This pullback is not a BCH problem. Bitcoin lost 1.84 percent on the same morning and traded at $82,703, Ethereum gave up 2.17 percent to $2,562, and the US spot Bitcoin ETFs saw net outflows of $487 million on October 7 according to SoSoValue data, $208 million of that from BlackRock's fund alone. Bitcoin Cash is falling with the market, not against it, and it is falling harder than the two large ones: a coin with just under $200 million in daily turnover reacts to the same selling wave more sharply than one with thirty times that.
What the CME Futures on Bitcoin Cash Actually Are
A future is an exchange-traded contract that fixes a price for a future date without the underlying asset itself changing hands. The CME Group runs the world's largest derivatives exchange in Chicago and has offered such contracts on Bitcoin since December 2017, on Ether since 2021, and by now on eight further cryptocurrencies. Bitcoin Cash and Uniswap would be the tenth and eleventh single-asset products in that series according to the exchange.
The CME announced the plan on September 22, 2026. We reported on the announcement when BCH stood considerably higher. Two things have stayed the same since: the launch date and the caveat of regulatory review.
Contract Size of 250 BCH and the Micro Contract of 25 BCH
The CME is listing two sizes. The standard contract covers 250 BCH, the micro contract 25 BCH. At the current price that corresponds to a value of around $73,700 and $7,370 per contract respectively. Trading is settled in dollars, through the CME CF reference rates, and takes place within the exchange's round-the-clock crypto segment.
The sizes say something about the target group. A standard contract worth $73,700 is nothing for a private portfolio, and at $7,370 the micro contract also stays well above what a German retail investor moves per order on a crypto exchange. These products are aimed at asset managers, market makers and mining companies looking to hedge holdings. Direct access for German retail investors does not arrive on October 19.
Cash Settlement Through the CME CF Reference Rate: What It Means for the Spot Market
Cash settlement means no BCH is delivered on expiry day. Instead the difference between the contract price and the reference rate is settled in dollars. The reference rate is formed from the trading data of several spot exchanges within a defined time window.
For the spot market that has one consequence reaching beyond the launch days: the more volume hangs on the reference, the more important the order book of the included exchanges becomes in exactly that window. With Bitcoin a pattern of its own has developed out of that over the years, with heightened activity around expiry dates. Whether that forms at all for a coin with $194 million in daily turnover depends on how many contracts actually stay open. The figures on that will come at the end of October at the earliest.

The Price Jump of September 22 Has Been Given Back in Full
On the day of the announcement BCH reacted sharply. The price jumped above $340 and briefly touched $358 according to market reports, with market capitalisation at just under $6 billion. From that level Bitcoin Cash has given up around 18 percent to date and trades below where it stood before the news.
A course like that is the rule with listing news, not the exception. The news works for a day, then the general market situation takes over. Two days after the announcement BCH already gave up 5.5 percent, following a week that had delivered 50 percent; back then the question was the same one as today. Anyone who took the September 22 reaction for the start of a re-rating now sees it for what it was: a one-day move.
Futures Market and Spot Market: the Record From Earlier CME Listings
What a CME listing brings over the medium term can be read off its predecessors, but it cannot be condensed into a single number. The regulated futures market opens a door for desks that may not trade on unregulated derivatives venues for compliance reasons. At the same time it allows systematic short selling through a regulated venue for the first time, which enables downward moves just as much as upward ones.
With Bitcoin the futures launch in December 2017 coincided with the all-time high of the day, and a bear market followed. With Ether in 2021 the pattern was less clear-cut. No rule can be built from two cases, and deriving a direction from the launch date overstates what a product listing can do. Only the mechanical part is demonstrable: more ways into the market and more ways out.
Regulatory Review Still Open: the Date Carries a Caveat
Every report on the announcement carries the same rider: the launch takes place subject to regulatory review. No final clearance and no confirmation of the first trading day had been published as of October 8. For the date that means it can shift without much notice beforehand.
In practical terms that barely concerns German investors, because they will not be taking part in these contracts anyway. For reading the price action in the week before October 19 it does matter, though: a postponement would be news that lands in the futures market and therefore in the spot price too.
Levels Above and Below: $319.62 and the Zone Under $293
Three reference points emerge from the week's price data, and none of them is a price target. Above sits the weekly high of $319.62; beyond it begins the area in which the price traded before the pullback. The round $300 level, lost from above on Thursday morning, lies just over the current reading and was the underside of the trading range in the preceding seven days.
Below, the weekly low of $293.57 marks the edge. Underneath it this week offers no reference at all, and the next marker would be the level before the CME announcement, the area around $270. These points describe where trading happened most recently, and they say nothing about where the price runs.
What the Levels Mean for Open Interest
Open interest is the sum of all open derivatives positions on a coin. Rising open interest with a falling price means the market is building short positions. Falling open interest alongside the price means positions are being closed, often through liquidations. With BCH that figure has been small relative to the spot market so far, and that is exactly what could change with the CME contract. From the launch date onwards it is worth looking at both numbers together, because a price decline with rising open interest tells a different story than one with falling open interest.

Buying Bitcoin Cash in Germany: Purchase Route, MiCA and Custody
BCH is among the coins tradable on practically every regulated platform in the EU. Since the MiCA transition period expired across the EU on July 1, 2026, only authorised providers may serve EU customers on a regular basis. Whether an exchange holds that authorisation is shown in the public ESMA register, and a pending application is not enough for it. Which providers hold the authorisation and what fees they charge is set out in the crypto exchange comparison.
On custody, the same applies to Bitcoin Cash as to Bitcoin: leave the coins on the exchange and you hold a claim against the company rather than the coins themselves. If you want to hold larger amounts for months, move them to your own wallet; the differences between the devices are set out in the hardware wallet comparison. BCH uses the same address logic as Bitcoin but has an address format of its own, and a transfer to a Bitcoin address is usually lost. Check the format before you move a larger sum.
Leverage and Liquidation: the Futures Market Is a Detour for Retail Investors
The CME contracts are practically out of reach for German retail investors, and the obvious alternative is leveraged products on crypto exchanges or decentralised perpetual platforms. A different arithmetic applies there: at ten times leverage a counter-move of ten percent is enough to wipe out the position. Bitcoin Cash has covered 7.6 percent between its high and the current reading in this week alone, a move that decides liquidation at high leverage. How far the platforms differ on fees, funding rate and liquidation rules is shown in the perp DEX comparison.
The funding rate is the item newcomers overlook. It is a balancing payment between the long and short sides, due several times a day, and it runs against you as soon as you stand on the crowded side. On a position left open for weeks it adds up to an amount that can exceed the price move.
Holding Period and Tax: What Applies to BCH After One Year
In Germany Bitcoin Cash is a private asset. Sell at a profit within a year of buying and that profit is taxable as a private disposal, at your personal income tax rate. After a year has passed the sale is tax-free, regardless of the size of the gain.
Two points regularly go wrong here. First, the clock runs per purchase, not per coin holding: buy in over several months and you have several clocks running in parallel and need the individual dates. Second, since the 2026 reporting year the reporting duty from the German Crypto Asset Tax Transparency Act applies, under which authorised providers transmit data to the Federal Central Tax Office. What gets reported are gross amounts and not gains; the gap between what the tax office sees and what you have to pay tax on is closed only by your own documentation. Which tools prepare the transaction history is set out in the tax software comparison.
Bitcoin Cash: Without Fresh Demand, October 19 Stays a Date
The futures market opens a door; it pushes nobody through it. Bitcoin Cash stands at $294.93, below the level before the announcement, the market is selling broadly, and whether institutional desks use the new contract at all will show only in the open interest in the weeks after the launch. Three steps are worth taking until then.
- Settle your purchase route and its authorisation. Check in the ESMA register whether your platform holds a MiCA authorisation, and compare the order fees for BCH in the crypto exchange comparison. On a coin with $194 million in daily turnover the spread bites harder than it does on Bitcoin.
- Decide on custody before the date arrives. Holdings you want to keep beyond October 19 do not belong on the exchange. The differences between devices and the setup are in the hardware wallet comparison; mind the BCH address format when transferring.
- Document your holding periods. Pull your exchange's transaction history now rather than next spring, and assign its date to every purchase. The tools for that are in the tax software comparison, and they are only as good as the data you give them.
The primary source on the announcement is the CME Group statement of September 22, 2026; the contract details and the product count can also be found in Decrypt's coverage.
(As of October 8, 2026. This article is not investment advice. Prices and fee structures change; check the terms with the provider before you buy.)
Hold USDT and you do not hold a bank balance but a claim against a private company. That company can put individual addresses on a blacklist, and it does so regularly. The power to do it sits in Tether's own terms of service, and it reaches further than most holders assume: Tether may freeze a balance when a law requires it, and in addition whenever the company considers it prudent at its own discretion.
Since October 5, 2026, a suit before a US federal court has been attacking exactly that clause. The payments company Conduit Technology filed in Manhattan because 2.76 million USDT from its corporate treasury have been frozen since September 24, 2025. Press coverage of recent days reports the events. The follow-up question a holder has goes unanswered: what does a freeze like that rest on, and what follows from it for your own balance?
This article reads the governing passage in the original, sets out what is disputed about it, and derives from that the points you can check against your own position. It does not prejudge a ruling, because the dispute is open.
What Tether's Terms of Service Literally Allow When Freezing USDT
What governs are the Token Terms of Sale and Service, Tether's own rulebook for the purchase, redemption and custody of its tokens. In the version dated February 26, 2026, it says there that Tether may suspend or terminate access to its services and "freeze any Tether Tokens held by you". The sentence then names three triggers: where applicable law requires it, where you have breached the terms or applicable law, and where Tether "in its sole discretion, determines it is prudent to do so".
The third trigger stands on equal footing with the other two. It requires no court order, no order from an authority and no breach by the holder. On the wording, a suspicion the company itself holds to be well founded is enough.
A second passage in the same terms goes further still. Among the possible measures where unlawful use is suspected, it names a report to the authorities without any notice to the person affected, the freezing or seizure of balances, the "blacklisting any Digital Tokens Address which holds Tether Tokens" and expressly that Tether may "at its sole and absolute discretion, seize and deliver your property" to the authorities. The word property there refers to what belongs to you, not to what belongs to the issuer.
Blacklist, in brief: A blacklist is a register of blockchain addresses whose balances the issuer of a token renders unusable. The address stays visible, the amount stays put, but every transfer out of that address fails.
"In its sole discretion": Why Those Three Words Are the Heart of the Dispute
In contract drafting, sole discretion is a standard formula and means that one party decides alone and need not give reasons. It is customary where side issues are concerned, the design of a website for instance. It becomes unusual once it governs access to assets that belong to someone else.
That is where the criticism begins. At a bank, freezing an account needs a legal basis, and the customer can have it reviewed. With a stablecoin, a set of standard terms replaces that chain. Whether such a text is effective at that breadth is a question of law on which no court has ruled so far.
A counter-example helps place it. When stolen XRP worth $83 million surfaced at Ripple in September 2026, the company could not freeze them, because the XRP Ledger provides no such function for the token itself. We set out the limits of this technique in our analysis of frozen and unfreezable coins. The freeze function in USDT is therefore not something a blockchain simply comes with. Somebody built it in deliberately.
Blacklisting: How a Freeze Written Into the USDT Contract Works on the Blockchain
USDT runs as a program on other networks, chiefly on Ethereum and Tron, and brings no network of its own. That program, the smart contract in technical parlance, keeps the list of all balances and decides on every transfer whether it goes through. The blacklist sits inside that same list.
Smart contract, in brief: A smart contract is a program that runs on a blockchain and whose rules anyone can read. Whoever wrote it determines what special powers the issuer retains.
Once Tether puts an address on that list, the program checks on every further attempt to send from it whether the address is blocked, and aborts. The balance does not disappear in the process. It stays visible in the blockchain explorer and can be counted to the cent. Movable it is not, all the same. How to look that up for your own address is set out step by step in our guide to checking a USDT address against the blacklist.
Technically the same logic applies to every token with an issuer. To know how much control sits inside a stablecoin, read the functions of the program and leave the marketing copy aside. Our overview of key control at USDT shows who holds which power in the background.

Conduit Technology's Lawsuit Over 2.76 Million USDT
Conduit Technology settles cross-border payments. On the company's account, it held USDT from May 2025 in a corporate wallet that it describes as the counterpart to a business bank account. On September 24, 2025, Tether is said to have frozen the entire holding of 2.76 million USDT. The complaint, filed on October 5, 2026, with the federal district court for the Southern District of New York, states that Tether has "no legal entitlement" and "no claim" to those funds.
The background, according to the complaint, is an investigation by the Brazilian federal police from 2024 directed against two financial intermediaries. Conduit submits that one of them was a former customer, had not used the platform since April 2025, and that the frozen wallet never held that customer's funds. Tether is said to have made the attribution "on its own initiative using its own criteria". The details have been summarised by Cointelegraph from the complaint.
Procedural status, expressly: All of these particulars come from the claimant's own submissions. No court has examined them. Tether has not commented publicly on this suit so far, on the account of the outlets reporting it. How the proceedings end is open.
What is notable about the case is less the sum than the point of attack. Conduit does not dispute that Tether can block an address technically. What is disputed is that the terms of service cover it in this situation.
The Second Case: 42.4 Million USDT and Tether's Own Answer to It
The Conduit suit is not the only attack on the discretion clause. Roughly a month earlier, two Thai businessmen had sued Tether over 42.4 million USDT said to have been frozen. Those funds are connected to fraud proceedings over a total of $61 million being conducted in the United States. Here too, nothing has been decided.
On those proceedings Tether has spoken, calling the suit "a baseless attempt to interfere with Tether's important work with global law enforcement". That is the company's position, and it describes at the same time where it stands on the substance: Tether understands the freeze function as a tool against crime.
That the tool is used on a large scale is documented. In September 2026 we reported on $550 million in frozen Iran-linked USDT and the attendant pressure from the US Senate. Both readings of the clause thus meet the same practice: for law enforcement it is effective, for someone wrongly caught by it there is little to attack.
Self-Custody Secures the Key, Not the Validity of the Token
A widespread misconception holds that your own wallet protects you against a freeze. It does not, and the reason lies in the division of labour between key and token.
Your private key proves that you are entitled to dispose of an address. Nobody can take that proof from you as long as you keep the key safe. Whether a transfer from that address goes through, however, is decided by the issuer's program. With Bitcoin the two roles coincide, because there is no issuer. With a stablecoin they stay separate.
In practice, that means a hardware wallet protects you against theft, against an exchange outage and against the insolvency of your trading venue. Against a decision by the issuer it does not protect you. Hold USDT as a long-term store of value and moving it into your own wallet does not shift that risk. For that, the asset itself would have to change.

MiCA and USDT: What the Missing Authorisation Means for Holders in Germany
In the European Union the Markets in Crypto-Assets Regulation, MiCA for short, governs who may issue and trade stablecoins. Tether has not applied for authorisation of USDT as an e-money token, and large venues have therefore stopped or restricted USDT trading for customers in the EU. The obligations behind that are set out in our overview of the MiCA duties for crypto companies.
E-money token, in brief: An e-money token is a stablecoin tied to a single official currency whose issuer needs a permission from a supervisory authority for it. With the permission come requirements on reserves, redemption and complaint procedures.
For holders in Germany that has one consequence which runs counter to expectation. The less USDT is traded at supervised European venues, the more often it sits in a self-custodied wallet or with a provider outside the EU. Both routes bypass the European complaints channel and end up at the terms of service from section one. Our report on the Revolut forced conversion by August 31, 2026 shows how that retreat plays out in practice.
Stablecoin Alternatives: USDC and EURC Compared as E-Money Tokens
Anyone looking to limit the discretion risk has two levers. The first is the issuer, the second the holding period.
On the issuer: USDC and EURC are authorised in the EU as e-money tokens. Authorisation does not rule out a freeze, because those tokens also carry a freeze function in their program. What it changes is the rules around it, because the issuer is subject to supervision, has to meet redemption obligations and has to offer a complaints procedure. Which stablecoin is built which way is set out in the stablecoin comparison.
The second lever is about habit. A stablecoin is built as a way station, for the leg between two trades or between two networks. The longer a six-figure amount sits there, the larger a risk grows that has nothing to do with price movement. For short legs USDT stays practical because of its liquidity. As a store over months it is the costlier choice, even when the price looks quiet.
What a Holder Can Draw From the Clause: Four Things to Check on Your USDT
From the wording and from the two sets of proceedings, four verifiable points can be drawn. None of them calls for legal knowledge.
First, the address. Look up in the blockchain explorer whether your receiving address is on the blacklist. It takes two minutes and costs nothing.
Second, provenance. In the known cases a freeze hits addresses that show a connection to an investigation, including an indirect one through a former business partner. Accept payments from unknown third parties and you raise that risk without hearing about it.
Third, spread. A single pot is the most vulnerable form of storage. Conduit describes exactly that position in its complaint: one wallet serving as the business account, and with the freeze the business stood still.
Fourth, the records folder. Keep purchase records, transfer confirmations and correspondence to hand so that you can set out the provenance of an amount without a long search. In both pending cases the dispute turns on exactly that chain of evidence.
USDT Freezes: Without Your Own Keys, Tether's Clause Decides Alone
The clause has been in the terms for years; what is new is only that it is being tested in court. Until then it remains the yardstick you set your own conduct by.
- Work out which stablecoin you use for what. For the leg between two trades, liquidity counts; for sitting longer, the issuer's legal framework counts. The differences are in the stablecoin comparison.
- Separate custody from trading. What you do not actively trade belongs in your own custody. Which devices do the job is shown in the hardware wallet comparison.
- Pick your venue by its authorisation. A supervised provider gives you a complaints channel that a contract under foreign law does not. Which houses hold a European permission is set out in the overview of regulated crypto exchanges.
(As of October 8, 2026. This article is not investment advice. Prices and fee structures change; check the terms with the provider before you buy.)
Samsung is building stablecoin transfers into the pre-installed wallet on its Galaxy phones and settling them over the Solana network. The launch is set for the last week of October, it covers 82 million devices, and every one of them sits in the United States. SOL traded at $115.23 on Thursday morning, 3.0 percent below the previous day. If you use a Galaxy device in Germany, you will not get the feature for now. Exactly there the news parts company with its headline.
Samsung Wallet and USDC on Solana: What Was Announced on October 8
The Solana Foundation and Samsung Electronics said on October 8 that Samsung Wallet and Samsung Pay will support stablecoin payments. What gets settled are cross-border money transfers, the stablecoin used is USDC, and settlement runs over Solana in the background. Users are supposed to need neither an exchange account nor a separate wallet app, because the on-ramps and off-ramps into the local currency are built in. The statement sits in the Solana Foundation newsroom.
A stablecoin is a token whose value is pegged to a currency and which is meant to be covered by reserves held against it. USDC is issued by the company Circle and tied to the US dollar. For the user, that means sending a dollar value rather than a fluctuating coin, with the blockchain serving only as the transport layer.
Woncheol Chai, Executive Vice President and head of the digital wallet team in Samsung's mobile division, is quoted in the statement saying stablecoins have the potential to make money move around the world faster and more easily. Lily Liu, president of the Solana Foundation, adds there that what stablecoins have lacked so far is a route into the mass market. Both are statements from the companies involved, not independent assessments.
82 Million Galaxy Devices, All in the US: How Narrow the Launch in the Last Week of October Really Is
The reach sounds large, the cut is narrow. The Foundation names the United States as the only launch market and the last week of October 2026 as the window. Further markets are to follow, explicitly depending on the regulatory requirements in each place. A date for Europe or for Germany does not appear in the statement.
Two figures circulating in press coverage do not appear in the official statement in that form and therefore deserve a caveat. First, a reach of 60 countries for the transfers: the Foundation does not make that claim. Second, custody. Several trade outlets report that Coinbase holds the USDC kept in Samsung Wallet through its institutional arm Coinbase Prime, and point to earlier cooperation between Samsung and Coinbase. The statement itself names no custodian. Anyone weighing the news should file both points as reporting, not as confirmed fact.
The commercially most important point also stays open. Samsung has published no fees. Whether the feature genuinely makes conventional international transfers cheaper cannot be judged without that number, because savings on money transfers come mainly from the exchange-rate spread and from payout fees in the destination country, not from the blockchain's network fees.

Solana Price at $115.23: the News Lands on a Market in Liquidation Mode
The announcement fell into a weak phase for the market. SOL cost $115.23, or 102.91 euros, on Thursday morning, down 3.0 percent within 24 hours and 3.5 percent over the week. The daily range ran from $114.42 to $118.96 and turnover came to $2.93 billion. Bitcoin stood at $82,775 at the same time, Ether at $2,565.53. All values come from CoinGecko as of Thursday morning.
The trigger for the weakness did not come from the crypto sector. According to CoinDesk, forced liquidations jumped 216 percent on October 7 to around $548 million while Bitcoin slipped below $84,000. The causes cited are an escalation in the Strait of Hormuz and an oil price above $101 a barrel of Brent. A liquidation is the forced closing of a leveraged position once the collateral posted no longer covers it. Waves like that move prices regardless of news about individual projects.
That is what the reaction to the Samsung news shows: there was practically none. SOL moved in lockstep with Bitcoin and Ether. Judge a piece of news by the price move on a day like that and you are measuring the oil quote along with it. How far spreads drift apart between individual venues shows in a look at the crypto exchange comparison, because spread and fees differ markedly in liquidation phases in particular.
$5.25 Trillion in Stablecoin Volume: What Samsung Changes About Solana's Payment Rail
The Foundation gives two figures for context in the same statement. The stablecoin volume issued on Solana is up by just under 20 percent year on year, and more than $5.25 trillion in stablecoin transfers moved across the network in 2026 alone. Against that backdrop, the Samsung tie-in is not a leap into a new line of business but an additional route into a rail that is already running.
The structural difference lies in the kind of user. So far the stablecoin volume on Solana has come mostly from trading between crypto addresses. A pre-installed wallet on a mass-market phone reaches people who do not want to open an exchange account or manage a seed phrase. A seed phrase is the sequence of words that restores access to a self-custodied wallet. Remove that hurdle and usage shifts from trading towards payment.
For Solana as a network that counts, because payment traffic brings steadier load than trading spikes. For the price the link is weaker than the headline suggests. If you want to use stablecoin payments in everyday life, the overview of crypto credit cards lists the routes available today in Germany that work without a wallet integration of this kind.
SOL Is Not USDC: Payment Volume and Demand for the Token Are Two Different Things
This is where the most common false conclusion about news of this type sits. Sending USDC through Samsung Wallet buys no SOL. It moves a dollar token across a blockchain whose fees are charged in SOL. Those fees are very low, on the order of fractions of a cent per transaction. Even a great many transfers therefore create only small direct demand for the token.
The link is more indirect and runs through three stages: more payment traffic means more stablecoin balances held on Solana, more balances mean more applications built on top of them, and only out of that does demand for blockspace arise. Any of those stages can fail to materialise. No price target can be derived from the news, and serious analysts do not derive one at this point either.
What does hold up is the network side, and it can be measured directly. A query to the public Solana node returned an inflation rate of 3.61 percent for the current epoch, 1052. Of a total supply of 635,460,122 SOL, 439,005,453 SOL are tied up as active stake, which is 69.1 percent. That works out to a nominal staking yield of around 5.2 percent before costs and before tax. Those numbers describe the starting position into which an additional payment application grows.

MiCA and E-Money Tokens: Which USDC Variant Is Authorised in Germany
The launch being limited to the US has a regulatory core. The European Union has applied the Markets in Crypto-Assets Regulation, MiCA for short, since 2024. A stablecoin pegged to a single currency counts there as an e-money token and may only be issued by an authorised institution. Circle obtained that authorisation in July 2024 through the French supervisor ACPR according to consistent industry accounts, which puts USDC among the few stablecoins with full MiCA authorisation.
Two limitations matter here and are regularly overlooked. First, the authorisation covers native USDC, not bridged variants running on other chains under labels such as USDC.e. A bridged variant is a representation of the original held by a bridge, and legally it is not the same instrument. Second, the larger competitor USDT has not applied for the authorisation required, which is why several venues have delisted it in the European Economic Area.
Which entity exactly is registered as the issuer is reported inconsistently by the available sources, in part as Circle SAS, in part as Circle Mint Europe SAS. If you depend on that detail, look up the entry in the register of the European securities regulator ESMA rather than relying on secondary sources.
Holding Period, Tax-Free Threshold and the Anlage SO Form: What Investors in Germany Have to Watch With Stablecoin Payments
Should the feature reach Germany later, one point many users underestimate comes into play. For tax purposes a stablecoin counts as a crypto asset rather than a currency. Every payment made with a stablecoin therefore counts as a disposal within the meaning of Section 23 of the German Income Tax Act, just like swapping Bitcoin for Ether. That applies even when the value of the token has not changed.
In practice, that means three things. The holding period is one year: hold a crypto asset for longer than twelve months and the sale is tax-free. The threshold stands at 1,000 euros and applies to the total gain from all private disposals in a calendar year; once it is reached, the entire gain is taxable and not just the part above it. Taxable gains belong in the Anlage SO form of the income tax return, the schedule for other income.
With a dollar stablecoin a gain arises almost exclusively through the dollar-euro exchange rate. That amount is small per payment, but it adds up with frequent use, and it has to be documented. Since January 1, 2026, the German Crypto Asset Tax Transparency Act has transposed the European reporting obligation DAC8 into German law, so providers report transaction data to the tax authorities. How income from the network itself is treated is set out at length in our article on staking taxes. A planned reform could scrap the holding period for holdings acquired from 2027; so far only a draft stage exists on that, and nobody should plan around it today.
Levels Above and Below: $114.42, $118.96 and the 69.1 Percent in Stake
For the coming days three values are verifiable instead of guessed. On the downside the daily low of $114.42 marks the zone where buyers stepped in on Thursday. On the upside the daily high of $118.96 caps the range, and above it sits the $120 level at which SOL already turned several times in early October. These values describe where trading took place and are not a forecast.
The third value is the more important one, because it moves more slowly. With 69.1 percent of total supply in active stake, a large share of holdings is not immediately sellable. Unstake and you wait until the end of the current epoch, which runs about two days. That buffer dampens selling pressure in fast downward moves and, conversely, also delays reactions to good news.
Against those three values the Samsung news can be checked over the coming weeks. If the price does not leave the range after the actual launch in late October, then for the price the news was what it already was on the day of the announcement: an infrastructure story without immediate price effect.
Samsung Launch in Late October: in Germany the Feature Stays Switched Off
The announcement matters for the network and leaves a German portfolio untouched for now. Three steps are worthwhile all the same.
- Note the date and check what actually launches. The last week of October is the Foundation's timing, the launch market is the United States. Whether and when Europe follows hangs on local authorisation. If you want to use stablecoins in everyday life before then, the routes available today are in the crypto credit card comparison.
- Check your own venue on fees and spread. In liquidation phases such as October 7 the spreads drift apart, and precisely then the venue decides your entry price. The terms are in the crypto exchange comparison.
- Keep the records for every stablecoin payment. Every payment is a taxable event, and the 1,000-euro threshold applies to all private disposals together. Which tools log that automatically shows in the crypto tax software comparison.
(As of October 8, 2026. This article is not investment advice. Prices and fee structures change; check the terms with the provider before you buy.)
Decrypt
Minecraft in Elden Ring, Skate in Call of Duty, and Spider-Man in Gotham. AI vibe coders are creating crazy video game mashup mods.
Justin Drake is calling for crypto holders to start calmly planning for “Bunker Mode." But reactions so far haven’t been too calm.
Jonathan Spalletta also spent stolen crypto on a Roman coin marking Julius Caesar's assassination and moon-flown Wright brothers fabric.
Sony plans to cease physical disc production in 2028. A former PlayStation exec claims it has caused reputational damage.
A draft bill would exempt the first €500 of annual gains, as crypto tax rates across Europe run from Cyprus's 8% to Italy's 33%.
U.Today - IT, AI and Fintech Daily News for You Today
The milestone comes as Cardano continues to work toward broader scaling improvements, with future upgrades expected to increase capacity.
Crypto news this morning, Oct 8: Bitcoin slips to $82,000 on US jobs data while Ripple shifts 200M XRP ahead of a major XRPL privacy upgrade.
XRP Ledger payment volume has climbed to a record 858 million in a single day. The key question is whether that activity can hold above one billion.
Tom Lee confirms plans to stop buying Ethereum once their stash finally carries 5% of Ethereum's total supply, describing it as BitMine's hard cap.
Shiba Inu faces double death cross as 'Uptober' narrative comes under pressure.
Blockonomi
TLDR:
- Retail investors raised stock allocations to 71.8% in September, the highest level since December 2017.
- Cash holdings fell to 13.3%, marking a nine-year low and remaining below the 22.5% historical average.
- Stock fund allocations climbed to 38.35%, while direct stock holdings remained nearly unchanged at 33.44%.
- AAII data showed 53.3% bearish sentiment on September 19, despite equity allocations reaching a nine-year high.
Retail investors are holding their largest share of U.S. stocks in nearly nine years, while cash reserves have fallen to their lowest level since December 2017. According to the American Association of Individual Investors (AAII), equity allocations rose 0.7 percentage points to 71.8% in September 2026.
The reading was the second-highest since July 2000, based on historical data highlighted by The Kobeissi Letter. Meanwhile, cash allocations dropped to 13.3%, reflecting a widening gap between money invested in stocks and funds held in reserve. The figures show how strongly surveyed investors favored equities entering the fourth quarter, despite prevailing market uncertainty.
Retail Investors Push Stock Holdings to 71.8%, a 9-Year High
The October 1 AAII report showed that stock allocations exceeded their historical average of 61.5% for the 76th consecutive month. Equity exposure has also increased approximately 3.3 percentage points since April.
According to The Kobeissi Letter, that represented the largest five-month increase since October 2025. However, the latest increase came primarily through stock funds rather than individual company shares. Stock fund allocations climbed 0.73 percentage points to 38.35% in September.
By comparison, direct stock holdings remained nearly unchanged at 33.44%. The breakdown shows that investment funds accounted for most of September’s increased equity allocation. Nevertheless, the survey cannot determine whether portfolio changes reflected fresh purchases, rising market valuations, or both.
Meanwhile, fixed-income holdings showed a smaller increase. Bond and bond fund allocations rose approximately 0.3 percentage points to 14.9%, remaining below their historical average of 16%.
Cash Falls to 13.3% as Bearish Sentiment Reaches 53.3%
Cash allocations declined approximately one percentage point to 13.3%, marking their lowest reading since December 2017. Additionally, September marked the 46th consecutive month that cash holdings remained below their historical average of 22.5%.
The latest allocation stood 9.2 percentage points below that benchmark. The positioning contrasted with investors’ stated market expectations. AAII’s separate September 19 sentiment survey showed bearish expectations reaching 53.3%, while bullish sentiment fell to 28.8%.
Consequently, the two surveys presented different pictures of investor behavior. Portfolio allocations showed substantial equity exposure, even as more respondents expected stock prices to decline. The divergence also emerged during a period of higher borrowing costs. In September, the Federal Reserve raised interest rates for the first time since 2023.
Still, historically elevated stock exposure does not establish that a market correction will follow. AAII’s findings represent surveyed members rather than every U.S. retail investor, limiting broader conclusions about market positioning.
The post Retail Investors Go All-In on Stocks as Cash Holdings Hit 9-Year Low appeared first on Blockonomi.
TLDR:
- A $12.5M loss hit 79thVault after an admin address was used without authorization on BNB Chain.
- One address held OPERATOR_ROLE with no multisig or timelock and made seven privileged calls in an hour.
- Proceeds became 16,249 BNB, and 14,394.92 BNB, about $11.03M, sits unmoved at a single address.
- The project called it a system upgrade and has not detailed the key compromise or the loss breakdown.
The 79thVault incident raises a central question: was it a hack or an insider action? The BNB Chain project lost about $12.5 million after a privileged admin address was used without authorization.
Close to 10,000 holders are affected. Security firm GoPlus Security reviewed the case on-chain. Its analysis leaves two explanations open, a leaked operator key or insider activity. The project has not confirmed either, and its public statement mentioned only a system upgrade.
What the On-Chain Data Shows About the Operator Role
GoPlus Security outlined the case in a post on X. It was titled “Hack or insider? Security analysis of the $12.5M loss at 79thVault.”
The firm said the 79AU contract has a function restricted to OPERATOR_ROLE. The source is unverified on BscScan. GoPlus stated that “centralized-control risk was high.”
Hack or insider? Security analysis of the $12.5M loss at 79thVault
BNB Chain project @79thVault lost about $12.5M after a privileged admin address was used without authorization. Close to 10,000 holders are affected. A leaked operator key and insider activity are both still… pic.twitter.com/eXIb3YwClW
— GoPlus Security
(@GoPlusSecurity) October 8, 2026
On-chain calls show the function can move 79AU from a chosen address to any recipient. Here, it pulled tokens from the 79AU/USDT pair. It then called sync() to update the pair’s recorded reserves. The firm wrote that the “effect is backdoor-like.”
The role was held by address 0x019bD8ED017D11AF0eB24d28DCdd0f9930c85cA3. On the missing safeguards, GoPlus wrote, “No multisig. No timelock.”
Between 07:25 and 08:19 UTC, that address executed seven privileged calls. The firm listed a leaked operator key and an insider as the two possible sources.
Those calls moved 2.01 million 79AU to 0xc3E90f78A918594a605d584887b2775F4b80A099. Transfers ranged from 10,000 to 500,000 tokens each. They coincided with a sharp rise in the 79AU price. The role was revoked after the incident.
Why the Hack or Insider Question Remains Open
GoPlus traced the full path from the pair to the final wallets. The receiving address sold the 79AU into the pool and drained the USDT.
It then converted the proceeds into 16,249 BNB. Those funds were consolidated at 0x629B368c6BF1a9f190e38f21235033FEcE8A6231.
Several smaller transfers of 10 to 15 BNB each followed, and their purpose is unclear. Most funds now sit at 0xa9537B40b02Af7Af8f1543aea3691992B2174F89.
That address holds 14,394.92 BNB, worth about $11.03 million. GoPlus reported that no further movement has occurred yet.
The on-chain bounty negotiation message adds another question. It was sent from the same privileged address used in the incident.
According to GoPlus, using that address to talk to an attacker “would be unusual.” The firm added that the message’s authenticity “is still in question.”
Meanwhile, the project’s X post called the event a system upgrade. GoPlus described the wording as a “vague” one.
The project has not shared details on the suspected key compromise, the role-revocation transaction, or the loss breakdown. GoPlus said this limited disclosure “leaves open whether users have been given enough information.”
The post Is 79thVault Hack or Insider Job? GoPlus Examines $12.5M BNB Chain Loss appeared first on Blockonomi.
FUNToken has expanded its growing list of supported tokens with the addition of FARTCOIN and JTO, giving users two more ways to access $FUN through its automatic conversion system.
With the latest additions, users can deposit FARTCOIN or JTO and have their tokens automatically converted into $FUN with 0% conversion fees. The process removes the need to manually swap tokens before accessing the FUNToken ecosystem.
The additions continue FUNToken’s focus on expanding token support and providing users with more flexible and convenient ways to access $FUN.
Two More Tokens, Another Route to $FUN
For users already holding FARTCOIN or JTO, accessing $FUN now requires fewer steps.
Instead of manually converting their holdings beforehand, users can deposit either supported token directly through the available deposit flow. The tokens are then automatically converted into $FUN with 0% conversion fees.
This approach is designed to simplify the journey from the tokens users already hold to $FUN, while reducing unnecessary conversion steps.
A Growing List of Supported Tokens
FARTCOIN and JTO join an expanding selection of tokens that can be deposited and automatically converted into $FUN.
FUNToken has continued to broaden its supported-token infrastructure as part of its wider focus on accessibility. By supporting a greater variety of assets, users have more flexibility to access $FUN using tokens they may already hold.
Each new addition strengthens this model by creating another route into the FUNToken ecosystem without requiring users to complete a separate manual swap first.
More Ways to Access, More Ways to Use $FUN
Expanding access to $FUN goes hand in hand with the continued development of its utility.
Once converted, $FUN can be used across the growing FUNToken ecosystem, which brings together gaming, staking, rewards and other token-based experiences.
FUNToken has continued to expand its gaming ecosystem across mobile and browser-based experiences while developing additional ways for users to earn and use $FUN.
As both accessibility and utility expand, the aim is to create a more connected experience where users have multiple ways to get $FUN and multiple ways to put it to use.
Continuing to Expand the $FUN Ecosystem
The addition of FARTCOIN and JTO marks another step in FUNToken’s ongoing expansion of its supported-token offering.
The process remains straightforward: users can deposit a supported token, have it automatically converted into $FUN with 0% conversion fees, and then use their $FUN across the wider ecosystem.
With the list of supported tokens continuing to grow, FUNToken is creating more routes for users to access $FUN while continuing to expand the utility available around the token.
About FUNToken
FUNToken is a blockchain-powered ecosystem built around $FUN, combining gaming, rewards, staking and growing token utility within a connected experience.
With an expanding range of products, supported tokens, multi-chain accessibility and reward opportunities, FUNToken is focused on creating more ways for users to access, earn, hold and use $FUN across its ecosystem.
As the ecosystem continues to evolve, FUNToken remains focused on expanding real utility, improving accessibility and building experiences that put $FUN at the centre of user participation.
The post FUNToken Adds FARTCOIN and JTO With 0% Conversion Fees appeared first on Blockonomi.
TLDR
- Daniel Rhyne, 59, of Kansas City, Missouri, was sentenced to 32 months in federal prison.
- He worked as a core infrastructure engineer at an industrial company based in New Jersey.
- In November 2023, he set up tasks to delete admin accounts, change passwords and shut down servers.
- He demanded about 20 bitcoin, then worth roughly $750,000, to stop the attack.
- Judge Michael A. Shipp imposed the sentence on September 28, 2026, in Trenton federal court.
A former employee of a New Jersey industrial company has been sentenced to prison for attacking his employer’s computer network. He also demanded a bitcoin ransom from the company’s staff.
Daniel Rhyne, 59, of Kansas City, Missouri, received a sentence of 32 months in federal prison. U.S. Attorney Robert Frazer of the District of New Jersey announced the sentence on October 5, 2026.
Rhyne had previously pleaded guilty to a two-count Information. The charges were extortion in relation to a threat to cause damage to a protected computer and intentional damage to a protected computer.
How the Bitcoin Extortion Scheme Worked
Rhyne worked as a core infrastructure engineer at a U.S.-based industrial company headquartered in New Jersey. Court documents refer to the company as Victim-1, and its name was not made public. At the time, Rhyne lived in New Jersey.
In November 2023, Rhyne began carrying out a plan to attack the company’s computer network. According to court filings, he started remote desktop sessions that he was not authorized to use.
He then scheduled tasks designed to damage the network. These tasks included deleting network administrator accounts and changing the passwords on other company accounts.
The scheduled tasks were also set to shut down several of the company’s servers. These steps were part of his preparation for the attack.
On November 25, 2023, Rhyne sent an email to employees of the company. In the email, he threatened to keep shutting down company servers until he was paid.
He demanded about 20 bitcoin. At the time, that amount was worth roughly $750,000, or about $37,500 per bitcoin. The release did not say whether any ransom was paid.
Guilty Plea and Sentencing in Federal Court
Rhyne entered his guilty plea before U.S. District Judge Michael A. Shipp. The same judge handled the sentencing.
Judge Shipp imposed the 32-month prison sentence on September 28, 2026. The hearing took place in federal court in Trenton, New Jersey.
The case was brought by the U.S. Attorney’s Office for the District of New Jersey. Rhyne is now a resident of Kansas City, Missouri.
The investigation was led by special agents of the FBI’s Newark Field Office. That office is under the direction of Stefanie Roddy.
Frazer also thanked the FBI’s Kansas City Field Office for its help with the case. That office is led by Special Agent in Charge Chris Ormerod.
The sentence was announced on October 5, 2026, one week after the hearing in Trenton. Rhyne will serve 32 months in prison for the network attack and the bitcoin ransom demand.
The post Former Insider Gets 32 Months in Prison Over 20 Bitcoin Ransom Demand appeared first on Blockonomi.
TLDR
- Tokenized US Treasury products on Avalanche have reached about $545 million in value.
- The figure comes from an October 7 ecosystem update.
- The market has grown about fourfold over the past year.
- The total also rose during the third quarter.
- Franklin Templeton and WisdomTree are among the firms with tokenized assets on the network.
Tokenized US Treasury products on Avalanche have grown to about $545 million in value. The figure was shared in an Avalanche ecosystem update on October 7.
That total marks roughly fourfold growth over the past year. The value also climbed during the third quarter of 2026.
Tokenized Treasuries are blockchain-based products tied to short-term US government debt and money-market instruments. They are linked to real assets that trade in traditional markets.
How Tokenized Treasuries Work
Investors who hold these products get access to yield linked to US Treasuries. The blockchain handles settlement, ownership records and transfers.
This setup differs from many crypto assets, which have no link to traditional finance. Tokenized Treasuries represent claims on familiar government debt.
US Treasury securities are liquid and pay yield. These features have made them a common choice for firms building blockchain-based financial products.
Avalanche and Its Institutional Focus
Avalanche has spent years marketing itself to institutions and asset issuers. Its design lets firms build custom blockchain environments that still connect to a larger public network.
Tokenized assets from Franklin Templeton and WisdomTree have helped grow the network’s real-world asset market. Both are established asset managers in traditional finance.
Avalanche is not the only network in this space. Ethereum, Solana, Stellar and several Layer 2 networks also host real-world asset products.
Issuers of these products often look at different factors than typical crypto traders. Compliance, custody, settlement reliability, identity systems and distribution are among their priorities.
Transaction fees still matter to issuers. But they are only one part of how firms choose a network.
The $545 million figure remains small compared with the conventional US Treasury market. That market is valued in the trillions of dollars.
Still, the amount of Treasury-linked value on Avalanche has quadrupled in 12 months. The data shows more of these products are now being issued and held on the network.
The data on the segment was highlighted this week as part of a wider update on the Avalanche ecosystem. The update focused on the network’s growth in real-world assets.
As of the October 7 update, tokenized Treasury products on Avalanche stood at roughly $545 million. The value rose during the third quarter, continuing the growth seen over the past year.
The post Avalanche Tokenized Treasury Market Reaches $545 Million appeared first on Blockonomi.
CryptoPotato
Solana appears to be pulling in users at a much faster rate. Since early September, network growth has risen 124%, with about 1.71 million new wallets being created each day.
Activity is rising too.
Network Growth Accelerates
According to Santiment’s latest findings, daily active addresses are up 58% over the same period, having reached around 4.27 million unique wallets. In other words, more people are not just creating wallets but actually using the network. The growth gives SOL a stronger long-term case if the trend continues.
Santiment explained,
“Networks that attract more users and real utility have historically had greater potential to support higher market caps over time. If Solana keeps expanding its active user base, rising network value can eventually follow.”
At the time of writing, SOL is trading near $115 after a fresh 3% decline over the past day. The crypto asset broke its own channel support on the four-hour chart after a rejection near $120 this week. The breakdown has put $114 in focus. If that level fails, Ali Martinez believes that $111 could be next. According to trader ‘Wick,’ on the other hand, corrections can become opportunities.
Long-term projections remain firmly bullish. Tracer has projected a break above $300 during the bull market. Martinez is even more optimistic. He pointed to a possible cup-and-handle pattern on SOL’s monthly chart, with the neckline around $295. A monthly close above that level could strengthen the setup. Interestingly, the pattern points toward a potential target near $2,744.
Institutional Demand Takes a Hit
The institutional side of things has slowed down. September was a strong month for US-listed spot SOL ETFs, which collectively pulled in more than $271 million, making it their second-best month so far. October, however, has started on a very different note. The funds have seen just one day of inflows, with only $1.30 million entering on October 2. So far this month, more than $22 million has flowed out of these investment vehicles.
Separately, Solana’s stablecoin activity is hitting new highs as the network pushes further into institutional settlement. More than 14 million addresses now hold stablecoins on Solana, according to the data compiled by Blockworks. That’s a big jump from fewer than 4 million in late 2024.
The network now has over $15 billion in stablecoin supply.
The post Solana Network Growth Jumps 124%: Here’s Why It Could Matter for SOL appeared first on CryptoPotato.
Managing your crypto taxes can become increasingly complicated as your activity starts spreading across multiple exchanges, wallets, blockchains, and DeFi protocols.
CoinTracking is designed to bring that activity into one place, combining crypto portfolio tracking with transaction analysis and tax reporting.
Launched in 2012, it’s one of the longest-running platforms in the market. It now serves over 2.2 million active users, supports over 400 integrations across exchanges, wallets, and blockchains, and offers dedicated tax reports for 22 countries.
The platform combines two main functions: portfolio management and crypto tax reporting.
On the portfolio side, users can import transaction histories from exchanges, wallets, and various networks to monitor balances, trades, realized and unrealized gains, and overall portfolio performance in a single unified dashboard.
On the tax side, CoinTracking analyzes that transaction history and then uses it to generate tax reports. It currently provides country-specific reports for 22 jurisdictions, including the United States, United Kingdom, Germany, France, Canada, Australia, and Switzerland. Users in other jurisdictions can use CoinTracking’s configurable General Tax Report option.
The platform supports 13 methods to calculate taxes, including FIFO, LIFO, HIFO, ACB, AVCO, and HMRC, alongside some additional options for selecting different calculation methods across tax years, giving users and CPAs plenty of flexibility.
One of the more distinctive areas of CoinTracking is transaction validation. Before the user generates their final tax reports, tools such as the Missing Transactions Report, ValiCheck, Account Check, and the Transaction Flow Report can help identify gaps or inconsistencies when it comes to the imported data. This matters because incorrect tax calculations often stem from inconsistent or incomplete transaction history.
CoinTracking Verdict at a Glance
CoinTracking is one of the most established crypto portfolio tracking and tax reporting platforms. It’s aimed at users who want detailed transaction records, tax calculations, and portfolio analysis in a single platform. It supports over 400 integrations across exchanges, wallets, and blockchains. It also provides country-specific tax reports for 22 jurisdictions.
One of its core strengths is the depth of its reporting and validation tools. Features such as Account Check, ValiCheck, the Missing Transactions Report, and the Transaction Flow Report are designed to help users identify incomplete or inconsistent data before generating tax reports.
The trade-off, however, is complexity. Because of the wide range of reports, settings, and tax methods supported by CoinTracking, it might not be immediately clear for beginners. However, the team has done a great job in providing all the necessary materials that will guide you through all features and processes.
Overall, the platform is best suited to investors and traders who have more detailed or complex crypto history and value reporting depth, accuracy, and data validation. CoinTracking has also devised various pricing options so that even those who have very scarce transaction histories can benefit from their reporting tools instead of having to crunch numbers manually.
CoinTracking Pros and Cons
Pros:
- Broad tax-report coverage
- Wide integration support
- Multiple tax calculation methods
- Built-in transaction validation tools
- Support for more complicated crypto activity
- Flexible import options
Cons:
- Can be a bit challenging for beginners
- No monthly billing
- Transaction limits are cumulative and not per fiscal year
- Automated daily sync is limited by plan
Who is CoinTracking Best For
CoinTracking is likely to be a much better fit for users who need detailed transaction records, tax reporting, and a unified portfolio view rather than a lightweight crypto portfolio tracking app.
Best for:
- Active crypto investors using multiple platforms: those of you who have transaction histories spanning several exchanges, wallets, and blockchains may benefit from the platform’s 400+ integrations and its various methods to import your data.
- Investors with complicated transaction histories: if you dabble in DeFi, automated market making, NFTs, meme coins, liquidity provision, and more, then CoinTracking’s tooling, which is designed to identify missing or inconsistent transaction data, can be a great fit.
- Users who need jurisdiction-specific tax reporting: CoinTracking provides dedicated tax reports for 22 countries, as we mentioned above. It also supports 13 calculation methods, which may be very useful for those of you whose jurisdictions have more specific reporting requirements.
Not ideal for:
- Users with small and straightforward portfolios: if you bought Bitcoin once this year and you’ve never sold, or you don’t have any other transaction history, even the basic plan of CoinTracking might be overkill.
- Beginners looking for the simplest interface: because CoinTracking attempts to provide all the necessary features, its interface can feel a bit challenging at first. It can take time to get used to everything the platform offers.
CoinTracking Pricing
CoinTracking offers a Free plan, alongside Starter, Pro, Expert, and Unlimited paid tiers. Additionally, those of you interested in corporate options can contact the team for custom pricing based on your needs.
One important point is that each transaction limit applies to the total number of transactions that are stored in the account over its lifetime – they do not reset at the start of each tax year. In practice, one subscription covers every tax year stored in the account, including previous years, which is especially useful if you are catching up on several years at once.
Two examples:
- Three tax years with around 1,000 transactions each (3,000 in total) fit into one Pro subscription at $169. Tools priced per tax year typically charge around $99 per year at this volume, so $297 for the same three years.
- Three tax years with around 3,000 transactions each (9,000 in total) fit into one Expert S subscription at $259. Per-tax-year pricing at this volume typically starts at $199 per year, so at least $597 for the same three years.

Free Plan
The free plan offers a view-only mode in the dashboard and can be used mainly for tracking your portfolio. You can import up to 200 transactions via manual entry, CSV files, blockchain addresses or exchange APIs, and use the mobile app. New accounts also start with a 7-day free trial with unlimited imports, although downloading a full tax report requires a paid plan.
Starter Plan
Tax reporting starts with this plan. It supports up to 200 transactions, but you can also rely on tax reports and backups. It also supports manual API imports, although the automatic daily sync is not included.
This plan starts at €39 per year, €69 for two years or a one-time payment of €199 for a lifetime subscription.
Pro Plan
The Pro plan includes everything the Starter plan does, but it includes 3,500 total transactions; you get 5 backups, automatic sync, access to the CoinTracking Data API, and source-of-funds tracking, a new feature.
It costs €129 per year, €209 for two years, or €569 for lifetime access.
Expert Plan
With the Expert plan you can customize how many transactions you need, starting with 20K, 50K, or 100K. You get 10 backups, everything included in the Pro plan but on top of it you also get a file converter, which allows you to convert any file you upload into a ready-to-import format.
The pricing starts at €219 per year
Unlimited Plan
As the name suggests, this plan gives you an unlimited number of transactions as well as all the features that CoinTracking has to offer.
It starts at €769 per year, €1,179 for two years, and €5,999 as a one-time payment for lifetime access.
How CoinTracking Works
In essence, CoinTracking works by allowing you to import transaction data from various sources such as exchanges, wallets, and blockchains. It then uses this data to enable portfolio tracking, performance analysis, and tax reporting.
The typical workflow is rather straightforward: you import your transactions (through one of many available means), review the data for errors, and then generate the reports you need for tax purposes.
Creating an Account
Creating an account is as simple as it gets. Once you are on the creation page, simply opt in to create an account with your Google or Apple profile, or generate one via email.

Importing Transactions
Once your account is created, you will land on a welcome screen which allows you to select a platform that you wish to import your data from. This could be an exchange, a wallet, a blockchain, and so forth. Use the search option if you cannot immediately find your provider. CoinTracking supports more than 400 different platforms, meaning that the odds of finding your particular one are rather high.

For the purpose of this demonstration, we have selected a MetaMask wallet connected to Ethereum. This is what the screen would look like:

As you can see, all you need to do is paste your wallet’s address. A cool feature of CoinTracking is that even if you’ve selected Ethereum (or any other network for that matter) as the one you want to import from, the platform detects if that address holds crypto on other blockchains and asks you if you want to import it as well.

API and CSV Imports
If a platform is not among the 400+ dedicated integrations, the Custom Exchange Importer lets you map the columns of almost any export file yourself, and Excel or bulk imports, a standard CSV format and the AI File Converter offer further ways to bring data in.
Naturally, the appropriate method is likely to vary based on your particular needs and the platform that you use.
Automatic Sync
As mentioned above, this is a feature that comes with the Pro plan. In essence, this feature will reduce the need for manual updates. That said, it is recommended that you continue reviewing the data for missing, duplicated, or incorrectly categorized transactions.
CoinTracking Data Validation Tools
CoinTracking also comes with multiple tools that allow you to check whether imported transaction data is complete and consistent before it is used to generate tax calculations.
This is important because the tax calculation itself depends entirely on the accuracy of the underlying transaction history. For example, if a relevant transaction is missing or gets duplicated during the importing process, the recorded cost basis is also going to be wrong.
Account Check
Account Check is designed to help identify potential issues with imported transaction data, including incorrect balances and inconsistencies.
Its main purpose is to serve as a diagnostic tool. It can flag entries that still need to be reviewed and, if necessary, corrected by the user.
ValiCheck
This one is designed to help the user compare imported transaction data with the records from their exchanges or wallets.
It can be very useful, and it is aimed at identifying missing or duplicated transactions, particularly when CoinTracking’s calculated balances do not match the balances that are shown on the original platform.
Missing Transactions Report
As the name suggests, the Missing Transactions Report feature focuses mainly on the transfers between wallets and exchanges. It looks for withdrawals and corresponding deposits that do not match correctly.
It can help you identify transfers where one side may be missing from the transaction history. It’s suitable for users who frequently move assets between exchanges and self-custody wallets.
Transaction Flow Report
This feature displays transactions chronologically and shows how balances change over time. It’s helpful to trace where a balance discrepancy or negative balance first appears. However, it’s most useful when applied alongside the platform’s other validation tools.
CoinTracking Tax Reports
It goes without saying that tax reporting is one of the platform’s main functions. Once the transaction data has been imported and checked for inconsistencies, CoinTracking can then transform that data and generate tax calculations based on your jurisdiction and selected accounting method.
Currently, CoinTracking provides dedicated tax reports for 22 countries, while users in other jurisdictions can use its configurable General Tax Report, which I will get to in a moment.
Country-Specific Tax Reports
CoinTracking provides country-specific reports for Austria, Australia, Belgium, Canada, Czechia, Denmark, Finland, France, Germany, India, Ireland, Italy, the Netherlands, New Zealand, Norway, Poland, Portugal, Spain, Sweden, Switzerland, the United Kingdom, and the United States.
For US filers, CoinTracking generates Form 8949, Schedule D, FBAR and Form 8938. It supports wallet-by-wallet cost basis under Rev. Proc. 2024-28 through its Reallocation Report, lets users assign transactions to the correct Form 8949 section to reconcile against broker-issued Form 1099-DA, and offers a direct TurboTax export. For UK filers, the dedicated HMRC method applies the same-day and 30-day rules before pooling the remaining assets at average cost.
It’s worth noting that the country coverage is constantly expanding, with France and the Czech Republic being the latest additions.
General Tax Report
If you reside outside of the 22 supported jurisdictions, you can use CoinTracking’s General Tax Report feature.
This is a configurable report that’s intended for exactly those jurisdictions where the platform doesn’t have a dedicated country-specific format. It allows users to apply the available calculation settings to their transaction history and produce tax-related data that can be then used for their records or reviewed with a local tax professional.
Supported Tax Calculation Methods
CoinTracking supports a total of 13 calculation methods. These include FIFO, LIFO, HIFO, ACB, AVCO, and HMRC. It also offers OPTI and MULTI options for selecting calculation approaches across different fiscal years.
This is an important consideration. Some countries have specific requirements as to the calculation method you have to use, and in certain cases using one over the other could result in some tax deductions and savings. You can read more about this in our article on the matter.
What the Tax Report Includes
At a high level, the tax reporting of CoinTracking is largely based on the transaction history that’s stored in the account and the calculation method that you’ve selected.
It’s critical to note that the output would heavily depend on the quality of the underlying data. Therefore, missing transfers, incorrect transaction types, duplicated entries or incomplete reports can significantly affect the calculations in the reports.
Fortunately, as I mentioned earlier, CoinTracking has quite the suite of tools that you can use to double check numbers, although manual review is always recommended.
CoinTracking Support for DeFi, NFTs and Complex Transactions
If you have been around for a while, chances are that at some point in your crypto journey, you have traded or minted NFTs, provided liquidity on Uniswap, or staked a token on-chain. Well, the bad news is that all of this activity also has to be accounted for in your annual tax reports. The good news is that CoinTracking offers plenty of tools for that too.
Decentralized Finance (DeFi)
CoinTracking supports a wide range of DeFi-related transaction types. These include loans, collateral, liquidity provision, liquidity-pool rewards, repayments, and whatnot. These transactions can be categorized so that they are treated appropriately within your portfolio and on the tax report.
DeFi activity can still require more manual review than standard exchange trades. This is because they involve multiple tokens, bridges, and liquidity pools, to name but a few.
For users with substantial DeFi activity, the transaction validation tools that I talked about earlier can become very relevant.
Non-Fungible Tokens (NFTs)
The platform can also record transactions related to NFTs, as well as display the NFTs within its NFT center. If a price is not assigned to your assets automatically, you can do that manually where necessary.
For instance, NFTs that were purchased with crypto can be record as trades so that the value of the crypto you used in the purchase is reflected in the transaction history.
Staking
You can record staking rewards and assign them to the relevant exchange or wallet within CoinTracking’s interface.
The platform also supports transaction types associated with staking and liquidity-pool rewards, allowing you to separate these activities in the transaction history.
The exact tax treatment of staking rewards varies a lot by jurisdiction. This is why correctly recording the transaction type doesn’t necessarily determine by itself how the activity should be reported for tax purposes.
Margin Trading and Futures
Undoubtedly one of the main concerns for many crypto users, CoinTracking supports dedicated transaction types for margin profits and losses, derivatives, and futures profits and losses.
Now, it’s very important to note that there is a certain limitation here: the data that CoinTracking handles is the one derived from the platform that you use. Some exchanges are known for not providing complete realized profit-and-loss data for margin and futures through their APIs or standard CSV exports. In those cases, CoinTracking won’t be able to reconstruct the result, so you might have to enter the information manually.
Fees and funding payments can also be recorded separately but, again, the way they ultimately appear in the tax report will depend on your reporting settings based upon your jurisdiction.
Portfolio Tracking
As I mentioned earlier, portfolio tracking was CoinTracking’s original core functionality before tax reporting was added. Today, users are able to monitor balances, gains, losses, transaction history, as well as portfolio performance across connected exchanges, wallets, and networks in a unified dashboard view.

The platform supports over 400 integrations, which makes it possible to consolidate activity from a bunch of different sources rather than having to review each one individually.
Portfolio tracking is also available in view-only mode on the Free plan.
Now, for users with relatively simple portfolios, the amount of data that’s being displayed could feel a bit unnecessary. The portfolio tools are definitely more useful for investors with activity that spreads across several platforms or have longer transaction histories.
CoinTracking’s Full-Service
CoinTracking also offers a separate full service for those of you who don’t want to manage the entire process yourself.
The service is available in more than 25 countries and it can include assistance with importing transactions, validating account data, and preparing tax reports. It is billed separately from the standard subscription plans. Filing is not part of the service. Users can submit the reports themselves or, in most countries, be referred to one of CoinTracking’s partner tax advisors. In the US, these are independent, US-based CPA partners.
There is no fixed public price list. The process starts with a free consultation, after which the team provides an individual quote based on factors such as the scope of work and transaction volume.
Is CoinTracking Safe in 2026?
Yes, CoinTracking is safe to use in 2026. The platform has put several security and privacy controls in place, including ISO/IEC 27001 certification, EU-based data hosting, GDPR compliance, encrypted API credentials, and support for read-only exchange API connections.
CoinTracking’s ISO 27001 Certification
First things first, CoinTracking is certified to ISO/IEC 27001:2017. This is an international standard for information security management systems. In essence, this certification covers areas including company processes, encryption, APIs, infrastructure, as well as internal security procedures.
The certification also means that the company has implemented and undergone audits of a formal information security management system. Of course, this doesn’t mean that it’s immune to security incidents, but it provides considerable insight into how security risks are managed.
EU Data Hosting and GDPR
User data is stored on servers within the European Union and it is handled in accordance with the rigorous standards set forth in the General Data Protection Regulation (GDPR).
Moreover, users are also able to create accounts without providing an email address, which reduces the amount of personal information required to use the service.
Account Privacy and Read-Only APIs
Another important thing to consider is the fact that the platform uses read-only APIs. This means that the permissions that are granted allow it to only retrieve transaction and balance information without allowing it to execute any further actions like executing trades or withdrawing cryptocurrency.
Moreover, CoinTracking states that it encrypts stored API secrets and that employees cannot view or decrypt them.
CoinTracking Limitations
CoinTracking offers a very broad range of portfolio and tax tools, but that depth might actually impose a few trade-offs.
For instance, the first thing that comes to mind is the ease of use. Now, don’t get me wrong, the software is not challenging to use and, by all means, no accounting software is actually easy to use. That said, the large number of report types, settings, transaction types, validation tools, and everything in between that is designed to optimize for as many possible user needs as there are also makes it a bit challenging for a beginner.
As I mentioned earlier, though, CoinTracking has done a good job posting various tutorials that explain most features in depth.
Naturally, as with most automated import systems, when you are uploading a list of transactions, especially if those transactions are actually coming from complex DeFi activity, manual verification is downright mandatory.
Remember, your final report is only as good as the data you support, so make sure that everything checks out.
Conclusion: Is CoinTracking Worth It?
If you’re a user who does hundreds of transactions regularly, if you trade on a daily basis or dabble in the intricate world of DeFi, CoinTracking is worth it. It provides all sorts of reporting capabilities, making it suitable for different types of crypto users, spanning from futures traders to margin users and DeFi aficionados.
The availability of 22 country-specific tax reports, 13 calculation methods, and dedicated validation tools also gives users a lot more control over how transaction data is reviewed before reports are generated.
If you’re a regular investor who buys something once a year and forgets about it, then CoinTracking might be rather unnecessary, as you can probably create the report on your own in a few minutes.
CryptoPotato readers get a special 10% discount using the following link.
The post CoinTracking Review 2026: Pricing, Features, Pros & Cons appeared first on CryptoPotato.
[PRESS RELEASE – Tallinn, Estonia, October 8th, 2026]
SaaS and eCommerce increased their combined share from 48.26% to 55.54%, while Trading moved from 14.07% to 13.15%.
Businesses can build stablecoin infrastructure around the wrong problem.
The mistake is treating stablecoins primarily as a coin-and-network decision. For a digital business, they may need to support a much broader set of operating workflows, including billing, checkout, settlement, payouts, and reconciliation.
Which of those workflows matters most depends on the business model.
New aggregated data from NOWPayments shows the industry mix shifting toward businesses that use payments as part of their day-to-day operations. Between January 16 and July 16, 2026, SaaS and web services accounted for 27.78% of classified partners. eCommerce Marketplaces followed at 27.76%. Together, the two sectors represented 55.54% of the sample. During the same period in 2025, their combined share was 48.26%. The increase of 7.28 percentage points represents a 15.08% year-over-year rise in their combined share.
Trading remained an important part of the sample, but its share moved in the opposite direction. It declined from 14.07% in 2025 to 13.15% in 2026, leaving trading in third place behind SaaS and eCommerce.
The clearest upward shift came from SaaS. Its share increased from 15.58% to 27.78% in one year, closing a gap of 17.10 percentage points with eCommerce. The emerging picture is not stablecoins replacing trading. It is stablecoin adoption expanding into the operating infrastructure of digital businesses.
Unless otherwise stated, industry-distribution figures compare January 16 to July 16, 2025, with January 16 to July 16, 2026.
The Partner Mix Is Shifting Toward Operational Use Cases
In 2025, eCommerce marketplaces led the dataset at 32.68%. SaaS and Web Services followed at 15.58%, with Trading close behind at 14.07%.
One year later, SaaS had increased its share by 12.20 percentage points to 27.78%. eCommerce stood at 27.76%, leaving only 0.02 percentage points between the two sectors. Their combined share rose from 48.26% to 55.54%. More than half of the classified partners in the 2026 sample therefore came from two sectors built around digital transactions, recurring services, and online customer relationships.
The rest of the partner mix changed more gradually.
Financial Services moved from 9.00% to 6.35%. Gambling and iGaming increased from 6.20% to 6.87%, and adult platforms rose from 4.99% to 5.89%. Charity declined from 2.27% to 1.40%, while TGE/Presale moved from 2.12% to 1.35%.
These figures measure changes in each industry’s share of the sample. They do not measure absolute partner growth. A category may lose share because another category expanded faster.
 Methodology: Each percentage represents an industry’s share of the full aggregated partner sample classified across the same nine categories. The comparison covers January 16 to July 16 in both 2025 and 2026. Each period was normalized independently. Absolute partner counts are not disclosed, and percentages are rounded to two decimal places. The findings describe partner distribution within the NOWPayments dataset, not payment volume, transaction value, or market-wide industry share.
Different Business Models Need Different Stablecoin Workflows
The industry data becomes useful when it is translated into the operating questions each business model may need to solve.
For a SaaS company, stablecoin payments may need to connect with recurring billing, invoice matching, account activation, renewals, settlement, and financial reconciliation.
A marketplace may need stablecoins to work across a longer flow. The payment can begin at checkout and continue through refunds, seller settlement, affiliate commissions, and other payouts.
Trading platforms face a different set of requirements. Their priorities may include asset and network coverage, confirmation policies, liquidity, and treasury controls.
These are potential workflow drivers, not a universal description of every company in each category. The point is that the same stablecoin can serve all three sectors while performing a different operational job in each one.
This is why a business should define the workflow before choosing the asset and network.
The Network Mix Also Changes by Industry
The successful-payment data shows that industry differences extend to network usage.
USDT on TRON accounted for 54.58% of the measured successful-payment sample within eCommerce marketplaces. Its share was 12.04% in trading and 9.60% in SaaS and web services.
Within this dataset, USDT TRC20 was about 4.5 times as prominent in eCommerce as in Trading and 5.7 times as prominent as in SaaS.
The corresponding shares were 4.76% in Gambling and iGaming, 1.85% in Financial Services, 1.49% in Other, and 0.60% in Charity. Adult Platforms and TGE/Presale each recorded a 0% share in the analyzed sample.
The difference supports the same conclusion as the industry data. A stablecoin setup that fits one business model may not fit another.
For an eCommerce business, USDT on TRON may play a visible role in checkout activity. A SaaS company may see a different asset and network mix. Trading platforms may need broader coverage across both.
Businesses should validate these decisions against their own successful-payment data instead of importing the preferences of another industry.

Methodology: Each percentage represents USDT TRC20’s share of the aggregated successful-payment sample within the corresponding industry. Absolute transaction counts are not disclosed. Failed, expired, refunded, and test transactions are excluded. The figures describe activity within the NOWPayments ecosystem and should not be interpreted as market-wide currency shares. A 0% result means that no successful USDT TRC20 payments were recorded in the analyzed sample for that category.
Build the Workflow Before Choosing the Rails
The five operating areas introduced at the beginning provide a practical framework for evaluating stablecoin infrastructure.
- Billing: Does the payment need to connect with invoices, subscriptions, renewals, or account access?
- Checkout: Which assets and networks produce completed payments for the company’s actual customers?
- Settlement: Which asset should the business receive, and when should funds become available?
- Payouts: Will funds need to move to sellers, affiliates, contractors, or customers?
- Reconciliation: How will the finance team match transactions with invoices, orders, and internal reporting?
Not every business needs all five. A SaaS platform may focus on billing and reconciliation. A marketplace may need checkout, settlement, and payouts. A trading platform may prioritize network coverage, liquidity, and treasury controls.
The company should first identify which workflows apply. Asset and network selection comes after that.
“The mistake is asking which stablecoin is best. The better question is: best for what?” said Kate Lifshits, Commercial Director at NOWPayments. “Businesses should define the billing, checkout, settlement, payout, and reconciliation flow first. The coin and network should serve that workflow – not the other way around.”
Lifshits explores the commercial side of crypto payments in her Cryptopolitan series, Crypto That Works for Business. The first column, The 22% Sales Boost Hiding in Your Crypto Checkout, examined how payment infrastructure can affect checkout performance. Future installments will continue looking at where crypto payments can increase revenue, lower costs, and remove operational friction.
Stablecoin strategy starts with the job the money needs to do. The coin and network come next.
About NOWPayments
NOWPayments is a crypto business ecosystem designed to help companies accept payments, automate mass payouts, manage stablecoin treasury, and scale global digital asset operations through a single infrastructure. The platform supports more than 350 cryptocurrencies, over 30 stablecoins, flexible settlement options, and enterprise-grade APIs.
The post Stablecoins Are Quietly Becoming Business Infrastructure, NOWPayments Data Shows appeared first on CryptoPotato.
[PRESS RELEASE – Singapore, Singapore, October 6th, 2026]
Travala has teamed up with BNB Chain and Binance Pay to launch a native AI travel booking agent directly on Travala that lets travellers search and book hotels using only a BNB Smart Chain (BSC) wallet with no setup required.
To use the agent, travellers simply open the AI travel agent widget on Travala, fund any BSC wallet address with USDT (turning the wallet into a universal API key), and book the desired hotel from the options presented by the agent.
In this three-way partnership, Travala supplies the hotel inventory, Binance Pay provides the settlement infrastructure, and BNB Chain brings the Machine Payments Protocol (MPP) Software Development Kit (SDK) standard, the agentic framework, and the distribution.
Travellers can receive 10% back on their first booking over US$400 made via the agent. The 10% incentive is split into two components: 7% in BNB is paid directly to the payment wallet after the stay is completed, and an additional 3% in AVA can be received when booking as an AVA Smart Member.
This agent functions independently of the Travala Travel MCP, providing travellers with a standalone option for agentic bookings on BNB Chain.
“By offering this browser-native, frictionless booking experience enabled by BNB Chain and Binance Pay, we’re streamlining agentic AI adoption at the intersection of blockchain and travel. Adding BNB Chain’s MPP standard gives our customers even more choice, making booking a vacation as simple as funding a BSC wallet and letting the travel agent do the rest,” said Juan Otero, CEO of Travala.
Travala’s entire hotel inventory of more than 2,200,000 accommodations is now available for booking via this agent, with additional travel products including flights expected to be integrated in the future.
Thomas Chen, CBO of BNB Chain, said: “The combination of AI agents, blockchain infrastructure and on-chain payments is opening the door to a new generation of products that can transact and operate on behalf of users. Travala is a great example of how this can simplify everyday experiences like travel while paving the way for entirely new on-chain use cases across industries.”
Binance Pay acts as the underlying settlement infrastructure for this new agentic experience. When travellers book with the agent, Binance Pay handles the payment process using the Permit2 facilitator.
- User signs one EIP-712 Permit2 authorisation off-chain. No gas, no broadcast.
- MPP SDK verifies the signature, checks balance and allowance, and confirms the Permit2 deadline and witness hash.
- MPP calls the Binance Pay settlement endpoint, passing the pre-verified Permit2 args.
- Binance Pay broadcasts the Permit2 call, paying gas. Funds move from the user wallet to Travala.
- MPP marks the payment complete and issues a cryptographic on-chain receipt, instantly confirming the booking.
This addition to Travala’s growing lineup of agentic travel booking options is another step in bridging the gap between Web3 capabilities and real-world utility through the power of AI.
About Travala
Founded in 2017 and now backed by industry giant Binance, Travala is the leading crypto-native travel booking service with 2,200,000+ properties across 230 countries, 600+ airlines, 400,000+ activities, and 50,000+ car rental locations globally. Travala is a champion of cryptocurrency adoption, accepting over 100 leading cryptocurrencies alongside traditional payment methods. In addition to unbeatable prices via its Best Price Guarantee, AVA Smart Members on Travala can also enjoy additional discounts and loyalty rewards for eligible bookings made on the platform. For more information, visit: www.travala.com
About BNB Chain
BNB Chain is one of the largest and most active blockchain ecosystems in the world. Its multi-chain architecture spans BNB Smart Chain (BSC), opBNB, and BNB Greenfield, giving developers the flexibility to choose the environment best suited to their application. With high throughput, low transaction costs, and full EVM compatibility, BNB Chain is built for high-speed trading, AI agents, privacy, and instant payments. It is the blockchain with superior distribution and deep liquidity, built for global markets and the next billion users. For more information, visit: www.bnbchain.org.
About Binance Pay
Binance Pay is a payment service within the Binance ecosystem that enables eligible users to make and receive payments through supported payment experiences. The service incorporates applicable user-verification, risk-management, transaction-monitoring, and account-security controls. For more information, visit: www.pay.binance.com
The post Travala Launches Native AI Travel Agent with BNB Chain & Binance Pay appeared first on CryptoPotato.
The past week or so has been quite eventful for the broader Ripple and XRP ecosystem, with new partnerships and developments concerning both the company and the underlying asset behind it.
We will review the key points in this article and outline some reasons behind the native token’s price slump.
Big Win on Wall Street, Another in Korea
But before we dive into XRP’s price moves, let’s examine some of the big news coming this week. Ripple strengthened its partnership with the Wall Street giant Brevan Howard by enhancing access to multi-asset prime brokerage amid rising demand and integrated investment infrastructure.
Ripple Prime will streamline operations for the Wall Street entity across several asset classes, including traditional and crypto, to improve capital efficiency. The collaboration follows Ripple’s $500 million investment round in 2025, in which Brevan Howard was among the participants, marking a significant evolution in their relationship post-SEC settlement.
The second piece of major macro news comes from the other side of the world, South Korea. Meritz Securities partnered with Ripple to improve its digital asset infrastructure in the country, focusing on custody and tokenization. The agreement aims to align with the evolving local market and regulatory landscape and follows Ripple’s broader expansion in Korea, including deals with K Bank and Kyobo Life Insurance.
RLUSD and XRP ETFs
Ripple’s native stablecoin, which saw the light of day in December 2024, has picked up the pace lately in terms of market cap and utilization. Following the launch of Ripple Mint, a platform allowing institutional customers a single way to access, mint, redeem, and manage the stablecoin, its adoption rate has increased significantly.
This led to RLUSD crossing a major milestone, with its market cap climbing above $2.5 billion. RLUSD is the 40th-largest cryptocurrency by this metric, and the eighth-largest in its stablecoin niche, closing down the gap to PayPal USD (PYUSD), with a current market cap of $2.88B.
Separately, demand for XRP through the exchange-traded funds tracking its performance fell 94% week over week, as reported over the weekend. The inflows dropped from over $75.5 million to under $4.75 million during the past full couple of weeks. The ongoing one has not seen any improvement, as the funds have seen only one day in the green ($3.14 million) and two days with no reportable data.
XRP Price Collapse
Heading into the business week, the underlying asset tried to take down decisively the $1.51-$1.53 resistance. Analysts such as Ali Martinez predicted a major breakout in the making, while ChartNerd supported his view and outlined $1.80-$2.00 as the next major target.
However, on-chain data showed something quite worrisome. CryptoQuant warned that XRP transfers to Binance had skyrocketed, with around 1.6 billion tokens flowing into the exchange over the past 30 days, increasing the immediate selling pressure.
The results were quite obvious. Instead of breaking above the $1.51-$1.53 resistance, XRP was rejected and plummeted below $1.40 earlier today. The asset is down by over 6% in the past week, and its market cap has plunged below $90 billion.
The most apparent reasons behind its collapse include the cratering ETF demand, increased immediate selling pressure due to large token transfers on Binance, and the market-wide correction. As reported earlier, BTC slipped to $82,200 for the first time in over two weeks, while ETH is down by almost 6% weekly.
The post Important Ripple News and XRP Price Update: October 8 appeared first on CryptoPotato.