Cryptocurrency Posts
Crypto Briefing
Cerebras' innovative chip design could redefine AI infrastructure by alleviating supply constraints, but execution and diversification remain critical.
The post Cerebras sidesteps AI chip supply bottlenecks with 5nm wafer-scale design appeared first on Crypto Briefing.
The debate highlights AI's potential to reshape economic dynamics, influencing inflation trends and monetary policy effectiveness.
The post ARK’s Cathie Wood counters Bill Ackman’s inflation warning appeared first on Crypto Briefing.
AI-driven fundraising in Hong Kong signals a shift in global capital flows, potentially reducing Wall Street's dominance in equity markets.
The post Hong Kong bankers skip summer break as AI drives record fundraising appeared first on Crypto Briefing.
The tightening Florida governor race could shift political dynamics, influencing national strategies and market perceptions of party strength.
The post Florida governor race tightens as Byron Donalds faces David Jolly appeared first on Crypto Briefing.
VIS's expansion plans highlight the growing demand for AI infrastructure, potentially intensifying competition in the mature-node chip market.
The post VIS weighs second Singapore plant as AI demand fills its first fab appeared first on Crypto Briefing.
Bitcoin Magazine
Bitcoin Magazine
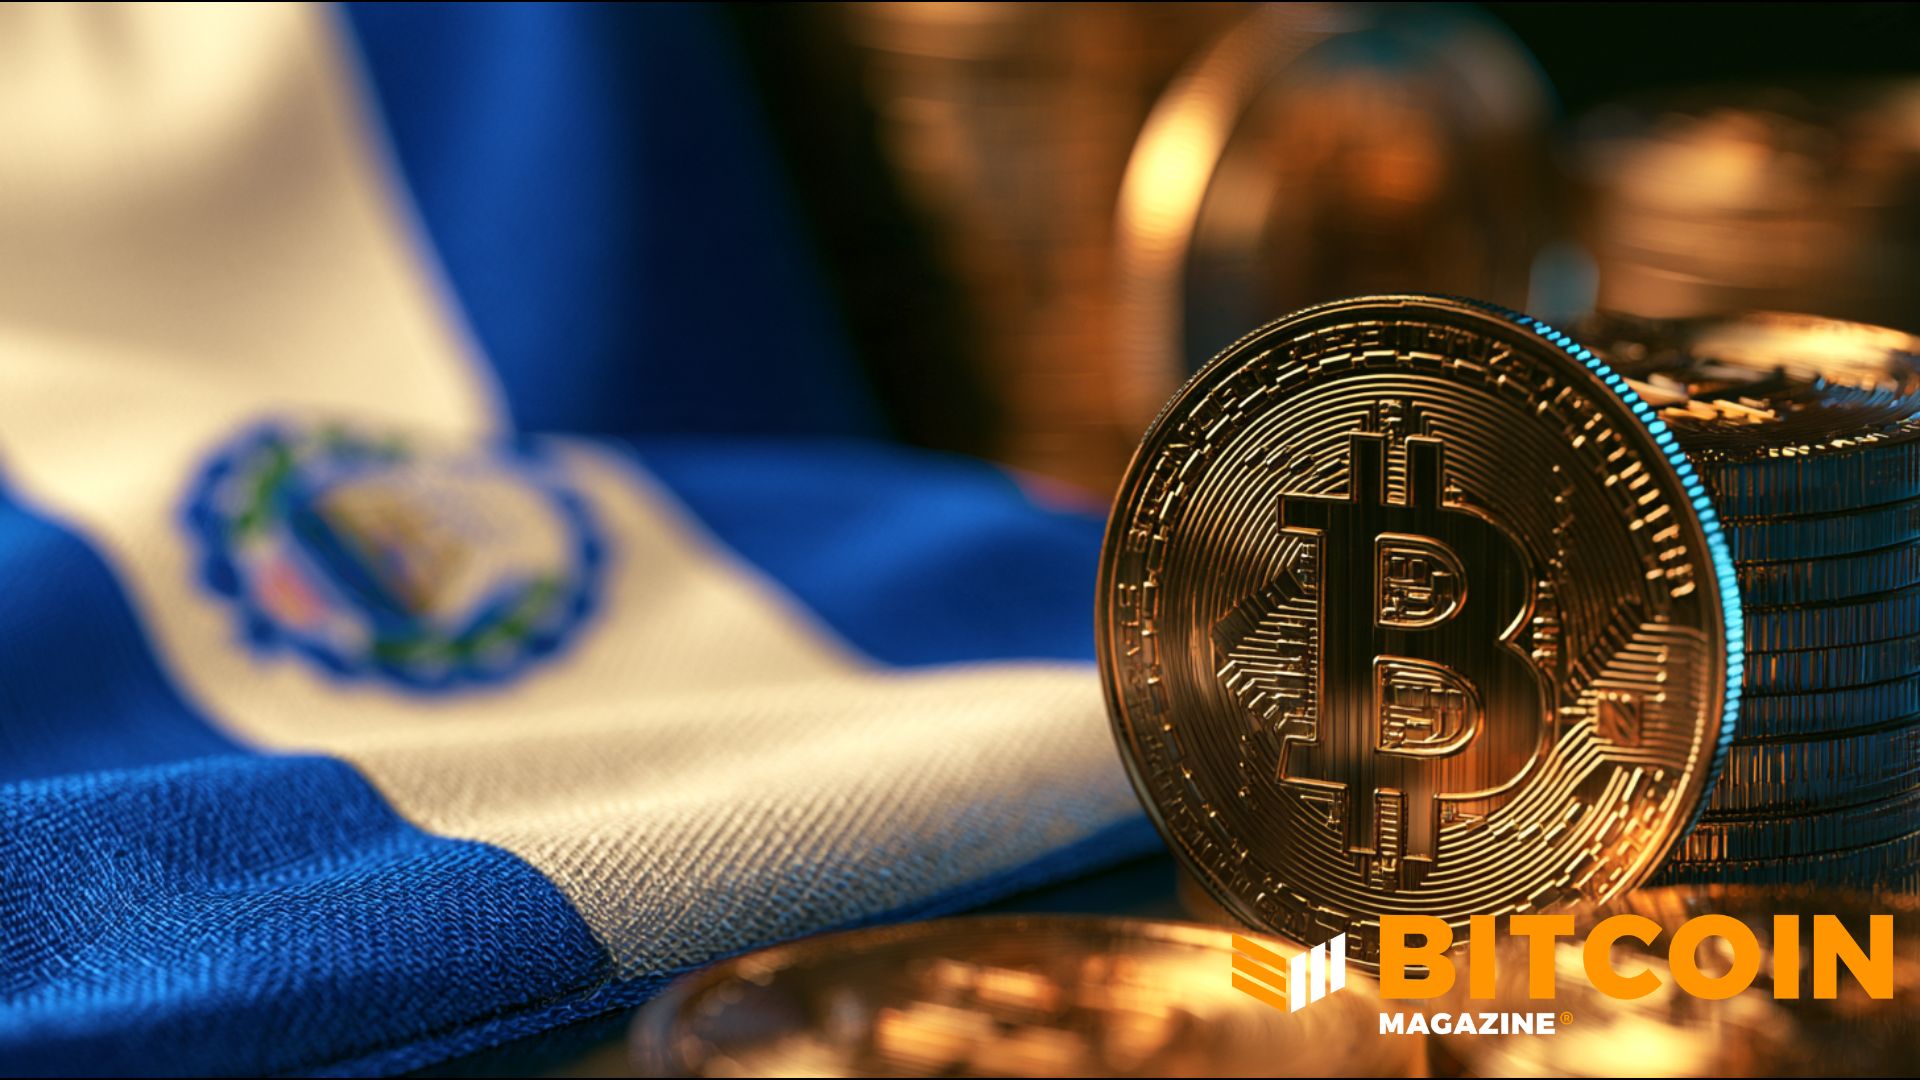
IMF Praises El Salvador — But Still Tries To Scale Back Its Bitcoin Project
The International Monetary Fund has praised El Salvador for improving its economy — but scolded it at the same time for its ongoing Bitcoin experiment.
In a statement Friday, the IMF said that it had approved a $139 million disbursement to the Central American nation while also trying to “reduce the state’s involvement in Bitcoin-related activities.”
El Salvador in 2021 made Bitcoin legal tender, much to the ire of the IMF and other major institutions. The Latin American country was at the time negotiating a development loan with the agency.
“El Salvador’s economy continues to perform strongly”
— Nayib Bukele (@nayibbukele) October 1, 2026https://t.co/Rvaerha9QA
The IMF in September said that El Salvador wasn’t buying bitcoin; the country’s Bitcoin Office has repeatedly said that it does buy the cryptocurrency.
“Economic activity has exceeded expectations, supported by sustained improvements in security and investor confidence, as macroeconomic imbalances continue to be addressed,” the IMF said.
It continued: “However, certain performance criteria were not met, including on the Bitcoin accumulation front, for which waivers were granted based on strong corrective measures and renewed commitments.”
The IMF further said that the Salvadoran state’s involvement in Bitcoin-related activities is being unwound and that “no further bitcoin accumulation is envisaged beyond the documented donations.”
Salvadoran president Nayib Bukele in 2022 said the country would buy one bitcoin per day but it was never clear where the money was coming from — or if he was actually buying at all.
The IMF said in September that El Salvador was — at least for some time —not using public funds to accumulate bitcoin but rather had received bitcoin from private donations.
El Salvador and the IMF entered a $1.4 billion loan agreement at the end of December but the fund asked for the country to scale back certain aspects of its Bitcoin strategy.
The Salvadoran state gifted its citizens bitcoin in 2021 and debuted a wallet with the hope of getting more citizens using the cryptocurrency in the dollarized country.
President Bukele in 2024 admitted that Salvadorans weren’t using the cryptocurrency to buy things as expected, but always boasted that the government was still stacking sats.
This post IMF Praises El Salvador — But Still Tries To Scale Back Its Bitcoin Project first appeared on Bitcoin Magazine and is written by Mathew Di Salvo.
Bitcoin Magazine
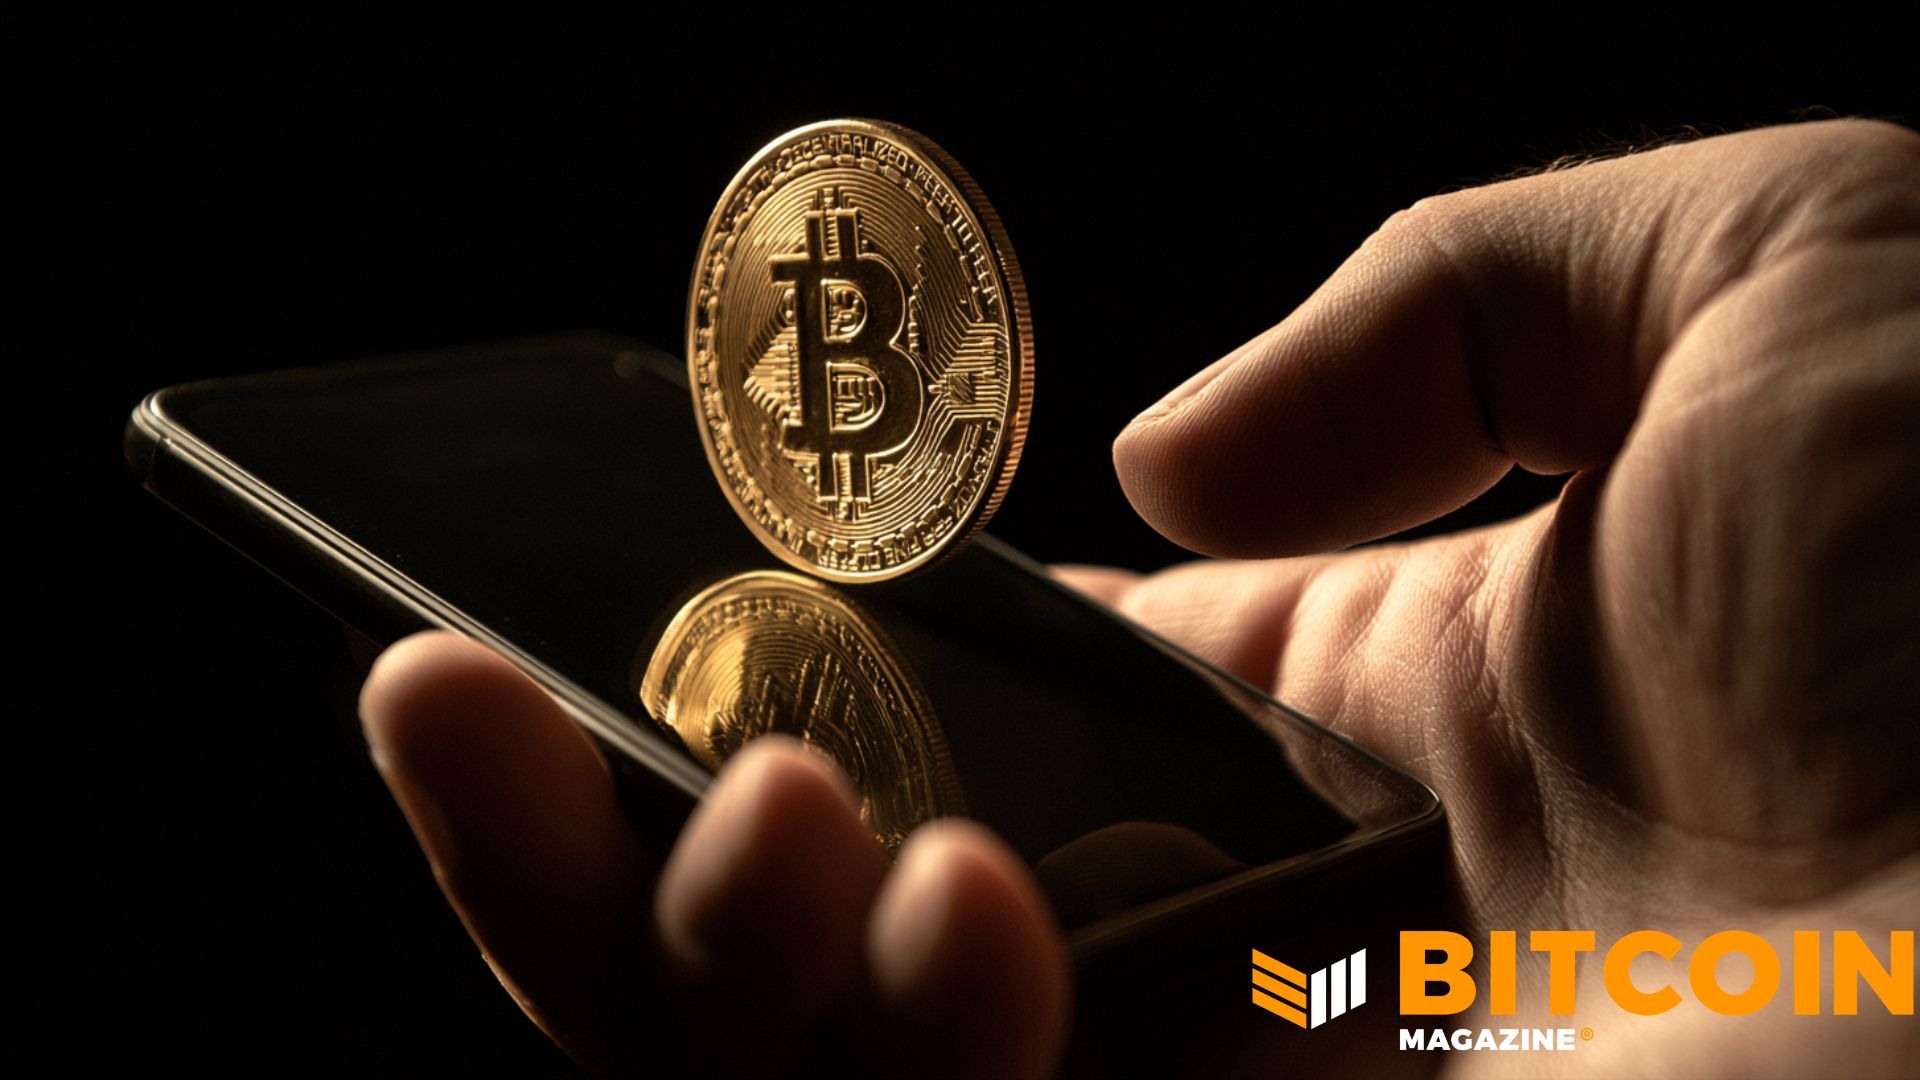
When the Banks Don’t Work, Bitcoin Does: Cornell University’s Adoption Index
A lot of people know little about Bitcoin and how it works.
But despite knowledge being shallow, for those holding the leading cryptocurrency, it appears to be solving a problem: getting around failing banking rails or inflation.
That’s according to new findings from the U.S. Ivy League research university Cornell, which spoke to nearly 26,000 around the globe about Bitcoin.
In its new Bitcoin Adoption Index report, the top college found that El Salvador, Venezuela and Nigeria were the countries that had the highest number of people who had ever owned bitcoin.
“Ranked by the share of all respondents who have ever owned bitcoin, the leaders are not wealthy financial centers — they are economies where the national currency has been unstable and everyday access to dollars or reliable banking is hard,” the report read.
“In each, bitcoin functions less as a speculative bet and more as a practical workaround.”
Bitcoin Advocacy Associate at Strategy and Junior Fellow at Cornell University’s Brooks School Tech Policy Institute, Ella Hough, added: “Bitcoin works the same everywhere, but people’s need for it does not.
“Across 25 countries, we found that people are more likely to see Bitcoin as a tool for financial freedom where currencies are less stable, banking access is limited, or monetary controls are tighter.”
Still, Cornell found that actually being able to explain the fundamentals of the protocol was difficult for most — including how many bitcoins would ever be minted in existence. In fact, 58% of those surveyed said they didn’t know the supply was capped at 21 million coins.
Technicalities aside, the cryptocurrency has still proved helpful to people wanting to use it, the report found.
One Venezuelan — who wasn’t named — told interviewers that Bitcoin was “faster, cleaner, and much less risky” than other methods of getting dollars in the country.
While another Salvadoran was quoted saying: “When nobody controls [bitcoin], it means we all have control of it.”
A Nigerian interviewee reportedly told Cornell researchers: “I’ve been to six African countries and whenever I go there, I don’t fear it because I know I can spend my bitcoin.”
Bitcoin adoption started growing in Venezuela ahead of other countries years ago, when hyperinflation crippled the economy and strict government currency controls meant getting dollars became difficult.
El Salvador made bitcoin legal tender — along with the dollar — in 2021. The country’s leader admitted that getting its citizens to use the cryptocurrency was difficult but the Central American nation still says it buys the asset for its government coffers.
In Nigeria, which has had some of the highest transaction volumes in the world, saving in bitcoin has been used by some to get around the collapse of the naira.
Cornell University’s research was fielded by Morning Consult in partnership with the Tech Policy Institute in Cornell University’s Jeb E. Brooks School of Public Policy, the Cornell Bitcoin Club, the Human Rights Foundation and the Reynolds Foundation.
Researchers interviewed 25,880 people in 25 countries between December 16, 2024 to March 10, 2025, asking 125 individual questions.
This post When the Banks Don’t Work, Bitcoin Does: Cornell University’s Adoption Index first appeared on Bitcoin Magazine and is written by Mathew Di Salvo.
Bitcoin Magazine
South Africa’s Absa Becomes First Bank on the Continent to Custody Bitcoin: Report
South African bank Absa has become the first African lender to custody bitcoin, according to reports.
As reported first by Bloomberg on Friday, the Johannesburg-based lender will serve institutional clients, mostly by custodying bitcoin — but other digital assets will also be a part of the service.
Banks worldwide are integrating or offering bitcoin-related products and services. A number of U.S. and European banks have started offering crypto-related services by custodying assets for institutions.
JUST IN:
— Bitcoin Magazine (@BitcoinMagazine) October 2, 2026Absa has become the first African bank to offer Bitcoin custody
pic.twitter.com/JaDza3S7Ez
Rob Downes, head of digital assets at Absa’s corporate and investment banking unit, was quoted saying that while bitcoin was the biggest asset the bank would custody, others would follow.
Absa did not immediately respond to questions from Bitcoin Magazine.
The African continent has a large crypto-native base, with data firms frequently highlighting the high adoption — particularly in countries where currencies have been significantly debased.
In Chainalysis’s 2025 report, South Africa’s $36.0 billion in on-chain value made it second in Sub-Saharan Africa. Nigeria alone received $92.1 billion, nearly three times the total of second-place South Africa.
On the global index, South Africa ranked 30th for crypto adoption.
The character of its market is different from Nigeria‘s: it’s more institutional, with regulatory clarity resulting in hundreds of licenses being issued to VASPs and attracting professional investors and traditional finance.
BNY Mellon in 2022 became the first major U.S. bank to offer digital asset custody services. And this month, German multinational Deutsche Bank said it would debut a bitcoin custody service for European corporate and institutional clients later in 2026.
This post South Africa’s Absa Becomes First Bank on the Continent to Custody Bitcoin: Report first appeared on Bitcoin Magazine and is written by Mathew Di Salvo.
Bitcoin Magazine

Bitcoin Price Surges Above $87,000 on Softer-Than-Expected Jobs Data
The price of bitcoin surged above $87,000 on Friday morning in New York, buoyed by constant exchange-traded fund flows and a jobs report showing that unemployment in the U.S. had ticked up.
Bitcoin’s price recently stood at $85,990 after a 2% jump over a 24-hour period. Over the past week, it has also risen by more than 2%.
Nonfarm payrolls increased 29,000 last month after a downward revision to the prior two months, Bureau of Labor Statistics data showed Friday.
JUST IN: Bitcoin jumps to $87,000 as U.S. Unemployment Rate comes in at 4.2%, higher than expectations
— Bitcoin Magazine (@BitcoinMagazine) October 2, 2026pic.twitter.com/jqtU8Q9zsd
Weaker-than-expected jobs data can give a lift to riskier assets like bitcoin and stocks, whose prices tend to swing more sharply.
A softer labor market typically means less consumer spending, which eases pressure on prices. That could make the Federal Reserve less inclined to keep raising interest rates to fight inflation.
Many economists and politicians have said the U.S. is in the midst of an affordability crisis, and the topic is a hot one ahead of the November midterm elections.
The Federal Reserve’s new chair, Kevin Warsh, has said that prices in the world’s biggest economy are too high and that the central bank is fully focused on making life more affordable again.
Bitcoin investors shrugged off the central bank’s interest rate hike in September, climbing on the news.
The largest cryptocurrency started rallying in August on news that the U.S. Treasury Department said it would more than double the size of its government debt repurchases. The coin had its best run in three years and third best August ever.
The coin’s price has benefited from the so-called debasement trade: when investors buy certain assets to hedge against currency being devalued. The dollar slid in value in August.
It continued to have a good September, rising nearly 6% over a 30-day period.
October has historically delivered good returns for bitcoin investors, with traders dubbing the phenomenon “Uptober.”
This post Bitcoin Price Surges Above $87,000 on Softer-Than-Expected Jobs Data first appeared on Bitcoin Magazine and is written by Mathew Di Salvo.
Bitcoin Magazine
Impacts of Daily Dividends on Digital Credit
In May 2026, Strive rebranded itself as “The Daily Dividend Company,” then moved SATA to daily cash dividends beginning June 16. Strategy has now pushed the same idea into its own digital credit engine. On September 24, its board proposed moving STRC, STRF, STRK and STRD to daily dividends, subject to shareholder approval at an October 28 special meeting. The proposal keeps the annual dividend economics unchanged and changes the cadence of cash payments.
STRC spent much of the summer below its $100 stated amount even as Strategy raised its dividend rate to 12% and deployed more than $1 billion buying back STRC. The move to daily dividends by Strategy could be seen as the latest attempt to make the security more attractive and help it trade near par.
Now that the overton window has fully shifted in favor of digital credit paying daily dividends, we should take a look at the actual impacts of daily dividends.
Daily Dividends Fit Onchain Finance
Digital credit is increasingly becoming an input for other financial products—so called “digital money” or “digital yield” products. Strategy estimated in mid-May that more than $440 million of STRC exposure had moved into DeFi through stablecoins, tokenized securities, yield products and other structures.
However, there is a cash flow mismatch. Crypto products commonly accrue and distribute yield at high frequency. A security that pays monthly or twice monthly forces the product sitting on top of it to bridge the period between economic accrual and actual cash receipt.
Daily dividends compress that gap to one day. The protocol, fund or issuer receives cash from the underlying asset at almost the same cadence that users expect to receive yield. That simplifies liquidity management and reduces the cash needed between dividend dates. This is much more impactful to a financial product funding daily distributions or redemptions than to a long term investor focused on total return. The crypto-heavy setting of the “Layer 3” products on top of digital credit raises the attractiveness of daily dividends.
Daily Dividends Are Primarily a Retail Feature
For investors focused strictly on total return, dividend payment frequency makes little difference in underlying economic value. The asset’s price accrues between distribution dates and adjusts post-payment, meaning annual, quarterly, monthly, and daily payouts produce comparable long-term results.
The true advantage of daily dividends lies in product psychology and user experience. Cash arriving every day provides immediate visibility and an engaging feedback loop. Investors can spend, withdraw, or automatically reinvest the payout while leaving their principal position intact, turning an abstract yield metric into tangible recurring cash flow.
This dynamic mirrors the strategy of Realty Income, which built a massive retail follower base by branding itself as “The Monthly Dividend Company.” As a member of the S&P 500 Dividend Aristocrats Index, Realty Income has paid and raised dividends for 31 consecutive years.
Daily dividends on digital credit extends this product concept even further: SATA pairs frequent daily payouts with a target price near $100 and a double-digit yield.
While institutional investors prioritize yield spreads, liquidity, tax structure, and balance sheet coverage, daily payments offer their strongest appeal to retail buyers. If the overarching objective is to raise capital to purchase Bitcoin, optimizing security design for retail investor preferences is the most effective approach.
Options Get Cleaner Too
Daily dividends also change options mechanics. STRC currently pays $0.50 twice monthly. SATA pays roughly five cents each business day. Larger dividend events create larger discrete adjustments in the underlying price, which affects option pricing and early exercise decisions. Daily payments spread the same annual cash flow across much smaller adjustments.
The total value of dividends over an option’s life is a key economic input. The more interesting effect comes from the price stability created by daily dividends. If daily dividends, variable rates and active par management keep SATA and STRC trading in narrower ranges, realized volatility should fall. Implied volatility can follow as the market gains confidence in that behavior.
The Biggest Test
The real test is whether daily dividends increase demand enough to eventually lower the required yield.
If investors consistently support SATA near the top of its target range, Strive can theoretically reduce the dividend rate while attempting to keep SATA near par. Success would show that a Bitcoin company can issue permanent preferred capital, manage it around a stable price, and adjust its yield with market demand. The benefit of the variable rate preferreds was, from inception, the eventual opportunity to lower the rate and reduce the cost of capital without upsetting price stability. In comparison, fixed rate credit locks in fixed rate forever.
Conclusion
Strategy adopting daily dividends would move the feature from a SATA differentiator toward a digital credit category standard. The annual economics barely change but the retail appeal and crypto composability become meaningful improvements.
This post Impacts of Daily Dividends on Digital Credit first appeared on Bitcoin Magazine and is written by Allard Peng.
CryptoSlate
The Independent Community Bankers of America sued the OCC in federal court in Washington on Oct. 2, two weeks after the agency approved Agora National Trust Bank, Catena Trust Bank and Bastion Platforms.
American Banker reported that the complaint asked the court to vacate the OCC's national trust bank rule and Interpretive Letter 1176. It argued the agency exceeded its authority by widening limited-purpose trust charters for fintech and crypto firms.
ICBA says the OCC has approved or conditionally approved 21 trust banks, 13 of them tied to crypto.
Banks lost the applicant-by-applicant fight against crypto firms
Banking groups objected company by company, and the OCC kept approving. Five crypto-linked national trust applications, including BitGo, Fidelity Digital Assets, First National Digital Currency Bank, Paxos and Ripple-linked applicants, won decisions in December 2025.
Bridge, National Digital Trust and Foris DAX, the parent of Crypto.com, followed in February, Coinbase in April and Laser Digital in May. Agora, Catena and Bastion arrived Sept. 18, and several of these approvals are conditional or preliminary.
The OCC finalized its national trust bank rule in February, effective April 1. It replaced the phrase “fiduciary activities” with the statute's broader wording, “the operations of a trust company and activities related thereto.”
The OCC says the language leaves its chartering authority intact and that national trust banks have long performed some nonfiduciary work, including custody. It points to 12 U.S.C. 24(Seventh) as authority for nonfiduciary custody and related activities.
ICBA's complaint reads the same rule as stretching a limited-purpose trust charter to cover non-depository, non-fiduciary crypto businesses under a lighter framework than insured banks face.
An objection to Coinbase or Ripple asks the agency to deny one applicant. A suit over the rule asks a judge to decide the scope of authority behind every charter that relies on it.
The OCC said a court would decide
In the February rule, the OCC cited the Supreme Court's Loper Bright decision. It said that when a party with standing disputes whether the National Bank Act authorizes a national trust bank charter, courts must exercise independent judgment on the statutory question.
That is the review ICBA now requests. The OCC spent 2026 approving crypto trust charters while on record that a court would settle their legal basis.
Exposure varies with business plan, with plain fiduciary custody furthest from the dispute and nonfiduciary custody, stablecoin issuance and reserves, payments, settlement, conversion, and execution nearest to it.
Coinbase's approved plan covers digital asset custody as a fiduciary plus transactional services tied to custodied assets, and the OCC defended it as trust-company operations or related activities under fiduciary authority and 24(Seventh).
Agora plans dollar-backed stablecoin issuance, reserve maintenance, nonfiduciary custody, and payment and settlement services. Catena combines custody, investment management, and trust services with conversion, clearing, and execution, and Bastion offers white-label stablecoin issuance, custodial wallets, conversion, and issuer services.
Foris DAX's plan couples custody with trade settlement and staking, and Bridge's initial approval covers custody, stablecoin issuance and orchestration, and reserve management.
ICBA seeks vacatur plus declaratory and injunctive relief. What happens to existing charters depends on the order a judge writes, including how it treats final approvals, conditional approvals and activities with independent statutory support.
The OCC said in August that it had received 40 de novo charter applications over about 18 months, and Comptroller Jonathan Gould said 23 of them involved digital assets.
The agency's digital-asset licensing page lists pending applicants, including zerohash, Dakota National Trust Bank, Payward (Kraken), Lorum National Trust Bank, EDX Trust and PAYO Digital Bank.
Whether the OCC keeps processing those applications on the same terms while the court weighs the rule is the open question for each of them.
Where the court crypto test leads
If the court sides with the OCC, the national trust bank becomes a firmer federal route for crypto custody and stablecoin infrastructure.
JPMorgan sees $500 billion by 2028, Coinbase's model centers on $1.2 trillion by the end of 2028, and Standard Chartered expects $2 trillion by then. Citi's 2030 cases run from $1.9 trillion in its base scenario to $4 trillion in its most optimistic one.
FDIC-insured banks held about $20.7 trillion in deposits in the second quarter, so $500 billion to $2 trillion equals roughly 2.4% to 9.7% of that base. For Bitcoin, a win would deepen bank-supervised custody and settlement-linked services for institutions.
If the court vacates or narrows the rule or the letter, the effect lands hardest on plans built around stablecoin issuance, reserves, nonfiduciary custody, conversion, payments and settlement.
Those firms might restructure activities into affiliates, state trust companies or partner-bank arrangements, and pending charters could face tougher review. Bitcoin custody itself could stay available, with the federal wrapper less flexible around adjacent services such as conversion, execution, settlement, staking-like services and collateral movement.
The San Francisco Fed estimates stablecoin issuers' Treasury demand could roughly double to about $400 billion by 2030, which gives the answer weight beyond crypto.
How much nonfiduciary market infrastructure can sit inside a national trust bank is now a question for a federal judge, which is where the OCC said it would land.
The post Bankers sue to overturn OCC trust-bank rule used by crypto firms appeared first on CryptoSlate.
Companies can own a mountain of US government debt without betting that bond prices will rise. Hedge funds buy Treasury securities and sell futures against them to collect a small pricing gap, borrowing most of the purchase money to make the return worthwhile.
The government gets another buyer, whose interest lasts as long as the trade pays.
The catch is that the loan can expire tomorrow while the trade needs longer to pay off. The government's ability to repay its debt doesn't solve the fund's need to repay its lender.
This is the Treasury cash-futures basis trade, and the sums involved are large enough to reach well beyond the bond desk. Morgan Stanley estimated positions had fallen 20% this year to about $1.2 trillion, according to Sept. 24 reports.
The bank hadn't found evidence of broad basis-related market stress at that point, so a smaller trade wasn't automatically a trade that would blow up.
Hedge funds love small profits when it's someone else's money
You can buy a Treasury security outright, or trade a futures contract that sets terms now for a transaction completed later. The contract specifies which securities can be delivered against it, linking their prices without making them identical.
When futures are expensive enough relative to an eligible bond, the fund buys the bond and sells the futures. Investors wanting bond-market exposure through contracts supply the other side, leaving the fund to hold the actual securities.
Selling the futures is the hedge: if bond prices fall, that short position can earn money that offsets much of the loss on the bond. The fund aims to collect the pricing gap as the contract approaches delivery, while limiting its exposure to the market's overall direction.
To pay for the bond, it uses repo, short for repurchase agreement. The fund sells the security for cash and agrees to buy it back later at a slightly higher price, which, economically speaking, looks like a loan secured by the bond.
Overnight repo means the fund must renew or replace the financing to keep the position.
Consider an illustrative $100 million position earning 0.2% annually from the strategy, net of assumed financing and trading costs. That's $200,000, which becomes a 4% return if the fund has committed only $5 million of its own capital.
But if borrowing costs on the other $95 million increase by 0.2% for the year, the extra bill is $190,000. Almost the entire expected profit has gone to the lender, without the government defaulting on anything.
The Office of Financial Research includes the cost of futures margin and the seller's options over which eligible bond to deliver and when. Calculating the return means valuing those delivery rights and accounting for financing and margin costs.
If that calculation stops looking attractive, a fund can simply stop replacing positions as they expire. Professional investors don't need a crisis to find something better to do with their money.
Being right doesn't pay today's bill
The hedge may work, but the fund can't afford the payments needed to keep it open.
Suppose the bond gains value and the short futures position loses a similar amount. The futures account can require a cash payment against that loss, known as variation margin, while the bond's gain is still tied up in a security.
The fund has to get dollars out of that asset or find them elsewhere before the payment is due.
Crypto traders with gains on one exchange and a liquidation approaching on another will recognize the problem: money in the wrong account won't meet the payment, and explaining the hedge won't extend the deadline.
The repo lender can also require more money. If it lends $98 against $100 of bonds, the fund supplies the other $2, a 2% haircut. If that haircut becomes 4%, the fund must supply twice as much of its own money against the same collateral, even before considering futures margin.
If many funds have to close positions at the same time, they sell bonds to repay loans and buy futures to close their shorts. Those trades can push bond prices down relative to futures, hurting funds still holding the same positions and making their own exits more expensive.
That forced selling is different from letting trades expire without replacing them, although both reduce outstanding positions. The reported contraction alone won't tell you which is happening.
Federal Reserve researchers estimated $830 billion of basis positions for September 2025, in research published this June. That and Morgan Stanley's newer estimate use different approaches, so treating them as consecutive readings would manufacture a comparison the data doesn't support.
Total hedge-fund Treasury holdings also include other strategies, as do their short futures positions.
Someone still has to own the Treasury bonds
Fewer trades dependent on tomorrow's loan can make the market less fragile, provided the next owners bring financing they can keep through a difficult week. Investors buying with committed capital don't face the same daily negotiation with a repo lender.
Those buyers may want a better price because they're buying the bond for its income. Cheaper bonds offer higher yields, attracting replacement demand while potentially making new government borrowing more expensive.
Dealers can hold bonds while they find buyers, but their capacity also costs money and has limits. An orderly transfer can therefore leave Washington paying more without the market breaking down.
Higher repo rates or larger haircuts become more troubling if funds must sell into a market with few willing buyers. Those financing terms and the prices sellers can obtain say more about stress than a position total alone.
The same restraint applies to Bitcoin, as hedge funds' broader balance sheets show why one strategy can't stand in for everything those firms do.
Connecting Treasury trouble to crypto requires evidence that the institutions involved are selling crypto or withdrawing financing, rather than assuming every cash need ends with a Bitcoin sale.
Borrowed money makes these funds willing to own bonds for a return that would otherwise be too small to bother with.
When that calculation stops working, replacing them can reduce the market's dependence on overnight loans, but the next owner may want a higher yield to take the debt off their hands.
The post Hedge funds built a $1.2 trillion Treasury trade on money they have to keep borrowing appeared first on CryptoSlate.
The European Securities and Markets Authority wants to extend Europe’s restrictions on non-compliant stablecoins beyond trading to the services that let customers keep and move them. If adopted as proposed, the change would remove the option of leaving such tokens with a licensed custodian after their trading pairs disappear.
In its September 30, 2026 response to a review of the EU’s Markets in Crypto-Assets regulation (MiCA), ESMA asks the European Commission to prohibit every licensable crypto-asset service involving stablecoins that fail the regulation’s applicable requirements. Custody and transfers fall within that service list. The consequence would reach existing holders who have stopped trading, as well as customers seeking to buy.
That is a further step from the regulator’s January 2025 approach, which said mere custody and transfer should remain possible. It could give compliant tokens a wider advantage in European distribution, but neither a forced conversion timetable nor a global demand shift follows from the proposal.
The permission left after delisting
ESMA’s January 17, 2025 statement distinguished services that offered non-compliant stablecoins to the public or admitted them to trading from simply holding or transferring them. Platforms were expected to stop making the tokens available for trading, and other services had to cease where they constituted an offer to the public.
Under that earlier transition, acquisition restrictions were expected by the end of January 2025, with temporary sell-only services through the end of the quarter.
For an investor, the custody distinction mattered. Losing access to a trading pair did not necessarily mean losing the service that safeguarded an existing balance or enabled its withdrawal. ESMA acknowledged that investors retaining those holdings could face worse execution conditions, even while custody and transfer remained possible.
A historical example shows the distinction. In its March 3, 2025 reporting, CryptoSlate said Binance planned to remove nine tokens’ trading pairs for European Economic Area users by March 31 while keeping deposits, withdrawals, conversions and custody available. This was the exchange’s announced approach in March 2025.
The September response would replace the activity-by-activity distinction with a broader asset-compliance test. ESMA argues that the lack of a clear prohibition creates disparities between compliant and non-compliant issuers and facilitates regulatory arbitrage.
The reach comes from MiCA’s Article 3 definitions. Custody includes safekeeping or controlling clients’ crypto-assets or their means of access, including private keys. Transfers cover moving assets on a client’s behalf from one ledger address or account to another. Both are expressly listed services, with Article 82 setting client-agreement requirements for transfers.
Provider permissions are also separate from token compliance. Article 59 requires authorization as a crypto-asset service provider, or qualifying permissions for specified financial entities, and says authorizations must identify the services permitted. A license for a provider does not by itself settle whether a particular stablecoin can be serviced.
An existing holder would therefore not avoid the proposed restriction by deciding never to trade again. If the wording became law without an exception, the custodian’s continued safekeeping would itself be covered.
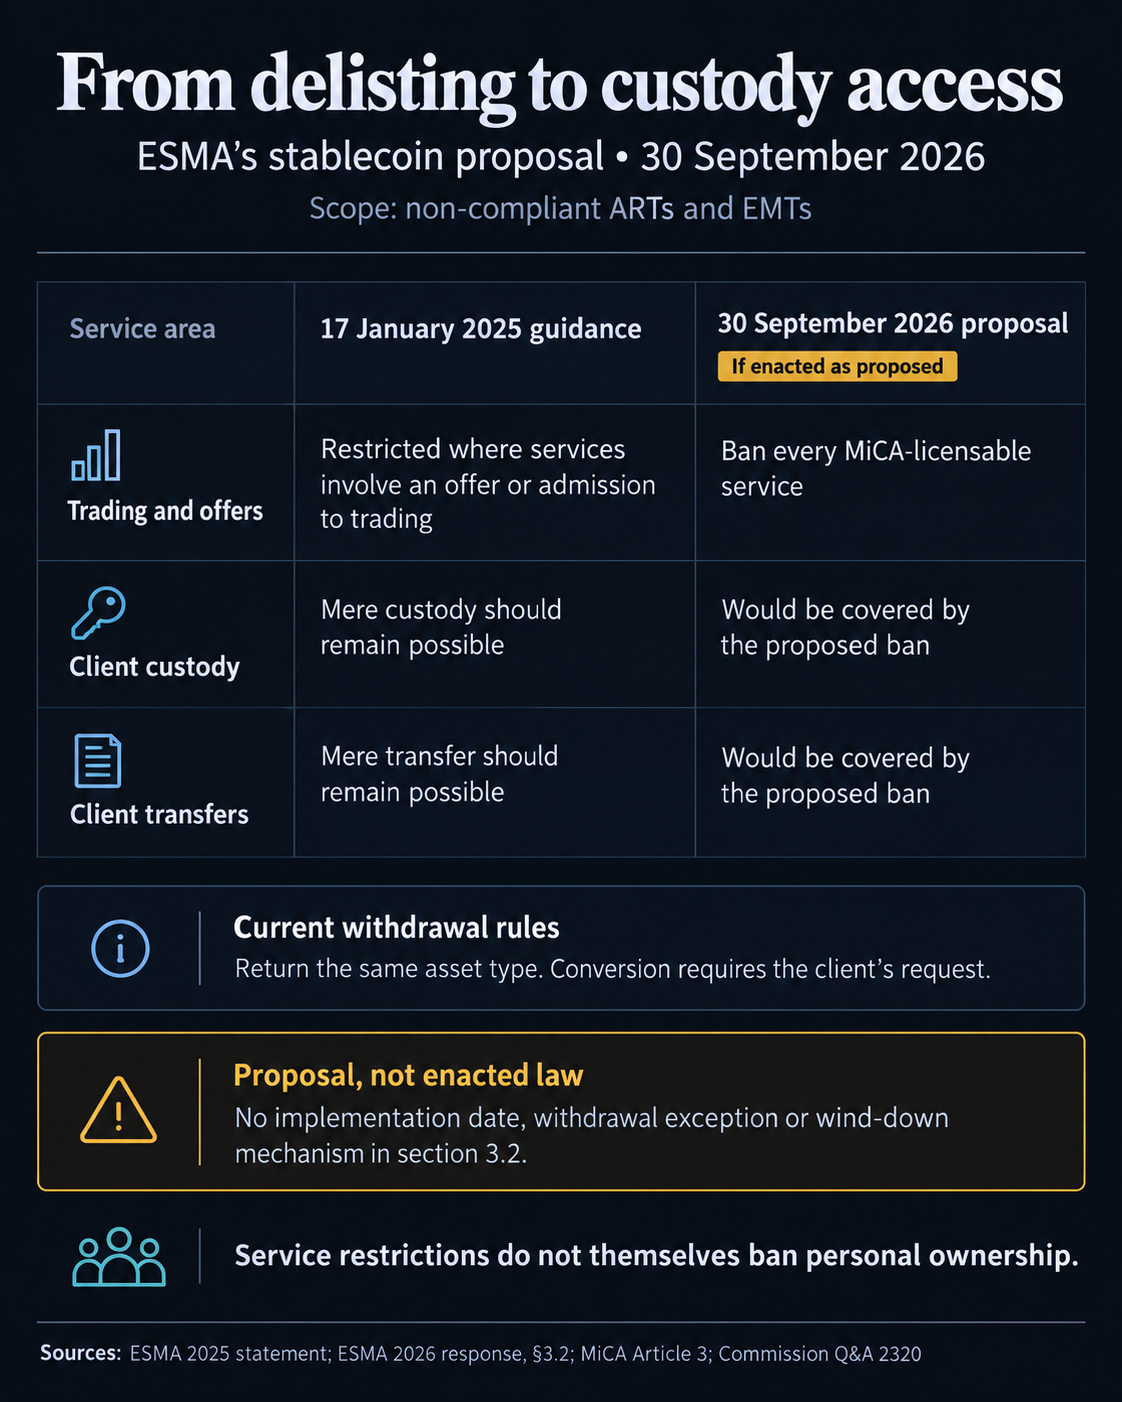
ESMA’s response is a policy submission, not an enacted amendment. The Commission’s consultation had a September 30 deadline, and its page says the resulting review report may, if warranted, be accompanied by a legislative proposal.
Section 3.2 of ESMA’s submission gives no implementation date, withdrawal exception or wind-down mechanism. That omission matters because ending custody requires a way to return assets that a provider already controls, while the proposed prohibition also reaches transfer services.
Current custody rules provide a relevant starting point. Article 75 requires procedures to return clients’ crypto-assets or their means of access as soon as possible. Client assets must also be segregated from the provider’s own holdings.
An answer from the European Commission via ESMA, dated February 18, 2026, further says the assets returned must be the same type held when the client requests withdrawal. A provider may offer conversion into fiat or another crypto-asset, but the client must request it at withdrawal and the provider must have permission for the additional service.
That existing interpretation does not settle how a future blanket service restriction would handle exits. It does explain why delisting, termination of custody and compulsory conversion cannot be treated as interchangeable outcomes. Legislators would need to resolve how any new prohibition fits the obligation to return assets.
The stablecoin proposal targets those professional services. It does not itself ban personal ownership, order tokens frozen or prescribe compulsory conversion. A holder’s ability to retain an asset and a licensed business’s ability to hold or move it for that customer are different questions.
Trading shares do not measure custody exposure
The earlier delistings show how trading can change at European-facing venues without a comparable shift across a wider market.
In a July 2026 paper, Nicola Borri and Kirill Shakhnov examine trading in the dollar-linked tokens USDT and USDC across 14 exchanges selected from CoinMarketCap’s top 30 centralized venues. Their daily pair-volume data from CryptoCompare run from January 1, 2024, through December 7, 2025.
The authors classify Bitstamp, Coinbase, Gemini and Kraken as “regulated-facing” because their Similarweb EU audience shares exceed 10%; all four also have US audience shares above 10%. The other 10 venues are classified as globally oriented, including Binance despite its EEA delistings. The audience proxy identifies neither individual EU-resident trades nor a clean division of legal exposure.
Around the study’s April 1, 2025 event date, the authors estimate that USDC’s share of combined USDT and USDC trading rose by about six percentage points on regulated-facing exchanges relative to global exchanges. The estimate covers a 30-day window and uses smoothed, detrended data; it measures a relative trading shift across venue groups.
The authors estimate USDT trading volume fell about 20% on regulated-facing exchanges relative to global venues, while the USDC-volume estimate was not statistically significant. USDC gained share primarily because USDT trading contracted in that comparison, not because the study established a corresponding expansion in USDC trading.
Aggregate USDC-to-USDT trading-volume ratios across the sample stayed nearly flat around the event. That describes sampled exchange turnover, not worldwide demand or EU custodial balances. The legal documents and study provide no total for the holdings that a future custody restriction could affect.
If the proposal became law in its present form, compliant tokens could retain access to regulated custody and transfer channels that non-compliant tokens would lose. For customers who want a provider to safeguard and move a dollar-linked balance, compliance could affect the usefulness of that asset beyond the availability of a trading pair.
The next consequential text would be a legislative amendment, particularly its scope, application date and treatment of existing balances. How it reconciles an end to custody with the return of clients’ assets would determine whether and how existing holders must leave regulated services.
The post ESMA proposes ending EU custody and transfer services for non-compliant stablecoins appeared first on CryptoSlate.
Six US banks have failed in 2026 so far, which is one more than in 2023 and enough to make another banking-crisis headline practically write itself.
But before we start reliving Silicon Valley Bank, it's worth looking at what those six banks actually held: about $1.43 billion in combined assets, compared with roughly $552.54 billion at the banks that failed in 2023, according to historical numbers from the Federal Deposit Insurance Corporation (FDIC).
Counting each bank as one gives you a perfectly accurate number and a pretty lousy sense of scale. This year's total includes a lender with $3.73 million in assets, which gets the same vote in the tally as a bank the size of SVB.
Meanwhile, FDIC's latest industry assessment shows stronger profits and fewer banks on its problem list. That doesn't mean the six failures were harmless, or that every surviving bank is doing well, but anyone selling a 2023 rerun has some explaining to do.
Nano Banc's Sept. 25 closure brought the count to six and supplied the largest failure of the year so far. The Irvine, California, lender reported $736 million in assets, and the FDIC estimated a $114 million cost to its Deposit Insurance Fund.
Someone will bear that loss, but a bill attached to one failed bank doesn't mean the rest of banking is about to follow.
Six is bigger than five (until you look inside)
The FDIC's annual totals record four failures in 2020, none in 2021 or 2022, five in 2023, and two apiece in 2024 and 2025. Through Sept. 25, this year had beaten every annual count in the 2020s, which sounds much, much worse than it actually is.
Consider Kentland Federal Savings and Loan Association, which the FDIC described as the country's smallest standalone bank when it closed. Its $3.73 million in assets counts for exactly as much as Silicon Valley Bank in a chart of bank failures, because that chart counts only institutions.
Asking it to measure financial trouble gives a very small bank a very large role.
| Failed institution | Closure date in 2026 | Reported assets |
|---|---|---|
| Metropolitan Capital Bank & Trust | Jan. 30 | $261.10 million |
| Community Bank and Trust – West Georgia | May 1 | $288 million |
| Kentland Federal Savings and Loan Association | July 10 | $3.73 million |
| Small Business Bank | July 17 | $73 million |
| Tioga-Franklin Savings Bank | Aug. 21 | $68 million |
| Nano Banc | Sept. 25 | $736 million |
| Combined | Through Sept. 25 | $1.43 billion |
Sources: FDIC failure announcements and annual summary. The unrounded sum is $1,429.83 million, using numbers from different reporting dates cited around the closures, rather than a single-date balance sheet or an estimate of losses.
The $552.54 billion number for 2023 and this year's $1.43 billion come from balance sheets with different reporting dates, so we can't turn them into an exact ratio. Luckily, we don't need one to see that the amounts belong in very different conversations, even if six is technically more than five.
The FDIC's problem-bank list adds another issue because it counts banks that are still operating, using their condition measured at a particular date. Banks get onto it when examiners assign one of the two weakest overall ratings for financial, operational, or managerial weaknesses, which is a more specific diagnosis than having an ugly week in the stock market.
The second-quarter assessment put 47 banks on that list as of June 30, down from 54 in March and 60 at the end of 2025. They made up about 1.1% of insured institutions, within the FDIC's normal 1% to 2% range outside a crisis.
That doesn't give the industry a certificate of perfect health, because a bank can leave the list by failing just as it can leave by recovering or merging. The failure count adds up closures over the year, while the problem list takes a snapshot of institutions still open, so it's not mysterious for one to get longer while the other gets shorter.
The dates also prevent us from doing some tempting mental math. Four of this year's six failures came in July through September, beyond the June snapshot, but subtracting four from 47 won't tell us how many troubled banks are left.
We don't know every bank that entered or left the list in between, and the published totals don't identify them.
Some banks were broken long before the headline
The records behind these closures describe institutions that had been struggling for quite a while. Illinois regulators said Metropolitan Capital had impaired capital and unsafe conditions, while Kansas officials described years of financial trouble at Small Business Bank.
At the Kansas lender, continuing operating losses ate through its capital until it became critically undercapitalized. Capital is the cushion that absorbs losses before creditors have to bear them, and a bank that keeps losing money can burn through that cushion while the rest of the industry has an excellent quarter.
Someone else's profits don't refill your bank's capital, and Kentland reached a similar endpoint, with the Office of the Comptroller of the Currency finding that unsafe practices had depleted its assets and earnings and that there was no reasonable prospect of restoring adequate capital.
Tioga-Franklin had its own FDIC consent order from earlier, covering weaknesses in management and capital planning, as well as liquidity and credit administration. It consented without admitting or denying the charges, so that record tells us supervisors had identified problems, without settling exactly what caused its August failure.
We know less about the full diagnosis at Community Bank and Trust – West Georgia. The state's closure notice explains the authority to take possession without supplying a detailed financial account, and the FDIC inspector general has a material loss review underway.
Giving it the same cause as the other failures would make the narrative tidier than the evidence allows.
Nano also had a lengthy regulatory history. California Business and Consumer Services Secretary Rohit Chopra described repeated violations and earlier action against mismanagement, while pointing to its large level of uninsured deposits.
Customers with money above the insurance limit have more to lose if a bank fails, which gives them a stronger reason to leave when they doubt it can pay them back.
You can take all of that seriously without treating the six banks as a chain of falling dominoes. The records describe unresolved weaknesses at individual lenders, but don't establish a common funding shock or show one closure bringing down the next.
Putting them in the same table doesn't create a financial connection.
The broader numbers don't support the small-bank-doom argument either. In the FDIC's second-quarter results, community banks earned 8.2% more than in the preceding quarter, while industry-wide profit reached $90.1 billion.
The regulator described capital and liquidity as strong, leaving plenty of room for a few badly damaged banks in an industry making more money.
The losses are real even when the apocalypse isn't
None of this makes a failed bank a non-event for the people caught in it.
Nano's estimated $114 million insurance-fund cost is a real financial consequence, even though Sunwest Bank agreed to take over substantially all its deposits and buy about $476 million of its assets.
The FDIC retained the rest for disposal and said customers could keep using checks and cards through the closure weekend.
Those customers could keep paying their bills while the receivership faced a loss, because access to deposits and the final cost of resolving a bank aren't the same thing.
The FDIC's estimate can move as it sells retained assets, and the six banks' combined $1.43 billion in assets shouldn't be treated as money that vanished. Loans can still be repaid, and securities can still be sold when their former owner has failed.
Tioga-Franklin's buyer assumed all deposits, while the West Georgia transaction transferred substantially all insured deposits, excluding certain brokered accounts.
Georgia officials said customers above the insurance limit would receive notices explaining their rights as uninsured depositors, which is a pretty different experience from being told your account now has another bank's name on it.
CryptoSlate's coverage of the year's first bank failure examined broader banking risks, but the road from a failed lender to crypto still needs spelling out. Whose money was at the bank, and what could they no longer do when it closed?
In 2023, Circle had $3.3 billion of USDC reserves at Silicon Valley Bank, giving stablecoin holders a direct reason to worry about access to part of their tokens' backing. The Federal Reserve's analysis of that failure follows that connection from bank distress into stablecoins.
This year's tally doesn't provide an equivalent connection on its own. Disclosed crypto deposits at a failed lender, or the loss of banking services needed to process customer payments, would give us something concrete to examine.
Another tick in the failure column can't tell us whose reserves are trapped or whose business has lost access to cash.
There are good reasons to keep watching the banks, including whether withdrawals spread across institutions and whether lenders have more trouble obtaining funding. The assets on the problem-bank list deserve attention too, because a shorter list can still contain more money at risk.
None of those possibilities gets answered by comparing six with five.
The case for another 2023 has to explain how trouble is spreading through the banks that are still open. Until the evidence shows that, six failed lenders tell us that six lenders couldn't keep going, and turning that into a verdict on the whole system asks a headcount to do a balance sheet's job.
The post Six US banks have failed in 2026 but the numbers look nothing like 2023 appeared first on CryptoSlate.
Leveraged funds’ reported Bitcoin futures shorts fell by about 5,300 BTC-equivalent in the week to Sept. 29, narrowing their net short even as their aggregate long exposure shrank.
The Commodity Futures Trading Commission’s latest futures-only figures, released in the Oct. 2 reporting cycle, cover CME standard and micro Bitcoin futures plus Coinbase Derivatives’ nano Bitcoin and nano perpetual-style futures. The totals convert different contract sizes into BTC-equivalent exposure; they describe futures positions, not transfers of physical bitcoin.
Compared with Sept. 22 positions, the funds’ reported shorts fell 5,299.69 BTC-equivalent and longs fell 908.99 BTC-equivalent. Their net short consequently narrowed by 4,390.70 BTC-equivalent, from 40,110.83 to 35,720.13. Their combined short exposure still exceeded their longs. These long and short columns exclude separately recorded, offsetting spread positions.
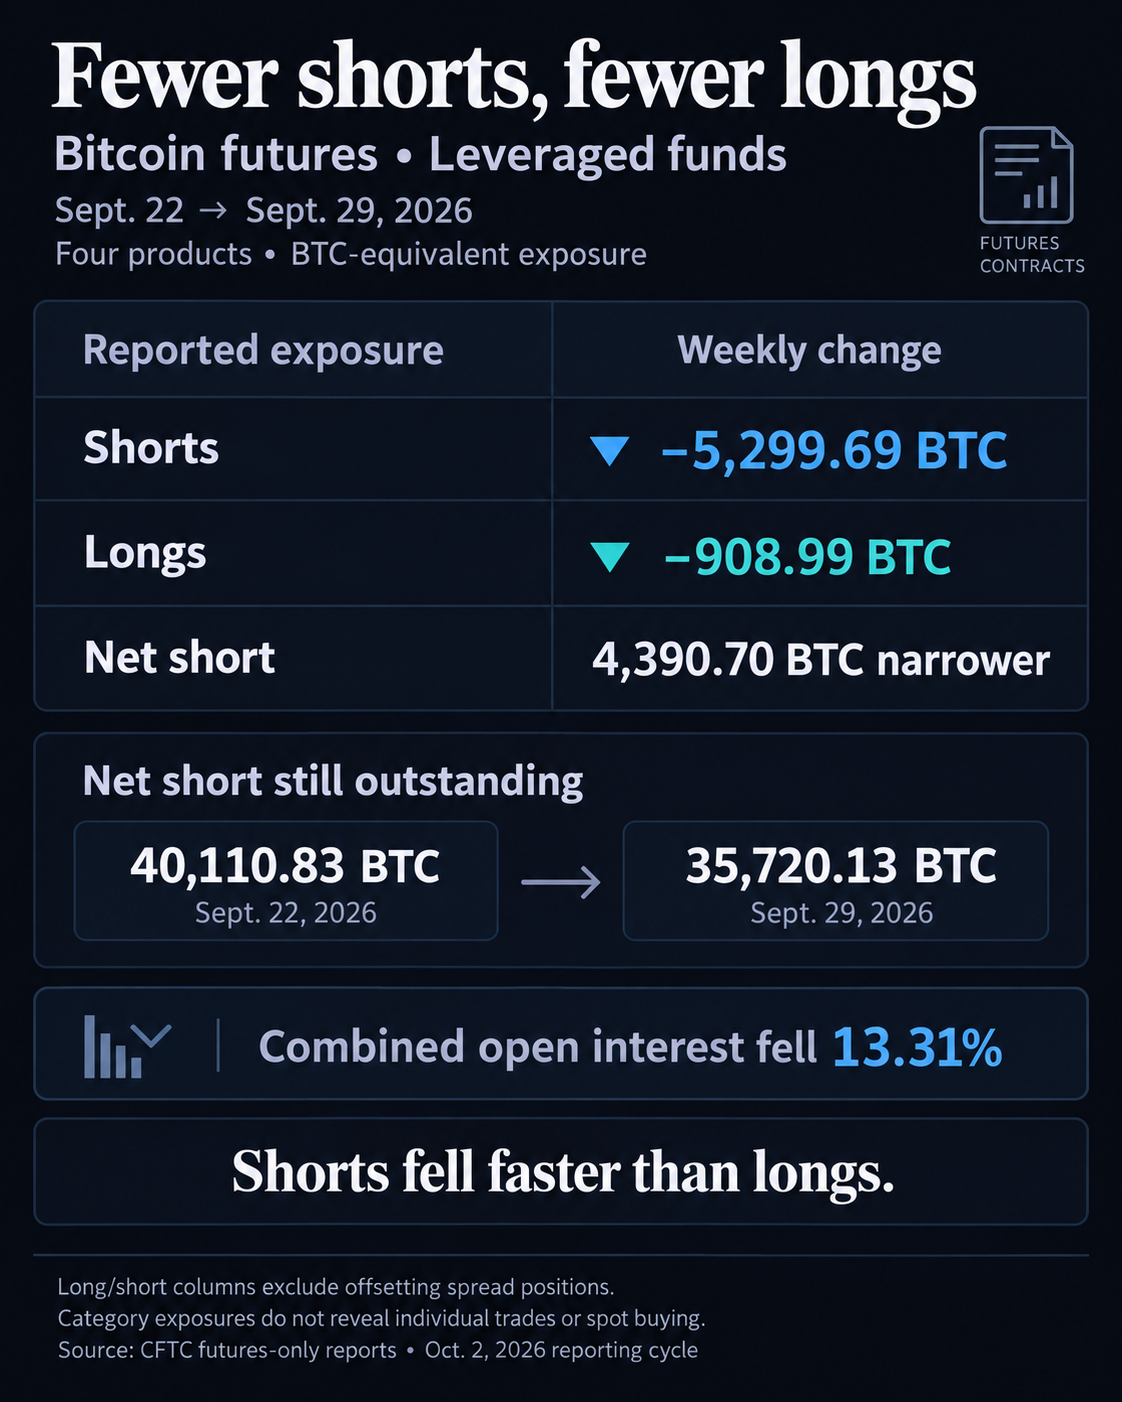
A better net figure can result from shrinking positions on both sides when shorts fall faster. In this snapshot, aggregate futures long exposure did not expand.
The individual products did not move uniformly. Standard CME futures accounted for 4,310 BTC-equivalent of the reduction in reported shorts, while their leveraged-fund longs increased 1,175 BTC-equivalent. Longs fell in CME micro futures and both Coinbase products, more than offsetting that increase.
The standard-CME move reversed the widening of net shorts in the Sept. 22 snapshot. That earlier report covered standard CME alone; the latest totals include all four products.
Asset managers’ net long across the four products increased 2,137.90 BTC-equivalent to 18,069.10. Their longs rose 573.10 BTC-equivalent, while shorts fell 1,564.80 BTC-equivalent. Most of their stronger net position therefore also came from fewer reported shorts.
Combined open interest, the outstanding futures exposure across these markets, fell 13.31% to 103,343.14 BTC-equivalent from 119,208.26. The improvement in net positioning occurred alongside a contraction in the overall futures market measured here.
Smaller shorts do not establish spot demand
The separately recorded spreading positions represent offsetting positions. Leveraged funds’ spreading column also fell, by 11,231.11 BTC-equivalent. The 5,300 BTC-equivalent reduction covers the reported short column, excluding those spread legs.
The monthly CME micro expiry rule places September’s expiry on Sept. 25, between the two observations. That provides calendar context without proving that expiry or rolls caused the contraction. Classification changes can also affect category totals.
The CFTC groups traders by predominant business activity. Its Tuesday position reports do not reveal individual transactions or paired spot and ETF holdings. A futures short may be part of a hedge, so fewer shorts do not establish fresh spot buying or reduced bearish conviction.
The next release is scheduled for Oct. 9. It can show whether the category shift persists.
The post Leveraged funds’ Bitcoin futures shorts fall by 5,300 BTC-equivalent as longs shrink appeared first on CryptoSlate.
CryptoTicker.io
If you are holding VANRY at Kraken, you can currently neither sell nor withdraw the token there. Both VANRY trading pairs are set to “cancel only”, and withdrawals are blocked. Kraken has scheduled that block to run until December 10, 2026, 15:05 UTC. The withdrawal deadline of the delisting falls on the same day at 15:00 UTC. The block therefore ends five minutes after the deadline you would have to meet to stop your balance being sold off.
That makes every instruction you have read about this delisting unworkable for VANRY: selling is impossible, withdrawing is impossible, and doing nothing leads into forced liquidation. What remains is the paper trail. This piece shows how the three dates fit together, why the block does not originate with Kraken, what the Base token has to do with your balance, and which records you should set up now so that a loss in December can be evidenced at all.
Where VANRY stands on Kraken: cancel only, a price of zero, withdrawals blocked
“Cancel only” is a trading state that exchanges set ahead of a delisting. It means existing orders can only be cancelled and new ones can no longer be placed. For VANRY this applies at Kraken in both the euro and the dollar pair. Both pairs are in that state on October 4, the last quoted price in the euro pair stands at zero, and turnover over the past 24 hours is zero as well. A sale there is not merely unattractive, it is technically ruled out.
That is not an isolated case at Kraken but a pattern running through the entire delisting cycle. How many trading pairs sit in that state there at the same time, and how to spot it for your own coin, we broke down at the end of September in a separate piece on blocked trading pairs at Kraken. For VANRY a second block now comes on top, and it is the more expensive of the two.
The three dates of the Kraken delisting: September 11, December 10 and the liquidation window
Kraken announced the delisting in August and names three cut-off dates in its notice for 21 assets, VANRY among them. Deposits and trading were switched off on September 11, 2026 at 14:00 UTC. Withdrawals close on December 10, 2026 at 15:00 UTC. Remaining balances will be liquidated automatically between December 14 and December 18, 2026. Besides VANRY this affects XTER, IR, GAIA, SCA, BNC, SBR, RBC, MIR, JUNO, HDX, ACA, MULTI, RIZE, EPT, MAT, CQT, CXT, BKS, VULT and M.
The exchange's instruction to its customers is worded unambiguously in this Kraken delisting notice: anyone wanting to keep their assets should withdraw them before December 10. We already set out the deadlines and the affected assets at the beginning of September, when only the trading halt was tangible; that overview sits in our piece on Kraken delisting 21 tokens. What was not foreseeable then: for one of those 21 assets, the instruction to withdraw leads nowhere.
In practical terms that means the reliability of a trading venue only shows itself in what happens when a project switches off its contracts. Which houses in Germany operate under which supervision, and how they are set up for deposits and withdrawals, is shown by our crypto exchange comparison. For your VANRY balance, the choice of exchange changes nothing retroactively; for the next small-cap it very much does.
Five minutes apart: why the transfer halt outlasts the withdrawal deadline
Kraken keeps a separate status entry on VANRY titled “VANRY withdrawals on Ethereum blockchain halted”. The entry has been running since September 24 and carries December 10, 2026, 15:05 UTC as its end point. The withdrawal deadline of the delisting sits five minutes before that. As long as nothing about that scheduling changes, there is no moment in the whole window up to the deadline at which withdrawals would be open and a transfer out therefore possible.
Kraken supplies the reason itself: the VANRY team has halted all transfers on the chain, and as long as those transfers are dormant, withdrawals at Kraken remain unavailable. You can read the entry on Kraken's status page. Important for context: the block is a consequence of the chain side, not a decision by the exchange against its customers. That makes it no less effective, but it shifts the question of whom you need to address.
The chain in question is Ethereum, where the old VANRY contract sits. Anyone holding the token there holds it in a version that can no longer be moved.

Vanar has paused the legacy contracts on Ethereum and Polygon
The origin lies with the project. Vanar moved its token to the Base chain in August and September 2026. The swap window opened on August 11 and closed on September 10, 2026 at 13:00 UTC. In mid-September the project confirmed that the VANRY contracts on Ethereum and Polygon are paused and that trading runs exclusively via Base. The project's own chain, on which VANRY originally ran, began winding down on September 18, 2026; staking for that chain's validators was discontinued.
This sequence is the core of the problem. The swap window was already shut before the withdrawal deadlines of the large trading venues were reached. We described that gap in August, when it was still a matter of weeks on a calculator and not a block; the timeline sits in our piece on the VANRY migration to Base. By now the gap has turned into a closed route.
Two data sets, one ticker: the Base token is a different asset
Since the migration there are two VANRYs, and for your valuation that is decisive. CoinGecko lists two separate data sets: “Vanar” for the new token on Base and “Vanar Chain [OLD]” for the old version. The old data set shows a market capitalisation of zero on October 4, a price of $0.00034199, turnover of around $28 in 24 hours and exactly one recorded trading venue. The new token trades at $0.00068289, carries a market capitalisation of some $2.59 million and daily turnover of around $1.31 million.
That means: what sits in your account at Kraken is the dormant version. On that reading, this version is worth roughly half as much as the token traded on Base, and it has practically no market. An exchange does not credit you the new token automatically if it does not support the swap. Binance stated explicitly in its delisting notice that it would not accompany the swap plan and referred users to the project's own portal. For Kraken, a credit of the Base token has not been announced anywhere.
A second data set under the same ticker is not a cosmetic flaw in a database. It is the reason why a price you read somewhere need not be the price of your balance. Anyone estimating the value of their holding should therefore check which of the two data sets the display refers to.
Forced liquidation in December: what “minimal or nil” means for your proceeds
Kraken names the consequence itself, and unusually plainly. The delisting notice states that several of the affected assets have limited or inactive markets, which is why the proceeds of a liquidation could fall well below the last reference prices and in some cases will be “minimal or nil”. That wording comes from the exchange, not from us, and it is a warning, not a forecast.
Set beside the turnover figure of the old data set, what it means in practice becomes tangible: with daily turnover in the region of a few dozen dollars and a single recorded trading venue, there is no buyer for larger quantities who would pay a price anywhere near the display. The proceeds of a forced sale then depend not on the price but on whether anybody buys at all.
For the order of your steps, something uncomfortable but clear follows: you should not plan on good liquidation proceeds. Plan on a record with which you can claim the loss for tax purposes, and treat any proceeds as a bonus.

Documenting your holding: units, dates and price source for loss offsetting
A loss you cannot evidence does not exist for the tax office. And unlike a normal sale, a forced liquidation does not hand you a statement you can choose for yourself. That is why the documentation belongs in place now, not in December.
Five items belong in it: the number of units in your VANRY holding together with the date on which you established it; the acquisition date and acquisition price of every purchase; evidence that trading and withdrawals were blocked, meaning a dated record of the trading state and of the status entry; the exchange's notice with the three cut-off dates; and finally the liquidation statement, once it is available. An account statement from the exchange, saved as a file, usually covers the first two points.
Anyone who does not want to keep this by hand can run it through a tax tool that carries acquisition dates and holding periods per position and still shows a holding even once the exchange removes it from the display. Which providers map German acquisition data and holding periods we have put together in our comparison of crypto tax tools. What matters is less the provider than the timing: after the liquidation, a holding the exchange no longer displays can no longer be reconstructed.
Total loss and the holding period: the tax position in Germany
A forced sale by the exchange is a sale for tax purposes. For private investors in Germany, gains and losses from the sale of crypto assets fall under private disposals pursuant to section 23 of the Income Tax Act. The decisive element there is the one-year rule: if more than twelve months lie between acquisition and disposal, the result is disregarded, and that includes a loss.
From this follows a quirk that is often overlooked on long-standing positions. If you bought VANRY more than a year ago, a loss from the December liquidation is as a rule not usable for tax purposes, because the position has passed the holding period. If the purchase was less than a year ago, the loss counts within private disposals and can be offset there against gains in the same year; whatever remains goes into the loss carry-forward. Losses from this category do not travel into offsetting against shares or interest.
Because what counts here is the individual acquisition date and not the total holding, the schedule per purchase is the actual work. That is the point at which clean filing can decide over several hundred euros. Binding advice on your own case comes only from a tax adviser, not from an article.
Asking Kraken support for a migration credit: what to put in the request
The second route open to you is a request to the exchange's support. That is neither automatic nor a commitment, but it costs nothing and creates a dated record that later forms part of your evidence. Word it narrowly and factually: name the asset entry, the number of units, the reference to the exchange's own status entry on the blocked withdrawal, and the question whether and how the exchange credits the migrated Base token for legacy holdings, or whether it will liquidate the holding in December.
Two points raise the chance of a usable answer. First, the deadline: point out that under the exchange's own schedule the transfer halt ends only after the withdrawal deadline, and ask for a statement on how customers are supposed to fulfil the instruction to withdraw within that window. Second, the form: ask for a written answer in the ticket and save it as a file. A verbal assurance will not help you in December.
If a withdrawal is still possible at another house, because a different network or a different schedule applies there, checking the alternative routes is worthwhile. How thin those routes are in practice for delisted small-caps we already counted up for the same Kraken basket back in August.
Binance ends VANRY withdrawals on October 17
The same question hits a second group considerably earlier. Binance removed VANRY from spot trading on August 17, 2026 and announced in its delisting notice that it would no longer support withdrawals of the token after October 17, 2026, 03:00 UTC. From October 18, delisted assets can be converted into stablecoins there, although the house expressly does not guarantee that conversion.
The wording on the chain is notable. Binance undertook to keep withdrawals via Ethereum and Polygon open until the project team had completed the migration. Those two contracts are precisely the ones now paused. Anyone holding VANRY at Binance should therefore not count on the withdrawal working reliably up to October 17, and should establish that for themselves promptly. The deadline there sits roughly two months ahead of Kraken's, on the same starting position on the chain.
That a withdrawal deadline and a swap window do not match up at VANRY is not a new pattern: for the swap via KuCoin the arithmetic ran similarly tight in August, as we worked through at the time for the KuCoin withdrawal deadline.
The caveat: if Vanar lifts the pause, the route opens again
One piece of context belongs here, because it governs your expectations. Kraken words the block conditionally: withdrawals remain unavailable as long as transfers on the chain are dormant. If Vanar lifts the pause on the legacy contracts, or if Kraken decides to credit the Base token for legacy holdings, the route opens again. Neither has been announced anywhere reachable, but on the wording both are possible.
From this it follows that your balance is not definitively lost as things stand today. What is evidenced is something narrower, namely that the way out is shut today and scheduled to stay shut until after the cut-off date. Anyone who looks into the status entry and the exchange account once a month over the coming weeks will catch an opening if it comes. Anyone who counts on it coming is acting without a basis.
What the case says about choosing a trading venue
For investors in Germany there is a lesson in this episode that reaches beyond VANRY. A licence under the European regulation on markets in crypto-assets governs how a provider is supervised, which information it has to give and how it segregates client assets. Such a licence does not oblige it to keep a token withdrawable whose contract the project itself has halted. What duties the regulation actually imposes on providers is set out in our overview of the MiCA duties for crypto companies.
The risk materialising here is not a regulatory risk but a project risk that passes through the exchange onto you. It hits small assets with few trading venues hardest, because there a single decision by the team suffices to close every route at once. Anyone holding such positions should look less at the price when sizing them than at the number of mutually independent routes that lead out of them.
And one more observation from the calendar: at Kraken, roughly three months lie between the announcement of a delisting and the withdrawal deadline. That is plenty of time if you use it. It is no time at all if the block comes from the project and the swap window was already shut before the deadline even began.
VANRY on Kraken: What to take away
The starting position is uncomfortable and nevertheless workable. You cannot move the token, but you can make sure the loss is evidenced, that a request is on file, and that the same thing does not happen to you again with the next small-cap.
- Pin down the holding and the block today. Save an account statement with units and date, plus the acquisition data for every purchase. A tool that carries holding periods per position takes the arithmetic off your hands; the providers are in the comparison of crypto tax tools.
- Write to support and save the answer. Ask in writing about the credit of the Base token and about how you are supposed to fulfil the instruction to withdraw while withdrawals are blocked. If you hold balances at several houses, check the deadlines there individually; which providers operate under which supervision is shown by the crypto exchange comparison.
- Hold future small-caps differently. Anyone keeping tokens in self-custody depends on the project alone at a delisting, and no longer additionally on a trading venue's block. The devices for that are in the hardware wallet comparison. That does not solve the project risk, but it halves the number of places that can bar your way.
(As of October 4, 2026. This article is not investment advice. Prices and fee structures change; check the terms with the provider before you buy.)
The US Securities and Exchange Commission cleared six triple-leveraged exchange-traded products for listing on October 2, 2026, among them the first ones on bitcoin and ether. Nothing trades yet. What has been cleared so far is the listing rule alone, and for a brokerage account in Germany nothing changes at all for now, because the products are meant to run on a US exchange.
The detail still rewards a closer look. Triple leverage sounds like triple the gain, but over several days the arithmetic works out differently from what most people expect. And the question of whether such products will ever show up in a German account has a clear legal answer.
What the SEC cleared on October 2, 2026
The decision carries the number 34-106577 and approves a rule change by the Cboe BZX exchange that permits the listing of six products from the Volatility Shares Trust. Cboe BZX filed the application on August 10, 2026, and the SEC published it on August 14. The products are sponsored by Volatility Shares LLC and are set up as individual series of a trust.
Each of the six products targets three times the daily move of an underlying: bitcoin, ether, gold, silver, crude oil and natural gas. For bitcoin and ether, according to reports on the decision, this is the first approval of triple leverage in the United States at all. Twice-leveraged crypto products have been available there for some time.
One term up front, because it carries everything that follows: an ETP, an exchange-traded product, is a security that trades on an exchange and tracks the performance of an underlying. It maps the underlying without being it: a wrapper around it. How well the wrapper fits depends on what sits inside.
Triple leverage on a daily basis: how the product does the math
The decisive qualifier sits in the small print and reads on a daily basis. The product does not promise to deliver three times the return over a month. It promises to track three times the daily move on each individual trading day, and it starts again from zero the next morning.
If bitcoin rises 2 percent on a given day, the product targets roughly 6 percent, before costs. If bitcoin falls 2 percent, it targets about minus 6 percent. That daily rebasing, known in the trade as the daily reset, is the reason for almost everything that surprises people about these products.
One limit follows directly from the arithmetic: if the underlying fell by more than a third on a single day, triple leverage would be mathematically wiped out. With twice the leverage, that threshold sits at half. The higher the leverage, the closer the arithmetic moves to the daily swing a crypto market can actually deliver.
Why the funds hold futures and not actual bitcoin
The products hold neither bitcoin nor ether nor barrels of crude oil. They obtain the performance through futures. A future is a contract to buy or sell an underlying at a price fixed today on a later date. The fund therefore holds forward contracts, not coins.
That has two consequences which weigh on returns. Futures expire, the fund has to roll them continuously into the next contract date, and depending on market conditions that rolling costs money. On top of that, the forward price can differ from the spot price. Over longer periods, the performance of a futures-based product therefore drifts away from the pure price performance of the underlying, even without leverage.
Anyone holding bitcoin or ethereum directly does not have that problem. In exchange, they are stuck with custody. That is the real trade-off behind every product wrapper.

Path dependency: what the daily reset does to a flat week
This is where leveraged products lose their reputation. Because every day starts afresh, the outcome depends not only on where the underlying ends up, but also on the route it took to get there. Practitioners call this path dependency.
Here is a worked example with round numbers that you can check yourself. The underlying stands at 100 and rises 10 percent on day one, to 110. On day two it falls 10 percent, to 99. After two days it is down 1 percent.
The triple-leveraged product also starts at 100. Day one delivers 30 percent, leaving the product at 130. Day two delivers minus 30 percent, and 30 percent of 130 is considerably more than 30 of 100. The product lands at 91, that is minus 9 percent. The underlying has lost 1 percent, the leveraged product 9.
This effect is called volatility decay. It bites deeper the more a market swings back and forth without finding a direction. In a calm uptrend, by contrast, the leverage works in the investor's favour, and there a leveraged product can even deliver more than three times the move. That is precisely why such products are built as a tool for a few days and not as a portfolio building block for a few years.
The market is currently providing the fitting backdrop. Bitcoin trades at around $84,800 on October 4, 2026, which according to CoinGecko data is some 33 percent below its record high of October 2025. Ether sits at about $2,690 and roughly 46 percent below its August 2025 peak. A market drifting sideways far below its highs is the least favourable environment imaginable for a daily reset.
Approval is not a trading start: the role of the S-1 registration
The SEC has approved a listing rule. That is the exchange's permission to list such securities in the first place. Before the first share can trade, a registration statement under the US Securities Act of 1933 also has to become effective, the S-1 form. Only then may the product be offered publicly.
The decision names no date for that. Weeks can pass between an approved listing rule and the first trading day, and there is no automatic guarantee that every approved product will actually launch in the end. Anyone reading headlines in the coming days about a supposed trading start should watch for that distinction.
Volatility Shares has filed documents on its product series with the SEC in parallel, most recently at the end of September 2026. These registration documents are publicly available and the most reliable source on which products are genuinely in the pipeline.
Will the 3x products reach German brokerage accounts?
The short answer: not directly. The products are to be listed on a US exchange, and US fund products have been practically out of reach for retail investors in the EU for years. That is not down to the SEC but to European law.
Anyone in Germany looking for leveraged exposure to crypto will therefore find the offering in other wrappers: in European crypto ETPs and ETNs, in leveraged certificates and in derivatives at brokers. We have gathered which routes exist and how to spot a reputable provider in our overview of crypto ETFs in Germany. A sober comparison of account costs belongs ahead of all of it in any case, and you will find that in our rundown of the best crypto brokers.

The PRIIPs key information document as a barrier for US products
The reason US funds are missing from German accounts is called PRIIPs. The EU regulation on packaged investment products requires a key information document in the respective national language for every product distributed to retail clients: a short, strictly formalised document with a risk indicator, cost disclosures and example scenarios.
US issuers as a rule do not produce this document, because the European retail market is secondary for them. Without a key information document, a broker in the EU may not actively offer the security to retail clients. Most German custodian banks simply block the purchase of such securities outright. That is exactly why German investors were never able to buy the US spot bitcoin ETFs directly either.
Professional clients are in a different position, but for that classification the legislator demands evidence of wealth and experience. For the normal case the rule holds: what the SEC permits does not automatically land in your account.
Leveraged ETP, crypto ETN and CFD: the differences for retail investors
Three wrappers are often confused in everyday use, although legally they have little in common.
A crypto ETN is a debt security issued by the provider, in Europe usually backed by coins. On top of the price risk, you therefore carry the risk that the issuer defaults. A leveraged ETP such as the US products now approved, by contrast, tracks a daily move in amplified form and obtains the performance via forward contracts. And a CFD, a contract for difference, is a contract with your broker in which margin calls and forced closure play a role entirely of their own.
On CFDs, European supervisors come down hard: for retail clients, leverage on cryptocurrencies is capped at two to one, and negative balance protection applies on top. A triple-leveraged security is not covered by that cap, precisely because it is a security and not a contract for difference. We have described how supervisors draw that dividing line in more detail using the example of perpetual futures and the CFD rules.
In practice that means one thing above all: the word leverage says nothing about which protections apply to you. That is decided by the legal wrapper, not by the number in front of the x.
Tax in Germany: one-year rule for coins, capital gains tax for fund products
One difference that tends to get lost in the heat of the moment concerns the tax office. Anyone holding bitcoin or ether directly is operating in the realm of private disposals under section 23 of the German Income Tax Act. After a holding period of one year, a gain there is tax-free.
For fund and certificate structures, that one-year rule as a rule does not apply. There, gains usually fall under investment income and therefore under the flat-rate withholding tax, regardless of how long you have held. Which rule applies in an individual case depends on the specific design of the product, and with hybrid forms the classification is contested enough that a tax adviser is a better address than a forum.
Anyone holding several products and exchanges side by side quickly loses track of acquisition dates. There are tools for that, and which ones have proved themselves in Germany is set out in our overview of crypto tax software and portfolio trackers.
3x leveraged ETPs: What to take away
The approval is a piece of news about the US market, not a new option for your account. Three things stick:
- Do not rush anything. Between the approved listing rule and a possible trading start stands the S-1 registration, and there is no date for it. Anyone hunting for a way to buy right now is hunting for something that does not yet exist. The realistic routes for Germany are set out in the overview of crypto ETFs in Germany.
- Understand the daily arithmetic before you buy leverage anywhere. Minus 1 percent on the underlying and minus 9 percent on triple leverage in the same week is not a flaw in the product. That is how it is built. Leveraged securities are day tools. What terms your account even provides for leveraged products is shown by a look at the rundown of the best crypto brokers.
- Settle the tax question beforehand, not in the April after. The one-year rule on directly held coins normally does not apply to fund products. Anyone holding both side by side needs a clean record of acquisition dates, for instance with one of the crypto tax tools.
You will find the SEC decision in the wording of the Volatility Shares registration documents in the filings with the SEC; the key facts of the approval including the file number were summarised among others by Crypto Briefing.
(As of October 4, 2026. This article is not investment advice. Prices and fee structures change; check the terms with the provider before you buy.)
Anyone in Germany buying bitcoin for the first time downloads an app and almost always pays more than they think. The visible part of the cost is usually small or absent altogether, because many providers advertise fee-free trading. The real price sits in the spread, and across the five apps in this comparison it ranges from 0.15 percent to 2.49 percent per purchase. On 100 euros that is 15 cents or 2.49 euros, and over a year of savings-plan instalments it becomes a difference of several dozen euros.
The second question matters even more for beginners and is asked less often: who owns the coins after the purchase, and can you get at them at all? An app that does not permit a transfer to your own wallet is selling you exposure to a price, not a cryptocurrency. This article sets both sides side by side, the costs and the custody, for five apps that German beginners use most often.
For this comparison, cryptoticker.io laid the published fee and price information of these five providers side by side on October 3, 2026: Bitvavo, Kraken, Bison, Bitpanda and Trade Republic. Five apps were examined and four points per app, namely the cost per purchase, the custodian, the transfer option and the regulatory authorisation. cryptoticker.io compiled this analysis itself on October 3, 2026.
What separates a crypto app from a crypto exchange
A crypto app is at first nothing more than an interface. What lies behind it determines the price and the rights you hold over your coins. Three constructions are common in the German market, and on screen they look almost identical.
With an exchange app you place an order into an order book in which other users form the other side. You pay a stated trading fee, usually split between maker and taker. Maker means your order first sits in the book and provides liquidity; taker means it is executed immediately against an order already there. Bitvavo and Kraken work this way.
With a broker app, by contrast, you buy directly from the provider, who quotes you a price. You often see no fee at all, but the buying price sits above and the selling price below the market price. Bison and Bitpanda follow this pattern in their main apps.
The third form is the neobroker, which places crypto alongside equities and ETFs in a securities account. Trade Republic belongs here, but since its wallet launch it actually holds the coins as crypto assets and not as a certificate. That is an important difference from providers carrying only crypto ETPs: there you buy a security tracking the price, and never a coin.
Spread instead of fee: where the costs in a crypto app really arise
Fee-free is rarely free of charge with crypto apps. Bison states expressly on its own fee page that trading is fee-free and that only a customary market spread applies. That spread is precisely the price.
What the spread is
The spread is the gap between the price at which you can buy and the price at which you could sell at the same moment. It is not debited; it is built into the quote. That is why it appears on no statement as a line item, and why beginners underestimate it so often.
In practice: you pay twice, once on the purchase and once on the sale. Professionals call it the round trip. A study from March 2026 put these total costs for buying and selling at 0.53 percent for Bitvavo at the low end and 6.45 percent for Coinbase at the high end. Between those two values lies a factor of twelve, on an identical product.
On top of that come costs with nothing to do with trading. Bison charges 2.49 percent for an instant deposit by credit card, Apple Pay or Google Pay, while the ordinary euro transfer remains free. At Bitpanda a PayPal deposit costs 1.49 percent, and the SEPA transfer nothing. Depositing conveniently may therefore cost you more for the payment route than for the purchase itself.
Five crypto apps on cost: 0.15 to 2.49 percent per purchase
The overview below summarises the published terms as of October 3, 2026. The values are list prices for retail clients without discounts; volume tiers lower them markedly at some providers.
| App | Cost per purchase | Custody | Transfer to your own wallet | Authorisation |
|---|---|---|---|---|
| Bitvavo | 0.15 percent maker, 0.25 percent taker; down to 0.04 percent on volume | Provider holds | possible | AFM Netherlands, since June 2025 |
| Kraken | 0.40 percent maker, 0.80 percent taker at the first tier; 1 percent on an instant buy in the app | Provider holds | possible | CSSF Luxembourg, Central Bank of Ireland |
| Bison | Spread averaging 1.25 percent on bitcoin and ethereum, 1.75 percent on all other coins | Börse Stuttgart Digital, insurance included | possible, with no provider fee | BaFin |
| Bitpanda | Mark-up of 0.99 percent on bitcoin and stablecoins, 1.49 percent on large coins, 2.49 percent on small ones | Provider holds | possible | BaFin and FMA Austria |
| Trade Republic | 1 euro order fee plus spread; the figures given for the spread range from about 0.5 to 2 percent | BitGo Europe GmbH, cold wallets | possible, with no provider fee | BaFin and Bundesbank, MiCAR authorisation |
On the range at Trade Republic, some context, because it stands out: the provider publishes no fixed spread for cryptocurrencies, and the available figures diverge. Around 0.5 percent on bitcoin is cited in one place and up to 2 percent in another. We are not smoothing that over; we name both ends. What applies in your case you will see only in the order screen, when the buying and selling prices are shown at the same time.

Why 100 euros buys different amounts of bitcoin across five apps
An example makes the range tangible. You buy bitcoin for 100 euros. At Bison's average spread of 1.25 percent, roughly 98.75 euros arrives in bitcoin and the rest stays with the provider. On an instant buy in the Kraken app at 1 percent it is roughly 99 euros. Through the same provider's exchange interface at 0.40 percent as a maker, roughly 99.60 euros remains.
As one-offs these are matters of cents, and arguing over them for a single purchase is not worth it. It becomes interesting with a savings plan. Invest 100 euros a month for twelve months and you pay roughly 15 euros in mark-up at 1.25 percent and roughly 4.80 euros at 0.40 percent. After five years there is a difference of a good 50 euros, without either side having delivered anything different.
This calculation has a limit you should know about: it treats the average spread as constant. In reality it fluctuates with market conditions, and on small coins it comes out differently in quiet phases than in hectic ones. An exact figure for your purchase comes only from the order screen at the moment of execution. How purchase costs and price performance relate to each other is set out in our overview of the bitcoin price.
Custody: who owns your coins inside the app
After the purchase your coins as a rule do not sit with you but with the provider. That is the normal case across all five apps and in itself no shortcoming, because that is exactly what the custody licence exists for. It does change who holds the key when it matters.
Custodian and insurance
Trade Republic names the custodian: the crypto assets sit with BitGo Europe GmbH in cold wallets, meaning on keys without a permanent network connection. Bison lists custody together with insurance cover against theft and hacking attacks, among other things, as a free service, without naming the custodian on its fee page.
Insurance cover is not a deposit guarantee scheme. For crypto assets the statutory deposit protection of 100,000 euros does not apply, because it covers bank balances in euros and not coins. Where a provider promises insurance, it is worth looking at what exactly is insured, with whom, and up to what amount. That is in the terms, not in the advertising.
In practice: as long as the coins sit with the provider, you share its default risk. How real that is was shown several times in 2026, from a breach at a large exchange in September through to incidents at intermediate layers. Anyone holding larger sums therefore spreads them or withdraws them.
Transfer to your own wallet: the question that counts before the first purchase
All five apps in this comparison permit a transfer to your own wallet. That is not a given, and at Trade Republic it is new: only with the wallet launch on November 14, 2025 did pure trading become an offering in which customers can send and receive around 50 cryptocurrencies. The provider charges no fee of its own for this; the network fee of the respective blockchain is borne by the customer.
Bison likewise lists cryptocurrency withdrawals as free, as well as deposits. These figures come from the Bison app's fee page, and the details on the wallet launch from Trade Republic's announcement of November 14, 2025.
Why this matters before the first purchase: an app without a transfer function ties you to the provider. You can then only sell, not move. Anyone wanting to switch to self-custody later has to sell and buy again, and in Germany that is a taxable event. Which devices qualify for self-custody is then the next question, and it is better asked before the purchase than after.

MiCA authorisation: how to spot a permitted app in Germany
Since January 1, 2026, crypto-asset services may be offered in Germany only by those holding a BaFin authorisation or a valid notification. The EU-wide transition period ended on July 1, 2026. Since then the question of authorisation is no longer a formality but the dividing line between a provider allowed to operate here and one that is not.
The authorisation does not have to come from Germany. The procedure permits operating in all other member states on a licence from one EU country. Bitvavo is authorised through the Dutch AFM, Kraken through Luxembourg and Ireland, Bitpanda through BaFin and the Austrian FMA, and Bison and Trade Republic through BaFin. Germany leads the list of authorisations granted within the EU, with 56.
Two notes on this, because they are easily misunderstood. First, an authorisation says nothing about the price and nothing about the quality of an app; it says that a supervisor is looking. Second, the number of houses holding a full trading permission is small: across the EU, as at the July 2026 reference date, only 14 trading venues held one.
Savings plan, minimum amount and staking: what beginners often overlook
Three points decide more in everyday use than the last tenth of a percentage point in the spread.
The savings plan is the first. It takes the question of the right entry moment off your hands and spreads the purchase over time. What matters here is whether the fee is charged as a percentage or as a flat amount: one euro of order fee on an instalment of 25 euros is four percent, on 250 euros it is 0.4 percent. Small instalments at a provider with a flat fee are therefore expensive, even where the figure looks small.
The second point is staking. Trade Republic offers it for networks such as Ethereum and Solana and points out that the coins are bound to the network while staked and cannot be sold. That is not an aside but the heart of the matter: stake, and you give up availability at any time. How much of the yield stays with the provider differs widely, and at Bison we put that share at 27 percent of the rewards in a separate piece on September 6, 2026, which you can read in our analysis of the Bison app.
The third point is rewards tied to payment activity. Trade Republic credits back two percent of card spending as Crypto Saveback, capped at up to 1,500 euros of monthly card spending. Such models only pay off if you use the card anyway; as a reason for choosing a crypto app they do not qualify.
Holding period and tax: the choice of app reaches into your tax return
In Germany the gain on a sale of cryptocurrencies has so far been tax-free after a year of holding. For the period, what counts is the acquisition date of the individual coin, and this is exactly where the app becomes a factor: you need an unbroken list of your purchases with date and quantity, otherwise the period cannot be evidenced later.
Which records an app supplies is therefore no convenience feature. Some providers make a ready annual statement available, others only an export of individual transactions that you have to work up yourself. Anyone using several apps in parallel needs a tool that brings everything together in any case; a selection is in our overview of tax tools and portfolio trackers.
A note on where things stand: on October 14, 2026, the federal cabinet takes up a draft bill providing for a flat-rate withholding tax of 25 percent on crypto assets from 2027, as matters stand only for acquisitions after December 31, 2026. None of this has been decided. For your choice of app it mainly means that acquisition records will matter even more in future than they already do today.
Crypto apps for beginners: What to take away
The differences between the five apps are larger than the interfaces suggest. Cheap and expensive lie a factor of ten apart, and the custody question decides whether you own coins or merely take part in their price.
- Project the mark-up onto your planned instalment, not onto a single purchase. A flat amount per order hits small instalments hard, a percentage spread hits large sums. The current terms across trading venues are in our crypto exchange comparison.
- Check before your first purchase whether the app permits transfers to your own wallet. Without that function your only way out later is a sale, and in Germany that is a taxable event. Suitable devices are shown in the hardware wallet comparison.
- Settle the authorisation and the records before money moves. Since July 1, 2026, every provider needs a permission, and you need a list of your purchases with dates. Which houses have a supervisor behind them is set out in the list of regulated crypto exchanges.
(As of October 3, 2026. This article is not investment advice. Prices and fee structures change; check the terms with the provider before you buy.)
Building a crypto portfolio comes down above all to one thing: deciding how much weight each holding gets. Take the four largest crypto assets for that purpose and you are spreading less than you think. The daily moves of Bitcoin, Ethereum, Solana and XRP ran almost in parallel over the past twelve months, with correlations between 0.82 and 0.90. Four names in a portfolio are therefore not yet four risks.
This article sets out the yardsticks investors use to weight, what a year of price data on the four actually supports, and the part played by holding periods, fees and the route you buy through. A recommendation on which split is right for you is not here: that depends on your investment horizon, your income and your capacity to bear risk, and only you know those.
What a crypto portfolio actually is
A portfolio is the sum of your positions together with their shares of the total value. What matters is not the list of coins but their weight: two assets split 90 to 10 behave entirely differently from the same two split 50 to 50. Weighting is therefore the real decision, and it is often taken in passing, by simply buying whatever is in the news.
To be kept separate from that is allocation, the share of your total wealth that cryptocurrencies make up. Someone holding 2 percent of their wealth in crypto has a different problem from someone at 40 percent, even with an identical split inside the crypto part. The two levels belong under separate consideration.
The third quantity is the investment horizon. It determines whether a fall of half the value is a paper loss you can sit out or a real loss, because the money is needed. Money earmarked for the next few years belongs outside this calculation.
Market capitalisation as a yardstick: Bitcoin carries just under 59 percent of the total market
The most widely used yardstick is market capitalisation, the price times the number of circulating units, and thus a measure of a coin's weight in the market. On data from CoinGecko, the entire crypto market stood at around 2,559 billion euros on October 2. Bitcoin supplied 58.75 percent of that, Ethereum 11.29 percent, XRP 3.20 percent and Solana 2.41 percent.
Weight the four by that yardstick and you land on a very lopsided split. Together the four were worth around 1,936 billion euros on the same day, and of that Bitcoin alone carried 77.7 percent, Ethereum 14.9 percent, XRP 4.2 percent and Solana 3.2 percent. A portfolio of these four weighted by market capitalisation is therefore more than three-quarters a Bitcoin portfolio.
That is why many reach for equal weighting instead, 25 percent each. This variant gives the smaller assets markedly more weight than the market does and thereby raises the volatility of the whole, as the section on drawdowns shows. Both yardsticks are defensible, they simply lead to entirely different portfolios, and anyone choosing neither ends up with the random result of their own buying history.

Core and satellite: two roles in a portfolio
Behind the weighting there usually sits a simpler consideration: which position carries the portfolio, and which one is trimming? The core is the part that sets the character of the portfolio and stays put the longest. The satellite is the smaller part, where a total loss hurts but knocks nothing over.
The classification says nothing about the quality of the projects. It only describes how much weight you give to something whose development you do not know. The younger a network, the thinner the trading and the stronger the dependence on a single team, the more an asset belongs in the smaller part.
How to read off the role
Three checkable points help: the depth of trading across several venues, how long a network has run without a major interruption, and whether the price still finds buyers once the topic drops out of the news. None of these says anything about price performance, but all three say something about the risk of not being able to get out.
Twelve months of price data: how closely the four move together
We analysed the daily euro prices of the four assets over the past 365 days and calculated the correlation of their daily returns. A correlation of 1.0 means they move entirely in step, 0 means no relationship, and minus 1 means they move exactly opposite. What matters for spread in a portfolio is how far below 1 the values sit.
- Bitcoin and Ethereum: 0.90
- Ethereum and Solana: 0.88
- Bitcoin and Solana: 0.86
- Bitcoin and XRP: 0.85
- Ethereum and XRP: 0.82
- Solana and XRP: 0.82
No pair sits below 0.82. In practice: on a bad day for Bitcoin, the other three are highly likely to be down as well. Splitting across four assets lowers the risk that one individual project fails, but it barely lowers the risk that the whole market falls. Why more positions change little about this, we showed across a broader field in our piece on correlation in a crypto portfolio.
Over the same period all four were down, and to differing degrees: Bitcoin lost around 27 percent, Ethereum around 38 percent, Solana around 48 percent and XRP around 50 percent. An equally weighted portfolio of the four would therefore have fared worse than Bitcoin alone in this window. That is no argument against spreading. It is a reminder that spreading within one asset class guarantees no return.
Volatility and drawdowns: 52 to 73 percent below the peak
The second half of the weighting question is how much volatility you want in the portfolio. The same daily data yields, for the past twelve months, an annualised volatility of around 45 percent for Bitcoin, 63 percent for Ethereum, 67 percent for Solana and 67 percent for XRP.
More tangible still is the largest drawdown from each asset's own peak within the year. Bitcoin at times sat 52 percent below its high, Ethereum 66 percent, XRP 67 percent and Solana 73 percent. Weight the three smaller assets more heavily than the market does and you are buying precisely these deeper drawdowns.
These figures are the soberest part of the portfolio question, because they promise nothing. What they describe is what happened in a normal year, not the worst that can happen. The size of the amount you commit is therefore the most effective lever you have, more effective than any fine-tuning of the shares.
A total loss remains possible
With every single crypto asset a total loss is possible: through a fault in the network, through the failure of a trading platform, through regulation, or because a project is abandoned. No share in a portfolio is so small that this risk disappears, and no weighting makes it go away.
What spreading within one asset class can achieve
Spreading works against single-name risks, not against market risks. When a network has a serious fault or a team dissolves, that hits one holding and not all of them. This is exactly what the split is for, and exactly why it still works at correlations of 0.85.
Against a market slump it does not help, and with crypto assets that is the more frequent case. Anyone wanting to lower the volatility of their total wealth achieves it through the share crypto holds within it, and through asset classes that behave differently. Inside the crypto part, spreading is protection against bad luck in selection, not protection against the market.
From that follows an uncomfortable but useful insight: more coins do not make a portfolio safer, they only make it harder to oversee. Tracking ten positions whose moves agree to 0.8 costs time and fees and adds little over three positions.

Savings plan or lump sum: two routes into building a position
Building a position is also about the how. A lump-sum purchase commits the entire amount at one price. A savings plan spreads it across many dates and averages the entry price; where prices fluctuate, you buy more units at low prices and fewer at high ones.
The savings plan takes the question of the right moment out of the decision, and that is its real advantage. It does not protect against falling prices: buy monthly into a falling market for a year and you will also end up with losses, merely at a different average price. Which providers offer savings plans on crypto assets, and at what cost, is in our comparison of Bitcoin savings plans.
For weighting, the savings plan has a practical side effect: the shares stay closer to your target split by themselves, because every instalment is distributed by the same key. With a lump sum the weights drift apart as prices move, and they do so most where volatility is greatest.
Fees, spreads and the choice of trading platform
Fees bear directly on the result and are the part you know in advance. Three things are to be distinguished: the stated trading fee per purchase, the spread between the buy and sell price, which often does not appear as a fee at all, and the cost of deposits and withdrawals. On small, frequent purchases the spread weighs more heavily than the percentage on the price sheet.
Then there is the question of who holds the coins. A platform licensed in the European Union is subject to supervisory rules, which neither prevents price losses nor rules out a default risk, but does make the framework clearer. How the various providers are set up is shown in our crypto exchange comparison.
A third point concerns custody. Coins sitting on a trading platform are conveniently tradable and dependent on the provider's continued existence. Coins in your own custody sit with you, and so does responsibility for securing them. For larger amounts with a long horizon, that is the trade-off standing behind the weighting question.
Holding period and tax: what rebalancing triggers
Every reallocation is a taxable event, including a swap from one coin into another. Under section 23 of the German Income Tax Act, gains from private disposals are tax-free where more than a year lies between acquisition and sale; within the year they are taxable to the extent that the exemption threshold for the whole year's gains is exceeded. That threshold applies to the sum of all such gains in a year, not per coin.
For weighting that means: anyone adjusting the shares frequently keeps triggering taxable events and loses holding periods that had already started running. A target split that needs adjusting only rarely is therefore not merely more convenient, it is often the cheaper one too.
Independently of that, the record-keeping duty applies. For every purchase, sale and swap you need the date, the quantity and the euro equivalent, otherwise the holding period cannot be evidenced later. For the crypto tax reform that is due to change this system from 2027, that documentation is likewise the basis.
How often a portfolio really needs adjusting
When prices run, the shares shift. If Bitcoin rises more than the rest, its weight grows, and the portfolio becomes more concentrated than planned. Bringing it back to the target weights is called rebalancing.
Two triggers are common. With the calendar trigger you check at fixed intervals, once a year for instance. With the threshold trigger you step in only once a weight has deviated by more than a set band, by a fifth of its target value for example. Where prices fluctuate, the threshold trigger leads to fewer transactions than a short calendar cycle.
The order matters: first the target weights and the trigger, then the execution. Reallocate without a defined target split and you are following the price chart, tending to buy whatever has just risen. Because every adjustment costs fees and holding periods, less often is usually better here than more often.
The most common mistakes in building a crypto portfolio
Four patterns recur. The first is confusing number with spread: twenty positions all hanging on the overall market are one holding in twenty parts. The second is committing money with a short horizon, money that has to be sold when the value halves.
The third is the missing record, which only makes itself felt at the tax return, when acquisition data for purchases from years back is nowhere to be found. The fourth is the constant readjusting to the news, which generates fees and destroys holding periods without measurably changing the portfolio's risk.
What all four have in common is that they can be avoided beforehand and cost money afterwards. None of them has anything to do with the selection of coins.
Building a crypto portfolio: What to take away
The four largest crypto assets moved almost in step over the past year at 0.82 to 0.90, with drawdowns of between 52 and 73 percent from their peaks. Weighting decides more than selection, and the amount committed decides more than the weighting. Three steps that hold regardless of your split:
- Set the yardstick before you buy. Decide between market capitalisation and equal weighting, write down the target shares and fix a trigger for adjustment. How a set key can be executed across many dates is shown in our comparison of Bitcoin savings plans.
- Compare costs and venue in advance. The trading fee, the spread and the deposit or withdrawal costs determine what is left of an instalment. Our crypto exchange comparison sets the terms side by side.
- Match custody to your horizon. What is meant to sit for a long time belongs in your own custody rather than on the trading platform. Which devices are suitable is in our hardware wallet comparison.
(As of October 2, 2026. This article is not investment advice. Prices and fee structures change; check the terms with the provider before you buy.)
Avalanche took on more tokenised stocks and real-world assets in September than any other blockchain. In the 30 days to September 29, data from Cryptobriefing shows $266 million in added RWA market capitalisation, more than BNB Chain, Robinhood Chain and X Layer combined. The price of Avalanche followed on October 3: cryptoticker.io measured $11.11 on Saturday evening, up 4.9 percent over 24 hours.
The catch lies in the composition. Nearly half of the increase traces back to a single issuer, and that issuer mainly brought its own token onto the chain. This article sets out what the figures support, where they diverge, and what a European investor can take from them.
Avalanche and tokenised stocks: $266 million of growth in 30 days
Real world assets, or RWA, are assets from traditional finance represented as tokens on a blockchain: money market funds, bonds, equities, loan receivables. Tokenised stocks are the sub-segment in which company shares exist as a tradable token.
In the window from August 30 to September 29, Avalanche gained $266 million in RWA market capitalisation according to Cryptobriefing. Behind it came BNB Chain with $116 million, Robinhood Chain with $100 million and X Layer with $95 million. Total RWA value spread across blockchains rose 15.54 percent over the same period, to $3.14 billion.
Two secondary figures say more about breadth than the headline sum does: the number of holder addresses grew 64.3 percent to 4.04 million, and transfer activity 115.7 percent to 3.24 million addresses. So there are not only more assets on the chain but also more addresses moving them.
Securitize and the SECZ token: why a single issuer carries the growth
Securitize is a platform that issues and administers securities as tokens for institutional clients. According to Cryptobriefing, roughly $770 million sits on Avalanche via Securitize, about half of the chain's entire RWA holdings. The increase in assets deployed there comes to 628 percent. BlackRock's BUIDL fund was an early participant.
Decisive for the assessment is an observation by news.Bitcoin.com: the SECZ token, the tokenised stake in Securitize itself, added $132 million in market capitalisation in a single week. That was roughly ten times the next largest tokenised stock. The lion's share of what Avalanche won in institutional capital in September therefore hangs on one security.
That is no charge against the issuer. It is a statement about concentration. Growth that comes largely from one position turns around faster than growth drawn from many. Read the figure as evidence of broad adoption and you are reading in more than it says.
The ranking in tokenised stocks: BNB Chain in front, Avalanche fourth
On holdings rather than growth, the picture looks different. news.Bitcoin.com puts the entire market for tokenised stocks at $3.6 billion across 4,555 assets as of September 29, citing the RWA Foundation and Token Terminal as sources. The distribution on that count:
- BNB Chain: roughly $1.1 billion
- Ethereum: roughly $773 million
- Solana: roughly $723 million
- Avalanche: roughly $428 million
Avalanche is therefore fourth on holdings and first on growth. In the seven days to September 29, $131.2 million in tokenised equity value was added. Solana gained less capital over the same period but 123,500 new holders. news.Bitcoin.com describes the split this way: institutional money is gathering on Avalanche, while retail investors are found more on Solana and the Robinhood Chain.
Where the figures diverge
Two sources, two orders of magnitude. Cryptobriefing cites a tokenised-equity market capitalisation of just under $1.7 billion for Avalanche in mid-September, while Token Terminal, via news.Bitcoin.com, arrives at roughly $428 million as of September 29. The spread is therefore about fourfold. The likely reason lies in the definition: the higher figure probably includes the entire RWA stock, the lower one only equities in the narrow sense. Neither side publishes a binding definition. Anyone working with such figures should know both and treat neither as the single truth.

AVAX price today: $11.11, 9.87 euros and 47.9 percent up over 30 days
cryptoticker.io compiled this analysis itself on October 3, 2026. It draws on public market data from CoinGecko on Avalanche, with the top 25 by market capitalisation checked.
- Price: $11.11, or 9.87 euros
- 24 hours: up 4.9 percent
- Daily range: $10.54 to $11.20
- Seven days: up 3.4 percent
- 30 days: up 47.9 percent
- Market capitalisation: $4.92 billion, ranked 25th
- Trading volume over 24 hours: $357 million
- Distance to the record of $144.96 set on November 21, 2021: minus 92.3 percent
- Circulating supply: 443.2 million of 469.9 million AVAX
The sturdier figure is the monthly gain of 47.9 percent, because it covers over the short-term swings.
The relationship between month and week is notable: just under 48 percent in 30 days, but only 3.4 percent in seven. The bulk of the rise therefore lies some weeks back and coincides in time with the reports on institutional deposits, which cryptoticker.io covered on September 20 on the tokenised bond fund on AVAX and on September 29 on Goldman Sachs and the Lynq network.
AVAX ETFs and ETPs: $268,000 of inflows on October 1
For European investors the fund route is often the more convenient one. In the United States, spot ETFs on AVAX recorded a net inflow of roughly $268,000 on October 1, according to BSC News as quoted by Coingabbar. That was the first inflow since September 22. The VanEck Avalanche ETF, ticker VAVX, reached net assets of $20.58 million as of September 28. Together the funds hold 1.22 percent of the circulating AVAX supply on this count.
The sum is small, and it should not be sold as a turning point. Measured against daily turnover of $357 million, $268,000 is a rounding error. The only meaningful part is the sign, after nine days without an inflow.
Important for the European market: these US funds are generally not available for purchase here. Anyone wanting exposure to AVAX through a securities account reaches for an ETP, an exchange-traded note on the price. How that differs legally and for tax from buying directly is covered at length in our overview of crypto ETFs and ETPs in Germany.
Buying AVAX in Germany: MiCA licence, spread and custody
Since the European crypto regulation MiCA has applied in full, a provider addressing retail clients in Germany needs authorisation as a crypto-asset service provider. That authorisation is the first thing you can check before money moves. BaFin maintains the list of providers active in Germany, and the European registers sit with ESMA.
Three points then determine the real costs, and two of them rarely appear in the advertising. The trading fee is the visible part. The spread, the gap between the buy and sell price, is the invisible one and often the larger on smaller altcoins. And the withdrawal fee in AVAX applies when the coins are later to move to your own wallet. A side-by-side view of the terms is in our crypto exchange comparison.
On custody there is no third option. Either the coins sit with the provider, in which case you carry its default risk, or they sit in your own wallet, in which case you carry sole responsibility for the key. A deposit guarantee scheme of the kind that covers bank balances does not exist for crypto.

AVAX staking: 25 AVAX minimum delegation and a two-week lock-up
Avalanche pays rewards on coins pledged to secure the network. The parameters are in the project's official documentation, and they matter more for planning than the advertised yield figure does.
- Running your own validator requires a stake of at least 2,000 AVAX.
- Delegating to an existing validator instead requires at least 25 AVAX.
- A delegation runs for a minimum of two weeks and a maximum of one year.
- The validator may retain a fee of at least 2 percent.
One change from the Helicon upgrade of September 22 is easy to overlook: the minimum term for validators fell from two weeks to 48 hours, while for delegators it stayed at two weeks. The lock-up is now longer for delegators than for validators. Delegate, and you cannot reach the coins during those two weeks, wherever the price moves.
This is the point at which yield and flexibility pull against each other. On an asset that has gained almost 48 percent in 30 days, a two-week lock is a real decision and not a formality. Anyone delegating should therefore weigh the lock against their own investment horizon before the coins are tied up.
Holding period and tax: what selling AVAX triggers in Germany
For private assets in Germany, the private disposal rules of section 23 of the Income Tax Act apply. Sell AVAX at a profit within a year of buying and you pay tax on that profit at your personal income tax rate. Once a year has passed, the gain on the sale is tax-free. For gains realised inside the period there is an exemption threshold of 1,000 euros a year, and a threshold is not an allowance: exceed it and the entire gain is taxable, not merely the part above it.
Staking sits differently. The rewards count as other income at the moment they arrive and are valued at their worth on that day. Sell the coins received this way later and a separate holding period runs for them from the day of receipt. Draw rewards regularly over a year and you are carrying many small positions, each with its own reference date. Anyone drawing rewards across a year therefore needs an unbroken record of every single credit.
An ETP on AVAX follows different rules again, which vary with how the note is structured. This overview is no substitute for tax advice; on larger amounts or where the classification is unclear, the route leads to a tax adviser.
The risks: concentration in one issuer and 92 percent below the record
Three things belong alongside the growth figures.
First, the concentration already described. When a single token supplies the bulk of the increase, the metric is sensitive to events at that one issuer. That holds in both directions.
Second, the distance to the all-time high. AVAX trades 92.3 percent below the record of November 2021. A gain of 47.9 percent in a month sounds enormous but builds on a very low base. From here the price would have to rise roughly thirteenfold to reach the old level again.
Third, the dependence on regulatory decisions. Tokenised stocks live on supervisors permitting them. Should that stance change in the United States or in the EU, the basis of the entire segment changes with it, regardless of the technical quality of the chain in question.
Against that stands the fact that the inflows come from the institutional side and not from a story on social networks. Institutional money moves more slowly but usually also stays longer. The bull case is that Avalanche establishes itself as infrastructure for regulated assets. The bear case is that the figures suggest a breadth a single issuer cannot carry alone.
Avalanche and tokenised stocks: The key points for your decision
- Separate growth from holdings. Avalanche leads on growth over the past 30 days with $266 million, but on holdings of tokenised stocks its roughly $428 million sits behind BNB Chain, Ethereum and Solana. If you want to start through a regulated crypto exchange, check the licence, the spread and the withdrawal fee in AVAX first.
- Factor in the lock-up before you delegate. The minimum delegation is 25 AVAX, the lock-up two weeks, the validator fee at least 2 percent. Terms and durations across providers are in our comparison of staking platforms.
- Settle the holding period before you buy, not after. One year decides between tax-free and taxable, and staking rewards start periods of their own. Software that tracks every position with its reference date is in our comparison of crypto tax tools.
The sources behind this article at a glance: the 30-day analysis of RWA inflows at Cryptobriefing and the staking parameters in the official Avalanche documentation.
(As of October 3, 2026. This article is not investment advice. Prices and fee structures change; check the terms with the provider before you buy.)
Decrypt
The firm says the Sept. 24 breach pushed North Korea's 2026 crypto haul past $1 billion, and detailed how it used in-house AI to trace the stolen funds across four blockchains in a race against the attackers.
The YouTuber says OpenAI suspended his account twice while he trained a small, uncensored model built to run on your own computer.
The TRUMP meme coin project is inviting its top 185 holders to a Nov. 22 gala dinner with President Trump two weeks after ethics disputes over his crypto interests helped stall the Clarity Act in the Senate.
The pontiff says algorithms "lack the spark of humanity," and the Vatican wants to renew an alliance with artists and cultural institutions to protect it.
California's attorney general wants answers from OpenAI about AI models that escaped a locked test environment and hacked Hugging Face—and whether the company can be held legally accountable.
U.Today - IT, AI and Fintech Daily News for You Today
Dogecoin’s utility push gains ground amid infrastructure expansion.
Shiba Inu may be facing intense selling pressure again as its exchange reserve sharply rises back above the closely watched 88 trillion threshold.
Cardano’s long-awaited golden cross finally arrives after 14 months.
This week in crypto: Ripple, XRPL, Bitcoin and Shiba Inu.
Namsan Seoul Tower illuminated to celebrate a record day for the XRP community in Korea.
Blockonomi
TLDR:
- Ethereum price holds above $2,600, with $3,400 identified as a conditional liquidity target and resistance near $2,750 to $2,800.
- Binance futures volume reached roughly 12.5 times spot turnover on October 1, despite ETH gaining approximately 73% since late June.
- CryptoPatel projects $10,000 to $15,000 during a future altseason, while his roadmap requires resistance breaks and intact structural support.
- U.S. spot Ethereum ETFs lost a provisional $118 million over the latest week, while Glamsterdam awaits a confirmed mainnet activation date.
The Ethereum price is holding above $2,600 after reclaiming a liquidity zone, with $3,400 identified as a potential target. ETH traded near $2,740.20 in the October 4 analysis, while resistance remained around $2,750 to $2,800.
However, Binance futures continue to dominate trading activity despite the recovery from late June. Analyst Amr Taha found that spot volume equaled only 8% of futures volume on October 1.
That trading mix adds context to the immediate support test, while CryptoPatel projects higher levels during a future altseason. Meanwhile, Ethereum ETFs face withdrawals as upcoming network changes add a separate development factor to the outlook.
Ethereum Price Tests Support as Binance Futures Lead Activity
Taha’s CryptoQuant review shows ETH advancing from $1,560 on June 27 to $2,700 on October 1. That represents a gain near 73%, or about $1,140, over the period.
Over the same interval, the Binance spot-to-futures volume ratio rose from 6.5% to 8%. This compares two trading volumes; it does not measure spot activity as a share of their combined total.
At an 8% ratio, Binance futures volume was approximately 12.5 times spot volume. Calculated across both markets, spot represented roughly 7.4% of combined turnover, assuming the same measurement window.

The Ethereum price recovery coincided with a small increase in spot trading’s relative contribution. However, the ratio alone cannot establish whether absolute spot volume increased, decreased, or stayed flat.
Differences in market size also limit what can be inferred about directional positioning. High futures turnover can reflect repeated trading or hedging, so it does not prove excessive leverage.
Taha identified earlier ratio peaks of 45% on April 13, 2026, and 114% on November 14, 2025. Subsequent declines reached approximately 36% and 45%, respectively. Those sequences show historical association without establishing that higher spot participation caused either decline.
For the Ethereum price, continued support above $2,600 would preserve the breakout case outlined in the analysis. A move below that zone would weaken the rationale for the $3,400 liquidity target.
Ethereum ETFs Reverse Flows as Cycle Targets Face Resistance
CryptoPatel’s longer-term Ethereum price forecast points toward $10,000 to $15,000 during a future altseason. His roadmap also marks $16,000 as a possible cycle peak around 2027 to 2028.
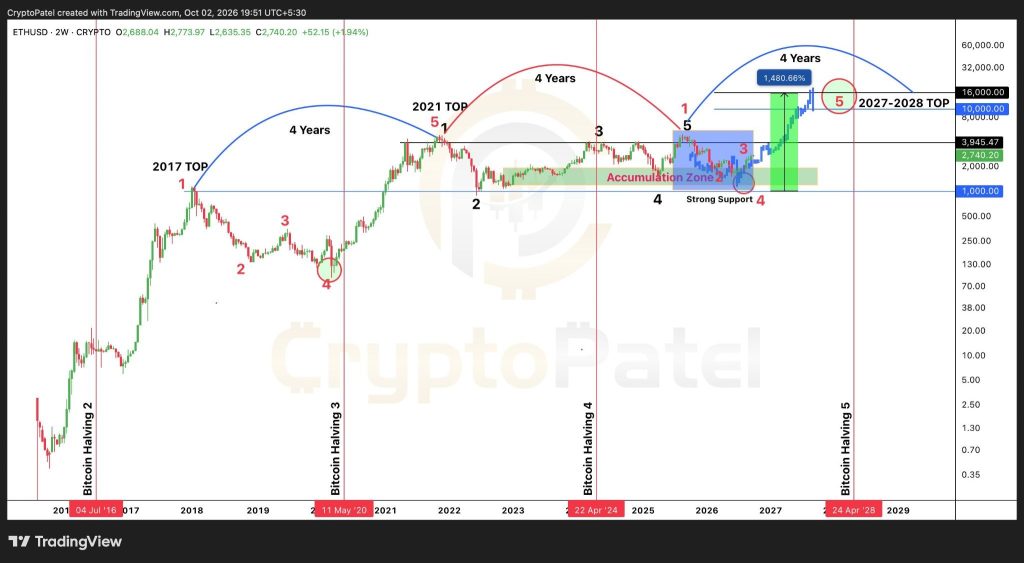
The two-week candle gained 1.94%, with a $2,773.97 high and $2,635.35 low. Calculated from $2,740.20, reaching $15,000 would require an increase of about 447%.
Earlier cycles carried ETH from roughly $10 to $1,400 in 2017, then down to $80. The subsequent recovery peaked near $4,800 in 2021 before reversing toward $880 in 2022.
The model links Ethereum’s previous advances to Bitcoin’s four-year halving pattern. It labels the current phase Wave 4, followed by a projected Wave 5 expansion.
Within that framework, $3,945 is a major resistance level before potential moves toward $8,000 and $10,000. More distant labels at $32,000 and $60,000 sit outside the immediate trading setup.
The Ethereum price roadmap includes an accumulation area near $2,000 and structural support around $1,000. CryptoPatel’s bullish wave count would fail below the latter level.
U.S. spot Ethereum ETFs recorded approximately $118 million in net outflows for the week ending October 2. Farside’s provisional daily totals show a reversal from $689.8 million in inflows during the previous week.
Lookonchain figures show wallets holding 1,000 to 10,000 ETH controlling more than 14.2 million tokens. That holding total alone does not show when purchases occurred or identify the wallets’ owners.
Network development provides another factor for the Ethereum price outlook. Ethereum’s official roadmap places Glamsterdam in the fourth quarter of 2026, while leaving the mainnet date unconfirmed.
The Ethereum Foundation has scheduled Sepolia activation for October 6. Planned changes include enshrined proposer-builder separation and block-level access lists, which prepare the network for greater throughput and parallel processing.
The post Ethereum Price Holds $2,600 as Binance Futures Dominate Trading appeared first on Blockonomi.
TLDR:
- The Cronos token burn removes 228 million CRO from the community pool. Community approval lifts this program to 428 million tokens.
- All Ult and Cronos Launch revenue will fund CRO buybacks and monthly burns. Published transaction hashes allow public verification.
- Staking rewards keep their current terms, with Strategic Reserve support maintaining payouts as emissions decline under existing policy.
- CRO trades near $0.0669 after a roughly 1.56% daily gain. Future purchase amounts depend on product revenue and execution costs.
The Cronos token burn removed 228 million CRO from the community pool after voters approved two governance proposals. Cronos Network announced the decision on October 3, bringing burns under the community program to 428 million tokens.
CRO traded near $0.0669, gaining approximately 1.56% over 24 hours, according to Coingecko market data. The destroyed tokens carried an estimated market value of about $15 million.
The approved framework directs all revenue from Ult and Cronos Launch toward open market purchases and monthly burns. Cronos will publish transaction hashes, while staking rewards retain their existing terms and funding support through the Strategic Reserve.
Cronos token burn lifts community total to 428 million
Proposal 36 authorized the latest community pool transfer to a burn address on Cronos POS. Four previous rounds each removed 50 million CRO, making this fifth round considerably larger.
The Cronos token burn therefore exceeded the combined size of those earlier rounds by 28 million tokens. The 428 million total describes this community initiative, rather than every historical destruction of CRO.
The immediate operation used tokens already held by the community pool. It did not require purchasing the entire 228 million CRO from exchanges, an important distinction when assessing market demand.
Future CRO buybacks introduce a separate source of purchases because they use product revenue to acquire tokens. Their size will vary with platform earnings and the market price when transactions execute.
Although the Cronos token burn reduces available supply, it does not establish a guaranteed price increase. Liquidity, demand, reserve distributions, and broader market conditions still influence how CRO trades.
Coingecko listed daily trading volume near $5.82 million and market capitalization around $3.31 billion. These figures show that the burn announcement arrived alongside relatively limited turnover compared with the token valuation.
That leaves a practical distinction between governance approval and sustained trading interest. A smaller token supply alone cannot reveal whether demand will grow enough to support a lasting advance.
CRO Buybacks Tie Monthly Burns to Revenue From Trading
Proposal 37 commits 100% of Ult and Cronos Launch revenue to token purchases and destruction. Cronos Labs says existing capital will cover operations, infrastructure, and growth spending instead of those product receipts.
The Cronos token burn framework links supply reduction directly to activity on both products. Ult generates trading revenue, while Cronos Launch collects fees associated with tokens created and traded through its launchpad.
Monthly burns provide a schedule for removing purchased tokens, and published transaction hashes allow independent verification. Community members can check execution amounts rather than relying solely on announcements about future commitments.
Under the Cronos token burn plan, published records can help compare revenue commitments with the tokens actually purchased and destroyed. A transaction record verifies execution, while separate revenue reporting would explain whether purchases reflect all earnings from the two platforms.
The revenue percentage is fixed, but the purchase budget is not. As an illustration, $100,000 would acquire about 1.5 million CRO near $0.0669 before fees and execution costs.
That calculation highlights why product revenue remains a central measure for future CRO buybacks. More usage can generate larger purchases, although lower revenue would reduce the number of tokens acquired.
Staking rewards retain their current parameters, including existing lock periods and bonus structures. The Strategic Reserve will support payouts as emissions decline, keeping reward funding separate from revenue committed to monthly burns.
The Cronos token burn does not change the review process for potential Crypto.com listings. The published strategy says qualifying tokens enter an ongoing assessment, with Crypto.com controlling criteria and final decisions.
Cronos Launch opened on September 15, followed by Ult on September 17. The September governance document listed the purchasing contract as being developed. Subsequent execution hashes will show the amounts bought and burned.
The post Cronos Token Burn Removes 228 Million CRO as Voters Back Buybacks appeared first on Blockonomi.
TLDR:
- Cathie Wood challenges Bill Ackman on inflation, arguing that stronger real growth and falling technology costs can explain higher rates.
- Bill Ackman questions whether higher borrowing costs can slow AI infrastructure investment when companies expect exceptionally large returns.
- Wood cites a 99.99% annual decline in AI inference costs at constant performance, presenting the figure as support for benign deflation.
- Wood links cheaper AI to expanding usage, citing OpenAI revenue run rate growth from $20 billion to $70 billion in her economic argument.
The ARK Invest CEO, Cathie Wood, has challenged Bill Ackman over whether artificial intelligence will fuel lasting inflation. She argues falling AI inference costs could support stronger economic growth while limiting pressure on consumer prices. Her response follows concerns that Federal Reserve rate increases could fail to restrain continued investment in computing infrastructure.
Wood also places the 10-year Treasury yield near its historical median, citing records dating to 1790. The disagreement highlights how cheaper technology and heavy construction spending could push inflation in different directions. Both investors question conventional assumptions, but they offer sharply different readings of the economic consequences.
Cathie Wood Challenges the Inflation Case Behind Rate Hikes
The Federal Reserve raised its benchmark rate by 25 basis points on September 16, 2026. That increased the target range to 3.75%–4.00%, following a unanimous vote. Officials said inflation remained elevated and reaffirmed their commitment to a 2% target.
Bill Ackman questioned that decision in a September 25 post on X. He suggested demand for computing capacity and energy could remain strong despite more expensive borrowing. Companies pursuing major AI breakthroughs may keep investing because they expect unusually large returns.
His concern centers on financing costs becoming embedded in goods and services. If AI investment stays resilient, tighter policy could raise costs without reducing that spending sufficiently. He warned that this could create a cycle of rising costs and further rate increases.
Cathie Wood offered a different interpretation on September 29, pointing to real yields and growth exceeding expectations. Real yields represent returns after adjusting for inflation. Under her argument, higher rates can reflect stronger economic prospects while productivity improvements help contain prices.
The Fed also reported solid economic expansion, strong productivity growth, and robust capital investment in September. Its statement still identified elevated inflation as a continuing problem. This combination suggests efficiency gains can coexist with price pressures while companies build infrastructure and expand their operations.
For Cathie Wood, the historical yield comparison provides context for evaluating those increases. However, a historical median alone cannot establish whether current policy is restrictive. Inflation expectations, borrowing conditions, and productivity trends also matter when assessing the economic effects of higher rates.
Falling AI Inference Costs Reshape the Inflation Debate
In the October edition of ARK’s In The Know, Cathie Wood highlighted sharply falling technology costs. She cited a 99.99% annual decline in AI inference costs at a constant performance level. Inference refers to running a trained model to generate outputs, including answers and predictions.
That estimate compares the expense of delivering similar capabilities as models and computing systems improve. Its broader economic impact depends on how widely businesses adopt those efficiencies. Potential savings could support automation, lower service costs, and expand access to tools previously considered expensive.
Cathie Wood linked those changes to OpenAI’s revenue run rate rising from $20 billion to $70 billion. She presented that increase as evidence that cheaper AI can encourage substantially greater usage. A run rate expresses revenue on an annualized basis, rather than a completed year of reported sales.
She describes the potential result as benign deflation, with productivity gains supporting output as production costs fall. That differs from falling prices caused by weakening demand. Yet cheaper inference can coexist with expensive electricity, land, and construction during a rapid infrastructure buildout.
Bill Ackman’s concern involves demand for data centers and other physical infrastructure that support AI services. Cheaper inference could increase usage, adding pressure to electricity supplies and computing capacity. That makes the speed of new supply relevant alongside the pace of technological improvement.
Cathie Wood also cited US money supply growth near 5.7%, arguing it had not triggered renewed inflation. ARK’s briefing placed 90% of global data center financing in the United States.
The post Cathie Wood Challenges Bill Ackman Over AI Driven Inflation Fears appeared first on Blockonomi.
TLDR:
- Trump Dividend proposes $5,000 per adult citizen if Republicans retain Congress, subject to congressional approval and unresolved financing.
- The estimated $1.2 trillion payout exceeds projected annual tariff revenue, prompting concerns about federal borrowing and inflation.
- CMS schedules $90 rebates for 20.8 million eligible Medicare beneficiaries, with most direct deposits expected around October 8.
- Published research estimates a 0.6% Bitcoin price increase from initial pandemic checks, without predicting effects of future payments.
The Trump Dividend proposal promises $5,000 per adult U.S. citizen if Republicans retain Congress in the November 3 elections. President Donald Trump repeated the pledge on October 3, leaving the estimated $1.2 trillion cost and its funding unresolved. Congress would need to approve funding before the administration could distribute the proposed stimulus checks.
Bitcoin traded near $84,850 on Sunday after retreating from Friday’s advance above $87,000. Separately, Medicare beneficiaries have a funded $90 rebate scheduled this month under an existing federal program. Those payments cover more than 20 million eligible people and carry no condition involving the midterm election results.
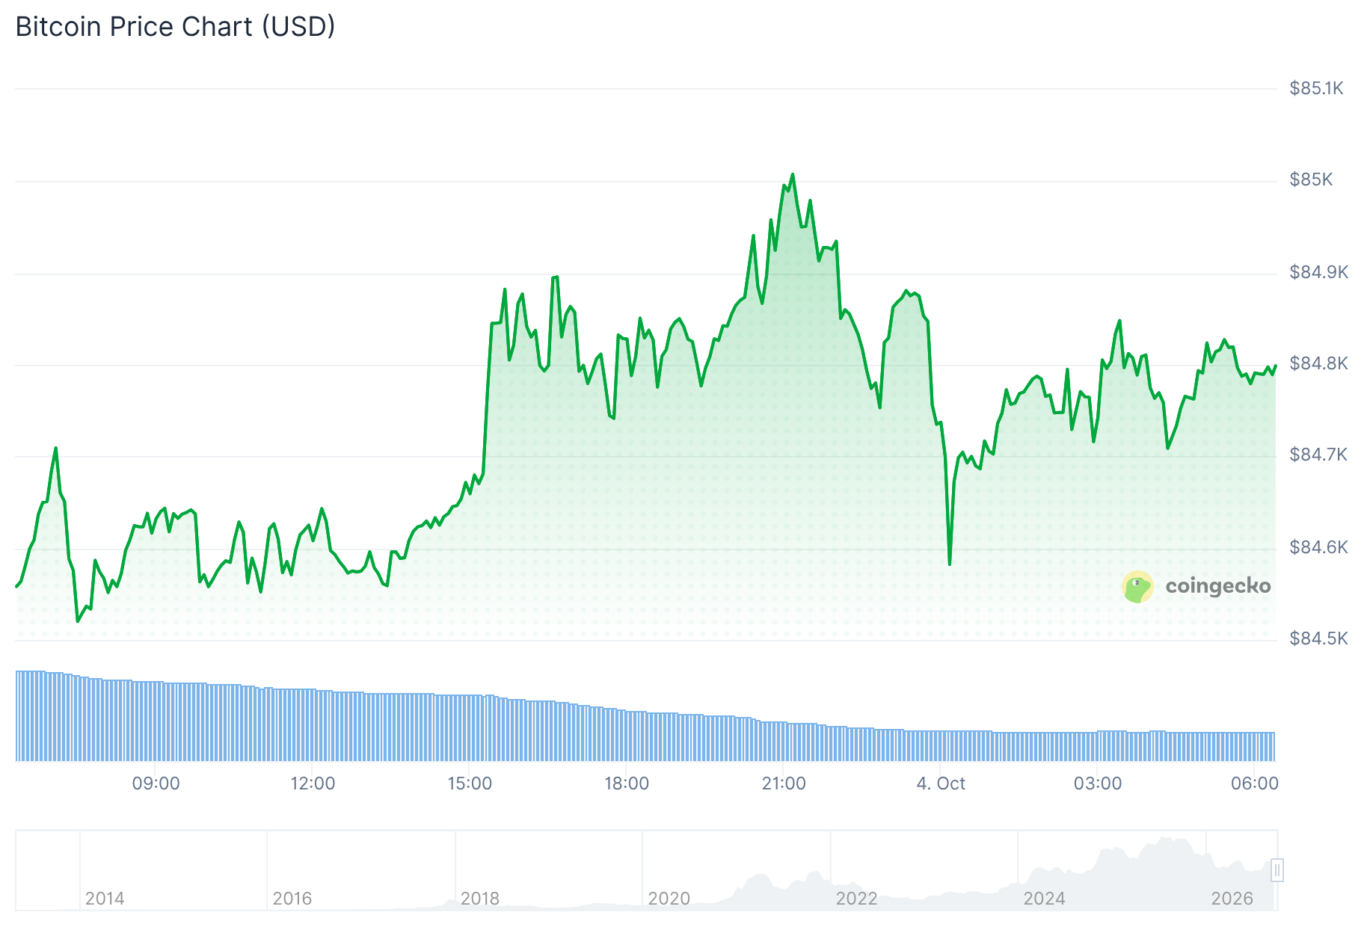
Trump Dividend Faces Funding Hurdles and Congressional Review
Trump first announced the Trump Dividend at a Republican convention in Dallas on September 9. He framed the payment as sharing economic gains, conditional on Republican control of the House and Senate.
Using roughly 245 million adult citizens, the proposed nationwide payout would cost approximately $1.23 trillion. That calculation assumes universal adult eligibility before any income limits reduce the recipient count.
Trump and Vice President JD Vance have pointed to tariff revenue to fund it. Private investment pledges do not automatically become federal revenue available for household payments.
Tax Foundation economist Erica York projects $125 billion in net revenue from new tariffs during 2027. That would cover one-tenth of the Trump dividend, requiring almost a decade to meet the cost.
The Committee for a Responsible Federal Budget warns that tariff revenue already appears in deficit projections. It says the payout could increase borrowing and inflation without spending cuts or additional income.
Congress controls federal spending through appropriations, so an election victory would not itself authorize the proposed stimulus checks. Ohio Senator Bernie Moreno says he intends to prepare legislation for consideration after the November 3 vote.
The election condition has drawn accusations of vote buying, although that criticism does not establish a criminal violation. Legal experts cited by PolitiFact suggest a payment benefiting all Americans could be legally permissible.
Officials have not published final eligibility rules or a payment timetable for the Trump Dividend. Earlier proposals involving DOGE savings and $2,000 tariff payments also failed to produce nationwide checks.
Medicare Rebates Advance as Bitcoin Stimulus Debate Grows
The Medicare rebate draws from the Medicare Improvement Fund, holding $2 billion authorized by Congress. CMS identifies 20.8 million eligible beneficiaries, putting total payments at approximately $1.87 billion.
Most recipients should receive direct deposits around October 8, while paper checks will arrive later in October. Eligibility covers qualifying Original Medicare Part B enrollees living in the United States.
Medicare Advantage members do not qualify, nor do people receiving Medicaid premium assistance or paying income-related premium adjustments. The rebate operates separately from the Trump Dividend and does not require Republicans to win Congress.
Past stimulus checks offer evidence about household Bitcoin purchases, although they cannot establish how recipients would invest future payments. A Management Science study estimates initial pandemic payments increased Bitcoin buying volume against the U.S. dollar by 3.8%.
The researchers estimated a 0.6% Bitcoin price increase attributable to those payments. The finding concerns the first payment round and does not explain Bitcoin gains across 2020 and 2021.
The pandemic period also included near zero interest rates and substantial Federal Reserve asset purchases. Those simultaneous policies complicate efforts to separate the influence of cash payments from broader liquidity conditions.
The Trump Dividend could send money toward digital assets if enacted, but the share households would invest remains unknown. If tariff revenue falls short, borrowing costs and monetary policy could influence Bitcoin alongside household investment.
Saturday’s trading followed losses in leveraged positions across the crypto market. Liquidations reached approximately $434 million over 24 hours, including about $322 million in long positions.
The post Trump Dividend Pledge Ties $5,000 Checks to 2026 Midterm Victory appeared first on Blockonomi.
TLDR:
- Bitcoin crash warning links Monday fears to Fed policy and yields. The Benner cycle comparison does not establish a scheduled crash.
- Bitcoin Cash gained 1.59% to $317.75, outperforming Bitcoin. Rotation into established forks remains a possible explanation for the divergence.
- BCH holds above its seven-day moving average with RSI at 63.52. Trading volume fell about 37%, weakening confirmation of the advance.
- BCH faces support at $306.59 and resistance around 328–330. A support break could expose $288.93 as Bitcoin and ETF flows shape sentiment.
The Bitcoin crash warning circulating on X links possible Monday turmoil to Federal Reserve policy and tightening liquidity. The post compares the S&P 500 with the Benner cycle, a historical framework for interpreting market fluctuations. However, that comparison does not establish that a crash will occur on October 5.
According to recent market data, Bitcoin Cash rose 1.59% to $317.75 over 24 hours, outperforming Bitcoin’s 0.25% gain. The divergence has fueled discussion about interest in established Bitcoin forks. Yet falling trading volume complicates the bullish picture. The warning offers a possible scenario rather than evidence of an imminent market breakdown.
Bitcoin Crash Warning Links Fed Policy to Yield Pressures
The Bitcoin crash warning argues that the Fed faces conflicting pressures from inflation, borrowing costs, and slowing growth. Higher rates could increase financing expenses, while easing could strengthen demand and revive inflation risks.
The post claims long-term Treasury yields have reached their highest levels since 2007. It also cites roughly $40 trillion in U.S. debt and compares potential American policy constraints with Japan. Those claims belong to the account’s forecast and require checking against specific Treasury maturities and reporting dates.
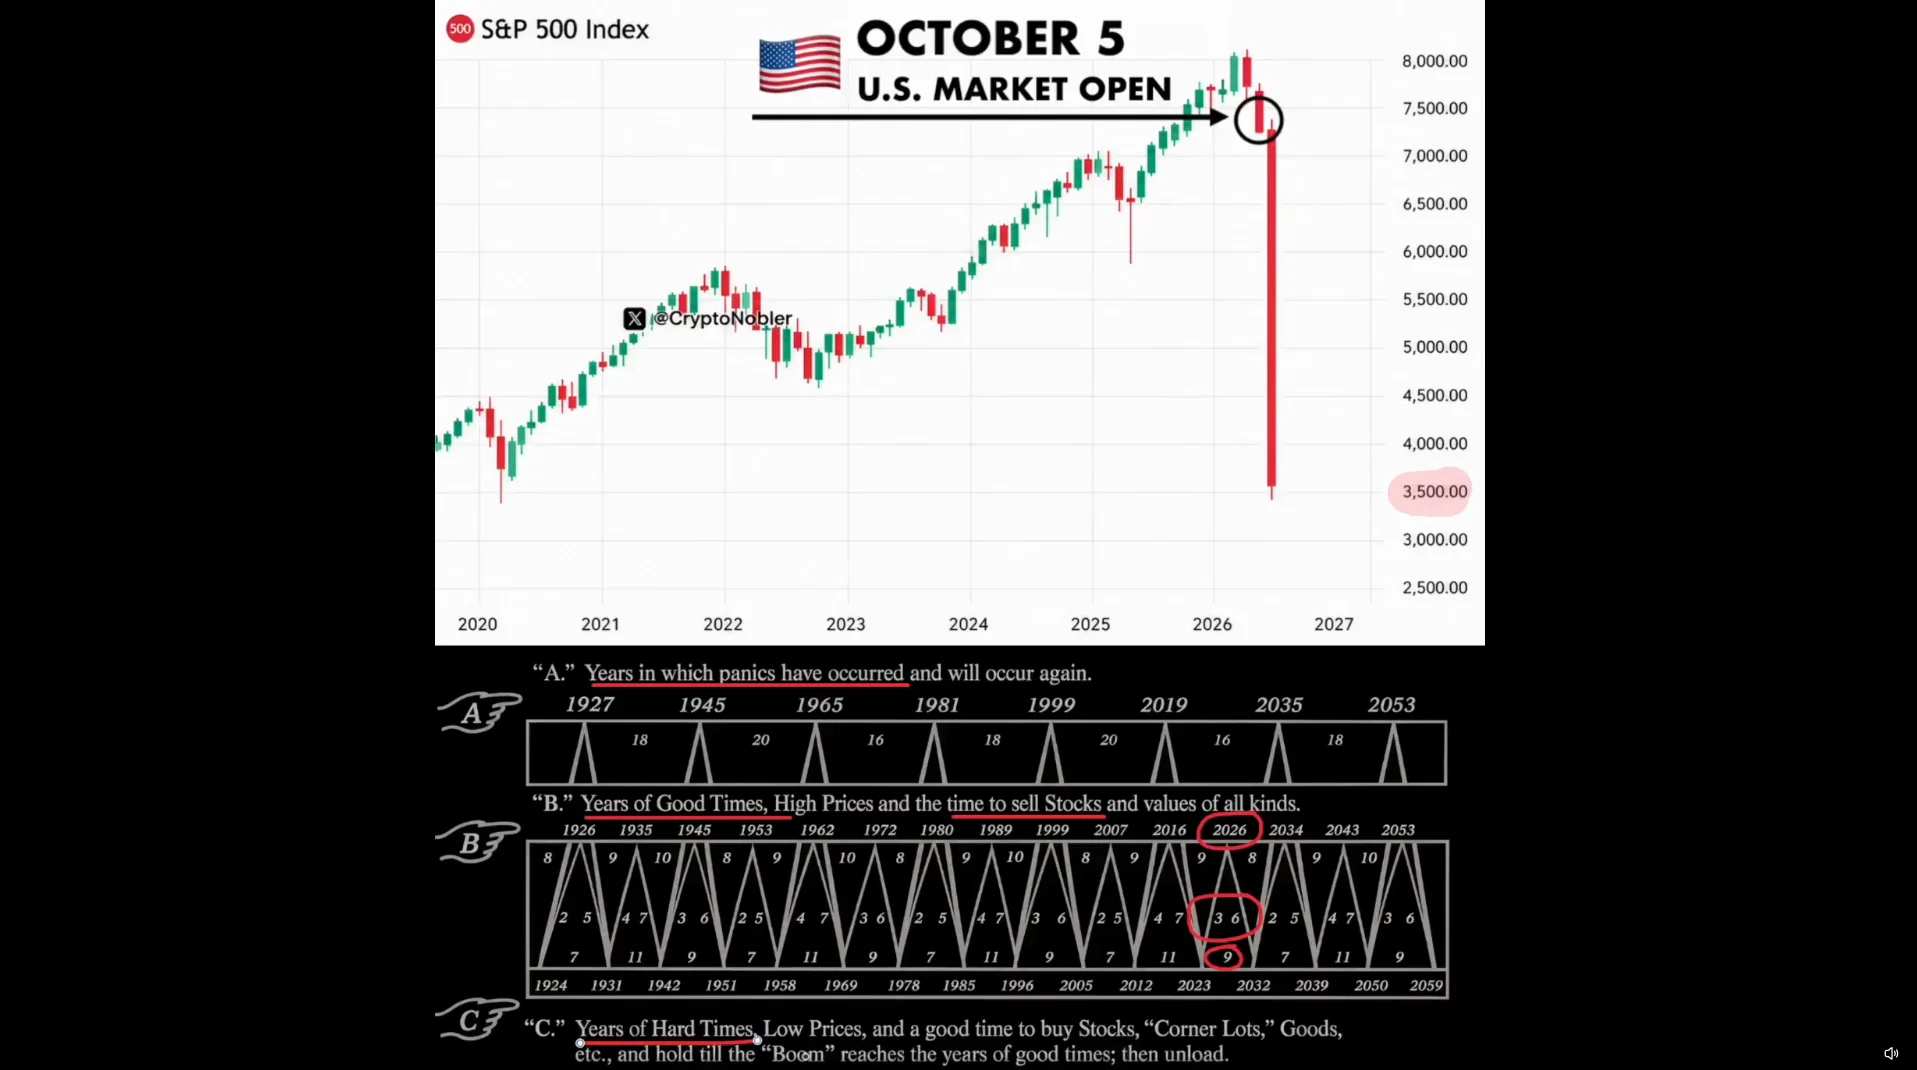
Long-term yields differ from the overnight policy rate. Treasury publishes market-based readings across maturities rather than one universal yield. U.S. Department of the Treasury
Official Federal Reserve guidance describes a broader process. Policy changes affect borrowing costs and financial conditions, but their economic effects are neither direct nor immediate. That weakens any suggestion that one rate decision automatically produces a crash.
For the Bitcoin crash warning, the proposed transmission mechanism is tighter liquidity followed by falling asset values. The account includes stocks, bonds, silver and Bitcoin among assets vulnerable to forced selling.
Such selling can occur when investors need cash or leveraged positions breach margin requirements. However, identifying that possibility does not establish its scale, timing or likelihood.
Another distinction concerns the calendar. The Fed lists its next scheduled policy meeting for October 27–28, rather than October 5. Markets can still move before meetings as investors reassess inflation and growth.
The Benner cycle comparison therefore remains an interpretation of past patterns. The Bitcoin crash warning supplies no demonstrated link between that pattern and a particular Monday selloff.
BCH Gains as Thinner Trading Volume Clouds Bullish Momentum
The Bitcoin crash warning contrasts with relative strength in Bitcoin Cash, although that strength does not remove broader risks. Social commentary has linked interest in BCH and Bitcoin SV to derivatives headlines and possible rotation.
$BSV MARKET UPDATE | OCT 2026
Bitcoin SV ($BSV) trades near $19.30 – $19.70, consolidating its recent 20% gains triggered by capital rotation into established forks!
Key Catalysts right now:
Fork Sympathy Surge: Capital rotated heavily into BCH and BSV following…
— Lucky (@Lucky_m_X) October 3, 2026


That explanation remains tentative. Differences in returns do not prove investors sold Bitcoin to fund purchases of its forks. The rally also lacks a clearly identified BCH-specific announcement in the accompanying market commentary.
Technical readings place Bitcoin Cash above its seven-day simple moving average at $313.88. Its 14-period relative strength index stands at 63.52, indicating positive momentum below the conventional overbought threshold.
However, 24-hour trading volume fell approximately 37% to about $152.9 million. Less turnover provides weaker confirmation of the advance, although volume alone does not measure available market liquidity.
The nearest outlined support is $306.59, corresponding to the 38.2% Fibonacci retracement. Holding that area could support another test of $328.44, followed by the wider 328–330 resistance band. These Fibonacci levels trace the latest correction from a recent BCH swing high of $363.75.
A sustained move through resistance would need stronger participation to improve the technical case. Losing $306.59 would expose the 50% retracement at $288.93.
The Bitcoin crash warning also keeps attention on Bitcoin’s stability and spot ETF flows. Sustained inflows could improve sentiment, while outflows could add pressure across related assets.
Bitcoin Cash remains sensitive to those broader conditions despite its daily outperformance. Bitcoin holding above $84,000 remains a near-term reference point, alongside BCH volume and its response around Fibonacci support.
The post Bitcoin Crash Warning Flags Monday Risk as Bitcoin Cash Gains appeared first on Blockonomi.
CryptoPotato
Robert Kiyosaki, who has frequently put BTC, ETH, silver, and gold into the same investment bracket, has compared owning some of these assets to carrying insurance against financial trouble.
The author of best-sellers such as “Rich Dad, Poor Dad” said preparing for monetary instability is not the same as predicting disaster. Moreover, he used the opportunity to lash out against government-issued money.
Financial Prepper
In his latest post on X, the renowned author called himself a “financial prepper,” arguing that holding gold, silver, and bitcoin is like buying insurance: people don’t buy car insurance because they want to crash, but because they want protection if something goes wrong.
He framed the argument around a conversation with a woman who reportedly questioned whether preparing for economic trouble was overly pessimistic.
“Do you own any gold, silver, bitcoin?” Kiyosaki asked, then reiterated one of the central themes of his investment philosophy: “I only want money government cannot print.”
His concerns are familiar, including the loss of purchasing power caused by inflation and monetary expansion. In his view, holding scarce assets outside government-issued currencies provides a degree of protection against those. Bitcoin fits that thesis particularly well because its supply is capped at 21 million coins, though scarcity alone does not guarantee the asset will preserve purchasing power over any specific period.
Kiyosaki’s BTC Bull Case
It’s worth noting that Kiyosaki’s latest comments are significantly less apocalyptic than some of his other recent warnings, but the underlying strategy has barely changed.
As we previously reported, the renowned investor warned that rising debt, inflation, energy-related geopolitical tensions, and weaknesses in traditional retirement systems could converge into a much larger financial crisis. As usual, he proposed owning BTC, gold, and silver, which he regards as alternatives to traditional fiat-based savings.
He has also continued buying during periods of market weakness. After sounding the alarm a few months ago that the financial crash “accelerates,” the author said he was accumulating assets including BTC and ETH rather than retreating into cash. However, his public stance has changed a few times on the topic. In June, for example, he explained why he wasn’t buying the BTC and ETH dip yet, even though prices bottomed within a week or so.
The post Why Robert Kiyosaki Treats Bitcoin and Gold Like Insurance appeared first on CryptoPotato.
PeckShield counted 55 major crypto hacks in September, totaling $766.49 million in losses.
That is about 462% above August’s $136.3 million, and two incidents account for nearly all of it.
Two Breaches Dominate the Month
The Bitget incident, at about $387 million, and the Liquid Network theft of about $320 million, of which $285 million was returned, are now the largest and second-largest crypto thefts of the year to date, PeckShield noted. They moved past the Drift and KelpDAO/LayerZero exploits. But take them out and the other 53 hacks add up to about $59 million, under half of August’s total.
As CryptoPotato reported earlier, Bitget stated that its security systems flagged unauthorized transfers from parts of its hot wallets at 18:31 UTC on September 24. CEO Gracy Chen explained that the attacker got into a backend system in the wallet infrastructure, spoofed transaction data, and tricked the authorization process into releasing funds.
The CEO ruled out a private key compromise and noted that cold wallets, which hold most of the exchange’s assets, were not touched. The exchange plans to cover the loss from its User Protection Fund, which holds more than $464 million.
“We will not run away from this, and every dollar will be accounted for,” Chen wrote on X.
The Liquid Network loss came earlier, on September 6, when purported white-hat hackers withdrew roughly 4,000 BTC from the Liquid Federation wallet. The withdrawal used the SideSwap peg-out authorization key, though Liquid noted that the key itself was not compromised.
In on-chain messages to Blockstream, the hacker promised to send the money back once every node was patched. Ledger CTO Charles Guillemet was skeptical, pointing out that legitimate security researchers would not typically drain a bridge and then ask to be contacted on-chain.
Laundering Trail and Smaller Losses
SlowMist wrote in a September 29 update that North Korea-linked hackers are laundering the stolen Bitget funds by pairing CoW Protocol orders with Chainflip deposit addresses, converting the proceeds to BTC and then using CoinJoin to obscure the movements.
Cos, SlowMist’s founder, argued that anti-money laundering checks are falling behind automated scripts. Chainflip is trying to block the flows and has rejected at least one deposit but refunded the money instead of freezing it.
The other eight entries in PeckShield’s top 10 ran from $3.15 million to $7.81 million. The largest was a front-run involving the MEV bot “yoink,” which was returned.
Payment Processor V2, the LimitBreak contract at the center of a September 25 white-hat rescue, accounted for $6.6 million, with $3.4 million returned. In that operation, security researcher Quit moved 23,155 NFTs worth nearly $6 million out of exposed wallets, while a separate exploit path left 660WETH unrecovered.
The post Crypto Hacks Hit $766M in September With Bitget and Liquid Leading Losses appeared first on CryptoPotato.
The Independent Community Bankers of America has sued the Office of the Comptroller of the Currency over rules allowing crypto-focused firms, such as Circle, Ripple, BitGo, and Paxos, to obtain national trust bank charters.
This comes just as a few of those companies secured final approval for their own federally supervised trust bank charters and could have broader implications for the growing number of digital asset entities pursuing similar licenses.
Side Door
The press release shared by the ICBA says that the center of the dispute is the final rule published by the OCC in March 2026 clarifying that national banks limited to trust-company operations can also conduct related non-fiduciary activities. The regulator noted at the time that the rule neither expanded nor contracted its existing chartering authority.
President and CEO Rebeca Romero Rainey said her organization strongly disagrees and argued that Congress never intended the national trust charter to become a “side door” through which crypto companies could receive the credibility of a federal bank charter while also avoiding requirements such as FDIC insurance, Community Reinvestment Act obligations, and the capital and liquidity framework applicable to insured depository institutions.
The lawsuit asks the US District Court for the District of Columbia to declare both the OCC’s final rule and the related Interpretive Letter N1176 unlawful.
Crypto Companies Go Deeper Into Banking
The lawsuit comes just months after several major developments for the crypto industry. As reported recently, Circle received the OCC’s final authorization to establish First National Digital Currency Bank, N.A., which will operate as Circle National Trust. The development allowed the USDC issuer to provide fiduciary crypto custody to itself and affiliates and could eventually bring parts of its stablecoin reserve management under direct OCC supervision.
However, the escalating situation now is not isolated to Circle. Ripple previously secured approval to establish Ripple National Trust Bank. Other crypto-focused firms, including BitGo and Paxos, have also been involved in the OCC’s recent trust-bank approval process.
ICBA’s lawsuit argues that the OCC may be creating a pathway for digital asset firms to gain the credibility and benefits of federal banking supervision without being regulated the same way, not just that one crypto company received the green light.
The post US Banking Group Sues OCC After Wave of Crypto Trust Bank Approvals appeared first on CryptoPotato.
XRP is consolidating after a sharp recovery from the $1.00 area, with price now holding well above the major support zones visible on the daily chart. The broader structure has improved, although the 4-hour chart shows that XRP is still trading beneath a descending trendline and remains capped by the $1.60-$1.70 resistance region.
XRP Price Analysis: The USDT Pair
On the daily timeframe, XRP has established a significant rebound from the $1.00 support zone. The subsequent rally pushed the price back above the 100-day and 200-day moving averages, which have started to flatten and turn higher around $1.30. This represents a notable structural improvement compared with the prolonged downtrend seen through the first half of the year.
XRP is currently trading around $1.49, with the nearest support located around $1.30. This zone is particularly important because it aligns with the recent breakout area and the daily moving averages. As long as XRP remains above this region, the broader recovery structure remains intact.
On the upside, the main resistance is the $1.60-$1.70 zone, which has already capped the recent advance. A sustained move through this area would put the next major resistance around $1.80-$2.00, followed by the more critical $2.40 supply zone visible on the chart.
The daily RSI has also cooled considerably from its recent overbought reading and is now around the middle of its range. This suggests that momentum has normalized rather than showing an obvious overbought condition. A renewed move higher while RSI expands could therefore provide additional confirmation of bullish momentum.
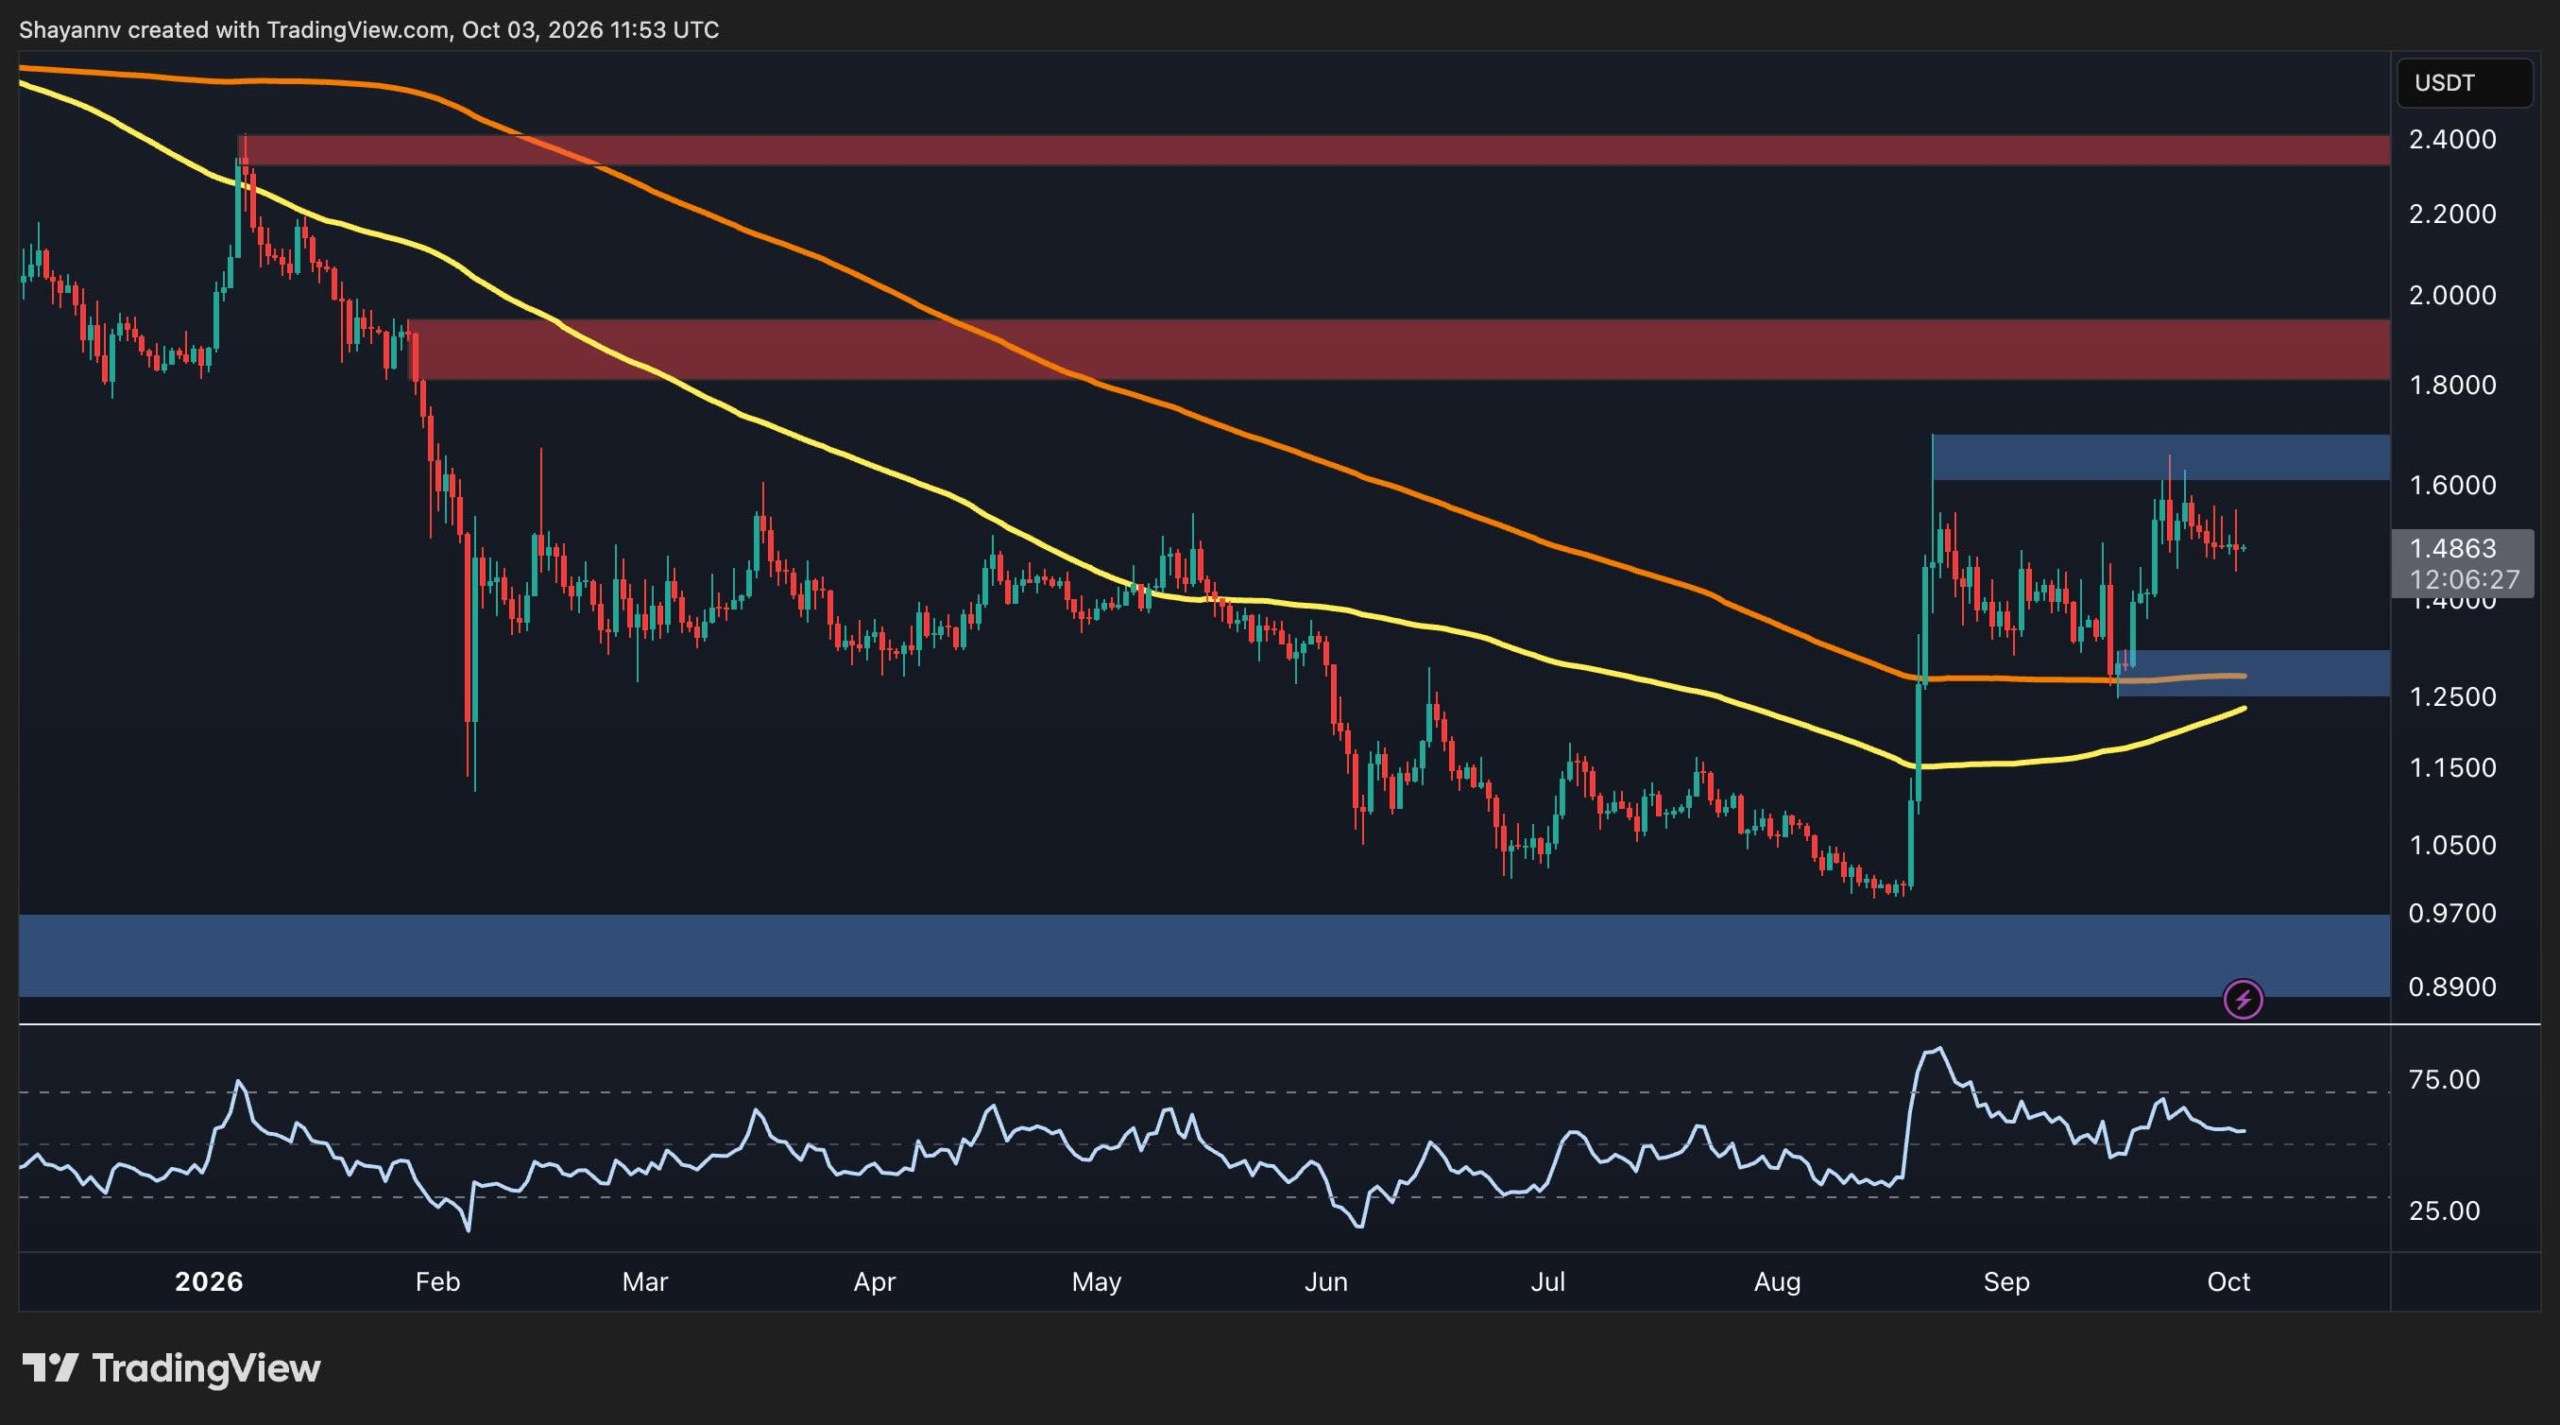
The 4-Hour Chart
The 4-hour chart shows a more cautious picture. XRP rallied toward the $1.60-$1.70 resistance level in late September but subsequently formed a series of lower highs beneath a descending trendline. The asset is currently around $1.49, leaving the trendline as an important short-term obstacle.
The immediate support sits around $1.45, marked by the green horizontal zone. XRP has repeatedly consolidated around this area, making it an important level for the short-term structure. A decisive loss of this support could expose the broader $1.20-$1.30 demand zone.
On the other hand, a breakout above the descending trendline would likely break the current corrective structure. XRP would then need to reclaim the $1.60-$1.70 resistance zone to establish a clearer continuation of the recent recovery.
Overall, the charts show a recovery structure that remains constructive above $1.20-$1.30, but XRP still needs to overcome $1.60-$1.70 to confirm a stronger bullish continuation. A break below $1.45 would instead increase the risk of another move toward the lower support zone.

The post Ripple Price Analysis: XRP’s Tightening Consolidation Puts $2 Breakout in Focus appeared first on CryptoPotato.
Bitcoin is trading around $84.7K after a strong recovery from the $60K area over the past couple of months. The charts show improving market structure, but BTC is now approaching a significant resistance cluster at $88K.
Meanwhile, futures taker flow has turned predominantly buyer-driven again, providing a constructive momentum signal, although the price still needs to clear resistance before the broader upside structure can extend.
Bitcoin Price Analysis: The Daily Chart
The daily chart shows a notable structural improvement over the summer. BTC established a base around the $60K area before spending several weeks consolidating and eventually breaking sharply higher from the $66K region. The move through the $75K area shifted the market into a sequence of higher highs and higher lows.
BTC is currently trading near $84.7K, with the immediate resistance zone extending from roughly $86K to $88K. This area has already capped recent attempts higher and therefore represents the main hurdle for the current recovery. As a result, a daily breakout above $88K would strengthen the bullish structure and expose the next major resistance area around $96K.
On the downside, the first meaningful support sits around $74K-$78K. This zone previously acted as a consolidation area before the latest impulsive move and could become an important bullish order block if the current resistance rejection develops into a deeper correction. Below it, another notable support region is visible around $66K.
The 100-day and 200-day moving averages are also becoming more constructive. The 100-day average has turned upward aggressively, converging toward the 200-day average around $72K. As long as BTC remains above these averages, the broader recovery structure remains intact. Additionally, a bullish crossover could be the key sentiment driver to push the price back above $90K in the coming weeks.
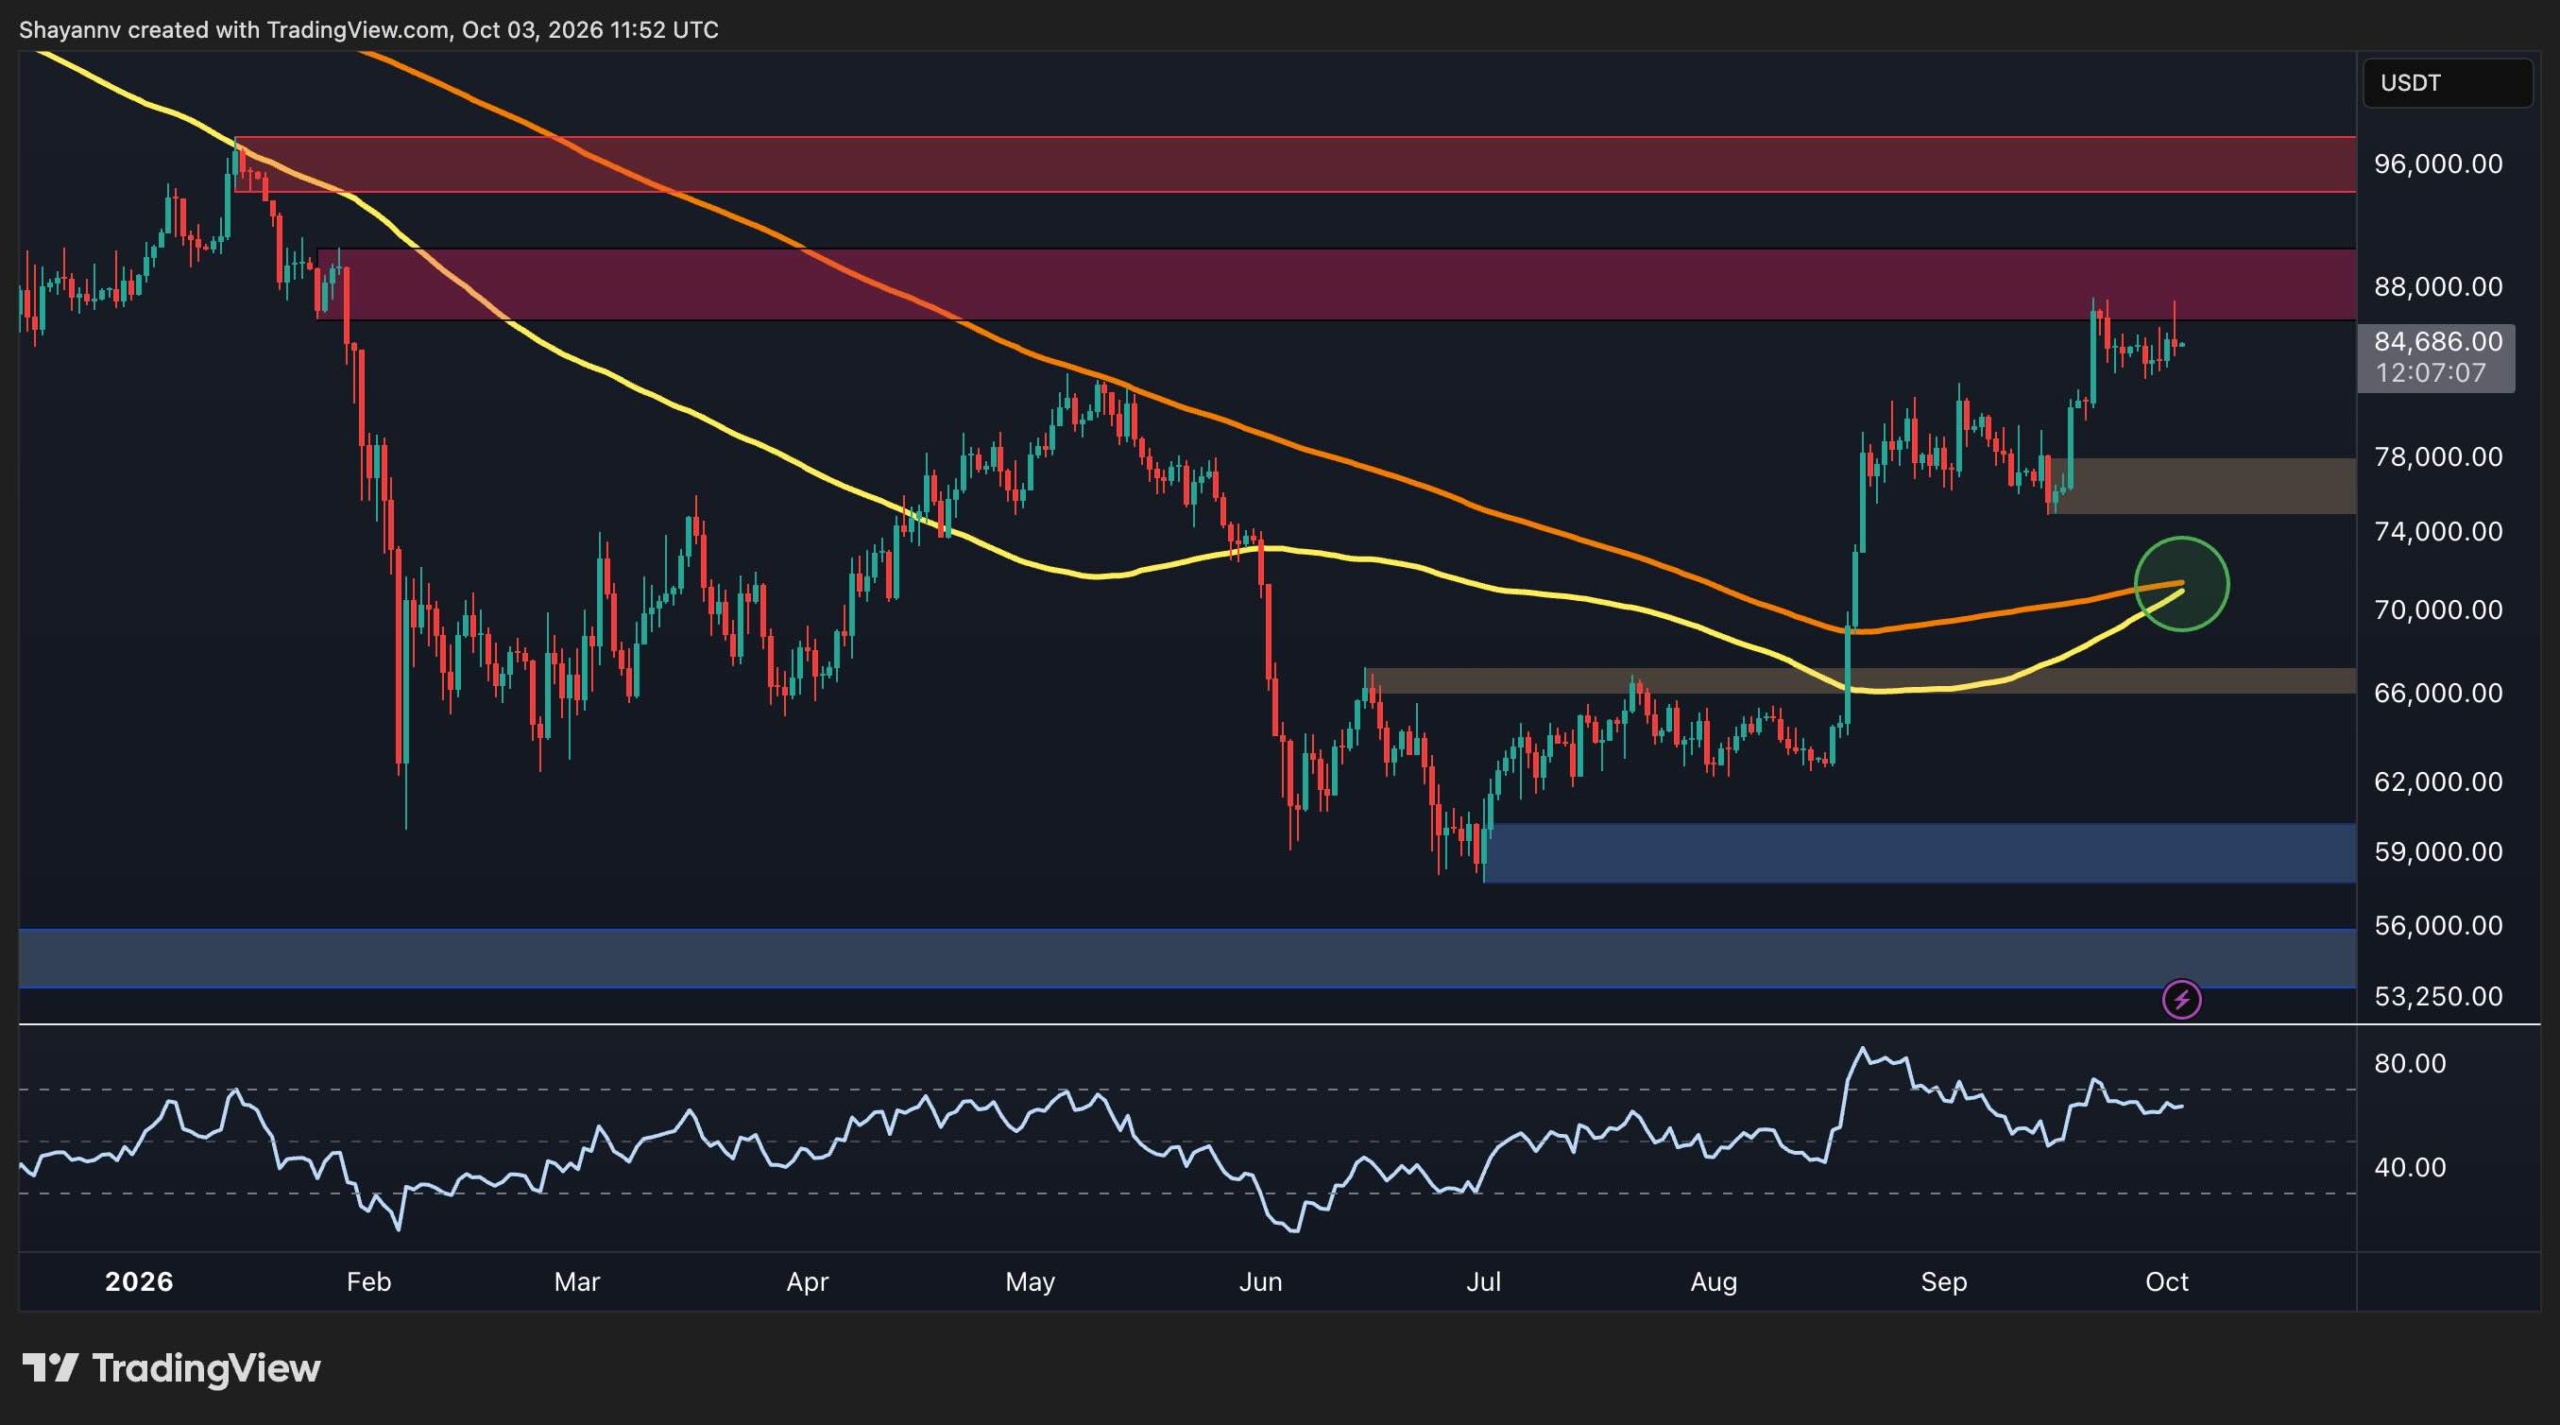
BTC/USDT 4-Hour Chart
The 4-hour chart provides a more precise view of the current consolidation. After surging from the $75K support area, BTC moved rapidly toward $86K and has since been trading sideways.
The most visible short-term structure is a slightly descending range, with the upper boundary around $86K and the lower boundary around $82K. BTC recently tested the upper boundary and was rejected, returning toward $84.7K.
This makes the lower boundary around $82K the first short-term level to monitor. A breakdown below that area could expose the broader $74K-$78K support zone, particularly if selling momentum accelerates. Conversely, a clean 4-hour breakout above $86K would signal that buyers are attempting to resolve the consolidation to the upside.
The RSI on the 4-hour chart, however, has returned toward the 50 area after briefly pushing higher, indicating relatively balanced short-term momentum. This is consistent with the sideways price action rather than a strong trend in either direction.
The broader setup therefore remains one of consolidation following a strong impulse higher. The key technical question is whether the range resolves above $86K or whether BTC loses the $82K floor first.

On-Chain Analysis
The provided chart is specifically a 90-day Bitcoin Futures Taker CVD, which measures the cumulative difference between aggressive futures buyers and sellers. Green periods indicate taker-buy dominance, while red periods indicate taker-sell dominance.
The latest reading has shifted back into green after a period of predominantly neutral-to-bearish futures flow during the decline from the highs. This is notable because the recent recovery toward $85K has been accompanied by renewed aggressive buying in the futures market.
The recent green readings suggest that takers are once again predominantly lifting offers rather than aggressively selling into bids. Historically within the chart, sustained green periods have frequently appeared alongside strong upward price movements, although the indicator itself does not guarantee continuation.
The key issue is that futures buying has been occurring directly beneath the $86K resistance zone. If aggressive buying persists while BTC breaks above that area, it would provide confirmation that the current consolidation is being resolved with stronger demand. If CVD remains green but price repeatedly fails around $86K-$88K, it could instead indicate that aggressive futures buyers are being absorbed by sellers at resistance.
Overall, the charts show an improving structure with BTC holding well above the summer base and futures taker flow turning buyer-dominant again. For the next directional move, $86K on the upside and $82K on the downside are the immediate levels to watch.

The post BTC Price Analysis: Is Bitcoin Gearing Up for $96K or a Retest of $82K? appeared first on CryptoPotato.