Cryptocurrency Posts
Crypto Briefing
JPMorgan traders stay cautious after the worst Treasury selloff in 18 months as the bank models three Middle East scenarios with oil potentially
The post JPMorgan traders remain cautious after Treasury market volatility appeared first on Crypto Briefing.
The Bank of England's cautious approach to energy-induced inflation highlights the delicate balance between controlling inflation and supporting economic stability.
The post Bank of England’s Lombardelli warns energy shocks may force policy response as UK inflation climbs appeared first on Crypto Briefing.
The Bank of England's cautious stance amid energy price volatility suggests prolonged inflationary pressures, impacting future rate decisions.
The post Bank of England sees no clear path to lower energy prices amid volatility appeared first on Crypto Briefing.
PAXGy democratizes access to gold leasing markets, enabling retail investors to earn gold yields, potentially reshaping asset-backed tokenization.
The post Paxos Labs debuts PAXGy gold token across OKX and DeFi platforms appeared first on Crypto Briefing.
Solari Capital's strategic investments in AI, biotech, and crypto signal a transformative shift towards integrating programmable technologies across industries.
The post Solari Capital emerges from stealth with $350M deployed across AI, biotech, and crypto appeared first on Crypto Briefing.
Bitcoin Magazine
Bitcoin Magazine
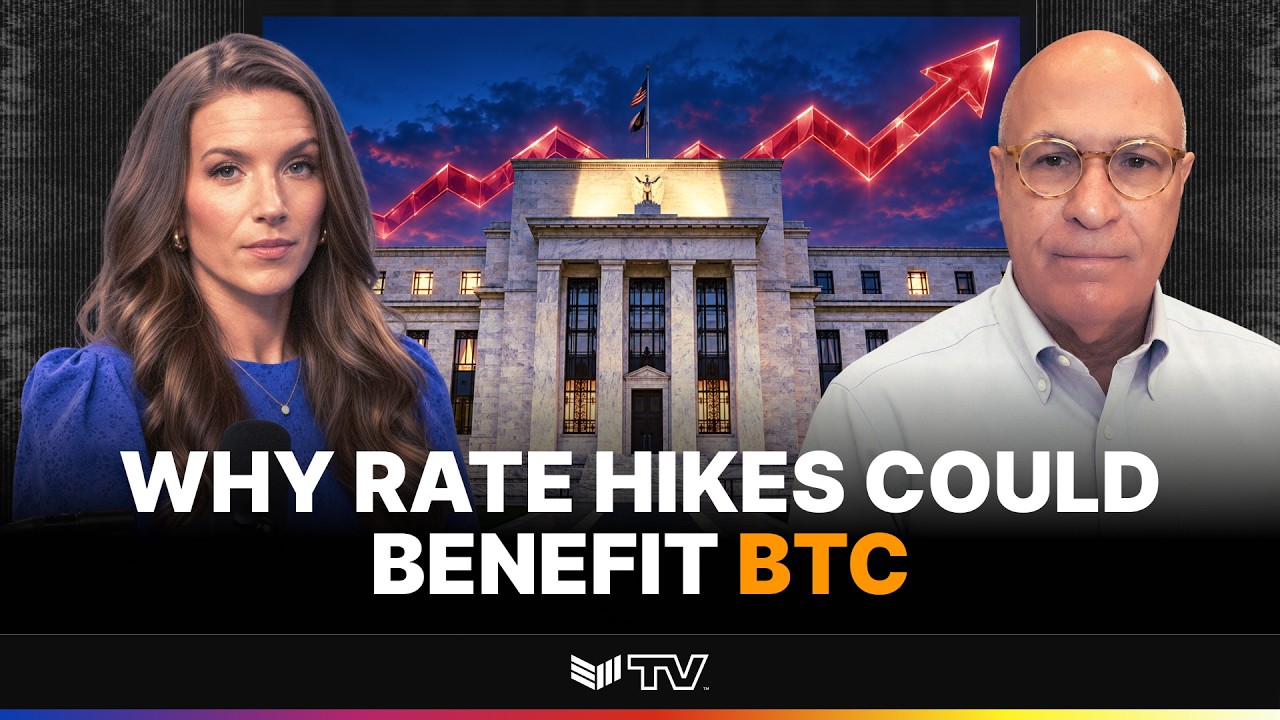
Former CFTC Commissioner Giancarlo: Why Rate Hikes Could Benefit Bitcoin
Government spending and currency debasement are making Bitcoin’s case stronger than ever. Chris Giancarlo explains why Bitcoin’s programmed scarcity makes it the digital form of gold and why governments might one day anchor money to a digital commodity. He also explains why Fed rate hikes and rising U.S. debt support Bitcoin’s value proposition.
Chapters:
0:00 Chris Giancarlo on Bitcoin Futures, Spot ETFs and Corporate Treasuries
1:19 Why the CLARITY Act Failing Isn’t a Setback for Bitcoin
3:07 Why Tokenized Money Can’t Be Reversed
4:42 Bitcoin as Digital Gold and a Hedge Against Debasement
6:57 How the CFTC Can Keep Bitcoin Innovation in the U.S.
8:40 The 2008 Financial Crisis and Giancarlo’s Bitcoin Eureka Moment
10:07 How Chris Giancarlo Became “Crypto Dad”
11:08 Tokenization of Every Securities Offering by 2036
14:11 Stablecoins, the GENIUS Act and Demand for U.S. T-Bills
15:29 Where Bitcoin Goes After Fed Rate Hikes
DISCLAIMER: The views and opinions expressed in this show are those of the participants and do not necessarily reflect the official policy or position of BTC Inc., Bitcoin Magazine, or any affiliated entities. This content is provided for informational and educational purposes only and should not be construed as investment, legal, tax, or accounting advice. Nothing contained in this show constitutes a solicitation, recommendation, endorsement, or offer to buy or sell any securities or financial instruments. Viewers should consult their own advisors before making financial or business decisions.
This post Former CFTC Commissioner Giancarlo: Why Rate Hikes Could Benefit Bitcoin first appeared on Bitcoin Magazine and is written by Patrick Green.
Bitcoin Magazine

Bloomberg’s James Seyffart: Why Trillions in Advisor Wealth Could Flow Into Bitcoin
Trillions in advisor wealth may still be sitting on the sidelines of Bitcoin. James Seyffart explains how wirehouse rules at firms like Morgan Stanley and JPMorgan still restrict how financial advisors can buy Bitcoin ETFs for clients. He walks through target allocations, why many advisors chose to wait out the bear market, and how a small shift in allocation could bring big new demand.
Chapters:
0:00 Bitcoin ETFs See Nearly $1 Billion in Daily Inflows
1:08 Why the $82K Bitcoin ETF Cost Basis Matters
4:11 Can ETF Flows Actually Move the Bitcoin Price?
5:42 New Buyers, Target Allocations and Advisor Demand
7:51 Wirehouse Rules Holding Back Bitcoin ETF Buying
9:05 Who’s Really Selling Bitcoin: Spot Holders vs. ETF Investors
10:17 Hedge Funds and the Bitcoin Basis Trade Unwind
11:24 Will Bitcoin ETFs Surpass Gold ETFs?
13:08 The Overlooked Data Point: $30–40 Trillion in Advisor Wealth
14:19 A Dampened Four-Year Cycle and Bitcoin as a Risk Asset
DISCLAIMER: The views and opinions expressed in this show are those of the participants and do not necessarily reflect the official policy or position of BTC Inc., Bitcoin Magazine, or any affiliated entities. This content is provided for informational and educational purposes only and should not be construed as investment, legal, tax, or accounting advice. Nothing contained in this show constitutes a solicitation, recommendation, endorsement, or offer to buy or sell any securities or financial instruments. Viewers should consult their own advisors before making financial or business decisions.
This post Bloomberg’s James Seyffart: Why Trillions in Advisor Wealth Could Flow Into Bitcoin first appeared on Bitcoin Magazine and is written by Patrick Green.
Bitcoin Magazine

Brent Johnson: BTC the Best “Pure Play” Asset for Rising Global Liquidity
Is Bitcoin money, or the best pure play on global liquidity? Santiago Capital CEO Brent Johnson makes the case for the latter, explaining why he believes Bitcoin is here to stay as digital assets and stablecoins grow. He shares why global money printing could send Bitcoin much higher, and why he still doesn’t see it replacing the dollar system. It’s a challenging and honest perspective every Bitcoiner should hear.
Chapters:
0:00 Brent Johnson on Why Bitcoin Could Hit $1 Million
1:11 The Dollar Milkshake Theory Explained
2:10 Why a Global Debt Crisis Makes the Dollar Stronger
4:01 10-Year Treasury at 5% and the Sovereign Debt Crisis
6:24 Three Market Signals: Credit Spreads, VIX and the DXY
8:03 “The Band”: The Dollar Index Range the Global Economy Needs
9:53 GENIUS Act, Stablecoins and Global Dollarization
12:07 Why Bitcoin Is a Bet on Global Liquidity
15:23 Where Santiago Capital Invests: Gold, Defense, AI and Tokenization
19:19 Tokenization, 24-Hour Trading and Central and South America
DISCLAIMER: The views and opinions expressed in this show are those of the participants and do not necessarily reflect the official policy or position of BTC Inc., Bitcoin Magazine, or any affiliated entities. This content is provided for informational and educational purposes only and should not be construed as investment, legal, tax, or accounting advice. Nothing contained in this show constitutes a solicitation, recommendation, endorsement, or offer to buy or sell any securities or financial instruments. Viewers should consult their own advisors before making financial or business decisions.
This post Brent Johnson: BTC the Best “Pure Play” Asset for Rising Global Liquidity first appeared on Bitcoin Magazine and is written by Patrick Green.
Bitcoin Magazine
Bitcoin Price Slips While US Treasury Yields Soar, Oil Prices Climb
Bitcoin’s price slid on Wednesday, just as U.S. Treasuries surged, with the 10-year yield climbing above 5% and reaching — its highest level since 2007.
The price of the leading cryptocurrency was down 2% over a 24-hour period Wednesday afternoon in New York, and was trading hands for $84,357.
Bitcoin’s price had surged earlier in the week as investors piled into exchange-traded funds. At one point, it soared as high as nearly $87,330.
JUST IN:
— Bitcoin Magazine (@BitcoinMagazine) September 23, 2026U.S. Treasury Department to buy back up to $6 billion in longer-term debt tomorrow.
Buy Bitcoinpic.twitter.com/nZm3BNqiVH

But its rally has since cooled. It dropped further on Wednesday afternoon around the time the U.S. Treasury said it will purchase up to $6 billion of longer-dated government debt on Thursday.
Bitcoin previously benefited from the Treasury Department’s announcement of buybacks — having its best run in months — but this time dropped.
The 10-year Treasury yield climbed above 5% on Wednesday for the first time in 19 years, after September’s flash PMI data came in well ahead of forecasts and pushed the composite index to a five-year high.
Inflation details added to the pressure: input costs across manufacturing and services rose to their highest level since October 2022, driven largely by fuel and transportation, while wage pressure also strengthened.
Rising yields are typically a headwind for bitcoin’s price. When safe government bonds pay 5%, holding an asset that generates no income becomes more expensive.
Higher rates also tend to strengthen the dollar and dampen appetite for risk-on assets. Bitcoin has repeatedly retreated this year when yields rose on inflation fears, often with ETF outflows and forced selling by leveraged traders amplifying the move.
This post Bitcoin Price Slips While US Treasury Yields Soar, Oil Prices Climb first appeared on Bitcoin Magazine and is written by Mathew Di Salvo.
Bitcoin Magazine
CFTC Chair Selig Says Regulator Is Preparing for ‘24-7, On-Chain’ Markets
Commodity Futures Trading Commission Chair Mike Selig has said that the regulator was preparing for the transition of markets moving “24-7, on-chain.”
Speaking to CNBC on Wednesday, the regulator said that it was an exciting time to be regulating markets related to crypto and artificial intelligence.
The CFTC is fast pushing ahead with rulemaking for the crypto space, despite lawmakers last week blocking the long-awaited Clarity Act. Following the vote on the landmark crypto legislation, Selig said that the watchdog would still help U.S. President Trump “get the job done” in regulating digital assets.
“Our markets are rapidly evolving,” Selig said. “We really have to reevaluate all of our rules and regulations to make sure that we’re ready and prepared for this transition to 24-7 on-chain and these automated markets that are facilitated through the use of algorithms and agentic finance.”
The Clarity Act wants to formally divide oversight between regulators, distinguishing which digital assets are securities, commodities or stablecoins.
But the bill stalled and stumbled this year as the banking lobby had issues with crypto companies paying customers stablecoin rewards and some lawmakers — mostly Democrats — were concerned about the ethics side of the legislation.
Trump received backing from major industry players while campaigning and since becoming president, his family has made money from digital asset ventures.
Some lawmakers have alleged conflicts of interest; the White House has always denied any wrongdoing.
Despite lawmakers blocking the Clarity Act, the CFTC and Securities and Exchange Commission have charged ahead with rulemaking. The CFTC last week sent a proposal to the White House to regulate crypto transactions and markets.
And the SEC went ahead and approved tokenized stocks trading the same week. In August, it also proposed its own framework for crypto asset offerings, pressing ahead while the landmark legislation stalled.
Formerly chief counsel at the SEC’s Crypto Task Force, Selig was described by White House’s Crypto and AI Tsar, David Sacks, as “instrumental in driving forward the President’s crypto agenda”
President Trump in August urged lawmakers to get the Clarity Act over the line, referring to the legislation as “very, very powerful.”
This post CFTC Chair Selig Says Regulator Is Preparing for ‘24-7, On-Chain’ Markets first appeared on Bitcoin Magazine and is written by Mathew Di Salvo.
CryptoSlate
BitMEX has opened withdrawal access to customers in six jurisdictions previously barred from using the exchange after ending operations this week.
On Sept. 24, the crypto derivatives platform said users in the United States, Canada, Hong Kong SAR, Bermuda, Seychelles and Myanmar can now log in, complete identity verification where required and withdraw funds remaining in their accounts.
Those markets had previously been classified as restricted jurisdictions, preventing customers there from accessing BitMEX trading services. The company has lifted those restrictions solely to facilitate fund recovery following its Sept. 23 shutdown.
The change gives former customers who were locked out because of their location a direct route to assets left on the platform as BitMEX winds down its operations. Users whose accounts were previously blocked on jurisdictional grounds can sign in with their existing credentials, complete know-your-customer checks and submit withdrawal requests.
Customers who still cannot access their accounts have been directed to contact BitMEX support.
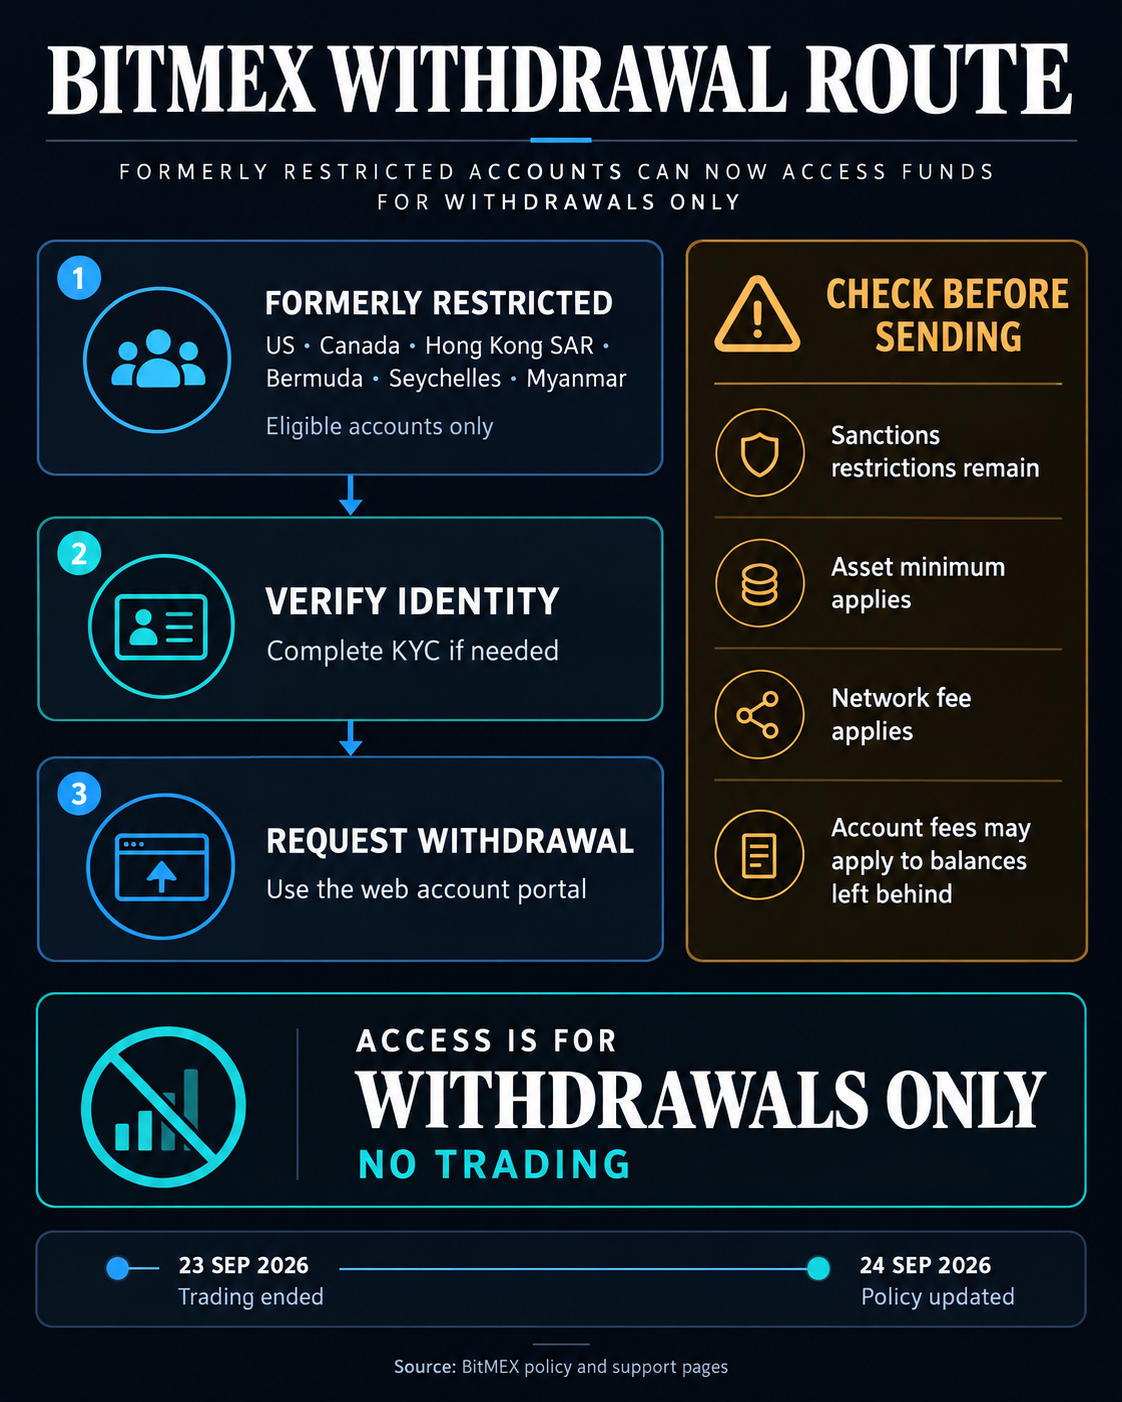
The withdrawal-only exemption follows BitMEX’s decision to cease exchange operations at 04:00 UTC on Sept. 23, ending an 11-year run for one of crypto’s best-known derivatives venues. The exchange has continued to operate account and withdrawal infrastructure while urging customers to remove remaining balances.
The policy distinguishes between jurisdictions BitMEX previously restricted for commercial or regulatory reasons and territories still covered by sanctions.
BitMEX users in sanctioned regions face extra precautions
Customers in Cuba, Iran, North Korea and several Russian-occupied regions of Ukraine remain restricted, as do other users covered by applicable sanctions rules.
BitMEX said withdrawals from those accounts remain subject to compliance checks rather than the broader reopening granted to the six previously restricted markets.
Some users can still apply for access under narrower exceptions.
Iranian nationals living outside Iran who are not subject to US, United Nations or European Union sanctions may request withdrawals after providing evidence that they reside elsewhere. BitMEX said it will review those applications individually.
Russian nationals living in the European Union or Switzerland can also seek access by providing documents proving residence, such as recent utility bills, bank statements or government correspondence.
Still, all withdrawals remain subject to monitoring.
The policy change shifts BitMEX’s remaining operational focus toward returning assets to customers who may have been unable to access them under the exchange’s earlier geographic restrictions.
The company has also warned users not to send new deposits to BitMEX addresses because it no longer credits incoming funds. Users can withdraw existing balances through the web platform, subject to asset minimums and network fees.
Funds that remain on the exchange may also begin attracting account charges as the wind-down progresses, giving customers an incentive to complete withdrawals rather than leave balances behind.
Founded in 2014 by Arthur Hayes, Ben Delo and Samuel Reed, BitMEX grew into a major crypto derivatives venue and helped propel perpetual futures into one of the industry’s dominant trading products. Notably, crypto venture firm a16z described it as “one of crypto’s biggest markets,” with crypto exchanges clearing $86.2 trillion in perp volume last year.
However, regulatory pressure increasingly shaped the sector pioneer's later years.
The exchange pleaded guilty in 2024 to violating the US Bank Secrecy Act and agreed to pay $100 million in penalties. President Donald Trump pardoned the platform's founders, including Hayes, Delo, and Reed, in March 2025.
The post BitMEX opens fund recovery to customers it previously barred from the platform appeared first on CryptoSlate.
On September 6, 2026, Liquid’s federation released roughly 3,996 BTC after its network accepted L-BTC that lacked Bitcoin backing. Liquid is a Bitcoin sidechain whose L-BTC is meant to represent bitcoin held in a federation reserve. A validly authorized withdrawal turned the invalid sidechain state into a real Bitcoin payment worth about $320 million at the time. A payout limit before federation signing might have interrupted that exit.
Alpen Labs CEO Simanta Gautam now says his AI agents traced the flaw and reproduced it locally in about an hour. The work began after he heard of the September 6 attack. His September 22 account and technical report give a detailed explanation of the failed proof check. The demonstration came after the funds left, so its speed says little by itself about whether a standing AI monitor would have raised an actionable warning before the attack.
Elements, the software underlying Liquid, caches successful checks of the cryptographic proofs attached to confidential transactions. A September 1 code change tried to make each cached result depend on all the context that affects verification, including the asset generator and output script. Alpen says the change concatenated those fields as raw bytes without encoding their boundaries. A valid “seed” proof and a different, invalid target could therefore produce identical cache input.
In Alpen’s local replay, fresh verification rejected the target, while the affected cache wrapper accepted it after the seed had populated the cache. A successful cache lookup bypassed the proof check that should have rejected the target. The two statements had the same input bytes for the cache even though they represented different verification requests. This was a local reproduction of the suspected consensus failure. Alpen says exact production validator binaries and historical cache contents were unavailable, leaving the deployed code and live priming path strongly inferred from the source and chain evidence.
SideSwap says a private security build installed on its own node in August accepted the attack transaction. That account narrows the deployment question for one operator but does not identify every federation functionary’s build. On September 8, an Elements repair changed cache keys to encode field lengths, added collision-focused tests and introduced an option to bypass the range-proof cache. Version 23.3.4 followed on September 9. Those changes address the validation gate before invalid L-BTC can become accepted state.
The authorized exit still needed a separate check
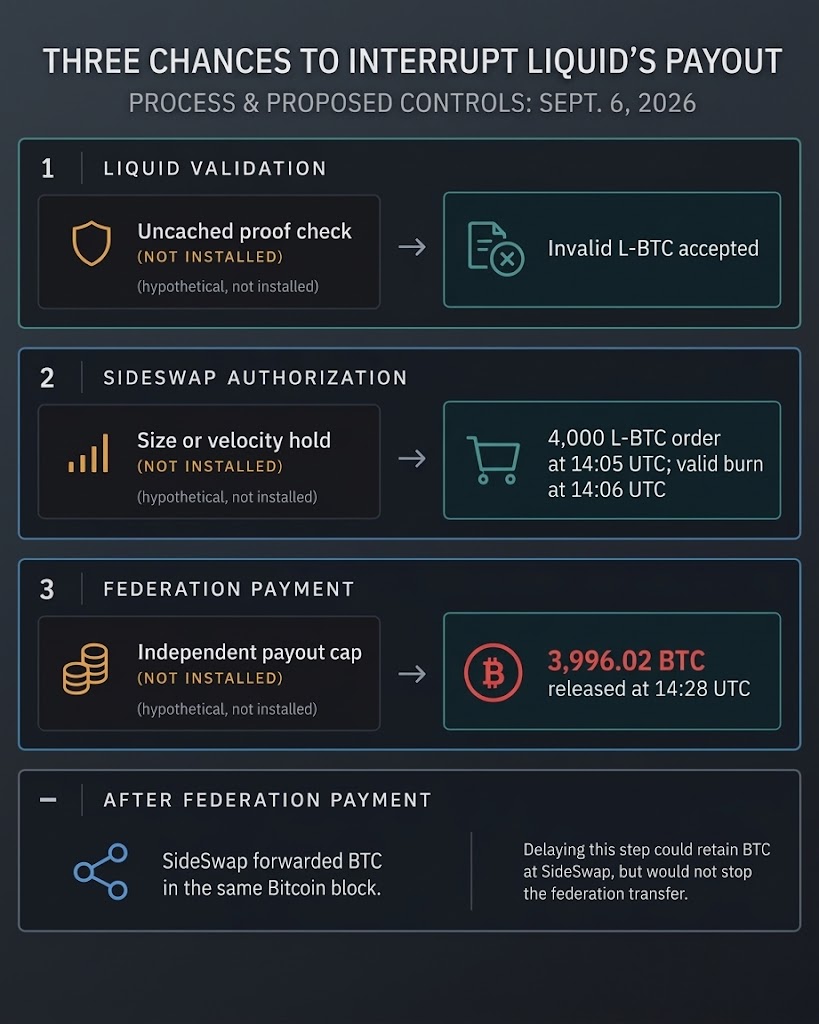
According to SideSwap’s account, the attacker sent 4,000 L-BTC to its peg-out service at 14:05 UTC on September 6. SideSwap burned the tokens with valid authorization at 14:06. The order exceeded its own wallet funds, causing two attempted payouts to fail before federation signers released 3,996 BTC at 14:28. SideSwap says it forwarded 3,995.99999857 BTC to the customer’s address in the same Bitcoin block.
The accepted order shows why a valid key was insufficient as a safety check. SideSwap says its authorization key was online, payouts were automatic, and its service had no size, velocity, supply-relative, wallet-history or human-review checks. The federation also signed an exceptional request after the two failed attempts. A payout limit or other independent hold at the service or federation, applied before authorization or signing, could have stopped this particular payout path even after Liquid admitted invalid state.
An offline authorization key would have created a pause before SideSwap approved the peg-out. A delayed manual forward would have acted later. It could have left the Bitcoin paid by the federation under SideSwap’s control for return, but the federation’s reserve transfer would already have occurred. The precise place a safeguard acts determines which loss it can prevent.
Gautam’s one-hour result describes a retrospective investigation. The local replay demonstrates how the cache could return the wrong answer under the assessed code; it does not measure a continuous detector’s chance of finding the defect before deployment or provide a record of the exact production cache state. A corrected validator could reject the invalid sidechain transaction. A payout limit could contain losses if another defect still reaches the bridge. The controls address different failures.
Liquid said on September 17 that ordinary transactions had resumed while peg-outs remained paused. It said withdrawals would restart only after full one-to-one BTC backing was confirmed and required software updates, testing and independent reviews were complete. The unanswered operational question is whether the resumed peg will have an independent reason to stop a reserve-sized authorized request before Bitcoin leaves federation custody.
The post Alpen says AI identified Liquid’s $320M BTC exploit in an hour. Could a payout limit have stopped it? appeared first on CryptoSlate.
Cosmos Hub restarted after a nearly day-long halt, moving 1.23 million ATOM linked to a governance exploit on Neutron.
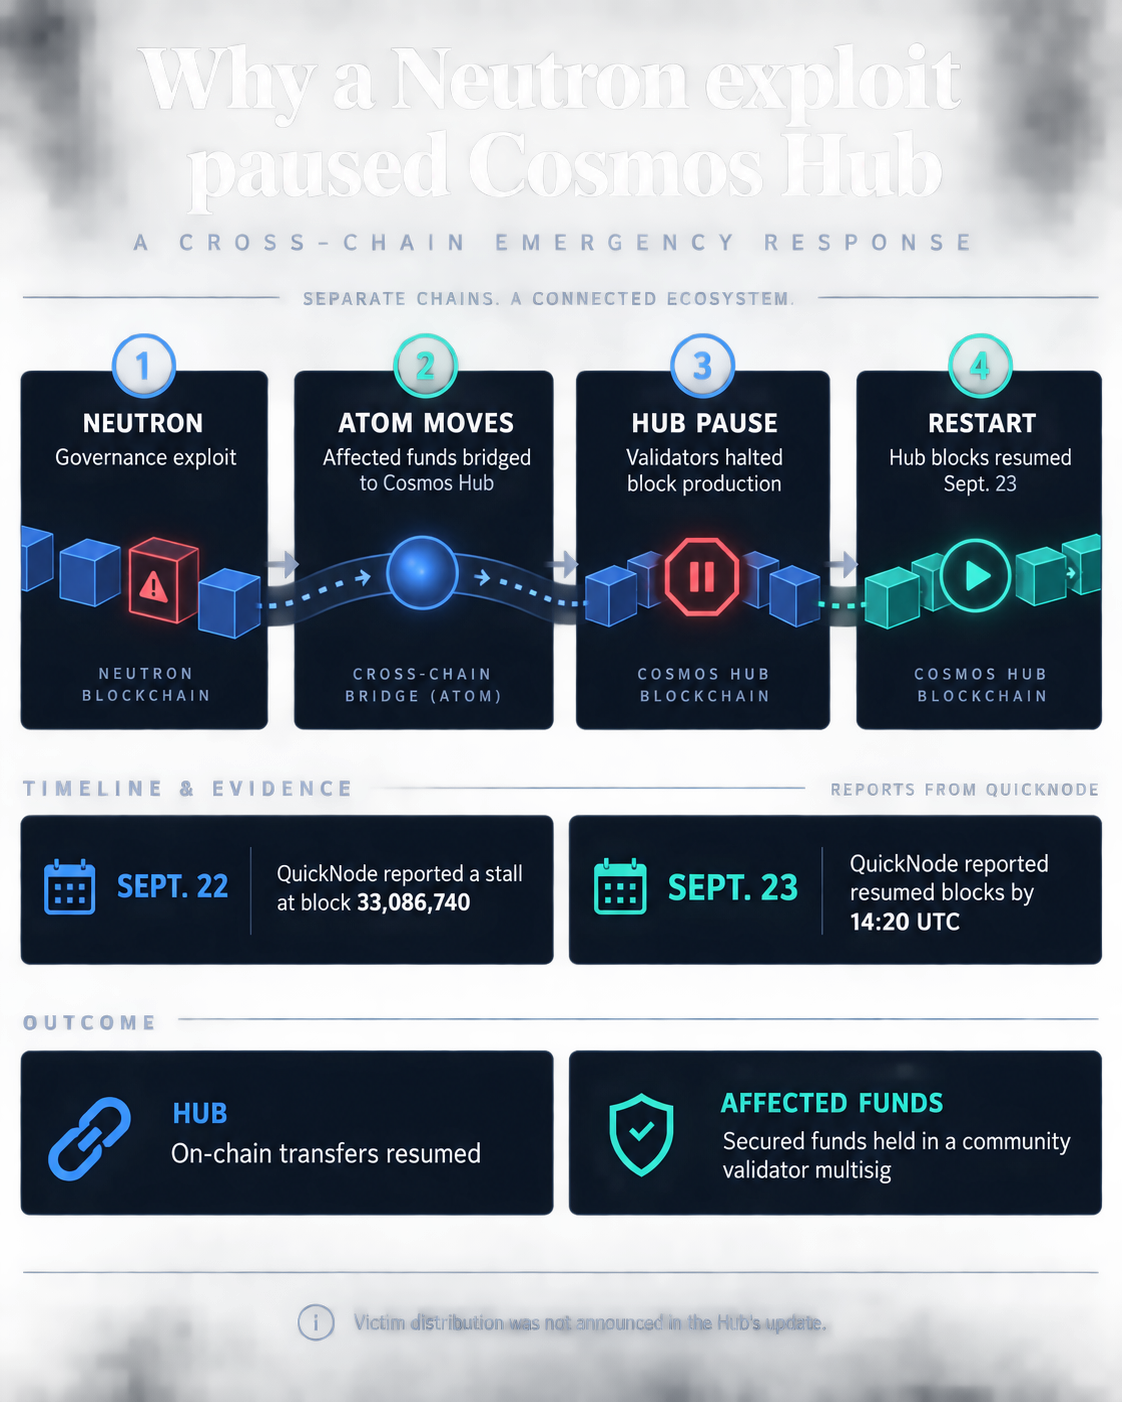
Validators resumed block production on Sept. 23 after stopping the network a day earlier, with the first block after the restart moving 1,227,121.37 ATOM, worth about $2.2 million, from an attacker-linked address.
The intervention followed the movement of funds stolen from Neutron onto Cosmos Hub, extending the fallout from an attack that began on a separate blockchain in the Cosmos ecosystem. Cosmos Hub said its network was not exploited and that the halt was intended to secure assets bridged from Neutron before they could move further.
Block production resumed at block 33,086,741, with the upgrade transferring the attacker-linked balance into a recovery address before ordinary activity continued. Cosmos Hub later said the secured assets had been placed in a community validator multisig while participants coordinated their return.
Former Neutron contributor Spaydh said the attack began after an attacker accumulated enough NTRN voting power to pass an expedited governance proposal that reassigned administrative rights over 11 smart contracts.
The affected contracts included infrastructure used by Astroport, Drop, and other protocols and were subsequently migrated to malicious code that allowed assets to be withdrawn.
Spaydh estimated the initial impact at roughly $4.4 million, comprising about $3 million in ATOM, $1.2 million in USDC, around $100,000 in DYDX and smaller amounts of wstETH and WETH. Notably, CryptoSlate previously reported that the losses amounted to roughly $9.3 million.
Neutron’s rate limits and subsequent halt prevented some of those assets from leaving the network. Spaydh said more than $1.6 million in USDC was protected, along with significant amounts of NTRN and ASTRO.
Roughly 70% of the stolen ATOM remained on Cosmos Hub when validators stopped block production, leaving about $2.15 million of ATOM within reach of the recovery operation.
Cosmos recovery leaves one gap as Neutron prepares restart
The first-block sweep secured most of the stranded ATOM, but a later refund from THORChain reached the attacker after the recovery transaction had already executed.
Crypto analyst Rarma said 168,990.9 ATOM arrived at the attacker-linked address seven blocks after the restart.
The tokens remained there for almost six hours before being transferred to Osmosis and sold in batches for about 266,841 USDC, with much of the proceeds subsequently converted into Ethereum.
The THORChain refund arrived after the sweep, leaving the newly returned ATOM outside the recovery transaction.
Rarma said an earlier attempt to transfer 500,000 ATOM was also included in a block and paid a fee before failing because the wallet lacked sufficient funds. He said the transaction showed the attacker-linked address could still submit an IBC transfer after the restart.
Cosmos Hub has not publicly explained why the later transfer proceeded or whether additional restrictions were intended for funds reaching the address after the initial sweep.
The bulk of the recovered ATOM remains under community control. Cosmos Hub said the funds captured during the restart came from the Neutron attack and are being held in a validator multisig while Hub validators, Neutron participants and affected protocols coordinate their return.
Meanwhile, attention is now shifting back to Neutron.
Spaydh said contributors have prepared a new binary that would restore affected contracts to their previous code and administrators, tighten governance controls, and move remaining attacker-controlled assets into a validator multisig.
The asset-return process is still being finalized, with recovered funds expected to be sent back to their original contracts and users after Neutron resumes block production.
Spaydh said Neutron was targeting a restart within roughly 24 hours and expected asset returns to begin afterward. The project also plans to publish a full post-mortem once the chain is back online.
Cosmos Hub said a separate forum update will follow with further details on the secured ATOM, leaving validators and affected protocols to reconcile the recovered balance against the portion that escaped after the restart.
The post Cosmos restarted to seize $2.2 million in stolen ATOM, but 169,000 tokens still escaped appeared first on CryptoSlate.
21Shares has launched a Zcash ETP, a physically backed exchange-traded product, on Euronext Paris and Amsterdam, opening a brokerage route to ZEC for European investors. The issuer announced the listing on Sept. 22 as Zcash rallied, but the price advance began before the product arrived.
The 21Shares Zcash ETP trades as ZCASH, with a euro listing in Paris and a dollar listing in Amsterdam. Its ISIN is CH1608218801. The product holds ZEC through its structure, giving investors price exposure without requiring them to buy or custody tokens directly. Its annual fee is 2.5%, and brokerage charges may add to the cost. The investor holds the listed product while the underlying ZEC is kept within its custody structure, a different experience from acquiring coins and moving them between personal wallets. In its launch post, 21Shares called it the first Zcash ETP available to European investors.
The distinction between product inception and public launch matters here. The issuer's product page gives Sept. 21 as the inception date, while its listing announcement came Sept. 22. ZEC was already trading around $1,540 on Sept. 19, when CryptoSlate covered a rally tied to growing attention on Grayscale's separate U.S. Zcash ETF. The European product therefore adds a new access point to an established price move.
On Sept. 23, Zcash recorded a 24-hour ZEC high of $1,651 before retracing to around $1,487 as of press time.
Weekly activity reaches multiyear highs
Messari reported more than $23 billion in Zcash transfer volume last week, its highest weekly total since 2021 and second-highest on record. That measure counts value moving on the network. Capital flows into ZEC or the new ETP require different data, so the $23 billion figure describes network movement rather than fresh investment.
On X, Zodl reported 62,379 shielded transactions last week, the highest weekly reading since 2022. Shielded transactions conceal details that would otherwise be visible on the public chain. The count measures transactions rather than distinct users. Subsequent weekly readings will show whether that level of shielded activity persists.
The new European listing and the two activity readings give investors fresh ways to assess Zcash beyond its price. Changes in ZCASH's assets will offer a separate gauge of take-up through European brokerage accounts. Those signals will develop on different timelines as the product begins trading.
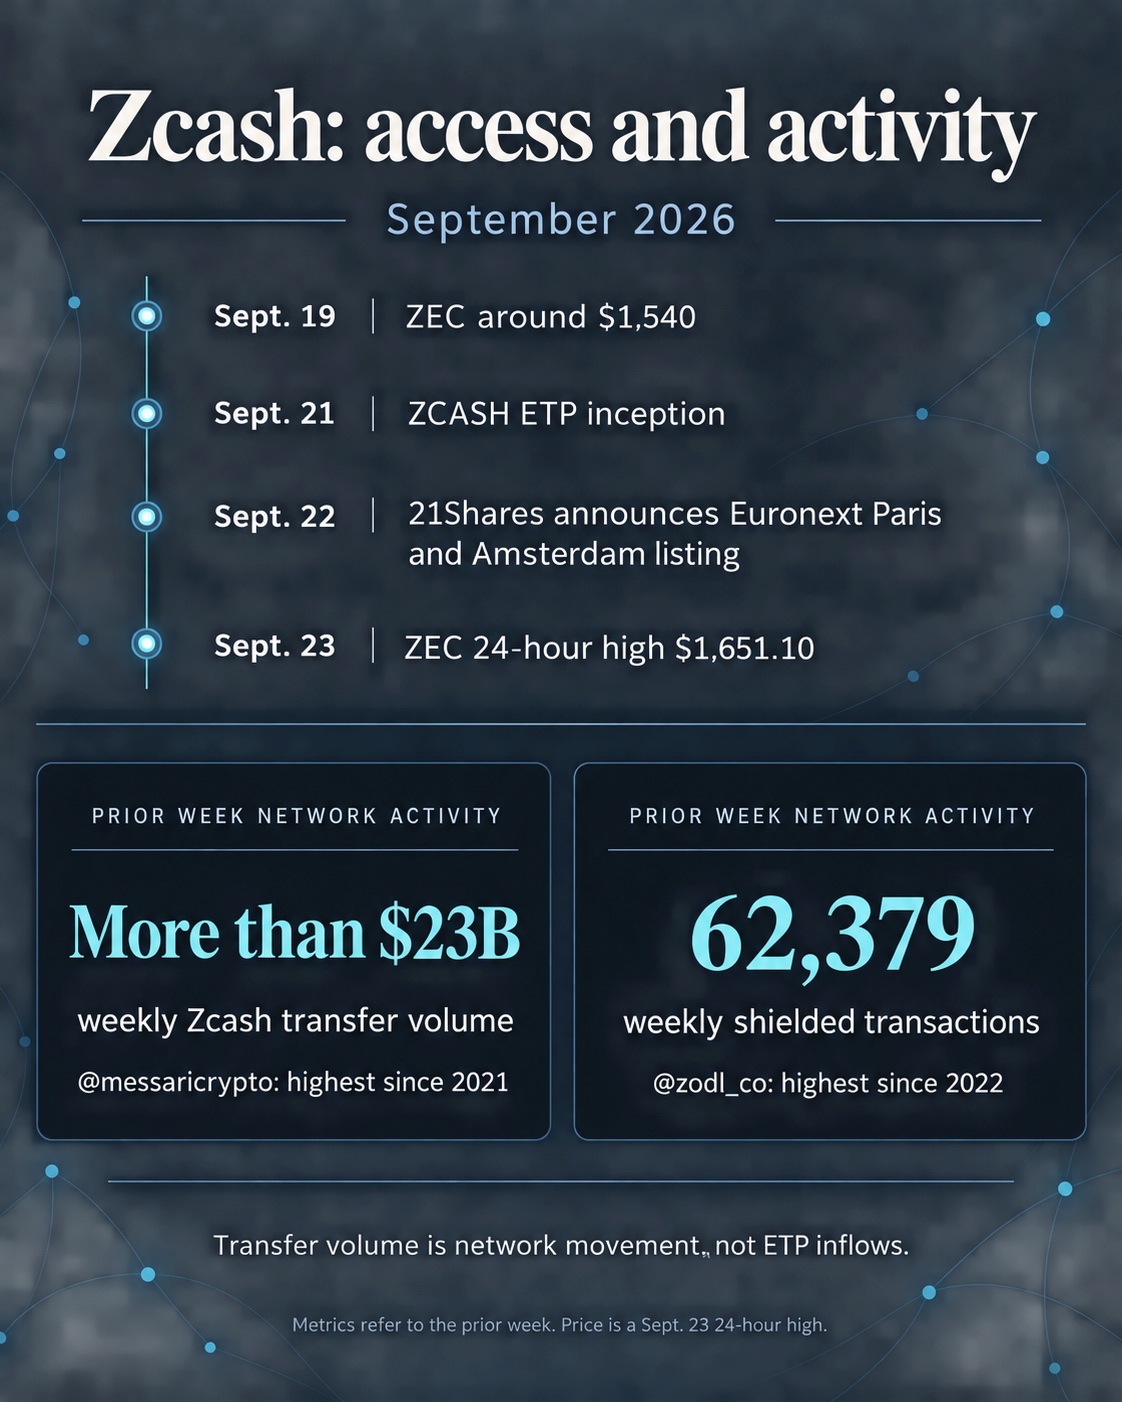
The post Why Zcash soared to $1,600 as Europe unlocks new ETP access appeared first on CryptoSlate.
Bitcoin registered an intraday low at $83,500 on Sept. 23, the same day the US 10-year Treasury yield closed at 5.11%, up 15 basis points in a single session, as a hotter-than-expected business activity survey pushed investors to reprice interest rates.
Bitcoin now sits inside the $84,000 to $85,000 zone Glassnode identifies as its nearest on-chain support.
Real yields carried most of the move
The 10-year real yield, which strips out expected inflation, climbed from 2.63% to 2.76% on Treasury's curve, accounting for 13 of the 15 basis points added to the nominal yield. Implied 10-year inflation compensation, the gap between the two, edged from about 2.33% to 2.35%.
| Metric | Sept. 22 | Sept. 23 | One-day move | Why it matters for Bitcoin |
|---|---|---|---|---|
| 10-year Treasury yield | 4.96% | 5.11% | +15 bps | Raises the benchmark return available in government debt |
| 10-year real yield | 2.63% | 2.76% | +13 bps | Increases the inflation-adjusted opportunity cost of holding BTC |
| Implied inflation compensation | 2.33% | 2.35% | +2 bps | Shows the move was mostly real-rate driven |
| S&P Global composite PMI | 56.0 | 58.4 | +2.4 pts | Triggered the repricing by showing stronger business activity |
Investors demanded a higher inflation-adjusted return on government debt, which raises the opportunity cost of holding Bitcoin, an asset that pays no yield of its own.
The trigger came from S&P Global's September Purchasing Managers' Index. The composite reading jumped to 58.4 from 56.0, with services at 58.7 and manufacturing at 57.0, the strongest expansion in the survey since July 2021.
An economy running that hot leaves the Federal Reserve less room to ease, one week on from its Sept. 16 hike to a 3.75% to 4.00% target range. Intraday reports put the 10-year near 5.058% within minutes of the PMI release, and Treasury's end-of-day curve settled at 5.11%.
Bitcoin's decline played out in the same session, with roughly $280 million in long liquidations as price broke below $84,000, according to CoinGlass.
Glassnode's map puts support at $84,000 to $85,000
Glassnode's Sept. 23 report places the largest cluster of long-term holder supply between $84,000 and $85,000, the price range where the biggest block of patient holders acquired their coins.
Bitcoin also trades above the short-term holder cost basis and above the True Market Mean at $77,000, which Glassnode describes as the main downside reference if the market loses $84,000.
On the upside, the report puts the next major resistance at $96,700, derived from the mean MVRV price.
| Level | Glassnode marker | Distance from ~$84,282 | Editorial meaning |
|---|---|---|---|
| $77,000 | True Market Mean | -8.6% | Main downside reference if $84K fails |
| $84,000–$85,000 | Long-term holder supply cluster | Current zone | Nearest support and key daily-close battleground |
| $96,700 | Mean MVRV resistance | +14.7% | Upside test if buyers absorb the macro shock |
From the current quote near $84,282, the $77,000 level sits about 8.6% lower and the $96,700 level about 14.7% higher. Glassnode's framework rests on sustained trading beneath the supply zone, so daily closes carry the weight in reading the Sept. 23 dip.
An intraday wick through $84,000 leaves the structure intact, while a run of closes below it would bring the $77,000 reference into play.
The buyers who returned before the bond move
Glassnode's demand data shows spot Bitcoin ETFs took in about $1.3 billion over the five days since the recent squeeze began, ending two weeks of outflows.
Over the same stretch, 24-hour spot volume across exchanges climbed 121% from its August trough. Farside Investors' figures show $999 million of ETF inflows on Sept. 21 and $714.7 million on Sept. 22 and $346.9 million on Sept. 23. IBIT led the second day with $350.3 million, with FBTC at $257.4 million and MSBT at $99 million.
Glassnode’s on-chain and ETF observations run mostly through Sept. 21, and its spot-volume data through Sept. 22. Farside’s Sept. 23 figures show inflows persisted during Wednesday’s bond selloff, though at a slower pace than Tuesday.
Friday brings roughly $16 billion in Bitcoin options expiring on Deribit, US durable goods and consumer sentiment data a few hours later, and CME's September Bitcoin futures settlement in the afternoon.
Whether $84,000 holds or $77,000 comes into view
The bull case has the 10-year real yield retracing below roughly 2.65% while ETF inflows stay positive and spot volume expands on up days. Bitcoin holds daily closes inside the $84,000 to $85,000 zone, and buyers who returned last week absorb the macro hit.
Under that path, attention moves from defending support toward the $95,000 to $97,000 region, with Glassnode's $96,700 resistance as the test that would confirm the recovery has room to run.
The bear case has real yields extending toward 2.85% to 2.90% as markets price a longer stretch of restrictive Fed policy. Bitcoin loses the $84,000 to $85,000 zone on sustained daily closes while ETF flows slow or turn negative.
| Scenario | Real-yield signal | BTC price signal | ETF / spot demand signal | Next level in focus |
|---|---|---|---|---|
| Bull case | 10-year real yield retraces below ~2.65% | Daily closes hold $84K–$85K | ETF inflows stay positive; spot volume rises on up days | $96,700 |
| Bear case | 10-year real yield extends toward 2.85%–2.90% | BTC loses $84K–$85K on sustained closes | ETF flows slow or turn negative; spot volume rises on selloffs | $77,000 |
In that scenario, the $77,000 True Market Mean becomes the active downside reference, and the long-term holders clustered at $84,000 turn into overhead supply for any rebound that follows.
Bitcoin's next few daily closes and the 10-year real yield's next moves will decide which of Glassnode's two reference points, $77,000 or $96,700, the market reaches first.
The post Why surging US real yields are quietly forcing Bitcoin under $84,000 appeared first on CryptoSlate.
CryptoTicker.io
Cardano trades at around $0.236 on September 24, 2026, roughly seven percent below the high the price had reached within the previous 24 hours. The move above the $0.25 mark has been given back. Anyone holding Cardano need not act because of it. Three things are worth knowing all the same: where the holding period stands for your own tranches, what a leveraged position can withstand within this range, and by what route ADA is regularly bought and held in Germany.
This article lists the figures with source and time, places the decline in its market context, and then works through the checkpoints that can lead an investor in Germany to a concrete action.
Cardano below $0.24: what happened in the last 24 hours
The exchange Kraken reports a last price of $0.2358 for the ADA against US dollar pair at 10:48 UTC on September 24, 2026. The high of the previous 24 hours was $0.2544, the low $0.2329. The volume-weighted average price for the same period was $0.2405. Measured against the high of that range, the decline comes to 7.3 percent.
CoinGecko reports a price of $0.2357 as of 10:56 UTC and a change of 7.1 percent against the level 24 hours earlier. On the morning of the same day this figure still stood at 7.6 percent. The divergence between the readings is a question of reference point and not a calculation error. Anyone measuring against the level exactly 24 hours earlier captures the previous day's sell-off in full. Anyone measuring against the opening price of the current UTC day arrives, for the same moment, at just 1.1 percent, because the decline mostly took place the day before.
That distinction has practical consequences. A stated daily loss of seven percent describes, in ADA's case, a move that has essentially already run its course. Between 00:00 UTC and midday on September 24 the price held within a narrow range. Anyone inferring an ongoing slump from the percentage alone is reading the figure against its reference point.
Over the week the balance stays positive. CoinGecko reports a gain of 18.8 percent over seven days and 8.0 percent over 30 days. Market capitalisation stands at $8.85 billion, which corresponds to 17th place, and trading turnover of the past 24 hours at $602 million. The price is around 92 percent away from its all-time high of $3.09 set in September 2021.
The decline therefore hits a price that had risen sharply beforehand. Part of the selling pressure can be read as profit-taking after a strong week, without any news on Cardano itself having to be behind it. No confirmation of that reading by a named source was available at the time of writing. It therefore remains an assessment and is not a statement of fact.
Why the ADA price is giving way now: bond yields and risk appetite
Cardano is not alone in the decline. Almost the entire front of the market gave way over the same period, and the trigger lies outside the crypto markets.
The US Treasury reports a yield on ten-year US government bonds of 5.11 percent in its daily yield curve for September 23, 2026. The day before, the same paper stood at 4.96 percent. A rise of 15 basis points in a single trading day is considerable in this segment.
Our own count of the daily series of the Federal Reserve Bank of St. Louis for the ten-year yield, series DGS10, gives the following picture for the period from January 2, 2007 across 4,935 trading days evaluated: the last closing value of 5.11 percent or higher dates from July 13, 2007. The current level is therefore the highest in a good 19 years. cryptoticker.io conducted this evaluation itself on September 24, 2026. Only daily closing values of that series were examined; intraday values were not available, and the value for September 24 had not yet been published at the time of the evaluation.
The link to the ADA price is not a detour. A higher yield on government bonds raises the return an investor can earn without price risk. That raises the bar for every investment that earns its return only in the future and only under risk. Equities and crypto assets give way together on this logic, and precisely that pattern showed on September 23 and 24.
The interest rate expectation itself and its consequences for leveraged positions were covered by cryptoticker.io on September 24 in a separate article on the expected Fed decision in October. For this article the macro background stays context. The checkpoints below relate to ADA.

Leverage and liquidation on ADA: how a position disappears without a sale
For investors without leverage, a decline of seven percent is a book value. For leveraged positions it is a question of remaining runway. This is exactly where those who can sit the move out part company with those who must not.
Funding rate and liquidation price, briefly explained
A perpetual future, or perp, is a futures contract with no expiry date that tracks the price of an underlying asset through running balancing payments between buyers and sellers. That balancing payment is called the funding rate: it falls due at short intervals and flows from the predominantly positioned side to the other side. If many market participants stand on the buy side, buyers pay sellers.
The liquidation price is the price at which the margin on a leveraged position no longer suffices and the trading platform closes the position of its own accord. That closure is not a sale at your discretion. It happens without consultation and without the option of waiting for a recovery.
At fivefold leverage, a counter-move of around 20 percent arithmetically suffices to consume the margin posted, and around 10 percent at tenfold leverage. The actual threshold sits below that depending on the platform, because fees, funding costs and maintenance margins come on top. ADA's daily range on September 24 ran between $0.2329 and $0.2544, that is 9.2 percent measured against the low. A tenfold leveraged position was already in the danger zone within that range.
What follows from this is arithmetic and not a recommendation: anyone holding a leveraged position can read off their own liquidation price on the platform and hold it against the daily range. If it lies within the range of recent days, the outcome is no longer decided by your own assessment but by the next swing. How the venues for such contracts differ in fees, maintenance margin and safeguard mechanics is shown in the overview of venues for perpetual contracts.
A second point concerns tax, and it is regularly overlooked. In Germany, gains from derivatives on crypto assets do not fall under the one-year holding period for private disposals. They are treated as investment income, with their own logic for offsetting losses. Anyone trading spot holdings and perps in the same year is therefore running two separate tax pots.
Crypto capital gains holding period: when your ADA sale stays tax-free
For privately held crypto assets, the one-year holding period of section 23 of the German Income Tax Act applies. Anyone selling ADA more than a year after acquisition realises a tax-free gain. Anyone selling within the year has a private disposal, taxable at their personal rate, provided the sum of all such gains in the calendar year exceeds the exemption limit.
The period runs per acquisition and not per wallet. Anyone who bought more during last week's upswing has begun a new period for that tranche, while older holdings remain untouched. For allocation, the first-in, first-out method is decisive in practice: the holding acquired first counts as sold first, provided holdings are viewed separately per wallet.
The current decline changes nothing about that mechanism; it only shifts the question. Anyone close to the end of the one-year period loses the tax exemption for that tranche by selling now. Anyone holding the position for more than a year already has that question behind them.
Staking rewards: accrual, valuation and documentation
Cardano is a proof-of-stake blockchain: the rights to produce blocks are distributed not through computing power but through the allocation of coins to a stake pool. That allocation is called delegation. It transfers no ownership, because the coins remain at the holder's disposal.
For tax purposes the rewards accruing from it count as other income and not as disposal gains. They are to be recognised at the moment of accrual at the price prevailing then, even if no conversion into euros takes place. Anyone delegating over months has correspondingly many individual accruals to value.
One point expressly relieves investors here. With its circular of March 6, 2025 on individual questions of the income tax treatment of certain crypto assets, reference IV C 1 - S 2256/00042/064/043, the Federal Ministry of Finance replaced the preceding circular of May 10, 2022 and clarified the requirements for record-keeping and cooperation. On the view set out there, using crypto assets for staking or lending does not extend the disposal period from one year to ten. Delegating your ADA therefore does not extend the holding period.
In practice that means two obligations. The rewards are to be valued per accrual date, and holdings are to be documented so that the acquisition date remains provable per tranche. A portfolio tracker with tax reporting takes over that allocation, but does not replace checking whether the imported prices and timestamps from the exchange match your own records.
Buying ADA under MiCA: which buying route is permitted in Germany
Since the European regulation on markets in crypto-assets, MiCA, became fully applicable, crypto services in Germany may only be provided by authorised firms. Such a firm is called, in the language of the regulation, a crypto-asset service provider, or CASP. The authorisation is granted in one member state and then applies across the entire single market.
For you as a buyer that has three visible consequences. The provider must be identifiable and must identify you, it must keep client funds separate from its own, and it must have a complaints procedure. Unauthorised platforms may no longer actively solicit customers in the European Union, and exchanges without authorisation regularly close access to residents of the EU altogether.
ADA can be traded on practically every authorised venue, which is why the buying route is rarely the problem. Where the venues differ is on cost: trading fee, the spread between bid and ask, deposit and withdrawal costs, and the question of whether withdrawals in ADA to your own wallet are possible at all. The overview of regulated venues for crypto assets lists these items per provider.
One detail is worth checking before your first purchase: some providers hold ADA exclusively as a custodial balance and permit no withdrawal to an external address. Anyone wanting to delegate or self-custody cannot do so with such a provider. That is in the terms of use and not in the fee table.

ADA custody: exchange, software wallet or hardware wallet
Anyone leaving ADA in an account at an exchange holds a claim against that company and not the coin itself. Access depends on the platform being available and solvent. With an authorised provider that is a calculable risk, but it is a different risk from self-custody.
A software wallet holds the keys on a device with an internet connection. It permits delegation to a stake pool and is convenient for ongoing use. A hardware wallet holds the keys on a device without an internet connection and releases transactions only after confirmation on the device. Delegation remains possible, because no transfer of the coins is needed for it.
The recovery phrase is in both cases the real asset. It consists of a fixed sequence of words from which all the wallet's keys can be recalculated. Whoever loses it loses the holding for good; whoever passes it on passes the holding on. An overview of the devices including supported networks and prices is in the hardware wallet comparison.
For tax, the choice of custody is not neutral. A transfer from the exchange to your own wallet is not a sale and triggers no tax, but it breaks the chain of evidence if the acquisition date and acquisition price are not carried along. Those details cannot be reconstructed later.
What the on-chain figures show on Cardano: supply, treasury and epoch 657
Besides the price, the state of the network can be read directly from the blockchain. A query of the public Koios interface on September 24, 2026 returns number 657 for the current epoch, that is, the fixed five-day period by which Cardano settles its rewards.
For that epoch the query reports a circulating supply of 36.77 billion ADA, a total amount in the protocol of 38.89 billion ADA, a reserve not yet distributed of 6.11 billion ADA, and a balance of the network treasury of 1.36 billion ADA. The treasury is fed from a share of the fees and the reserve and finances projects voted on by the network's delegates.
On circulating supply the sources diverge. CoinGecko reports 37.53 billion ADA, the on-chain query 36.77 billion. The difference of around 760 million ADA is explained by differing definitions: the on-chain figure deducts treasury and reserve from the total holding, while market data providers calculate closer to the tradable amount. For valuing market capitalisation that is a difference of about two percent. Nothing is smoothed here; the two figures stand side by side because they measure different things.
The protocol's cap is 45 billion ADA. Around 6.11 billion of that is not yet in circulation and flows in through the rewards of future epochs. That is not an expansion of the supply beyond the cap; it distributes a stock already fixed.
Levels above and below: how to spot the next ADA move
Levels are not a forecast. They are price levels at which a striking amount of trading took place in the past, and at which experience therefore suggests it is decided whether a move carries.
On the downside the first relevant level is $0.2329, the low of the past 24 hours on Kraken data. Below it begins the area where the price traded before last week's upswing. On the upside the first level is $0.2405, the volume-weighted average of the past 24 hours, and above that $0.2544, the high of the same period. Only above $0.25 would the breakout now given back be restored.
Analyst views on price targets are left out of this article, because no attributable, current assessment could be documented for September 24. An anonymous price target would be worthless to you, because you could not check who holds it and on what grounds.
What you can check instead of a forecast is the composition of your own holding: which tranche was acquired when, which of them has reached the one-year mark, whether a leveraged position is open and where its liquidation price lies. Those four details are in your hands, unlike the price.
Checking the Cardano slide: what to take away
- Check first whether you are leveraged. Read off the liquidation price of every open position and hold it against the daily range of $0.2329 to $0.2544. If it lies within that range, the next swing decides and not your assessment. How the venues differ in maintenance margin and fees is in the overview of venues for perpetual contracts.
- Sort your holdings by acquisition date. Every tranche has its own one-year period, and anyone who bought more during last week's upswing has started afresh for it. Staking rewards come on top as other income per accrual. A portfolio tracker with tax reporting takes the allocation off your hands; checking the imported timestamps stays with you.
- Check the route before you buy more or withdraw. Before a withdrawal, establish whether your provider releases ADA to an external address at all, and compare fee and spread, not just the fee. The terms of the authorised venues are listed in the overview of regulated venues for crypto assets, and the devices for self-custody in the hardware wallet comparison.
The running price data for ADA is published by the exchange Kraken on its Cardano price page; the values named in this article come from its public interface at the time stated.
(As of September 24, 2026. This article is not investment advice. Prices and fee structures change; check the terms with the provider before you buy.)
NEAR Protocol falls sharply on September 24, 2026, yet remains one of the strongest performers among the top 25 cryptocurrencies over the week. Anyone holding NEAR, or looking to buy in now, therefore has to judge two things at once: a short-term pullback, and a rally built on a very particular product that is not readily accessible in Europe.
This article puts the numbers in context, explains what triggered the upswing, and then works through the points you as an investor in Germany can actually check: the buying route under MiCA, custody, the holding period, and the records the tax office will want to see.
NEAR price on September 24, 2026: The figures from our own survey
cryptoticker.io retrieved the following values itself on September 24, 2026, between 08:47 and 08:50 UTC, via CoinGecko's public programming interface, both calls returning status code 200. Because three minutes lay between the two calls, individual values differ. We give them as a range and do not smooth them.
- Price: $4.22, and around €3.69 on venues with a euro pair.
- Change over 24 hours: minus 6.9 to minus 7.9 percent.
- Change over seven days: plus 55.2 to plus 61.8 percent.
- Change over 30 days: plus 118.6 percent.
- Daily range: $4.09 at the low, $4.79 at the high.
- Trading volume over 24 hours: around $2.15 billion.
- Market capitalisation: around $5.51 billion, 23rd place.
- Distance from the all-time high of $20.44 set on January 16, 2022: 79.3 percent.
Two of these figures deserve attention. The first is the distance from the all-time high. Even after a month of plus 118.6 percent, NEAR trades around four fifths below its price of early 2022. Reading the current move as a return to old highs underestimates how far that road still runs. The second is the ratio of trading volume to market capitalisation: with $2.15 billion of turnover against $5.51 billion of market value, almost forty percent of the market value arithmetically changes hands in a single day. Turnover on that scale belongs to a phase in which short-term traders set the price, not long-term holders. The running price action and the key levels can be found in our NEAR price prediction.
What triggered the rally: confidential perpetual futures via Hyperliquid
Last week's upswing has an identifiable cause. NEAR has switched on confidential perpetual futures contracts, known as confidential perps, which run over an existing connection to the derivatives venue Hyperliquid. The trade press dates the launch to September 17 or September 18, 2026; the accounts differ by a day, and we were unable to confirm an official date on the project's own pages.
A perpetual future, or perp, is a futures contract with no expiry date. It tracks the price of an underlying asset but runs on indefinitely, as long as the margin holds. To stop its price drifting away from the spot price, the two sides of the market pay each other a balancing amount at fixed intervals, the funding rate. Whoever stands on the crowded side pays; whoever takes the other side receives.
According to consistent reports in the trade press, the offering covers more than 50 perp markets, permits leverage of up to forty times and accepts collateral from more than 35 different blockchains. Positions continue to be executed at Hyperliquid. In the United States and Canada the product is not available, according to Altcoin Buzz. The underlying confidential intents system held around $70 million in deposited value on September 15, 2026.
The technical substructure is the part NEAR itself puts front and centre: the project's official intents pages describe NEAR as a universal transaction layer for an economy driven by AI agents, in which so-called solvers compete to find the best execution for a desired end state. How this mechanism works for a simple cross-chain swap is set out in our analysis of NEAR Intents.
What "confidential" means for these futures contracts, and what it does not
Precision pays here, because the term carries further in marketing than in the technology. On the available descriptions, the confidentiality arises because trading activity runs over a shielded NEAR shard, that is, a separate section of the chain connected to the main network by a bridge with a trusted execution environment. What is hidden is the asset traded, the position size, the entry time and the direction. The public link between deposit, account and position is severed.
What that does not mean: the position does not disappear. The contract is still executed at Hyperliquid and remains part of its market infrastructure. Selective disclosure is explicitly provided for in the descriptions, but which body may decrypt under which conditions has so far not been named in the public documents. That is no accusation against the project. It remains an open question you should carry with you in your own risk assessment.
For you in Germany, one sober sentence follows: confidentiality towards the public is not confidentiality towards the tax office. Your record-keeping obligations for tax purposes remain unchanged, regardless of whether a third party can see your position in a public data set. Anyone who relies on the shielding and therefore keeps no records takes on a problem that has nothing to do with the technology.

Funding rate and liquidation: the mechanics behind forty times leverage
Forty times leverage sounds like an opportunity and is first of all an arithmetic problem. At forty times leverage, a price move of 2.5 percent against your position equals the complete loss of the collateral you posted. Liquidation, the forced closure by the system, sets in earlier in practice, because maintenance margin and fees are taken into account.
Hold that against the numbers from our survey. In the past 24 hours alone, NEAR has run a range between $4.09 and $4.79. That is around 17 percent between low and high. A position with forty times leverage would have been stopped out several times in this window depending on entry, and in both directions. Leverage does not improve your hit rate; it shortens the time until the decision.
On top of that comes the funding rate. In a phase where many are betting on rising prices, the buy side pays the sell side continuously. That payment falls due regardless of whether the price moves your way, and it adds up noticeably over days. Anyone holding a leveraged position for a week should have estimated the cumulative funding payment beforehand. Which venues for perpetual futures bring which fee models, leverage limits and safeguards is set side by side in our comparison of perp DEX platforms.
Buying route under MiCA: which venues quote NEAR in euros
Our retrieval on September 24, 2026 lists, among others, five venues with a euro pair for NEAR: Bitvavo, Kraken, Bit2Me, WhiteBIT and OKX. The price there was uniformly around €3.69. That list describes where trading takes place, and says nothing about which of these providers is allowed to take you on as a customer in Germany.
That question is answered by the Markets in Crypto-Assets Regulation, or MiCA. A company providing crypto-asset services to customers in the European Union needs authorisation as a crypto-asset service provider. In Germany it is granted by the Federal Financial Supervisory Authority. Every authorisation granted is published in the Federal Gazette and entered in the supervisor's company database; Europe-wide, the European Securities and Markets Authority maintains a register of its own.
From this follows a checking step you can take yourself in a few minutes. Look up your venue's full company name, not the brand name of the app, in the supervisor's company database or in the European register. If the company is listed there with authorisation as a crypto-asset service provider, you know your legal position in a dispute. What the authorisation requires in detail and where its limits lie is explained on BaFin's information page on crypto-asset services. An overview of the venues that regularly serve the German market can be found in our comparison of crypto exchanges.
One point belongs to honesty here: the confidential perp offering that carried this rally is not a product of a trading platform authorised in Germany. It runs over decentralised infrastructure, and MiCA does not capture decentralised protocols without an identifiable operator in the same way it captures an authorised company. Anyone trading there does so without the protections that authorisation brings, and without a body to which a complaint could be addressed.
Tax in Germany: holding period on spot NEAR and the open question on perps
For a direct purchase of NEAR held privately, the legal position is clear. The transaction falls under private disposals within the meaning of section 23 of the Income Tax Act. If you sell within a year of buying, the gain is taxable; if more than a year lies between purchase and sale, it remains tax-free. An exemption limit of €1,000 applies to the sum of all private disposals in a year. Exceed it and the entire gain is taxable, not merely the excess.
With perps the matter is different, and pretending to certainty here helps nobody. How perpetual futures on crypto assets are to be classified for retail investors, whether as a forward transaction within the meaning of section 20 of the Income Tax Act or as a private disposal, is disputed in practice and depends on the specific design of the product. The classification decides whether the one-year period applies at all and how losses may be offset. That is a question for your tax adviser, and before your first trade rather than in May of the following year.
What applies in both cases: you need unbroken records of the time, quantity, price and equivalent value of every single transaction, including funding payments. In a shielded trading environment you do not get that statement reconstructed automatically from a public data set. Export the records as you go and file them. Which tools bring transactions together and deliver a holding-period calculation on a first-in, first-out basis is shown in our comparison of crypto tax software.
Custody and staking: what delegating does to your holding period
NEAR uses a proof-of-stake procedure. You can delegate your holdings to a validator and receive rewards on an ongoing basis. For tax purposes these rewards are to be valued at the time they accrue as other income under section 22 no. 3 of the Income Tax Act, for which a separate exemption limit of €256 a year applies. The market value on the day of accrual is at the same time your acquisition value for a later sale of those rewards.
The earlier worry that staking extends the holding period of the coins deployed from one year to ten has been cleared up. The tax administration has made clear that the extended period is not to be applied to staking and lending. For the holdings you deploy, the one-year period therefore stands.
More important in practice is the withdrawal period. Delegated NEAR holdings are not available immediately after you cancel. Only after a waiting time of several epochs can you withdraw them. In a market that runs 17 percent between low and high in one day, that is a risk you should know about: anyone who wants to sell into falling prices and first has to wait sells at a price they did not choose. Check your validator's current waiting time before you delegate, not when you want to get out.

The NEAR@3.33 incentive programme and why it matters again now
In September 2026 NEAR set up an incentive programme under which allocated claims are converted into NEAR provided the price holds a set threshold over a defined period. We broke the conditions down in a separate analysis of the incentive programme.
One aspect of it is notable for today's pullback: programmes whose payout is tied to holding a price threshold create an additional vested interest in the price around that threshold. As long as NEAR trades well above it at $4.22, that is theoretical. Should the price approach the threshold, it will no longer be. Anyone holding claims from the programme should read the conditions rather than quote them from memory.
Method of our survey: 25 coins and five euro venues counted
cryptoticker.io conducted this analysis itself on September 24, 2026. The method in one sentence: on September 24, 2026 at 08:47 UTC we retrieved the market overview of the 25 largest cryptocurrencies and at 08:50 UTC the individual data set for NEAR Protocol via CoinGecko's public programming interface, both calls returning status code 200, and from these counted the price changes and the venues listed with a euro pair.
Objects examined: 25 entries of the market overview, of which 21 assessable assets after deducting the stablecoins, plus one individual data set for NEAR with the venues listed within it. In this count NEAR, at minus 6.9 to minus 7.9 percent, was the biggest daily loser among the assessable assets; over seven days NEAR, at plus 55.2 to plus 61.8 percent, was at the same time in front.
What we could not verify and therefore disclose: whether the five venues named hold authorisation as crypto-asset service providers, and whether they accept customers from Germany, does not emerge from a price interface. You have to take that step yourself in the supervisor's register. Nor were we able to cross-check the trade press accounts of the confidential perp offering against an official publication by the project; NEAR's product pages describe the intents architecture but name neither the number of markets nor the leverage limit.
Levels above and below: how to measure the pullback
Levels are not a forecast but measuring points at which you can anchor your own decision. Four of them follow from the figures gathered.
On the downside, the daily low at $4.09 is the first reference point. Below it, the pullback loses the character of profit-taking within an intact move. The second lies at around $3.15, the closing price of September 17, that is, the level immediately after the perp offering launched. Should the price fall back there, the market would have given up the entire valuation of that trigger again.
On the upside, the daily high at $4.79 is the nearest level. Above it lies the round five-dollar mark, to which analysts have repeatedly pointed in recent days. Such price targets are the assessments of individual houses and not documented quantities; we report them as what they are. Against that stands the counter-position that the move is technically overbought after plus 118.6 percent in thirty days, and that a pullback was the likely rather than the surprising scenario.
For anyone working to a savings-plan logic, this whole paragraph is secondary. For everyone else: write your level down before you buy, not afterwards.
Checking the NEAR pullback: what to take away
Three steps that can be done today.
- Check your buying route before you react to the pullback. Look up your venue's full company name in the supervisor's company database or in the European register and establish whether authorisation as a crypto-asset service provider is in place. Which providers regularly serve the German market is shown in our comparison of crypto exchanges.
- Leave the leverage alone until you have estimated the funding rate. At forty times leverage a counter-move of 2.5 percent suffices for the total loss of your collateral, and NEAR has run a range of around 17 percent today alone. If you still want to use perpetual futures, compare fees, leverage limits and safeguards in the perp DEX comparison.
- Secure your records, especially in shielded trading environments. Export the time, quantity, price and equivalent value of every transaction as you go, and track the holding period separately for each purchase. The tools for this are in our comparison of crypto tax software.
(As of September 24, 2026. This article is not investment advice. Prices and fee structures change; check the terms with the provider before you buy.)
Stellar has been a payment rail at BVNK since September 22, 2026. BVNK settles stablecoin payments and has belonged to Mastercard since this summer. According to the company, the rail is live for business customers in more than 130 countries. On the first trading day afterwards, the price of Stellar's XLM token fell by around seven percent.
The two developments belong together, but they call for different responses. The integration concerns the network and how companies use it. The pullback concerns your portfolio, your holding period and, if you are leveraged, your liquidation price. This article separates the two and names, for each point, what you can actually check: the buying route under MiCA, the memo field on deposits, the one-year period under section 23 of the German Income Tax Act, custody, and the price levels that follow from documented daily data.
XLM price on September 24: The numbers behind the pullback
The price of Stellar (XLM) stood at $0.20348 and €0.178583 at 07:49 UTC on September 24, 2026. On CoinGecko data that is 6.98 percent lower than 24 hours earlier. The daily high was $0.220096, the daily low $0.198654. Market capitalisation is around $7.11 billion, which ranks 20th in the overall market, on turnover of $345.8 million in 24 hours.
As a cross-check we pulled the euro price independently from Kraken. There the XLM/EUR pair last traded at €0.178424 at 07:52 UTC, with a 24-hour high of €0.192692 and a low of €0.174634; a good 10.09 million XLM changed hands. The two sources are therefore about two ten-thousandths of a euro apart, which is within the usual range for daily data from different venues.
The day's loss looks smaller over the week. On a seven-day view XLM is still 11.38 percent higher, and 3.77 percent higher over 30 days. Over a year, by contrast, the price is 44.6 percent lower, and it remains far from its all-time high of $0.875563 set on January 2, 2018. Anyone who bought this week is sitting on a pullback inside an upswing. Anyone holding for longer is watching a move that changes little in the annual picture.
Around 34.94 billion XLM are in circulation out of a total supply of 50.0 billion. That gap is not hidden inflation in the sense of a running issuance into the market; it is the portion of the supply held by the Stellar Development Foundation. The circulating amount is nonetheless what counts for the price calculation, because only that part is tradable.
BVNK adds Stellar: What the new payment rail does
A payment rail is the technical route a service provider uses to move money from one account to the next. BVNK runs such infrastructure for stablecoin payments: companies pay out through a single interface and the firm picks the network in the background. A stablecoin is a crypto asset whose value is pegged to an official currency and is meant to be backed by reserves.
According to BVNK's statement of September 22, 2026, Stellar is live for all customers across more than 130 supported countries. Three use cases are named: cross-border payments, merchant payouts and treasury transfers within corporate groups. The company cites technical metrics of the network as its reasoning: average settlement in five seconds, transaction costs in the range of a fraction of a cent, and availability of 99.99 percent.
The statement gives two figures for scale. BVNK itself processes an annualised volume of $39 billion. The Stellar network handled payment volume of $55.6 billion in 2025. Both numbers come from the respective provider and are not independently audited; we report them as statements by the parties involved.
Kim Mescal Julien, Head of Partnerships at BVNK, explains the step in the statement: "The future of global payments is multi-chain and multi-asset, but businesses shouldn't have to carry the technical burden of connecting to dozens of individual blockchains." Denelle Dixon, CEO and Executive Director of the Stellar Development Foundation, adds: "Businesses moving money at scale need to know that it works every time, in every corridor." Those are statements by the parties about their own product, not independent findings.
Mastercard behind BVNK: Why the owner gives the news more weight
BVNK was an independent fintech until recently. The firm now belongs to Mastercard; the acquisition is documented in BVNK's press room. That changes the reading. When an independent settlement provider adds another blockchain, it is a product decision. When the same decision is taken under the roof of one of the two big card networks, it carries weight, because behind it stand distribution channels to banks and merchants that a fintech does not have on its own.
What matters just as much is what the news does not say. It announces no card payments in XLM, no integration into Mastercard's card network and no retail product. It concerns settlement between businesses. Anyone who infers immediate demand pressure on the XLM price from it is assuming a link the statement does not support.
What the XLM token actually does in the Stellar network
Stellar is a public payment network and XLM is its native token. Its jobs are narrowly defined: it pays the network fees, which come to a tiny fraction of a cent per transaction, and it serves as the minimum reserve every account on the network has to hold so that storage space on the blockchain is not occupied for free.
For valuation, that is the decisive distinction. If BVNK moves stablecoins over Stellar in future, those payments run in the stablecoins themselves. XLM is needed for fees and reserves, in an amount that is vanishingly small per payment. Growing payment volume on the network therefore does not create proportionally growing demand for XLM. What it does create is a larger economic base for the network itself, and with it an argument that works over years rather than days.
That assessment is labelled as such. The token's functions and the volume figures are documented. How both feed through to the price is an expectation, not a fact.

Buying XLM in Europe: Which buying route counts under MiCA
Since the European crypto regulation MiCA came fully into force, any provider selling or holding crypto assets for you in Germany needs authorisation as a crypto-asset service provider. BaFin maintains the list of authorised firms, and ESMA collects the national registers across Europe. What that means in practice for providers is set out in our overview of MiCA licensing duties for crypto companies.
Three practical things hang on this for you as a buyer. First, the complaints route: with an authorised provider there is a competent supervisor, with an unauthorised one there generally is not. Second, the separation of client assets from the firm's own holdings, which MiCA requires. Third, the records you will later need for the tax office, which a regulated provider as a rule delivers more cleanly. Which firms are authorised in Germany can be found in our comparison of regulated crypto exchanges.
Check as well whether your provider quotes a genuine euro pair for XLM. If the purchase runs via the detour of a dollar stablecoin, you pay trading fees twice and additionally carry the exchange-rate risk between euro and dollar. With an asset that swings seven percent in a single day, a detour margin is less noticeable than usual, but it is no smaller for that.
EURAU on Stellar: The MiCAR-compliant euro stablecoin
For European readers a second strand of this story matters more than the news itself. EURAU, a euro-denominated stablecoin issued by AllUnity GmbH, runs on Stellar. According to the statement from the Stellar Development Foundation, AllUnity is a regulated e-money institution founded by DWS, Flow Traders and Galaxy. DWS is Deutsche Bank's asset management arm.
The legal core is in the same statement: under article 49 of MiCAR, holders of such e-money tokens have a statutory right at any time to redeem their holdings with the issuer at par. That is the difference between a regulated e-money token and a stablecoin without European authorisation: with the one, a redemption right is written into law; with the other, there is a promise from the issuer.
In practice that means: if a German company wants to settle in euros over a rail like BVNK's, without the detour via the dollar, a purpose-built, European-supervised building block exists on Stellar. Whether and when BVNK will actually offer EURAU over Stellar is not stated in the integration announcement, so we do not claim it either. What is documented is that the token is available on the network.
For you as a retail investor, EURAU changes little for now. It becomes interesting as soon as your provider represents euro balances through such a token, because the relevant question then is who you have a claim against if the worst happens: the exchange holding the balance, or the issuer of the token.
Crypto capital gains holding period: What taking profits on XLM triggers
In Germany, crypto assets held privately count as other assets. If you sell them at a profit within a year of buying, that gain is taxable as a private disposal under section 23 of the Income Tax Act, and at your personal income tax rate rather than the flat withholding rate. After a year has passed, the sale is tax-free. The exemption limit for private disposals is the amount named in section 23(3) of the Income Tax Act; it is a threshold and not an allowance, so once it is exceeded the entire gain becomes taxable.
This is exactly where today's pullback sets a trap. Anyone wanting to bank profits after the weekly gain of 11.38 percent will be selling holdings they bought, as a rule, over the past few weeks. Their one-year period cannot have run. A paper gain thus turns into a taxable one, while older holdings of the same coin may long since be out of the period.
Which holdings you sell is determined in practice by the tax authorities on a first-in, first-out basis: what you bought first counts as sold. If you hold XLM in several tranches and on several platforms, you need a continuous record across all accounts, with date, quantity and acquisition price. An exchange statement alone rarely suffices, because it only knows its own slice. Anyone who has made transfers between platforms should keep the records: a transfer into your own wallet is not a sale and does not interrupt the period, but you must be able to show that if challenged.

Memo and destination tag: The most common mistake on Stellar deposits
Stellar has a field that many other networks do not have in this form: the memo. It is a short note the sender attaches to a payment. Technically it is optional; in practice it is almost always mandatory for deposits to exchange accounts.
The reason lies in how the platforms are built. Many exchanges run a single Stellar address for all customers and assign incoming payments to the right account using the memo. If you send XLM there without a memo, the money arrives correctly on the network but lands in the exchange's pooled holdings and not visibly in your account. Recovery is then a support case with processing time, sometimes a fee, and in unfavourable cases the outcome that the amount cannot be assigned at all.
This is not an exotic edge case. It is by far the most common way users lose funds on Stellar, and it hits beginners making their first deposit from a wallet particularly often. On XRP the same field is called the destination tag; the logic is identical. So before you think about buying routes and price levels, check the banal question: does your platform's deposit page ask for a memo, and did you send one? When in doubt, transfer a small test amount first and only send the rest once it has been credited.
Leverage and liquidation: What the pullback means for leveraged XLM positions
Leverage means you trade with borrowed capital and your position is a multiple of your own stake. The liquidation price is the price at which the platform forcibly closes your position because your margin is used up. It is not a warning signal but an automatic execution.
Work through today's daily data to see how tight that can get. Between the daily high of $0.220096 and the daily low of $0.198654 lies around 9.7 percent. A position with tenfold leverage opened at the high would arithmetically have lost its entire stake at that low, before any assessment of the payment rail played any role at all. At fivefold leverage, roughly half would remain.
If you are leveraged, these are the points that count today: the current distance between market price and liquidation price in percent, the level of funding costs, which are settled every few hours on open positions, and the question of whether your margin is posted in XLM itself. That last point is regularly underestimated: if the collateral falls in step with the position, the liquidation price moves against you while the market falls.
For investors without leverage the picture is simple. A daily loss of seven percent in an asset that is eleven percent higher over the week is a normal pullback and calls for no action.
XLM custody: Exchange account, software wallet or hardware wallet
Where your XLM sit decides who holds the keys. On an exchange account the exchange holds them; you have a claim against the firm. That is convenient, allows immediate trading and is defensible with an authorised provider that segregates client assets. It remains counterparty risk.
In a software wallet on your phone or computer you hold the keys yourself, tied to a device that is online. A hardware wallet keeps the keys in a separate device that never has to go online to sign; it is the choice for amounts you do not intend to move for some time.
Two Stellar-specific quirks come on top. First, the minimum reserve mentioned above: a Stellar account must permanently hold a small amount of XLM, so you cannot empty a wallet to zero. Second, the memo, which is also needed on the way back from the wallet to the exchange. Knowing both before making your first transfer saves you the support case.
Whichever route you take, the same sentence always applies: your wallet's recovery words are the only way back to your funds. They do not belong in a screenshot, in a cloud password manager or in any chat.
XLM price levels: Which documented levels frame the next few days
Rather than naming price targets nobody can document, we stick to the day's numbers. On the downside the daily low of $0.198654 is the first level at which it becomes clear whether the pullback is petering out; below that lies the round $0.19 mark, which Stellar took from below only a few days ago. On the upside the daily high of $0.220096 marks the point at which the day's loss would be recovered.
In euro terms the corresponding levels are the Kraken daily low of €0.174634 and the daily high of €0.192692. Anyone buying and selling in euros should calculate in euros, because otherwise the currency move gets lost in the judgement.
Whether any of these levels holds, we do not predict. All that is documented is that trading actually took place at them on this day, and that makes them traceable reference points for your own order.
Checking the Stellar payment rail: What to take away
- Clarify the buying route and the euro pair. Check whether your provider is authorised under MiCA and whether it quotes a direct XLM/EUR pair or sends you via a dollar stablecoin. An overview of the venues can be found in our comparison of the best crypto exchanges.
- Sort out the holding period and your records. Note the date, quantity and acquisition price for each tranche before you think about taking profits, so that you can document the one-year period under section 23 of the Income Tax Act and the FIFO order. Tools for this are set out in our overview of crypto tax software and portfolio trackers.
- Settle custody and the memo. Decide which part of your holdings stays on the exchange and which moves into your own custody, and test every new transfer route once with a small amount, memo included. Devices and differences are covered in our hardware wallet comparison.
(As of September 24, 2026. This article is not investment advice. Prices and fee structures change; check the terms with the provider before you buy.)
The most important date for the crypto market in the coming weeks is October 28. That is when the US Federal Reserve decides on the policy rate again, and since September 23 the futures markets have held a further increase to be more likely than a pause. One economic figure caused that turn: the flash purchasing managers' index for the United States jumped to 58.4 points, its highest level since July 2021.
For you as an investor in Germany, what counts is less the figure itself than the chain it sets off. Rising rate expectations make credit more expensive, lift the return on safe assets and therefore weigh on everything that throws off no running income. On the morning of September 24, Bitcoin was trading around 2.8 percent below the previous day's level, with individual names in the top 25 considerably weaker. This piece places the data in context and then works through what there is to check in concrete terms: leveraged positions, the one-year deadline under Section 23 EStG, the buying route and custody.
US PMI Jumps to 58.4: What the Purchasing Managers' Index Actually Measures
The purchasing managers' index, or PMI, is a monthly survey of company purchasing managers that puts every answer on a scale around 50 points: readings above 50 mean growth against the previous month, readings below it contraction. The index therefore measures the direction and pace of change; it says nothing about the absolute size of the economy.
The flash reading for September 2026, published on September 23, took the composite index for the United States to 58.4 points. In August it had stood at 56.0. The jump of 2.4 points carries the index to its highest value since July 2021. S&P Global converts the survey readings into annualised growth of roughly 5 percent. That is the relevant order of magnitude: not a mild pick-up but a pace that makes a central bank with inflation concerns sit up.
A second finding from the same survey is often overlooked. Supplier delays were as widespread as at any time since July 2022. S&P Global attributes that to a lack of operating capacity, meaning that companies can no longer serve demand with the plant and workforces they have. Whoever is short on supply has pricing power. That finding therefore leads straight to the second part of the survey.
Input Prices at Their Highest Since October 2022
Alongside activity, the survey also records how companies' input prices are developing. That sub-index came in at 66.4 points in September, and the rate of input price inflation derived from it reached its highest level since October 2022. S&P Global names higher fuel and transport costs along with wage pressure as the drivers. The figures are in the S&P Global press release, which is blocked to automated retrieval but reads normally in a browser.
Why that matters for crypto prices can be said in one sentence: costs that rise at the input stage travel into consumer prices with a lag, and consumer prices are the measure against which the Fed has its 2 percent target judged. A survey nonetheless remains a leading indicator: available earlier than an official price index, and more volatile for it. Reading it as inflation already settled stretches it too far.
Fed Funds Rate at 3.75 to 4.00 Percent: What Was Decided on September 16
The starting point for the current expectation lies a week back. On September 16, 2026, the Fed's Open Market Committee raised the target range for the overnight rate by a quarter point to 3.75 to 4.00 percent, the first increase since July 2023. The decision was unanimous at twelve votes to none. In the text the committee records that inflation remains elevated and justifies the step on the grounds that it supports a more timely return to the 2 percent target. You can read that in the FOMC decision of September 16, 2026.
The direction is what stands out. For two years the question was when the Fed would cut. Since September the question has been how much further it will raise. That reversal is the frame in which the PMI data is read: a central bank that has just raised and expressly calls inflation elevated is handed two arguments for a further step by a jump in activity and firming input prices.
A Rate Hike on October 28: What the Futures Market Prices In Under CME FedWatch
The CME FedWatch tool is not a bank's forecast but a derivation: it works back from the prices of futures contracts on the US overnight rate traded on the CME to establish which rate decision the market is pricing in for each meeting date. The value is a market opinion in percent, and it changes with every trading day.
Following the PMI release, the daily market report of the KuCoin exchange dated September 24 gives a probability of 69.7 percent for an increase of 25 basis points in October. A German-language analysis of the same futures market data most recently put the October 28 meeting at 41.1 percent. Both values were read off at different moments, and the tool updates continuously. What is reliable is therefore the range: the market moved within a few days from a good 40 to almost 70 percent. Treating either figure as settled confuses a snapshot with a decision.
The next meeting falls on October 28, 2026. Several official data releases lie before it, among them the final PMI reading and US consumer prices. Any of them can turn the priced-in probability back the other way.
Crypto Market Falls Broadly: Bitcoin, Ether and the Top 25 Over 24 Hours
We counted for ourselves how broad the reaction is. This analysis was compiled by cryptoticker.io on September 24, 2026. Method: a single pull of the list of the 25 largest cryptocurrencies by market capitalisation from CoinGecko at 06:48 UTC, response HTTP 200, followed by a count of the 24-hour change for each asset excluding stablecoins and the tokenised credit products in the list.
Of the 18 assets remaining, 17 were in the red. Seven lost at least 5 percent, the weakest 10.51 percent. Exactly one gained, by 5.83 percent. Bitcoin traded at $84,160 and therefore 2.75 percent below the previous day, within a daily range of $83,654 to $86,459. Ether stood at $2,688, down 2.53 percent, with a daily range of $2,643 to $2,754. What we could not check is what share of that move came from the spot market and what share from futures positions; the list retrieved does not yield that split.
The picture is therefore clear: the move hits the whole market, not individual projects, and it hits the smaller names harder than the two large ones. The weekly comparison puts it in perspective at the same time. Despite the pullback, Bitcoin stood 9.85 percent above its level seven days earlier, Ether 9.97 percent. The decline gives back part of a strong week.
Inflows into exchange-traded crypto products run the other way. On one trading day of the current week, market reports put $925.82 million into US crypto ETFs, of which $714.7 million went into Bitcoin products; BTC-Echo puts the two trading days of September 21 and 22 together at around $1.7 billion and speaks of the strongest days in months, expressly not of an all-time record. For you in Germany the access route is what matters here: the US spot ETFs cannot be traded here, and the exchange route runs through debt securities on crypto, that is ETNs and ETPs. What that means for your account, fees and taxation is set out in our overview of crypto ETFs in Germany.
Why Rising Rates Weigh on Crypto Prices
The relationship holds for any asset without a running distribution and is therefore no crypto peculiarity. If the yield on short-dated government bonds rises, so does the return an investor receives without price risk. Everything that draws its return solely from a future price gain has to compete against that. Financing becomes more expensive at the same time: anyone holding positions on credit pays more for them, and part of those positions is closed as soon as the arithmetic no longer holds.
That second channel explains why a moderate decline in Bitcoin coincides with considerably larger swings in smaller names. In thinner order books the same amount sold moves the price further. An analyst's view of how much further this runs deliberately has no place here; the mechanism is evidenced, its end point is not.

Leverage and Liquidation: How a Rate Shock Closes a Position Early
Liquidation means that an exchange closes a position held on credit of its own accord, because the collateral lodged no longer covers the loss. The position then ends at the market price at that moment, regardless of what you had expected. In a market-wide pullback such as the one on September 24, that is the point at which a paper loss becomes a realised one.
Liquidation Price, Funding Rate and Margin Call: The Three Numbers That Count
The liquidation price is shown in your exchange's position overview and shifts as soon as you add or withdraw collateral. Check it against the measured daily range: if Bitcoin's daily low was $83,654 and your liquidation price sits close to it, the question is not theoretical. The funding rate is the payment that flows at fixed intervals between the long and short side on perpetual futures; it is the running price of your leverage and accrues regardless of whether the price moves. The margin call, finally, is the collateral you have to supply to avert a liquidation, and the deadline for it is shorter than a trading day at many houses.
In practice that means: note down your liquidation price, the current funding rate and the distance to the collateral threshold before the next data release comes up. Which venues for perpetual contracts set which fees, leverage limits and liquidation rules you will find in our comparison of perp DEX platforms. The rules differ considerably from house to house and are set out in the respective contract terms.
Holding Period and Tax: What Selling Into the Pullback Triggers With the Tax Office
Section 23 EStG applies in Germany to privately held cryptocurrencies. Gains from a sale within a year of purchase are taxable as a private disposal transaction and charged at your personal income tax rate; once a year has passed since acquisition, the gain remains tax free. The deadline runs per acquisition, not per holding, and that is the point at which a pullback can become expensive.
Anyone selling in September 2026 disposes, under the sequence usually applied, of the oldest acquisitions first. With purchases made in the summer of 2026 the one-year deadline cannot arithmetically have been met. A sale made out of nerves ahead of a rate decision can therefore trigger a tax charge that would not have arisen had you sat still. For that you need an unbroken record for each acquisition: date of acquisition, quantity, acquisition cost and venue.
The exemption limit of Section 23(3) EStG also has to be borne in mind. If that amount is exceeded, the entire gain is taxable and not just the excess. The amount in force is best checked against the statutory text or with a tax adviser, because it has been adjusted several times in recent years. Which tools carry acquisitions, deadlines and sequence along automatically is set out in our comparison of crypto tax software.

Buying Route and Custody: Exchange, ETN or Your Own Keys Under MiCA
Since the EU regulation on markets in crypto assets, MiCA for short, has been in application, providers addressing customers in the EU need authorisation as crypto asset service providers. For you that has two practical consequences. First, it is visible who operates under supervision and who does not; the authorisation can be traced with the provider and in the supervisor's registers. Second, the authorisation changes nothing about the question of ownership: a balance in an exchange account is a claim against that company, not direct access to the coins.
Three routes are open to you, and they differ in cost, tax treatment and access. Buying directly on a supervised trading platform and then withdrawing to a wallet of your own gives you the keys and keeps the one-year deadline under Section 23 EStG open. Holding on the exchange account is convenient and lets you act quickly if in doubt, but ties you to the solvency and the trading rules of the house. The exchange route through ETNs and ETPs runs in your usual securities account but follows the taxation of investment products and not the private one-year deadline. Ahead of a rate decision it is worth looking above all at two points: how long a withdrawal takes at your provider, and up to what time of day trading happens at all.
Levels Above and Below: Which Price Levels Are in View Now
Levels here are measured values, not price targets. To the downside sits Bitcoin's daily low of September 24 at $83,654; below that begins territory the retrieved daily range no longer covers. To the upside, the daily high of $86,459 marks the zone in which the week had begun, and market reports place the price on September 24 close to its highest level of the past eight months. For Ether the day spans $2,643 to $2,754.
The frame for that is the calendar. Until October 28 it is the data rather than the chart that decides: final PMI figures, US consumer prices, statements from the board of governors. Anyone setting markers in this phase sensibly sets them against dates and not against prices alone.
Fed Rate Hike and the Crypto Market: What to Take Away
- Check leverage first. Open your position overview and note the liquidation price, the funding rate and the distance to the collateral threshold. Compare the liquidation price against the daily low. Which platform sets which leverage limits and liquidation rules is set out in the perp DEX comparison.
- Settle the buying route and trading hours. Check before October 28 how quickly your provider pays out and takes deposits and whether it is authorised under MiCA. A side-by-side of supervised venues with fees and withdrawal routes is under best crypto exchanges.
- Document acquisitions and deadlines. Record the date, quantity, cost and venue for every acquisition, so that a sale does not fall unintentionally within the one-year deadline of Section 23 EStG. Tools that carry this along continuously are in the tax tool comparison.
(As of September 24, 2026. This article is not investment advice. Prices and fee structures change; check the terms with the provider before you buy.)
If your bank terminates your account after money has arrived from a crypto exchange, that one banking relationship ends, but your participation in the payment system does not. The German Payment Accounts Act (Zahlungskontengesetz, ZKG) gives every consumer lawfully resident in the European Union a right to a basic payment account, and Section 35(1) sentence 3 ZKG expressly forbids a bank from refusing that right on the grounds that another account still exists, when that very account has been terminated. Everything that follows turns on that sentence.
This piece explains what happens legally when an institution ends a banking relationship over crypto payments: which notice period applies, why the letter usually gives no reason, which documents actually bring an anti-money-laundering review to a close, and in what order you approach the consumer arbitration body, the supervisor and the courts. The details relate to German law and to institutions based in Germany.
A Frozen Account and a Terminated Account Are Two Different Things
The two words get mixed up in everyday use, but they lead to completely different steps. A freeze is a temporary measure: the contract continues to exist, the institution merely holds payments or blocks transactions while an internal review runs. A termination ends the payment services framework contract itself. In both cases the balance remains your money; ownership is never in dispute, only access to it.
In practice that means: with a freeze you work towards release and give the bank the documents it lacks. With a termination that route is closed, because nobody can force an institution to continue an ordinary business relationship. Your objective then shifts to two other things: full payout of the balance, and a replacement account that is ready in time.
Often the two come one after the other. First a credit is held up, then a query follows, and if the answer does not come or the institution considers it inadequate, the termination letter arrives weeks later. Taking that first query seriously often prevents the second step.
Why Crypto Payments in Particular Trigger a Review
The trigger sits in the German Anti-Money Laundering Act (Geldwäschegesetz, GwG), and it is not one case handler's discretionary decision. Section 10(1) no. 5 GwG obliges banks to carry out continuous monitoring of the business relationship including transactions and requires a comparison with the information held on business activity and customer profile and, where necessary, on the source of the assets. A credit that does not fit the existing picture of a current account has to stand out under that rule.
Customer profile here simply means the pattern the bank has known from you over the years: salary, rent, direct debits, the occasional saving. A six-figure credit from a payment institution elsewhere in Europe does not fit that pattern, even if it is entirely lawful. It is precisely that deviation that triggers the review, not the word crypto on the statement.
Section 15 GwG comes on top. The provision requires enhanced due diligence as soon as an institution identifies a higher risk of money laundering in the individual case or in its own risk analysis. The extent of the measures follows that risk; the statute sets out no fixed list. That is why the response differs from house to house: one bank asks once, another freezes immediately.
With Bitcoin there is a technical detail that sharpens the problem. If you self-custody, you may have moved a holding across several addresses over years without that producing any evidence in the sense a bank means. The blockchain shows transfers, but neither purchase price nor counterparty, and without supplementary documents an institution can do little with it.
What Section 10(9) GwG Requires and What It Does Not Say
This provision is often cited in blanket terms in termination letters, and a look at the wording is worth the trouble. Subsection 9 sentence 1 states that a business relationship may not be entered into or continued if the obliged entity cannot fulfil the general due diligence obligations under subsection 1 nos. 1 to 4; sentence 2 then requires termination by notice or by other means. What is named there is identification, clarification of the beneficial owner, the purpose of the business relationship and classification as a politically exposed person.
Continuous monitoring including the source of assets sits in no. 5 and therefore outside that list. A missing answer to a source-of-funds question does not, then, automatically trigger the statutory duty to terminate under subsection 9. That does not make a termination ineffective, since the contractual route is sufficient for that in any case. But it shifts the weight in a conversation, because the institution is then relying on its contract law and not on a statutory duty that, at this point, is no duty at all.
Two Months: What Section 675h BGB Requires of the Bank
For an ordinary current account the notice period sits in the German Civil Code. Under Section 675h(2) BGB a payment service provider may terminate the framework contract only where the contract was concluded for an indefinite period and the right of termination has been agreed; the notice period may not fall short of two months. Subsection 4 also forbids the institution from agreeing a charge for the termination.
Two months is the statutory minimum, not a guideline. If your letter states a shorter period, it is worth looking into your institution's general terms and into the question of whether ordinary termination is meant at all. Alongside it, the general right remains to terminate a continuing obligation without notice for good cause under Section 314(1) BGB, where continuation cannot reasonably be expected of the terminating party after weighing the interests on both sides.
The practical consequence of that split matters more than the statutory references. Termination without notice requires a serious individual reason and is therefore open to challenge. Ordinary termination on two months' notice, by contrast, needs no reason, and as a rule you will not get anywhere against it. Your energy therefore belongs not in the fight over the old account but in the new one.

Why the Termination Letter Usually Gives No Reason
For an ordinary current account there is simply no statutory duty to give reasons. With the basic payment account the position is different, and looking there explains the silence in the first case too. Section 43(2) ZKG requires the reason for termination to be stated, but its second sentence expressly provides that this is omitted where it would endanger public security, in particular the rules on preventing money laundering, or would breach a prohibition on disclosure.
A termination letter without a reason is therefore neither an oversight nor a discourtesy but a case the statute provides for. Section 43(5) ZKG closes the circle: if the institution withholds the reason on those grounds, it must inform the competent authority of the termination and the reason. Under Section 46(2) ZKG the competent authority is the Federal Financial Supervisory Authority, BaFin.
For you one thing above all follows from that: pressing the point achieves nothing in this configuration, and irritation at the missing explanation takes you no further. The question you settle instead is whether a working replacement account is in place within the notice period and whether your balance arrives on it in full.
Proof of the Source of Funds Decides More Often Than Any Letter of Objection
As long as the account is merely frozen, the situation can almost always be resolved with documents. Proof of the source of funds is the unbroken account of where the money arriving in the account comes from. With crypto gains that requires a chain beginning with the euro you once transferred to the exchange and ending with the euro now coming back.
That chain can be assembled from:
- the exchange's complete transaction export covering the entire period, not just the year in question
- the bank statements showing your original deposits to the exchange
- purchase and sale confirmations for the individual positions
- a list of your own wallet addresses, where amounts were self-custodied in between
- evidence for special cases such as mining, staking, airdrops or a gift
- your tax return or the tax assessment for the year concerned, in so far as the gains are already recorded there
- a short covering letter that tells the chain in a few sentences and refers to the annexes
The last item is left out most often and works hardest. A stack of uncommented exports generates follow-up questions; one page of prose with clear references ends them. If you buy from the outset through a venue that supplies a clean export across all years, you have that evidence together in a few minutes; our comparison of crypto exchanges shows which providers make history and withdrawal routes available in a form a bank will accept. What a bank checks on the way in we have broken down in our analysis of source of funds on crypto deposits.
Where Proof Fails in Practice
The typical gap rarely sits where investors suspect it. Problems arise where an exchange has closed in the meantime and the export can no longer be retrieved, where holdings were bought over a peer-to-peer platform or privately, or where part of the assets dates from a time when nobody kept records. A reconstructed proof is better than none in such cases, and an openly stated break in the chain reads as more credible than a smoothed-over account.
The second common mistake is timing. If you only react when the termination arrives, you have missed the moment at which documents could still achieve something. The bank's query is the real deadline, not the date in the termination letter.
Your Right to a Basic Payment Account Under Section 31 ZKG
Here lies the most robust lever in the whole subject. Under Section 31(1) ZKG an institution that offers payment accounts to consumers is required to conclude a basic payment account contract with an entitled person, provided the application meets the conditions of Section 33. Entitled is every consumer lawfully resident in the European Union. Subsection 2 sets the institution a deadline: the offer must be made without undue delay, at the latest within ten business days of receipt of the application.
Under Section 34(1) ZKG an institution may refuse such an application only on the grounds named in Sections 35 to 37. That list is exhaustive, and two points within it are decisive for crypto investors:
- Section 35(1) ZKG permits refusal where the applicant already holds a usable payment account. Sentence 3 expressly excepts from that the case where the account has been terminated or the entitled person has been notified of its closure. The termination of your current account is therefore not an obstacle to the basic payment account but precisely the reason why the refusal falls away.
- Section 37 ZKG permits refusal where the same institution lawfully terminated an earlier basic payment account of the same customer within the past year under Section 42(3) no. 2. That bar applies only in relation to that one house.
The charge is not arbitrary either. Section 41(2) ZKG requires the charge for the services provided for by statute to be reasonable, measured against customary market charges and against user behaviour; a contractual penalty in connection with the basic payment account contract is impermissible under subsection 3. And the basic payment account itself is harder to terminate than an ordinary current account: Section 42 ZKG allows termination only on the conditions listed there, for instance after 24 consecutive months without an instructed payment transaction, and even then on at least two months' notice.
What is striking about the situation is that many of the same institutions now offer crypto themselves. The launch of crypto trading at the German savings banks shows how far sales and anti-money-laundering review have drifted apart within a single house.

The BaFin Procedure Under Section 48 ZKG and the Order That Matters
If an institution refuses you the basic payment account, you do not have to go straight to court. Section 48(1) ZKG opens an administrative procedure before the Federal Authority in three cases: where the application is refused, where no decision is taken on it within ten business days, or where the account is not opened within ten business days of the contract being concluded. The Federal Authority confirms receipt and conclusion of the procedure in writing or electronically.
If it concludes that the refusal does not hold, it orders the conclusion of the contract or the opening of the account under Section 49(1) ZKG. The burden of proof sits with the institution: it has to make out the conditions for a permissible refusal to the satisfaction of the supervisor. The Federal Authority may charge the institution a fee for the order. How the procedure runs from a consumer's point of view is described by BaFin on its basic payment account page.
Now the point at which most mistakes happen. Section 48(2) ZKG declares the application inadmissible where proceedings have already been brought before the ordinary courts on the same grounds and are still pending or have been finally decided, or where proceedings are pending before the consumer arbitration body competent under Section 14(1) UKlaG. Whoever goes to arbitration or to court first thereby closes off the fast route through the supervisor. The order is therefore a genuine fork in the road and not a formality.
Equally important is the limit of this procedure: it concerns the basic payment account alone. There is no procedure under Section 48 ZKG against the termination of an ordinary current account, and the supervisor will not get that account back for you either.
Arbitration or Court: What Is Left for the Terminated Current Account
Two routes remain for the old account, and both are limited in effect. The first runs through consumer arbitration. For the basic payment account, Section 43(3) ZKG even obliges the institution to point out in the termination the competent authority under Section 46(2) and the consumer arbitration body competent under Section 14(1) UKlaG, and to give the contact details. Where the house provides its own complaints procedure, the same duty to inform applies under subsection 4.
The second route is an action before the ordinary courts. That rarely makes sense with an ordinary termination on two months' notice, because no reason is required for it. With a termination without notice, with a withheld balance or with loss arising from a delayed payout, the calculation looks different. Both routes bar the administrative procedure on the basic payment account under Section 48(2) ZKG, which is why the replacement account sensibly comes first.
What to Change Before Your Next Withdrawal
The most effective part of this subject is the preventive one. An account that has been terminated is hard to get back; a withdrawal that is explicable from the outset is usually not held up at all.
- Announce larger withdrawals to your bank in advance, informally and in text form, with a line on the source.
- Do not break a large sale into many small transfers. Structuring looks like an attempt at concealment in anti-money-laundering monitoring and generates exactly the attention you want to avoid.
- Download the complete transaction export from your venues at least once a year and keep it outside the platform. Exchanges that have closed supply no history any more.
- Keep a second current account at another institution that serves solely as a fallback and is used regularly.
- Prefer venues with authorisation under the European crypto regulation and with a withdrawal route through an account in the euro area. Which providers meet that is set out in our comparison of regulated crypto exchanges.
- Keep your acquisition records as you go rather than retrospectively. A portfolio and tax tool produces the same history that later serves as proof of source; the selection is in our comparison of crypto tax software.
Frequently Asked Questions on Account Termination Over Crypto
May a bank terminate the account without giving reasons?
With an ordinary current account, yes, provided the contract is open-ended and a right of termination has been agreed; the period is at least two months under Section 675h(2) BGB. With the basic payment account, Section 43(2) ZKG requires reasons, which are however omitted where the anti-money-laundering rules or a prohibition on disclosure would otherwise be affected.
Will I get my balance paid out?
The balance is yours and is to be paid out once the contract ends. Delays almost always arise where an anti-money-laundering review is running in parallel or where no recipient account has been named. A second account at another institution resolves that point in advance.
Do I have to tell the bank I trade crypto?
There is no general duty of disclosure. You should, however, answer specific queries raised in the course of due diligence, because unanswered queries are the most common route from a freeze to a termination.
Will BaFin help against the termination of my current account?
The administrative procedure under Section 48 ZKG applies only to the basic payment account and only in the three cases named there. A general complaint to the supervisor is possible alongside it, but gives you no right to continuation of the old account.
How long does it take for a basic payment account to be in place?
The statute gives the institution ten business days for the offer after receipt of the application. If that period passes without a decision, that is already one of the cases in which Section 48(1) ZKG opens the procedure before the Federal Authority.
Can I simply switch to a direct bank?
That is possible, but it solves the underlying problem only if the new bank assesses the same payment flows differently. The due diligence obligations under the Anti-Money Laundering Act apply equally to every institution; what differs is solely the internal risk classifications.
Account Terminated Over Crypto: What to Take Away
- Answer the query, not the termination. The moment at which documents work lies before the termination letter. Put the proof of source together from the exchange export, bank statements and a short covering letter; which venues supply a history usable for that is shown in the exchange comparison.
- Secure the replacement account immediately. The right under Section 31 ZKG exists regardless of why the old account ended, and Section 35(1) sentence 3 ZKG takes away from the bank precisely the argument that you still have an account. Set up your ongoing documentation correctly at the same time, for instance with a tool from the comparison of crypto tax software.
- Keep to the order. First the application for the basic payment account, then, on refusal or expiry of the period, the procedure under Section 48 ZKG, and only after that arbitration or court, because both bar the supervisory procedure. For future withdrawals you cut the risk most effectively through a regulated venue from our comparison of regulated crypto exchanges.
(As of September 24, 2026. This article is not investment advice and not legal advice. The state of the law, terms and fee structures change; check the terms with the provider before you buy.)
Decrypt
Rachel Conlan arrives as chief strategy officer and Polygon Labs' Jamal Raees takes over payments, both recruited from elsewhere in crypto.
Premier Partnership will livestream the Main Stage through Decrypt Media and bring Rug Radio and FOMO HOUR programming onsite.
Elliptic’s new AI-assisted tool, called Pulse, lets any officer input a wallet address or transaction hash and get a plain-language summary in seconds, aiming to bring crypto tracing beyond specialized units.
The CFTC has been extremely busy ever since the Clarity Act failed its vote, and it appears they’re ready to accelerate.
The threat could arrive before quantum computers are commercially useful, and member states have until the end of 2026 to plan for it.
U.Today - IT, AI and Fintech Daily News for You Today
Data shows that large miner deposits near 20,000 BTC no longer trigger the immediate price drops seen in previous cycles.
XRP Ledger account creation surged more than fourfold above its 30-day average, signaling an unusual burst of network activity.
A sudden price drop accross the market catches traders betting on an increase off guard.
Morgan Stanley has become the only Bitcoin ETF that has not sold Bitcoin in the last 20 days, consistently accumulating the asset amid sustained demand.
Macro models fail as Bitcoin clears $83,000, putting the entire cycle trend on a high-stakes weekly close.
Blockonomi
Key Takeaways
- UBS highlights that increasing US Treasury yields are applying significant pressure to European equity markets, with impacts differing across industry sectors.
- The benchmark 10-year Treasury yield surged from 3.94% in February to reach 5.00% last week, while real yields jumped from 1.68% to 2.67%.
- According to UBS analysts, the yield surge stems from expanding economic growth momentum rather than inflationary concerns, fueled by capital expenditure cycles in defense, artificial intelligence infrastructure, and energy.
- Energy firms, financial institutions, chemical producers and raw materials companies have posted gains in recent months, while construction, telecommunications, utilities and consumer staples have underperformed.
- European equity markets exhibited hesitation on Thursday amid ongoing US-Iran tensions and anticipation of diplomatic talks between Chinese and American leadership.
The surge in bond yields is emerging as an increasingly significant challenge for European equity markets. A recent analysis from UBS indicates that this pressure is being felt unevenly throughout different market segments.
The benchmark US 10-year Treasury yield has experienced a dramatic ascent since the beginning of the year. Starting from 3.94% at February’s close, it reached the 5.00% threshold last week. Meanwhile, real yields—adjusted for inflation expectations—climbed from 1.68% to 2.67% during this timeframe.
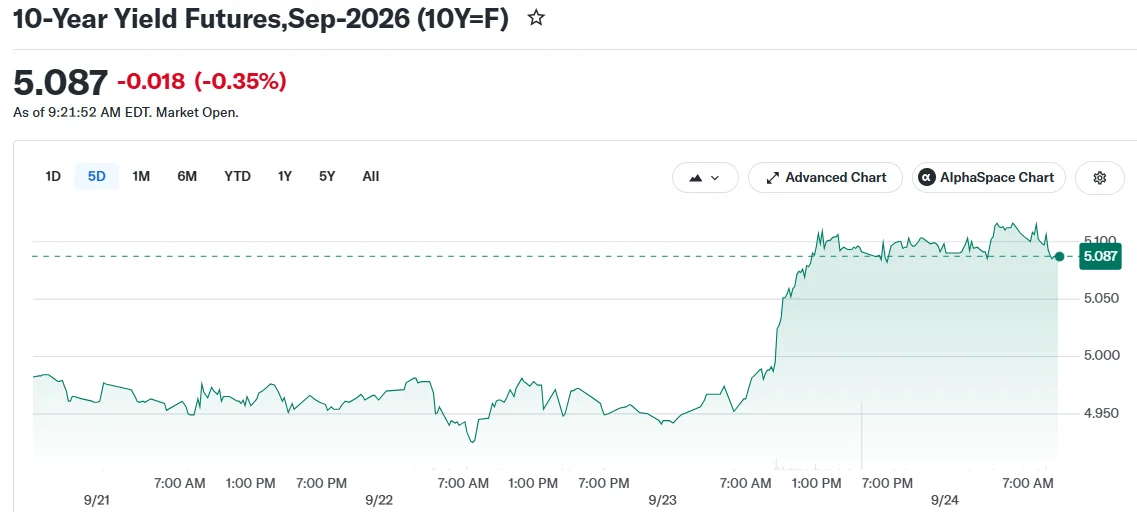
UBS market strategists Gerry Fowler and Sutanya Chedda conducted an analysis examining MSCI Europe index behavior during periods of rising versus declining yields. Their findings reveal that since March 1, weeks characterized by increasing yields saw merely 42% of index constituents gaining weight on average. Conversely, weeks with declining yields witnessed 64% of components advancing.
This 22-percentage-point differential represents the largest gap UBS has documented in their dataset.
Understanding Yield Impact on Equities
The analysts emphasize that absolute yield levels tell only part of the story. The critical factor is the interplay between the level itself and the pace of movement.
When the 10-year yield remained below 3%, even substantial weekly fluctuations left the majority of index components in positive territory. Yield increases at those levels were interpreted as economic expansion signals.
Within the 4% to 4.5% range, market dynamics shifted considerably. Market breadth contracted from 61% during weeks of yield declines to merely 30% when yields surged by more than 20 basis points.
Beyond 4.5%, UBS notes that rapid weekly advances inflict the most significant market damage.
The Drivers Behind Yield Expansion
UBS contends that the yield escalation isn’t rooted in inflation anxiety or fixed income market dysfunction. Rather, it reflects substantial investment in industrial capacity spanning defense sectors, AI hardware production, infrastructure development and power generation.
The firm characterizes this as the first coordinated capital expenditure cycle of this magnitude in a generation. Such activity accelerates money circulation through the economy more rapidly than services-oriented growth typically achieves.
UBS frames this as a fundamental regime shift that markets haven’t adequately priced for three decades. Accelerating velocity against a stable monetary foundation translates to faster nominal GDP expansion, meaning previously neutral policy stances become accommodative. This dynamic could necessitate additional rate increases rather than cuts.
The bank cautioned that policy adjustments may take longer than usual to manifest their effects. Industrial investment operates on multi-year planning horizons. Capital already allocated to power grid connections, military procurement and manufacturing facilities won’t be withdrawn due to isolated rate decisions.
For market participants, UBS suggests prioritizing equities with limited bond yield sensitivity, where profit growth can surpass discount rate increases. Throughout the past quarter, energy producers, banking institutions, chemical manufacturers and commodity providers have advanced. Meanwhile, construction companies, consumer goods producers, telecommunications providers, utilities and food and beverage manufacturers have retreated.
The strategists clarify that the crucial distinction isn’t simply cyclical versus defensive classifications broadly. Rather, it’s whether earnings momentum is sufficient, and valuations attractive enough, to counterbalance rising yield pressures.
European equity markets traded tentatively on Thursday. Both the STOXX 50 and STOXX 600 indices hovered near unchanged levels.
Market participants monitored escalating US-Iran tensions, which sustained elevated oil prices and kept bond yields near multi-year peaks. Traders also anticipated a meeting between Chinese and American presidents for potential breakthroughs on trade disputes.
Technology and financial services stocks numbered among Thursday’s weakest performers. SAP, UBS, Infineon, Mercedes-Benz and Rheinmetall all declined, while H&M shares tumbled nearly 3% following disappointing third-quarter results. LVMH, Novartis and Siemens posted gains.
The post European Equities Face Mounting Pressure as Bond Yields Surge Past 5% appeared first on Blockonomi.
Key Takeaways
- JPMorgan elevated CoreWeave from Neutral to Overweight while increasing its price target from $120 to $125.
- The revised target suggests approximately 44% potential gains from CoreWeave’s trading price around $86.90.
- Analyst Samik Chatterjee highlighted improved compute pricing dynamics, including a July price hike of 25% across all product lines.
- Short-duration contracts at competing providers are priced approximately three times higher than CoreWeave’s extended-term agreements, creating margin expansion opportunities.
- The company’s contracted power capacity expanded from 3.1 gigawatts at 2025 year-end to 4.2 gigawatts as of August 11.
Shares of CoreWeave (CRWV) traded around $86.90 on Thursday following JPMorgan‘s decision to upgrade the cloud computing infrastructure provider. The financial institution shifted its stance to Overweight from Neutral while boosting the price objective to $125 from its previous $120 mark. This updated forecast indicates potential appreciation of roughly 44% from present trading levels.
CoreWeave, Inc. Class A Common Stock, CRWV
According to analyst Samik Chatterjee, the revised outlook centers on the company’s enhanced pricing capabilities. Computing capacity demand has intensified throughout the year, driving widespread price escalation across the industry.
Chatterjee highlighted that CoreWeave implemented a comprehensive 25% price increase across its entire product portfolio in July. Competitor Nebius has similarly pursued aggressive pricing adjustments.
Near-term computing agreements at certain rivals are commanding rates approaching triple what CoreWeave bills for its extended-duration contracts. This substantial pricing differential provides CoreWeave with significant flexibility to modify rates while maintaining customer retention.
Profitability Metrics Improving
The company’s most recent contracts, finalized during its third fiscal quarter, averaged approximately $40 million per megawatt. Company executives indicate that enhanced pricing is contributing between 5 and 10 percentage points to contribution margins on newly executed agreements.
Chatterjee stated this trend is “dispelling any concerns that the higher price is purely a pass-through of higher costs.” Essentially, the organization appears to be retaining genuine margin improvements rather than simply transferring cost increases to clients.
The analyst also tackled shareholder concerns regarding the capital requirements CoreWeave faces to sustain its expansion trajectory. Chatterjee anticipates that pricing advantages and margin enhancement will exceed the additional leverage associated with financing its infrastructure development.
JPMorgan observed that CoreWeave shares have remained within a narrow trading band throughout the year. This stability persists despite the company elevating all components of its 2026 guidance during this period.
The firm’s contracted power capacity has demonstrated consistent growth. It advanced from 3.1 gigawatts at the conclusion of 2025 to 4.2 gigawatts by August 11.
Wall Street Sentiment
JPMorgan’s optimistic position isn’t isolated. UBS initiated coverage this week with a Buy recommendation and $120 price objective, emphasizing robust AI-computing demand drivers.
TD Cowen elevated CoreWeave to Buy in July. Both Mizuho and Goldman Sachs have increased their price projections in recent months, although both maintained neutral positions.
Among the 34 analysts tracking the stock, one assigns a Strong Buy rating, 21 recommend Buy, nine suggest Hold, and three advise Sell. MarketBeat reports the average recommendation as Moderate Buy with a consensus price objective of $138.78.
CoreWeave’s most recent quarterly results, published August 11, revealed revenue of $2.58 billion. This represents 112.5% year-over-year growth, although the company recorded a net loss during the period.
Several insider transactions have taken place lately. CFO Nitin Agrawal divested 66,576 shares on September 14, while EVP Chen Goldberg sold 22,424 shares on September 8.
CoreWeave additionally finalized an expanded convertible notes offering totaling approximately $4.2 billion this month. The offering exceeded the original $3 billion target and will support the company’s data center expansion initiatives.
The post JPMorgan Boosts CoreWeave (CRWV) Stock Rating on Pricing Strength appeared first on Blockonomi.
Key Takeaways
- Oracle filed a force majeure declaration for its Project Jupiter AI data center located in New Mexico.
- The filing is intended to protect Oracle from financial obligations should the facility fail to launch by 2028.
- Oracle shares declined approximately 4%, while Blue Owl Capital retreated 4% and Bloom Energy tumbled 6%.
- A critical natural gas pipeline required for the project has been postponed until February 2027.
- Project Jupiter represents a significant component of the Stargate AI infrastructure collaboration involving OpenAI and SoftBank.
Shares of Oracle (ORCL) tumbled approximately 4% following reports that the tech giant delivered a force majeure notification to the developer overseeing its Project Jupiter data center facility in New Mexico. The announcement also triggered declines in Blue Owl Capital (OWL), which fell 4%, and Bloom Energy (BE), which plunged 6%.
Oracle Corporation, ORCL
According to Bloomberg’s initial report, the notification serves as a legal safeguard to shield Oracle from potential penalties should the ambitious AI-focused data center miss its scheduled 2028 completion target. Oracle holds the position as the primary tenant for the campus.
Stack Infrastructure, a company within Blue Owl Capital’s investment portfolio, is responsible for constructing Project Jupiter. The facility is designed to supply 2.45 gigawatts of electrical capacity—sufficient to power approximately 1.8 million residential homes.
This magnitude positions it among the most substantial data center developments connected to the artificial intelligence expansion. However, the venture has encountered significant infrastructure challenges: access to water resources and reliable power generation.
The Critical Pipeline Challenge
Oracle formed a partnership with Bloom Energy to operate the facility using solid oxide fuel cell technology. These power systems are particularly suitable for New Mexico’s arid environment because they require minimal water for electricity production.
The complication lies in the fuel cells’ dependence on a consistent natural gas supply. This gas is scheduled to be delivered via a 17-mile pipeline infrastructure known as the Green Chile Project, managed by Energy Transfer.
The pipeline’s original completion date was set for August 2026. Current projections now indicate a February 2027 delivery.
This setback results from the New Mexico State Land Office’s continued rejection of right-of-way authorization across state trust territories. Community leaders and environmental advocacy organizations have voiced objections regarding environmental consequences and pressure on local resources.
In the absence of the pipeline infrastructure, Bloom’s fuel cell systems cannot operate. This situation currently leaves the data center campus without a functional electricity source.
Force majeure provisions enable corporations to suspend contractual responsibilities when unforeseen and unavoidable circumstances arise. Oracle characterizes its invocation of this clause as a protective measure.
The corporation asserts that “Project Jupiter remains on our planned schedule.” Nevertheless, the legal filing indicates genuine apprehension about meeting the established timeline.
Financial Implications
Approximately 20 financial institutions assembled an $18 billion lending package to fund the campus construction. This represents substantial capital exposure to a project now confronting a stalled pipeline and community opposition.
Should Oracle secure payment flexibility from Blue Owl, it could nonetheless create uncertainty among the financial institutions backing the development. This dispute introduces additional complexity to a project that has been under development for nearly two years.
Project Jupiter doesn’t exist in isolation. It functions as an integral element of the expansive Stargate initiative, which also encompasses OpenAI and SoftBank, and was publicly unveiled with President Trump present alongside leadership from all participating organizations.
SoftBank (SFTBY) shares similarly declined roughly 6% after the disclosure. The widespread stock market reaction demonstrates how interconnected these corporations have become through their collective AI infrastructure investments.
Oracle has not publicly clarified whether the force majeure declaration would completely absolve the company from its current financial obligations associated with the project. Bloomberg published the story based on information from sources with knowledge of the situation.
The post Oracle (ORCL) Stock Slides 4% Amid Project Jupiter Data Center Dispute appeared first on Blockonomi.
Key Highlights
- Operating profit reached 6.04 billion Swedish crowns in Q3, surpassing analyst expectations of 5.14 billion crowns.
- Gross margin expanded to 54.0% versus 52.9% year-over-year, exceeding forecasts of 53.4%.
- Shares declined approximately 2-3% following guidance showing September sales growth of only 1%.
- CEO Daniel Erver continues implementing strategies for faster production cycles and trend responsiveness through near-market manufacturing.
- Revenue in Western Europe declined 1% during the quarter, attributed to ongoing consumer spending pressures.
H&M (HMb) shares tumbled by as much as 3% during Thursday trading before stabilizing at a 2% decline, despite the Swedish apparel giant delivering better-than-expected earnings for its third fiscal quarter.
H&M Hennes & Mauritz AB ADR, HNNMY
The retailer reported operating profit of 6.04 billion Swedish crowns for the June-August period, a significant increase from 4.91 billion crowns in the same quarter last year. This result comfortably surpassed the analyst consensus of 5.14 billion crowns compiled by LSEG.
The company’s gross margin also exceeded expectations, climbing to 54.0% compared to 52.9% in the prior-year period. Market watchers had anticipated a margin of 53.4%.
However, the forward-looking guidance failed to inspire confidence among shareholders. The company disclosed that September revenue is expected to increase by a mere 1% in local currency terms, mirroring the lackluster growth rate observed throughout the third quarter.
This modest performance contrasts sharply with competitor Inditex, Zara’s parent company, which announced 9% sales expansion earlier this month. The disparity highlights the competitive challenges H&M currently faces in the fast-fashion landscape.
Accelerating Product Turnaround Times
Daniel Erver, who assumed the CEO role in January 2024, has prioritized operational efficiency and supply chain optimization during his leadership. In comments to Reuters, he revealed the company has reduced the timeline from design concept to retail floor to just six weeks.
The strategy involves increasing the proportion of inventory purchased through this expedited process, minimizing delays between identifying fashion trends and delivering products to consumers. Erver emphasized this agility is increasingly critical given volatile weather conditions and rapidly evolving consumer preferences.
The company’s most important market, Western Europe, presented a more challenging picture. Regional sales contracted 1% during the reporting period. Erver attributed this weakness to consumers experiencing “a lot of pressure for a long time.”
Operational restructuring also impacted results. The closure of H&M’s Belgian distribution center during the quarter created headwinds for regional revenue performance.
One-Time Tariff Benefits Not Expected to Continue
A portion of this quarter’s profitability boost stemmed from a non-recurring refund related to previous US tariff payments. H&M explicitly stated that similar refunds are not anticipated in future periods.
Shipping expenses increased during the quarter, which the company identified as an external headwind affecting procurement costs. Promotional markdown expenses remained relatively flat compared to the previous year.
For the upcoming fourth quarter, H&M anticipates external cost pressures will be moderately unfavorable versus last year. Markdown expenses as a percentage of revenue are projected to edge higher, partially due to an extended promotional period leading up to Black Friday this year.
The retailer continues reducing its physical footprint while investing in existing locations. Approximately 20% of its nearly 4,000 stores worldwide have undergone renovation.
Digital commerce now represents over 30% of H&M’s total revenue. The company plans to activate additional European distribution facilities within the next year to support this expanding channel.
Erver also commented on the European Union’s newly implemented customs duties on low-value ecommerce shipments, regulations he previously advocated for to create competitive parity against Shein and Temu. He indicated these changes are unlikely to materially impact H&M’s sales performance.
Total third-quarter revenue reached 57.189 billion Swedish crowns, marginally higher than the 57.017 billion crowns recorded in the comparable period last year.
The post H&M (HMb) Stock Slides 2% Despite Earnings Beat on Sluggish Sales Growth appeared first on Blockonomi.
Key Highlights
- SK Hynix (SKHY) began Thursday trading at $189 following a 3% decline in the prior session.
- Wolfe Research elevated its price target on SKHY to $250 from $200, suggesting approximately 32% potential upside.
- Analyst Chris Caso maintained his Buy rating, highlighting robust memory market pricing and strong cash generation.
- The firm simultaneously increased its Micron (MU) price objective to $1,500 before the company’s September 30 earnings release.
- Consensus analyst ratings for both memory semiconductor manufacturers remain at Strong Buy.
Shares of SK Hynix (SKHY) commenced Thursday’s trading session at $189 after experiencing a 3% pullback during Wednesday’s market action. The semiconductor stock recently peaked at $199.86 for the year but has struggled to break through the psychological $200 threshold.
SK hynix Inc., SKHY
Investment firm Wolfe Research anticipates that resistance level will be breached soon. Equity analyst Chris Caso increased his SKHY price objective to $250 from a previous $200 target, representing roughly 32% appreciation potential from present trading levels.
According to TipRanks, Caso holds the 82nd position among over 12,500 monitored analysts. His recommendations demonstrate a 63% accuracy rate with an impressive 32.70% average return.
The bullish revision extended beyond SK Hynix alone. Wolfe Research simultaneously maintained its Buy recommendation on Micron (MU), establishing a $1,500 price objective for that memory chipmaker as well.
Memory Sector Strength Drives Bullish Outlook
Caso identified persistent pricing power throughout the memory semiconductor industry as the primary catalyst supporting the elevated price targets. His analysis projects demand will exceed available supply through a minimum of 2028.
Advanced high-bandwidth memory (HBM) pricing dynamics and accelerated capacity buildouts form additional pillars of the investment thesis. Caso anticipates additional HBM price appreciation during 2027, building upon the upward momentum that began in late 2025.
The analyst also tackled investor concerns regarding potential “de-speccing” trends in memory products. Per Caso’s assessment, specification reductions reflect constrained supply availability rather than diminishing HBM value proposition.
Extended contract agreements establish fixed pricing for portions of bit shipment volumes at both manufacturers. However, Caso identifies near-term upside opportunities stemming from sales activity occurring outside these locked-in arrangements.
Capital Returns and Free Cash Flow Generation
The analyst emphasized free cash flow generation as a critical component of the investment narrative. His projections indicate SK Hynix and Micron will produce sufficient cash during 2026 and 2027 to facilitate share repurchases equivalent to 32% and 25% of their respective valuations.
This buyback activity could amplify 2027 earnings per share by as much as 47% for SK Hynix and 34% for Micron, based on Wolfe Research’s models. Should favorable market conditions persist through 2028, aggregate repurchase programs could surpass 50% of both companies’ market capitalizations.
“While much of the positive outlook is already known, we think the cash flow will be difficult to ignore,” Caso wrote in a note to investors.
Currency headwinds entered Caso’s analysis as well. The Korean won’s 14% appreciation versus the U.S. dollar throughout the quarter may pressure SK Hynix’s operating margin performance, he observed.
Micron is scheduled to announce fiscal fourth-quarter results on September 30. Analyst consensus anticipates earnings per share of $31.49, representing substantial growth from $3.03 in the year-ago period, while revenue is forecast to surge approximately 350% to $50.91 billion.
Wall Street maintains a Strong Buy consensus on both stocks. TipRanks data shows the average price target implies higher upside for Micron than for SK Hynix.
Through the current year, Micron shares have advanced approximately 276%. SK Hynix’s U.S.-traded American depositary receipts have gained roughly 13% during the identical timeframe.
The post SK Hynix (SKHY) Stock: Wolfe Research Analyst Boosts Target to $250, Sees Major Upside appeared first on Blockonomi.
CryptoPotato
FXRP has reached its first anniversary on Flare as the network expands the number of financial applications available to XRP holders. The token went live on September 24, 2025, as the first asset launched through Flare’s FAssets system.
Its initial 5 million minting limit was filled within roughly four hours.
Flare’s Expansion
The milestone comes after a year of development around lending, liquidity, staking, and yield products. FXRP represents XRP on Flare as an ERC-20 token. The asset is backed by XRP on the XRP Ledger through the FAssets system. Flare uses its oracle protocol FDC to verify activity on the XRPL.
Several protocols have since built products around the token. Kinetic introduced lending markets. SparkDEX, BlazeSwap, and Enosys developed liquidity venues. Firelight uses FXRP to build onchain cover, turning staked XRP into capital designed to provide capital against risks such as exploits, oracle failures, and bad debt. Spectra brought fixed-rate and yield trading to the asset. Upshift’s earnXRP and Clearstar added vault-based strategies. Enosys also introduced a way to use the token as collateral for debt.
Access from the XRP Ledger has also been a focus. Flare Smart Accounts connect XRPL activity with applications running on Flare. The system was integrated with Xaman in February 2026 through earnXRP. Later updates added more wallet support and reduced some supported processes to a single XRP Ledger signature.
The network also made changes for broader distribution. For instance, FAssets v1.3, which was released in May, added destination-tag minting. The feature is intended to make integrations with exchanges and custodians easier. FXRP also expanded in 2026 to Ethereum and Base.
Another development came in August. A Morpho market built with Sentora allowed it to be supplied as collateral for borrowing RLUSD on Ethereum. The development expanded FXRP’s use into credit markets, beyond liquidity and yield applications. Flare also made changes to its token economics. FIP.16 cut annual FLR issuance from 5% to 3%. The proposal also reduced the annual issuance ceiling from 5 billion FLR to 3 billion FLR.
Additionally, the network is developing Flare Confidential Compute and Protocol Managed Wallets. The initial deployment path for these systems is planned through Songbird.
Flare said the technology is intended to support assets beyond XRP. Its data protocols are integrated into network consensus, which lets assets issued elsewhere be verified and used in applications without requiring the underlying asset to leave its original ledger. FXRP is the first production example of that model on Flare.
Partnership With D’CENT
In May, Flare expanded its XRPFi push with D’CENT Wallet to give its hardware-wallet users a direct way to access XRP yield products. The integration was built around Flare Smart Accounts, so users did not need to move to another chain or hold a separate gas token.
Instead, they could access the Monarq XRP Yield Vault and earnXRP through two signatures on the XRP Ledger. The move was part of the newly formed XRP Alliance, which also includes Doppler, Banxa, and Squid.
The post FXRP Hits One Year as Flare Expands What XRP Can Do Onchain appeared first on CryptoPotato.
Most crypto and fintech founders build their marketing for retail audiences first. That’s understandable — retail audiences are large, accessible, and respond to the energy that drives a project’s early community. But when the same founder walks into a family office meeting or pitches an institutional fund carrying materials built for someone else, the results are predictable: polite non-answers, long silences, no term sheet.
Institutional investors and high-net-worth individuals evaluate blockchain companies differently than retail participants do. They have legal teams, compliance officers, and risk committees. They care about regulatory positioning, not roadmaps. They read footnotes. Reaching them requires a different kind of marketing — one built around credibility, precision, and compliance awareness from the ground up.

Positioning: Stop Competing With the Noise
The first problem most blockchain startups have is that their positioning is indistinguishable from thousands of other projects. “Decentralized,” “trustless,” “next-generation” — these words appear on countless project websites and tell an institutional investor nothing useful. At best, they signal that the team communicates for retail traders. At worst, they raise the concern that the project can’t explain itself in plain terms.
Effective positioning for institutional audiences starts with specificity. What problem, exactly, does this company solve? For whom? What is the market size, sourced from identifiable data? What does the competitive landscape actually look like — not dismissively (“we’re better than X”), but in an honest structural analysis of where this company sits?
A family office managing $200 million doesn’t need to feel excited. It needs to see that the founding team understands the space clearly enough to place a coherent bet on itself.
The table below shows how the two audiences read the same marketing signals differently:

The implication is direct: a company can’t run one marketing program for both audiences. The signals that build retail excitement actively undermine institutional credibility.
Credibility-Building Content: Show Work, Not Vision
Institutional investors don’t respond to vision decks the way early adopters do. They respond to evidence. A content strategy targeting this audience needs to demonstrate expertise, not announce ambition.
The content formats that carry real weight with institutional readers are specific:
- Audited white papers — written to a technical standard, with methodology documented and findings signed off by an independent auditor, not internal team members
- Cited research reports — market analysis, protocol assessments, or competitive reviews thorough enough that other practitioners reference them
- Trade press bylines — published in Bloomberg, the Financial Times, Reuters, The Block, or CoinDesk’s institutional coverage, not consumer crypto outlets
- Legal and regulatory memos — brief, factual documents that show the company understands its jurisdictional exposure and has addressed it
- Team credential materials — structured backgrounds for key hires that surface relevant prior roles: exchange positions, regulatory agency experience, institutional fund management
Leadership credibility is a separate lever. Institutional investors diligence people before they diligence protocols. A CIO who previously ran a prime brokerage desk, or a general counsel who came from a regulatory agency — these are marketing assets. They belong in investor materials, not buried in an about page.
Working with a specialist in blockchain marketing, such as ICODA, often makes sense at this stage because the content standards for institutional audiences differ in kind, not just degree. A generalist agency experienced in SaaS or e-commerce campaigns doesn’t know why a tokenomics paper needs an independent auditor’s sign-off — or why a hedge fund’s compliance officer will kill a deal if the company’s website carries “not financial advice” disclaimers in the footer while the homepage talks about guaranteed yields.
Compliance-Aware Messaging: The Rules Are Part of the Product
This is where most blockchain startups underestimate the problem. Securities law, AML obligations, investor accreditation requirements, and jurisdiction-specific disclosure rules create a constraint landscape that effective institutional marketing has to be built inside — not layered onto afterward.
These are the messaging mistakes that most commonly damage credibility with institutional audiences — and in some cases create direct legal exposure:
- Implying returns — any language that suggests historical performance will repeat, or that a yield is predictable, is both a compliance violation and a red flag for legal teams
- Skipping risk sections — pitch decks or one-pagers that omit regulatory risk, counterparty risk, or liquidity risk read as either naïve or deliberately evasive
- Using general solicitation channels for restricted offerings — an email campaign or social post promoting a Regulation D private placement to an unqualified audience can void the exemption entirely
- Inconsistent disclaimers — “not financial advice” in the footer while the homepage describes projected returns signals to compliance reviewers that the team doesn’t understand what the disclaimer actually requires
None of this means messaging has to be evasive. It means it has to be precise. There’s a difference between “our protocol returned 340% to early participants” (a liability) and “here is an independent analysis of how the protocol performed under the following conditions” (a reference document). The second version tells the same story with more substance and less exposure.
Institutional-grade messaging also addresses risk directly. Retail marketing tends to minimize or avoid risk language. Institutional investors expect it. A pitch deck that doesn’t acknowledge regulatory risk, counterparty risk, and liquidity risk reads as either naïve or evasive. A risk section isn’t a weakness — it demonstrates that the team has a mature view of its own business.
The Underlying Issue
The gap between retail crypto marketing and institutional crypto marketing isn’t a matter of tone or production quality. It’s a structural difference in what the audience values, what they’re allowed to respond to, and what professional consequences they face if they back a company that turns out to have operated carelessly.
Institutional capital markets run on reputation and referrals. A firm that impresses a family office once gets introduced to three others. A firm that wastes their time doesn’t get a second meeting.
The companies that close institutional rounds aren’t always the ones with the best technology. They’re the ones that understood who they were talking to and built everything — content, positioning, legal review, distribution channels — around that understanding. That’s not a niche marketing problem. It’s a business problem that marketing is responsible for solving.
Disclaimer: The above article is sponsored content; it’s written by a third party. CryptoPotato doesn’t endorse or assume responsibility for the content, advertising, products, quality, accuracy, or other materials on this page. Nothing in it should be construed as financial advice. Readers are strongly advised to verify the information independently and carefully before engaging with any company or project mentioned and to do their own research. Investing in cryptocurrencies carries a risk of capital loss, and readers are also advised to consult a professional before making any decisions that may or may not be based on the above-sponsored content.
Readers are also advised to read CryptoPotato’s full disclaimer.
The post Why Blockchain Startups Need Different Marketing for Institutional Investors appeared first on CryptoPotato.
Ethereum is consolidating after a sharp recovery from the $1.5K area and a subsequent breakout above the $2.1K region. The second-largest crypto asset is now trading around $2.64K, with the latest pullback occurring directly inside a major resistance zone. The broader structure remains constructive, although short-term momentum has weakened following the rejection near $2.8K.
Ethereum Price Analysis: The Daily Chart
The daily chart shows a clear structural improvement from the June low near $1.5K. ETH subsequently established higher lows and pushed through the $2K-$2.1K area after accelerating higher in August. The latter part was the strongest structural move, but it has led to consolidation in September, which has become an important reference for the current trend.
ETH recently pushed toward $2.8K before reversing. The current level at around $2.64K is therefore sitting inside the marked $2.6K-$2.7K resistance zone. A sustained daily close above this area would strengthen the breakout structure and leave the $3K region as the next immediate resistance.
On the downside, the first important support is around the same consolidation area at $2.4K-$2.5K. A deeper correction, however, could bring ETH toward the $2.1K support region, where the 100-day and 200-day moving averages are also closing in to form a potential bullish crossover. This makes the mentioned area the most important level for the market to hold in order to not fall back into a downward spiral once again.
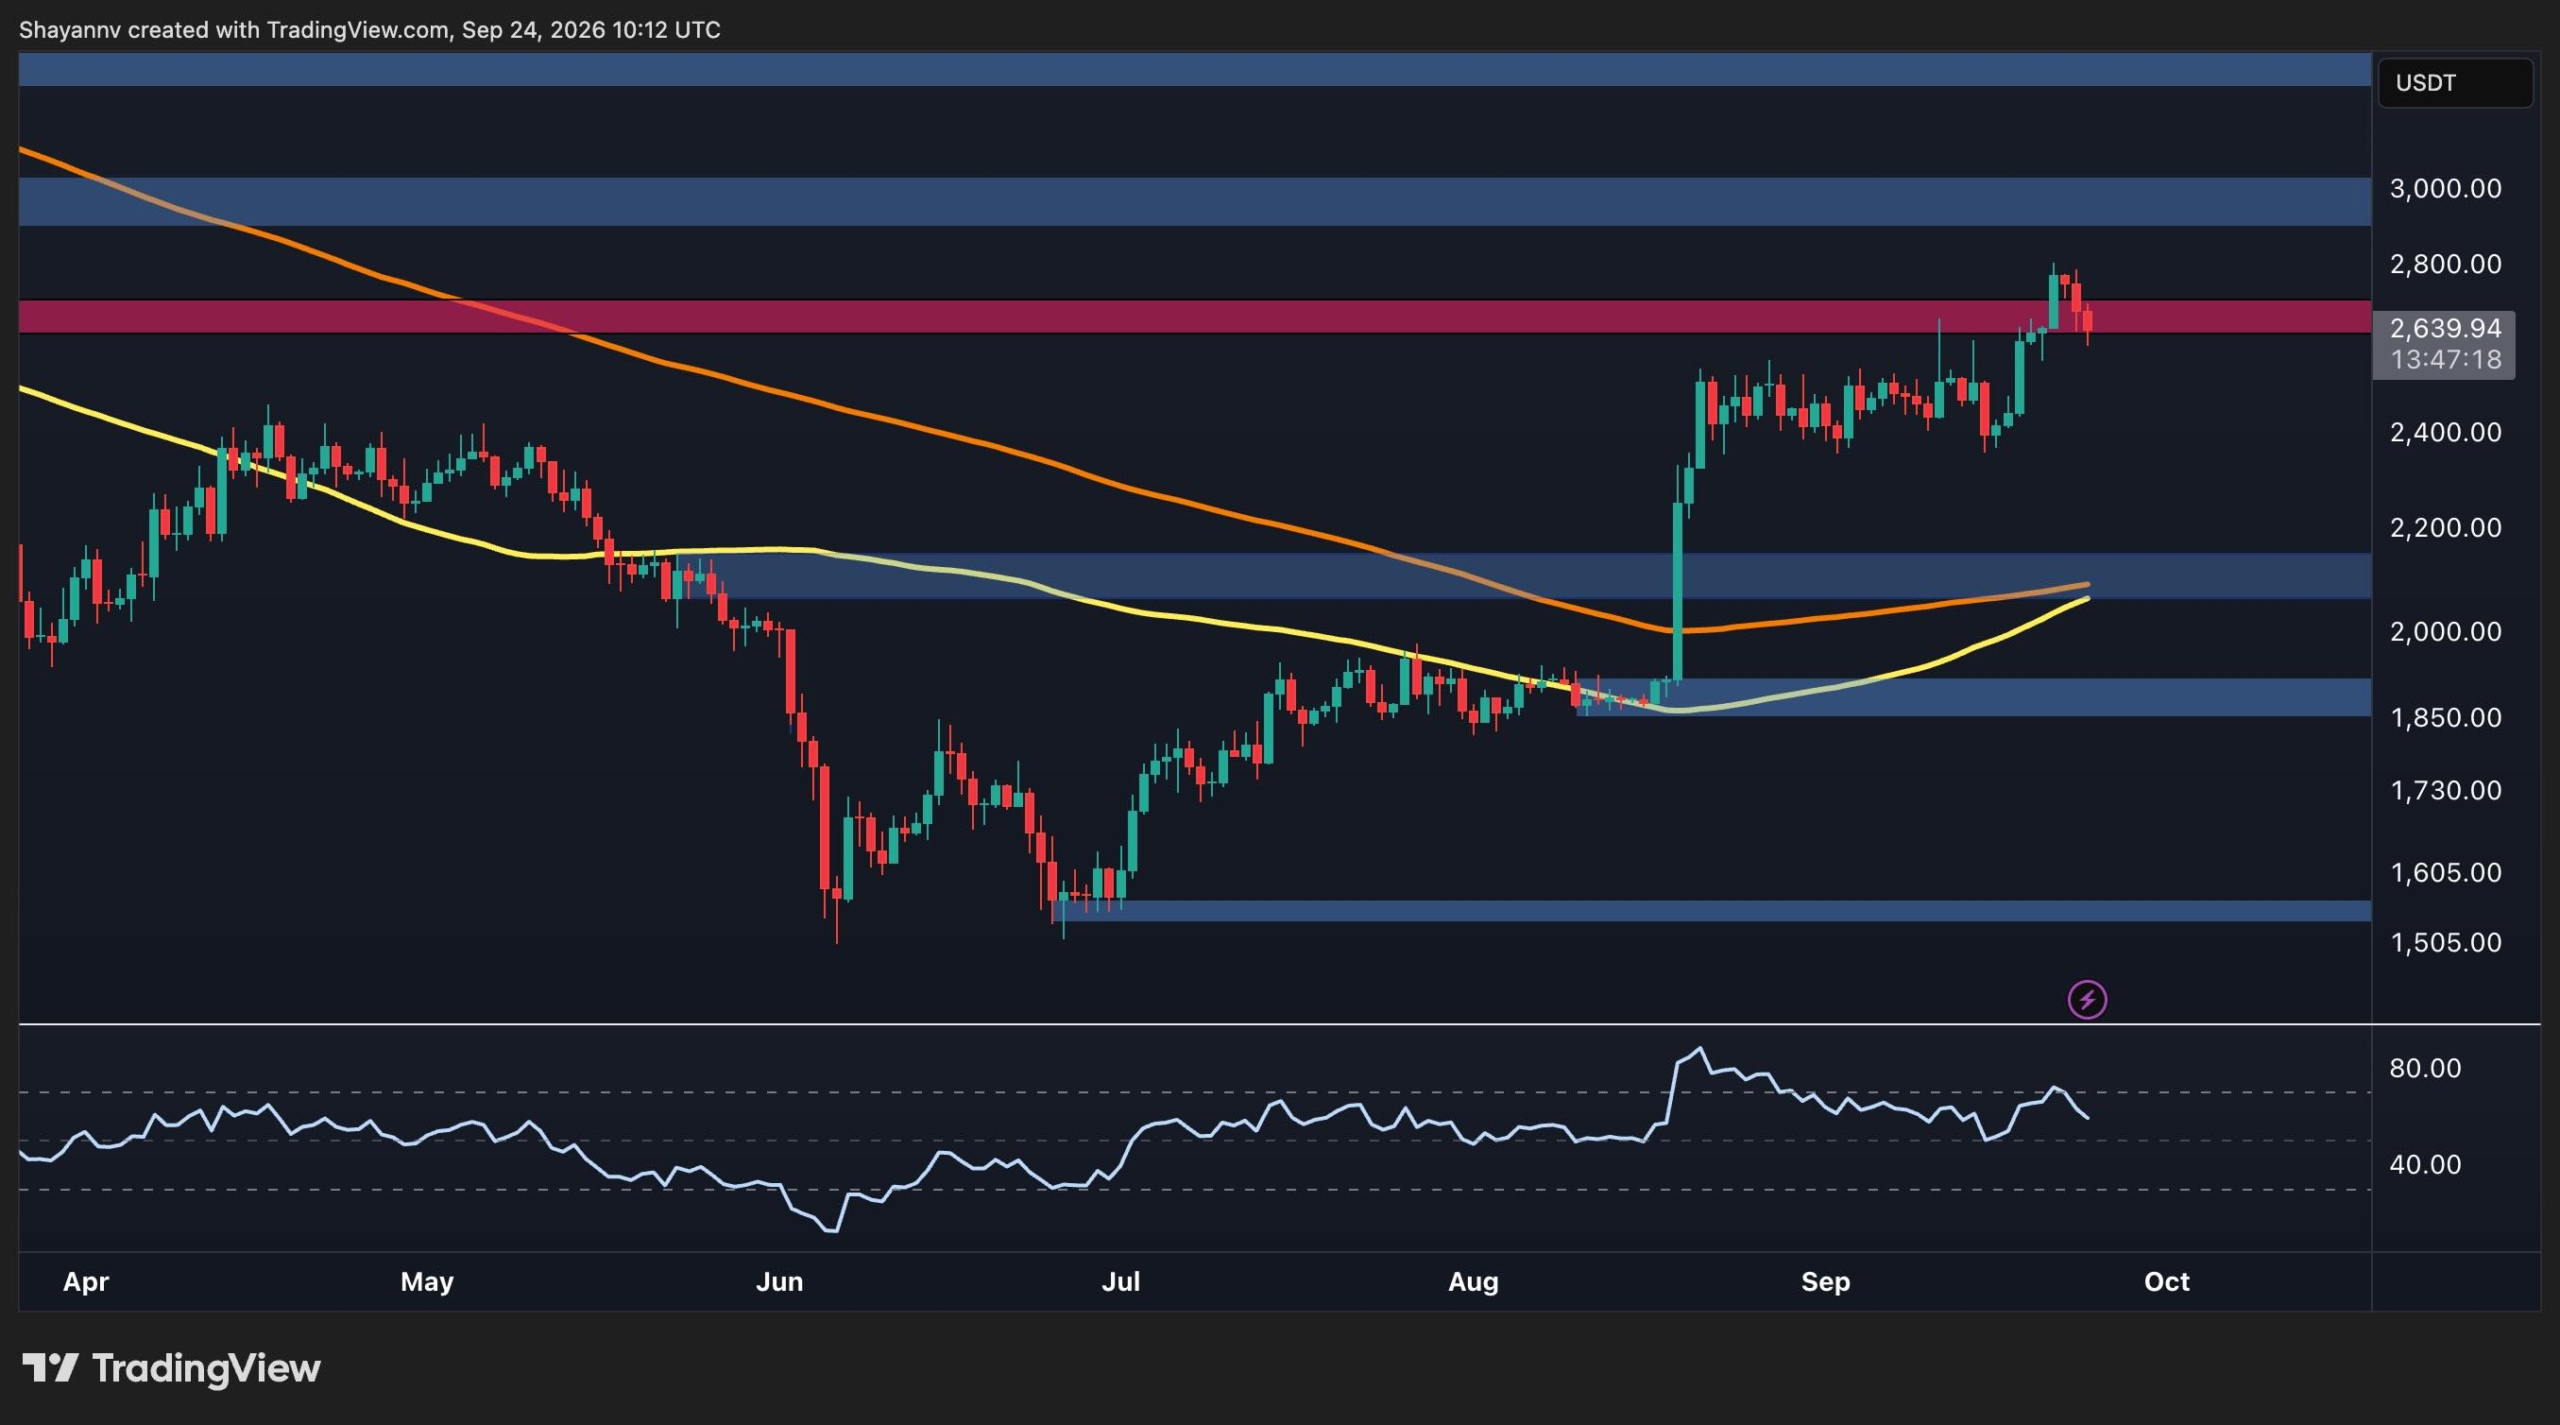
ETH/USDT 4-Hour Chart
The 4-hour chart provides a clearer picture of the recent consolidation and rejection. ETH rallied from approximately $2.4K and broke sharply higher, reaching the $2.8K area. However, several candles subsequently failed to maintain those highs, producing a pullback toward the $2.6K resistance zone.
The immediate battle is therefore around the same $2.6K-$2.7K zone. ETH is currently trading close to the lower portion of this area after the rejection around $2.8K. A recovery back above $2.7K would put the recent short-term highs around $2.8K back into focus.
Conversely, continued rejection from the current zone could send ETH toward the bullish order block around $2.45K. This is the most important near-term downside area on the chart. Losing it would weaken the short-term breakout structure and could expose the next order block around $2.25K.
The 4-hour RSI has also deteriorated noticeably from its recent overbought readings and is now below the 50 level. This reflects the loss of short-term momentum rather than a confirmed broader trend reversal. For the bullish structure to remain intact, however, ETH would ideally need to stabilize above the $2.5K region.

On-Chain Analysis
The exchange supply ratio measures the proportion of Ethereum’s circulating supply held on exchanges. A declining ratio generally means that a smaller share of the available ETH supply is sitting on exchanges, while a rising ratio indicates that more ETH is being held in exchange wallets.
The chart demonstrates a pronounced decline in Ethereum’s exchange supply ratio over the past couple of years. The metric has fallen from roughly 0.18 in early 2025 to approximately 0.123 currently, even as ETH has recovered back above $2.5K.
The latest move is particularly notable because the exchange supply ratio continues to sit near the lowest levels shown on the chart while ETH has recently accelerated higher. This indicates that the amount of ETH held on exchanges relative to supply has continued to contract during the broader recovery.
From a market-structure perspective, a persistently lower exchange supply ratio can mean that less ETH is immediately available on exchanges for potential selling. However, the metric by itself does not establish that prices must rise, and the current price rejection around $2.8K shows that resistance remains relevant, and that any supply shrink should be accompanied by sufficient demand to push the recovery further.

The post Ethereum Price Prediction: ETH Failed at $2.8K – Which Levels Matter Now? appeared first on CryptoPotato.
XRP’s breakout from its descending channel delivered a strong rally, but the move has now met substantial selling pressure at a major resistance area. The resulting pullback puts the recent breakout to the test, with the next reaction around former resistance likely to be important for the short-term structure.
Ripple Price Analysis: The Daily Chart
On the daily chart, Ripple’s XRP remains structurally stronger following its sharp rebound from the $1.27 region. The asset rallied rapidly toward the major $1.61-$1.70 resistance zone, briefly entering this area before sellers stepped in aggressively.
The rejection has pushed XRP back toward $1.47, showing that supply around $1.61-$1.70 remains significant. Nevertheless, the broader recovery structure has not yet been invalidated. The price remains well above the moving averages, with the higher one currently positioned around $1.27 and potentially acting as an important dynamic support if a deeper correction develops.
For buyers, reclaiming $1.55 and eventually breaking through the $1.61-$1.70 resistance zone would be required to resume the bullish leg. Conversely, continued selling could lead to a broader retracement, with the $1.40 area becoming relevant before the more substantial $1.27 region comes back into focus.
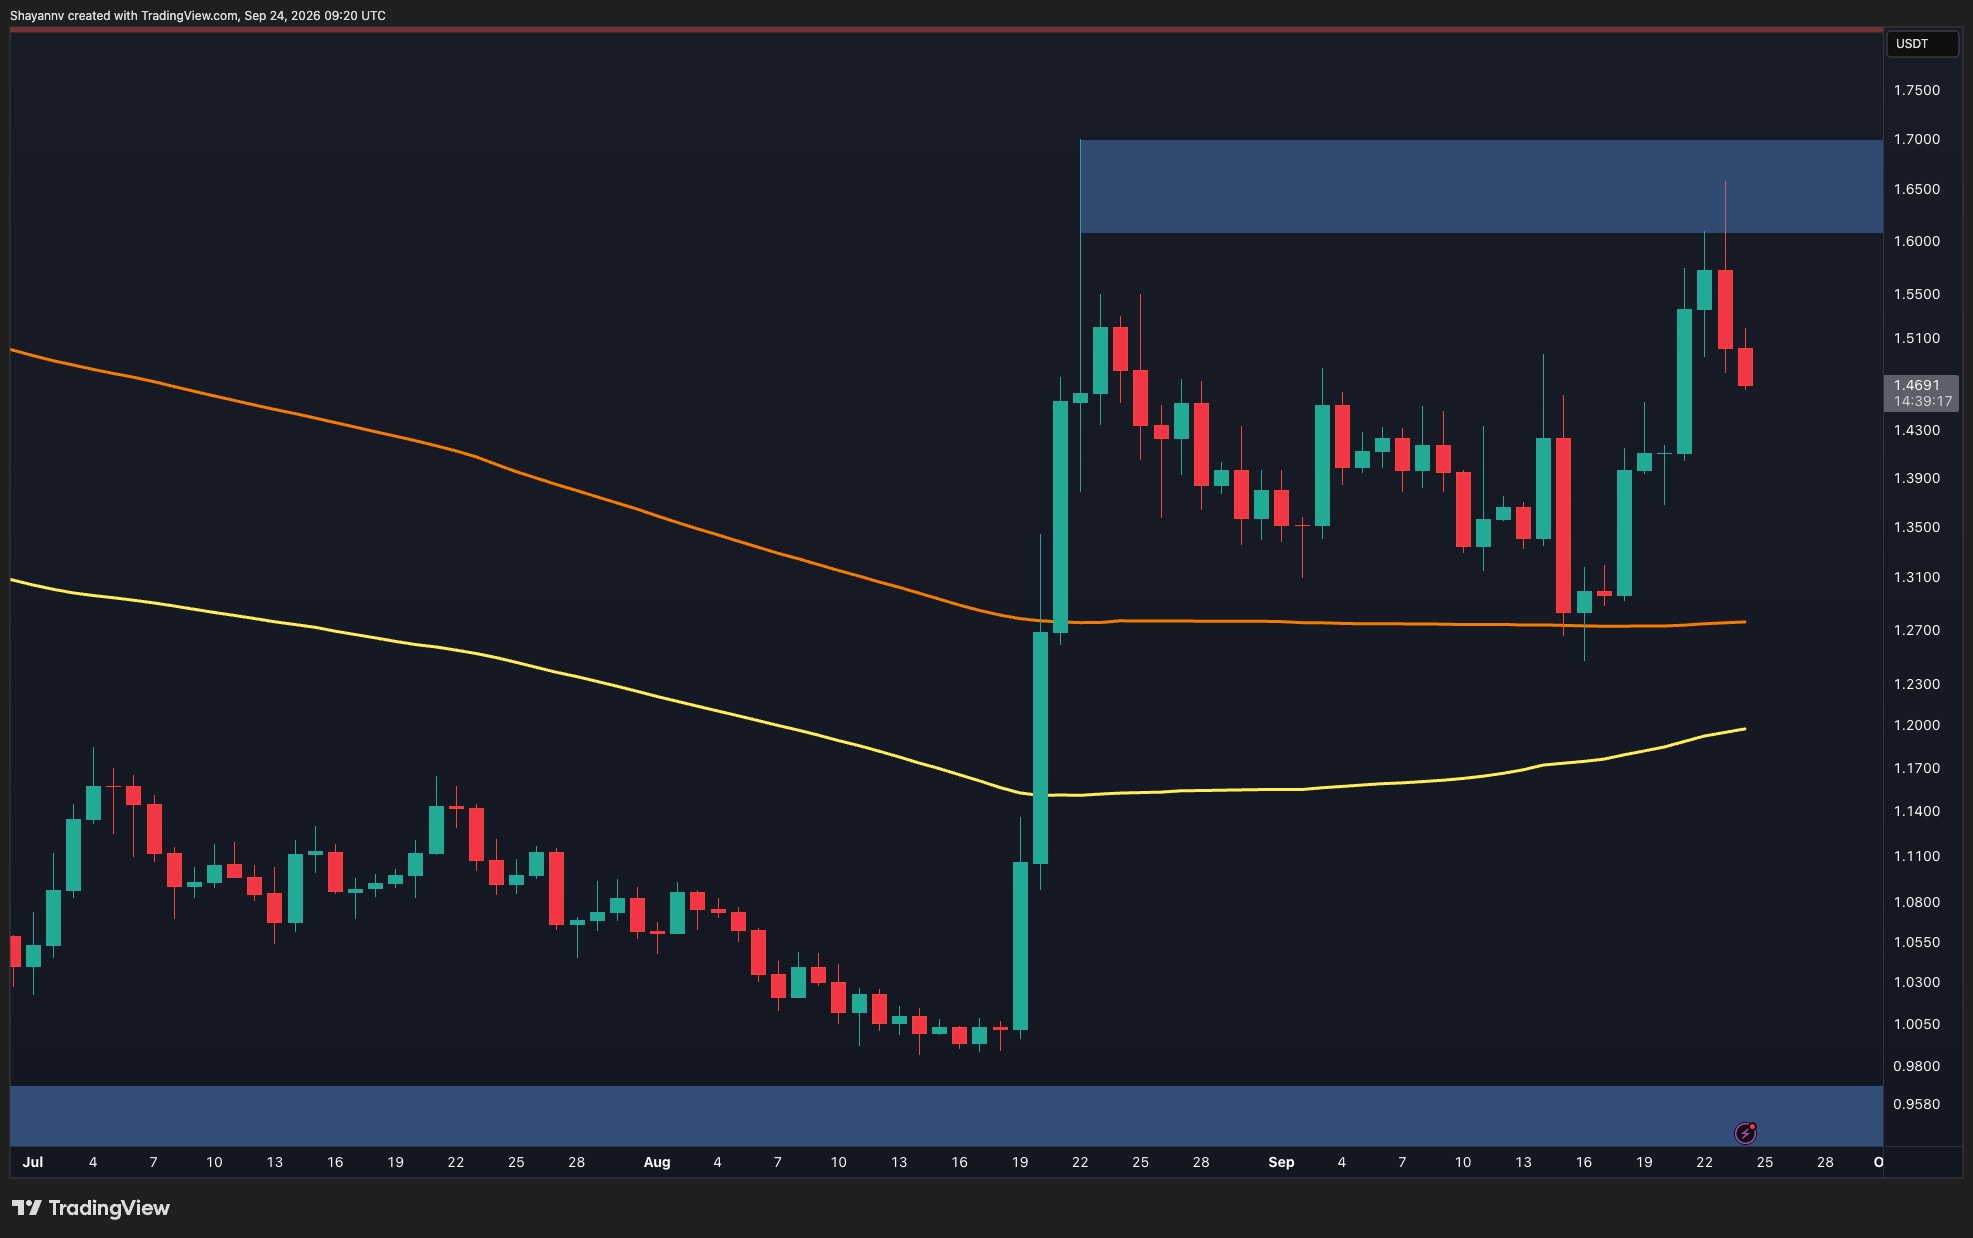
XRP/USDT 4-Hour Chart
The 4-hour timeframe provides a clearer view of the current retest. XRP successfully broke above the descending channel that had contained the price action for several weeks and subsequently accelerated toward $1.65. However, the rally was rejected almost immediately after entering the $1.61-$1.69 supply zone.
The resulting correction has now brought XRP back toward the $1.42-$1.45 demand zone. Crucially, this area overlaps with the former descending channel resistance, creating a potential breakout-retest setup.
Therefore, the reaction around $1.42-$1.45 could determine the next short-term move. If buyers defend this zone and price establishes support above the broken trendline, the recent decline could simply represent a healthy retest before another attempt toward $1.60-$1.65.
On the other hand, a decisive breakdown below the $1.42 area would weaken the breakout structure and increase the likelihood of a deeper correction. In that case, attention could shift toward the $1.28-$1.22 major demand zone, where XRP previously attracted strong buying pressure.

The post Ripple Price Analysis: Is It All Doom and Gloom for XRP After the Latest Rejection at $1.60? appeared first on CryptoPotato.
[PRESS RELEASE – GEORGE TOWN, Cayman Islands, September 23rd, 2026]
BTCC, one of the world’s longest-serving cryptocurrency exchanges, today announced a promotional collaboration with Markets.com, a global CFD trading platform.
The collaboration will see BTCC feature and promote the Markets.com brand to audiences interested in both digital assets and traditional financial markets. BTCC and Markets.com remain separate and independent entities, each operating its own platform, products and services and retaining responsibility for its respective regulatory obligations.
Meeting at the Intersection of TradFi and Crypto
As part of this collaboration, BTCC and Markets.com will both be present at TOKEN2049 Singapore, one of the world’s premier Web3 and digital finance events, taking place from October 7 to October 8 at Marina Bay Sands, Singapore.
Through the collaboration, BTCC will provide visibility to the Markets.com brand and introduce attendees to its CFD trading offering, including access to a range of global markets and 24/7 trading on selected CFDs on digital assets.
Attendees will have the opportunity to meet representatives from both businesses and learn more about their respective platforms, products and services, subject to jurisdiction, eligibility and applicable regulatory requirements.
“This collaboration reflects the increasing interest we are seeing across both digital assets and traditional financial markets,” said Alex Hung, Head of Operations at BTCC Exchange. “We are pleased to feature Markets.com and introduce its offering to audiences interested in accessing a broader range of financial markets.”Elva Mok, Head of Operations at Markets.com added:“Markets.com is a global online trading platform and multi-asset CFD broker providing access to a broad range of global markets through an intuitive, transparent platform built on secure technology. We are pleased to collaborate with BTCC in introducing the Markets.com brand to a wider audience and showcasing our market access, trading tools and 24/7 trading on selected CFDs on digital assets.”
The collaboration is promotional in nature and does not involve the integration of BTCC’s and Markets.com’s respective platforms or services. Both businesses continue to operate independently and remain solely responsible for their own products, services, clients, and regulatory obligations.
For the latest updates on TOKEN2049 and the collaboration, follow BTCC on X at @BTCCExchange.
About BTCC
Founded in 2011, BTCC is a global cryptocurrency exchange serving over 12 million users across 100+ countries. As the official regional sponsor of the Argentine Football Association (AFA), BTCC provides cryptocurrency trading services focused on accessibility, security, and user experience while operating in accordance with applicable regulatory requirements.
Official website: https://www.btcc.com/en-US
X: https://x.com/BTCCexchange
Contact: press@btcc.com
About Markets.com
Markets.com is a global, regulated CFD trading platform that gives traders access to a broad range of financial markets, including 24/7 trading on selected CFDs on digital assets. With over a decade of operations through its group entities, Markets.com serves a large global client base across numerous jurisdictions through an intuitive, transparent platform built on secure technology. This is the place to trade.
Official website: https://www.markets.com/
X: https://x.com/marketscomMena
Contact: affiliate@markets.com
Disclaimer
The relevant provider is Markets South Africa (Pty) Ltd, an FSCA-regulated Financial Services Provider and authorised Over-the-Counter Derivatives Provider.
BTCC and Markets.com are separate and independent entities. The collaboration described above is promotional in nature and does not constitute a partnership, joint venture, agency relationship, integration of services or regulatory association between the parties. Both businesses continue to operate independently and remain solely responsible for their own products, services, clients and regulatory obligations.
Products, services and regulatory protections may vary depending on the client’s jurisdiction and eligibility.
Trading in financial instruments, including CFDs and other derivatives, involves a high level of risk and may not be suitable for all investors. Leverage can amplify both gains and losses and may result in the loss of the entire amount invested. You should ensure that you understand the risks involved and consider whether trading is appropriate for your circumstances.
The post BTCC Exchange and Markets.com Announce Promotional Collaboration Ahead of TOKEN2049 Singapore appeared first on CryptoPotato.