Cryptocurrency Posts
Crypto Briefing
TRON DAO's AI fund expansion could accelerate the agentic economy's growth, potentially reshaping financial systems and blockchain integration.
The post TRON DAO expands AI fund to $1 billion to back agentic economy infrastructure appeared first on Crypto Briefing.
The temporary diplomatic pause highlights the fragility of peace efforts, with ongoing tensions posing risks to global markets and energy stability.
The post Trump drops Iran strike threat after back-channel talks in Riyadh, oil plunges 11.7% appeared first on Crypto Briefing.
SoftBank's potential leverage increase could heighten financial risk, impacting investor confidence and influencing AI and crypto sectors.
The post SoftBank CFO opens the door to breaching its own leverage ceiling appeared first on Crypto Briefing.
Polymarket's new fee and referral structure could reshape user engagement and market dynamics, potentially influencing industry standards.
The post Polymarket updates fee structure and offers up to 30% referral rewards appeared first on Crypto Briefing.
Understanding executive decision-making dynamics is key for product leaders to drive successful collaborations and innovations.
The post Jessica Fain: Executives face extreme time constraints, influence is the key skill for product leaders, and empathy enhances executive engagement | Lenny’s Podcast appeared first on Crypto Briefing.
Bitcoin Magazine
Bitcoin Magazine

MoonPay Launches Open-Source Wallet Standard for AI Agents
MoonPay recently launched an open-source wallet standard to equip artificial intelligence (AI) agents with the ability to manage funds and conduct transactions across multiple blockchains.
By doing so, MoonPay says it is trying to confront the challenges posed by the existing fragmentation in wallet and key management systems that autonomous software often encounters.
The escalating involvement of AI agents in economic activities underscores the urgent need for standardized financial tools that streamline operations and minimize risks. Under traditional systems, each AI agent typically must handle its own keys and maintain a distinct balance, which invariably leads to inefficient processes and heightened security vulnerabilities.
For example, a lack of coordination among key management can expose funds to hacks or loss, particularly if agents operate in environments with differing security protocols. MoonPay’s initiative aims to counter these risks by providing a cohesive framework for wallet access and transaction execution, benefiting both AI developers and their end-users.
This development not only enhances operational efficiency but also paves the way for broader adoption of bitcoin and other cryptocurrencies in the AI sector.
As these agents become more prevalent across trading, e-commerce, and automated financial services, the demand for seamless interactions with blockchain technology will grow accordingly.
Key features of the wallet standard
The newly introduced MoonPay wallet standard is composed of several pivotal features designed to optimize the functioning of AI agents within various blockchain environments:
- Unified Access: AI agents are empowered to function from a centralized pool of funds. This feature eliminates the fragmentation of multiple disconnected accounts, facilitating smoother transaction flows.
- Secure Key Management: The wallet standard prioritizes security by ensuring that private keys are stored within an encrypted local vault. Transactions are signed in a dedicated, isolated process, which keeps keys out of the agent’s runtime environment, thus mitigating the risk of exposure during transactions.
- Policy Controls: Users can implement spending limits and restrictions, offering them control over the transactions that an AI agent can initiate. This feature is particularly valuable in organizational contexts, where oversight and compliance with internal financial policies are critical.
- Modular Design: The standard adopts an open-source, modular approach, encompassing essential components such as storage systems, signing processes, policy controls, and compatibility with a range of blockchains. This flexibility will allow developers to tailor the wallet to meet the specific needs of various AI applications.
These integrated features collectively aim to bolster the security and efficiency of AI-conducted financial transactions, supporting the growing trend of automation in business operations.
Industry Collaboration and Adoption
MoonPay’s endeavor to establish this wallet standard was bolstered by contributions from more than a dozen companies, including notable entities like PayPal, OKX, and Circle.
The participation of various blockchain foundations and infrastructure providers demonstrates the industry’s collective recognition of the need to effectively integrate AI agents into blockchain ecosystems. Such collaboration is pivotal to adopting new technologies that could reshape financial services.
The introduction of MoonPay’s wallet framework for AI agents presents significant implications for the Bitcoin network.
By facilitating seamless interactions, this development could lead to increased transaction volumes and the emergence of innovative use cases. For instance, AI-driven trading algorithms may use the wallet to execute transactions more efficiently, potentially stabilizing market dynamics by improving liquidity.
Furthermore, as the integration takes hold, it could spur greater adoption of Bitcoin and other cryptocurrencies among businesses looking to leverage AI capabilities.
Companies may find new opportunities for efficiency and cost-effectiveness in utilizing bitcoin for automated financial transactions, driving further integration of AI in daily business practices.
Outlook
Looking ahead, as AI technology continues to accelerate, the integration of standardized financial tools is poised to become increasingly impactful.
MoonPay’s open-source wallet standard stands as a crucial step in promoting autonomous economic activities for AI agents. Its implications extend beyond mere financial transactions, influencing the ongoing intersection of AI and blockchain technologies.
Editorial Disclaimer: We leverage AI as part of our editorial workflow to support research, image generation, and quality assurance processes. However, all content is human-led, rigorously reviewed, and approved by our editorial team, with strict standards for accuracy, originality, and integrity. In Bitcoin, as in media: Don’t trust. Verify.
This post MoonPay Launches Open-Source Wallet Standard for AI Agents first appeared on Bitcoin Magazine and is written by Micah Zimmerman.
Bitcoin Magazine
Bitcoin Swings Wildly as Iran Ceasefire Drama Rocks Crypto Markets
Bitcoin kicked off the week with a surge above $71,000 before retracing, reflecting renewed market sensitivity to geopolitical developments between the U.S. and Iran.
The leading cryptocurrency had traded below $68,000 over the weekend, leaving investors on edge as markets digested conflicting reports about peace talks in the Middle East.
Monday’s spike came after the U.S. President Donald Trump announced a five-day postponement of planned strikes on Iranian power plants, citing “very good and productive” conversations with Tehran on a “complete and total resolution” of hostilities. Within minutes of the announcement,
Bitcoin jumped to an intraday high of $71,811, according to Bitcoin Magazine Pro, before easing back to around $70,000. The rally briefly wiped out roughly $791 million in leveraged crypto positions, with $425 million in long positions liquidated.
The momentum was short-lived. Iran’s Foreign Ministry, via state media, denied that any talks had occurred in the form Trump described.
“We are not the party that started this war, and all these requests should be referred to Washington,” the ministry said, underscoring the continued uncertainty surrounding the conflict.
The market’s reaction reflected the mixed signals, with volatility dominating early-week trading.
Bitcoin’s resilience in war
Despite the rollercoaster, BTC remains resilient over a broader horizon.
Since February 28, when U.S.-Israeli airstrikes triggered retaliatory Iranian attacks and the closure of the Strait of Hormuz, Bitcoin has risen roughly 7%, outperforming the S&P 500 (-4.6%) and gold (-17%). Gold is currently trading near $4,428.
Analysts attribute this outperformance to several rounds of market deleveraging since October 2025, when BTC peaked at $126,080.
The week’s volatility was compounded by broader market factors.
U.S. 10-year Treasury yields climbed to 4.36% on Monday, reflecting inflation concerns exacerbated by higher oil prices.
Brent crude, which surged past $107 per barrel after February’s Strait of Hormuz closure, fell back on Monday by 8%, highlighting the interplay between oil markets, inflation expectations, and risk assets such as BTC.
Technically, Bitcoin remains confined within a symmetrical triangle on the daily chart, suggesting consolidation.
A sustained close above $75,000 this week could pave the way for further gains toward $85,000 and $90,000, while a breakdown below $67,000 would reopen the path to retest recent lows, according to Bitcoin Magazine Pro analysis.
At the time of publication, Bitcoin’s price is trading near $71,000.

This post Bitcoin Swings Wildly as Iran Ceasefire Drama Rocks Crypto Markets first appeared on Bitcoin Magazine and is written by Micah Zimmerman.
Bitcoin Magazine

Capital B Acquires 44 Bitcoin, Boosting Holdings to 2,888 Coins
Capital B, Europe’s first Bitcoin Treasury Company, has completed the acquisition of 44 bitcoin for €2.7 million, bringing its total holdings to 2,888 BTC.
The purchases were executed as part of the company’s ongoing Bitcoin Treasury Company strategy, which aims to increase the number of bitcoin per fully diluted share over time, according to a company press release seen by Bitcoin Magazine.
The company also finalized multiple capital raising operations. An “ATM-type” capital increase with TOBAM generated €0.5 million through the issuance of 669,906 new shares at €0.76 per share.
Additionally, €3 million was raised via share subscription warrants, with €2 million subscribed by TOBAM and €1 million by UTXO Management.
These operations funded the latest BTC acquisition and supported the company’s broader treasury strategy.
Capital B reported a year-to-date (YTD) BTC Yield of 0.72%, equivalent to a gain of 20.4 BTC and €1.2 million. The company also achieved a quarterly BTC Yield of 0.72%, highlighting the incremental growth of its bitcoin holdings relative to fully diluted shares. The average acquisition cost of its BTC portfolio stands at €92,495 per coin, representing a total investment of €267.1 million.
Swissquote Bank Europe SA, a Luxembourg-registered virtual asset service provider (VASP), executed the bitcoin acquisition and provided secure custody through Taurus technology. The company maintains an additional 60 BTC for operational needs, separate from its treasury holdings.
Capital B is listed on Euronext Growth Paris and specializes in data intelligence, artificial intelligence, decentralized technology consulting and development, and corporate treasury.
Bitcoin surges
Bitcoin surged to $71,000 on Monday, rebounding from weekend lows near $67,000, following a sudden easing of geopolitical tensions after Donald Trump announced a five-day pause on planned U.S. strikes against Iran.
The pause came after what Trump described as “very good” and “productive” talks with Tehran, reversing the market’s defensive posture from prior threats to target Iranian energy infrastructure.
Amid this backdrop, Strategy continued its corporate bitcoin accumulation, albeit at a slower pace. Between March 16 and March 22, the company acquired 1,031 BTC for $76.6 million at an average price of $74,326 per coin, funded through common stock sales. This contrasts with the prior two weeks, when Strategy deployed over $1 billion into bitcoin via equity and preferred share offerings, signaling a more measured approach.
Strategy now holds 762,099 BTC, purchased for approximately $57.7 billion at an average cost of $75,694 per coin.
Disclaimer: Bitcoin Magazine is owned by Nakamoto Inc. (NASDAQ: NAKA). Nakamoto Inc. also owns UTXO Management.
This post Capital B Acquires 44 Bitcoin, Boosting Holdings to 2,888 Coins first appeared on Bitcoin Magazine and is written by Micah Zimmerman.
Bitcoin Magazine

Saylor’s Strategy (MSTR) Arms Itself With $44.1 Billion ATM Capacity to Fuel Bitcoin Treasury Expansion
Strategy has moved to sharply expand its capacity to raise capital through at‑the‑market equity and preferred offerings, adding new Wall Street agents and reshaping its preferred stock authorization to favor a key floating‑rate series.
The steps, disclosed in a March 23 Form 8‑K, give the company scope to sell up to an additional $44.1 billion in securities on top of large existing programs.
In the filing, Strategy said it entered joint agreements with Moelis & Company LLC, A.G.P./Alliance Global Partners, and StoneX Financial Inc., adding them as sales agents under its Omnibus Sales Agreement dated November 4, 2025.
That agreement already named TD Securities (USA), The Benchmark Company, Barclays Capital, BTIG, Canaccord Genuity, Cantor Fitzgerald, Clear Street, Compass Point, H.C. Wainwright, Keefe Bruyette & Woods, Maxim Group, Mizuho Securities USA, Morgan Stanley, Santander US Capital Markets, SG Americas Securities, and TCBI Securities doing business as Texas Capital Securities as agents.
Under the joinders, each of Moelis, Alliance, and StoneX becomes an agent on the same contractual footing as the original banks, with the right and obligation to place Strategy’s securities in at‑the‑market, or “ATM,” transactions.
JUST IN: Michael Saylor’s Strategy announces new $42 billion plan to buy more Bitcoin
— Bitcoin Magazine (@BitcoinMagazine) March 23, 2026pic.twitter.com/w2WA2YIzHl
Strategy’s new ATM programs and size
Alongside the added agents, Strategy and the syndicate executed three “Additional Program Addenda” that establish new ATM programs for its Class A common stock (ticker MSTR), its Variable Rate Series A Perpetual Stretch Preferred Stock (STRC), and its 8.00% Series A Perpetual Strike Preferred Stock (STRK).
These addenda operate under Section 8(i) of the Omnibus Sales Agreement and are structured so they do not cancel or limit rights under the underlying framework.
The company then filed new prospectus supplement annexes under its automatic shelf registration statement, which became effective on January 27, 2025.
Those annexes authorize at‑the‑market offerings of:
- Up to $21.0 billion of new Class A common stock (the “New Common ATM Shares”).
- Up to $21.0 billion of new STRC preferred shares (the “New STRC ATM Shares”).
- Up to $2.1 billion of new STRK preferred shares (the “New STRK ATM Shares”).
In other words, Strategy has established new ATM programs to sell up to $21 billion of common stock, $21 billion of STRC preferred, and $2.1 billion of STRK preferred shares.
These programs supplement existing authorizations, with the old STRK program replaced by the new $2.1 billion offering.
These new capacities sit alongside existing shelf authorizations. Strategy had previously registered the sale of about $15.85 billion of common stock and $4.2 billion of STRC preferred under prior annexes and the base prospectus, and it intends to keep using those prior prospectuses until those capacities are fully sold.
In contrast, the company terminated its prior STRK preferred ATM program effective March 22, 2026, and the new $2.1 billion STRK annex replaces that earlier effort.
Strategic tilt in preferred structure
To support this mix of funding options, Strategy also amended its charter with two targeted preferred stock actions. A Certificate of Increase raised authorized shares of STRC preferred from 70,435,353 to 282,556,565, more than tripling the pool available for issuance. A separate Certificate of Decrease reduced authorized STRK preferred shares from 269,800,000 to 40,270,744.
Both certificates were adopted by the board’s Pricing and Financing Committee under authority granted in the company’s Second Restated Certificate of Incorporation and Section 151(g) of the Delaware General Corporation Law.
Strategy also said they secured legal opinions confirming that its new ATM shares — both common and preferred — will be validly issued, fully paid, and non-assessable.
The 8‑K clarifies that no offers or sales are happening yet, and any actual issuances will depend on market conditions, investor demand, and internal decisions.
Overall, the expanded ATM programs and reallocated preferred shares give Strategy flexibility to raise capital while prioritizing floating‑rate preferred issuance over the 8.00% STRK series.
This post Saylor’s Strategy (MSTR) Arms Itself With $44.1 Billion ATM Capacity to Fuel Bitcoin Treasury Expansion first appeared on Bitcoin Magazine and is written by Micah Zimmerman.
Bitcoin Magazine

H100 Eyes Strategic Bitcoin Acquisition to Triple its BTC Holdings and Expand Institutional Scale
H100 Group AB (H100), the Stockholm-based publicly listed bitcoin treasury company, announced a letter of intent (LOI) to acquire Norwegian bitcoin-focused firms Moonshot AS and Never Say Die AS.
The move, if completed, would roughly triple H100’s holdings to around 3,500 BTC, positioning the company among Europe’s largest listed bitcoin treasury firms and enhancing its institutional profile, according to a press release seen by Bitcoin Magazine.
Currently holding 1,051 BTC, the company would add the target companies’ combined 2,450 BTC through the transaction.
The acquisition is structured as a bitcoin-for-bitcoin exchange, meaning ownership in the combined entity will be determined solely by the number of BTC contributed.
This preserves the existing shareholders’ exposure per share while significantly expanding the company’s balance sheet. The deal is set up as an all-share transaction with no cash consideration, consistent with H100’s strategy of bitcoin-based mergers and acquisitions.
The move comes on the heels of H100’s January announcement regarding its combination with Switzerland-based Future Holdings AG, also a bitcoin treasury company, highlighting the firm’s ongoing effort to consolidate institutional-scale bitcoin holdings in Europe.
H100’s backing
Both acquisitions have backing from Adam Back, the British cryptographer and co-founder of Blockstream, reinforcing the network of experienced bitcoin investors involved in the transactions.
Chairman Sander Andersen emphasized the industrial rationale for the deal, citing scale, credibility, and access to capital markets as increasingly important for publicly listed bitcoin firms.
“This transaction would significantly strengthen H100 in all these areas,” Andersen said, noting that the acquisition aligns with H100’s ongoing capital markets and M&A strategy while leaving its listing structure and core operations unchanged.
The target companies bring more than just bitcoin holdings. Moonshot AS and Never Say Die AS are led by seasoned professionals including CEO Eirik Grøttum, a former systematic trader and asset manager, and CIO Peter Warren, a hedge fund veteran with extensive experience across equities, derivatives, and FX markets.
Together with founder Geir Harald Hansen, the pioneer behind the Bitminter BTC mining pool, the Norwegian teams bring operational expertise and technology capabilities expected to complement H100’s treasury management and capital markets activities.
Following completion, the company will remain the listed parent company. Management and board positions are expected to include representatives from both H100 and the acquired firms, ensuring continuity of existing leadership while integrating new expertise.
Current executives, including Andersen and CEO Johannes Wiik, will continue in central roles. Definitive agreements are targeted by April 22, 2026, with completion expected shortly after H100’s annual general meeting on May 21, subject to regulatory approvals and customary conditions.
The company continues to operate its health technology business alongside its bitcoin treasury strategy, combining digital health tools and AI-powered solutions for providers of health and lifestyle services.
The firm said its core business model and listing structure will remain unchanged even as it pursues aggressive growth in bitcoin holdings.
This post H100 Eyes Strategic Bitcoin Acquisition to Triple its BTC Holdings and Expand Institutional Scale first appeared on Bitcoin Magazine and is written by Micah Zimmerman.
CryptoSlate
Over the last week, both Bitcoin and gold failed the safe-haven test. Bitcoin is still trading more like a risk asset than “digital gold,” while gold has also failed to behave like a clean geopolitical hedge as higher yields and inflation fears overrode the usual flight-to-safety bid.
To start the week, Bitcoin rebounded to about $70,508 after falling as low as $67,436 earlier in the day, while gold was still trying to recover from a far steeper break, and the US 10-year Treasury yield remained above its Friday close after briefly pushing to a new high.
That sequence changed the usual reading of a geopolitical shock. Investors did not rush cleanly into classic hedges. They sold first, repriced inflation and rates, and only then bought back some risk after comments about “productive” talks with Iran and a five-day pause in strikes eased immediate panic.

The last three sessions broke into three distinct phases.
Friday was an inflation and yield repricing. Bitcoin hovered near $70,272 after the prior day’s drop below $69,000, linked to higher-for-longer Fed expectations and energy-driven inflation pressure.
Over the weekend, escalating US-Iran tensions pushed Bitcoin back toward $68,000, wiping out more than $240 million in long positions.
Monday then brought a relief reversal. Bitcoin traded in a wide intraday band from $67,436 to $71,696 before climbing back above $70,000, tied to the market’s reading of Trump's de-escalation statement.
Gold followed the same broad rhythm, though with heavier damage
Barron’s coverage showed New York futures up about 1.7% to $4,682.20 early Friday, yet still headed for a weekly loss of more than 7%, with front-month futures ending the week near $4,570.40.
Today, gold is down toward roughly $4,100 to $4,260 intraday as the market focuses on the inflation and yield shock coming from oil.
Gold is not acting as a clean geopolitical hedge; it's trading like an asset caught between forced selling, higher real-rate expectations, and opportunistic buying.
The macro hinge has stayed in rates. The 10-year Treasury yield was around 4.30% on Friday as oil strength and fading rate-cut hopes pushed yields higher.
Today, the 10-year hit 4.43%, the highest level since mid-2025. After the Iran-talks headline, yields fell to about 4.31% before settling near 4.386%. The inflation premium eased, but it did not disappear.
| Period | Bitcoin | Gold | US 10-year yield | Market read |
|---|---|---|---|---|
| Friday, March 20 | Near $70,272 after stabilizing from a dip below $69,000 | Early futures near $4,682.20, week ended near $4,570.40 | Around 4.30% | Inflation and yield repricing |
| Weekend | Down toward $68,000 as long liquidations hit | Pressure carried into Monday open | Pressure building into Monday | Geopolitical risk-off |
| Monday, March 23 | Range of $67,436 to $71,696, now around $70,508 | Down toward $4,100 to $4,260 intraday, later around $4,286.10, with one rebound measure near $4,500 | High near 4.423% to 4.437%, later around 4.36% to 4.386% | Relief reversal after de-escalation comments |
Flows show where investors looked for liquidity
The price action alone was enough to weaken the old “digital gold” line. US spot Bitcoin ETFs finished the March 16 to March 20 stretch in positive territory, but the direction turned worse as the week went on.
The daily flow table shows net inflows of $199.4 million on March 16 and another $199.4 million on March 17, then net outflows of $163.5 million on March 18, $90.2 million on March 19, and $52.0 million on March 20. That left the week net positive by about $93.1 million, yet the pattern was one of weakening demand, not strong accumulation.
That distinction helps with the Bitcoin framing. ETF buyers did not vanish. Buying slowed, then reversed, as macro pressure returned and Bitcoin lost momentum into the weekend.
Monday’s recovery above $70,000 improved the immediate picture, but it did not erase the sequence that came before it.
Bitcoin is still trading primarily as a high-beta macro asset, with any hedge behavior showing up only in short bursts.

Gold ETF flows were weaker. The cleanest indexed US data for last week points to a cluster of heavy withdrawals from the largest gold funds.
ETF.com reported IAU outflows of $554.66 million on March 17, while commodity ETFs as a whole lost $735.29 million that day.
On March 18, ETF.com reported GLD outflows of $414 million and IAU outflows of $387 million. On March 19, GLD outflows were $760 million, and IAU outflows were $329 million.
That makes gold the more revealing asset in this stretch. Bitcoin bent, then recovered, and Bitcoin ETF flows for the week still ended slightly positive. Gold took deeper price damage and saw large holders redeeming through the break.
Investors appeared to use gold ETFs as a source of liquidity instead of treating them as a preferred refuge. That is a meaningful shift because gold normally carries the stronger default claim as a haven during geopolitical stress.
The broader context still matters. Global gold ETFs took in $5.3 billion in February and lifted holdings to a record 4,171 tonnes. That tells you the US outflow week did not arrive after a long period of persistent global liquidation.
After a strong prior backdrop, the reversal is even more striking. In other words, the selling pressure was strong enough to overwhelm a market that had just logged nine straight months of global inflows.
| ETF flow signal | Latest reading | What it suggests |
|---|---|---|
| BTC ETFs, March 16 | +$199 million | Strong demand at the start of the week |
| BTC ETFs, March 17 | +$199 million | Demand still firm before the macro turn intensified |
| BTC ETFs, March 18 | -$163 million | Reversal as macro pressure returned |
| BTC ETFs, March 19 | -$90 million | Outflows continued |
| BTC ETFs, March 20 | -$52 million | Third straight outflow day into the weekend |
| Gold ETFs, March 17 to 19 | Large GLD and IAU withdrawals across three sessions | Investors raised cash and reduced exposure |
The next move still runs through yields, oil, and expectations
Monday’s bounce changed the direction of travel, but it did not change the hierarchy of drivers.
The market still looks more sensitive to oil, inflation expectations, and rate pricing than to the old safe-haven labels attached to either asset.
The University of Michigan’s early-March chart showed short-run inflation expectations rising from about 3.3% to 3.5% and long-run expectations rising from about 3.1% to 3.3%, with one-year gasoline price expectations jumping from about 10 cents to about 43 cents. Those moves help explain why the inflation premium in yields stayed elevated even after Monday’s relief reversal.
The Fed’s March projections still point to only modest easing, with the median end-2026 fed-funds rate at 3.4% against a 2025 midpoint near 3.6%. That leaves little room for a fast return to the kind of falling-real-yield backdrop that usually flatters both gold and Bitcoin.
The market can absorb one encouraging geopolitical headline and still keep a higher bar for non-yielding assets if inflation risk remains embedded in energy and rates.

Oil sits at the center of that calculation. The latest EIA outlook said Brent should stay above $95 for the next two months before falling below $80 in the third quarter and toward $70 by year-end, assuming disruptions ease.
If that path holds, the pressure on real yields can cool and the current selloff in hedges can look like a short-lived dislocation. If oil stays higher for longer, the Monday rebound in both gold and Bitcoin will look more like a relief trade than the start of a durable turn.
Published outlooks still give both assets room to recover, though the ranges are wide. A 2026 gold outlook showed a gain of 5% to 15% in a shallow-slip case and 15% to 30% in a deeper risk scenario, while a reflation case pointed to a decline of 5% to 20%.
In crypto, an Investing.com report said Citi cut its 12-month Bitcoin target to $112,000 because it expects weaker ETF-driven demand and slower progress on US crypto legislation, while Standard Chartered warned Bitcoin could fall to $50,000 before recovering.
Those ranges fit the current market structure. Downside still runs through yields. Upside still runs through calmer energy markets, steadier inflation readings, and renewed ETF demand.
Narrower projection than the old “digital gold” debate usually allows
Gold and Bitcoin both lost ground when the market marked up the return available in yield-bearing assets and questioned how quickly inflation would fade.
Monday’s rebound showed that both can still snap back when fear eases. It also showed that traders were responding to the prospect of de-escalation, not restoring either asset to automatic safe-haven status.
For the next quarter, the cleanest checkpoints are visible already.
The 10-year Treasury yield needs to stop pushing higher. Oil needs to move toward the lower path sketched by the EIA outlook.
Bitcoin ETF flows need to move from three straight outflow sessions back toward sustained creations. Gold needs to hold a rebound without another round of heavy GLD and IAU withdrawals.
Until those things happen, the market is still saying the same thing it said from Friday through Monday, cash flow and explicit yield rank above narrative when inflation risk is rising.
The post Gold is not acting like a safe haven, so what does “digital gold” even mean for Bitcoin? appeared first on CryptoSlate.
Gold has fallen into bear-market territory after giving up its gains for the year, even as US spot Bitcoin exchange-traded funds (ETFs) continued to attract fresh money, pushing the two assets onto sharply different paths.
Spot gold traded near $4,388 an ounce on March 23, according to goldprice.org, down about 22% from its Jan. 29 record of $5,594.82. The decline accelerated after the latest Middle East conflict began on Feb. 28. Since then, gold has dropped about 17%, reversing the advance that had carried it higher in the opening weeks of 2026.
At the same time, institutional money continued to flow into the US spot Bitcoin ETF market. Data from Farside Investors show the funds took in about $2.42 billion of net inflows across the four calendar weeks ended March 20.
The divergence has drawn attention across macro and digital-asset markets because gold and Bitcoin are often discussed in similar terms during periods shaped by inflation concerns, currency dilution, and geopolitical stress.
Over the past month, however, investors treated them very differently. Gold faced liquidation pressure as cash demand rose and rate expectations stayed elevated. Bitcoin, through the ETF structure, continued to draw allocations through brokerage and advisory channels.
The move also stands out because gold had entered 2026 with strong momentum. Its retreat now meets the widely used market definition of a bear market: a decline of 20% or more from a recent peak. Bitcoin, by contrast, has held up well enough to keep ETF buyers engaged through the same stretch of volatility.
Gold gives back early-year gains as rates stay high and investors raise cash
Gold’s decline has unfolded against a macro backdrop that has become less supportive for assets that tend to benefit from lower yields and a softer dollar.
The Federal Reserve held interest rates steady in March and projected the benchmark rate at 3.4% at the end of 2026, while core personal consumption expenditures inflation remained at 2.7%. That combination reinforced the view that policy may stay restrictive longer than investors expected earlier this year.
For bullion, the effect is direct. Higher rates raise the opportunity cost of holding a non-yielding asset. A firmer dollar adds pressure by making gold more expensive for buyers using other currencies.
Those forces intensified as investors also sought cash and liquidity after the Middle East shock forced a repricing of growth, inflation, and energy expectations.
Fund-flow data captured the shift quickly. LSEG Lipper data showed global gold and precious-metals funds posted about $5.19 billion in weekly net outflows through March 18, the largest weekly withdrawal since at least August 2018. In the same week, money market funds took in $32.57 billion.
That rotation suggests investors moved toward liquidity and away from positions that had benefited from earlier inflation and geopolitical hedging demand.
Gold’s decline, therefore, fits into a broader portfolio adjustment in which preserving flexibility became more important as markets reassessed the likely path of monetary policy and commodity prices.
The selloff also arrived after a period in which gold’s long-term support looked firm. Central-bank demand had helped underpin the bullion market through 2025, and the reserve case remained intact as 2026 began.
The recent drop shows how forcefully short-term macro conditions can overwhelm that structural support over a matter of weeks.
Additional fund data point in the same direction. The largest US gold-backed ETF, SPDR Gold Shares (GLD), recorded $7.07 billion in outflows in March, according to market data.
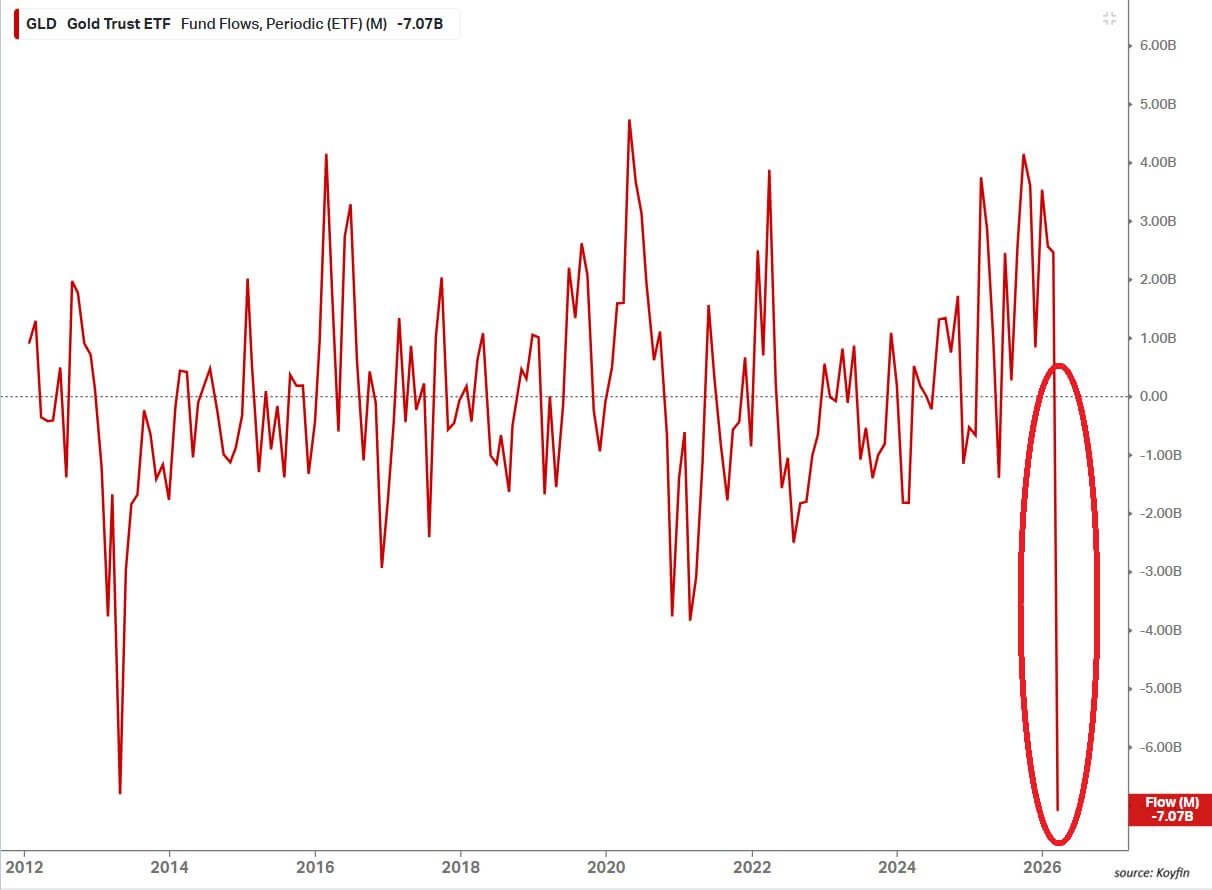
That exceeded the previous monthly record withdrawal of $6.8 billion in April 2013. The pace of redemption reflected the speed of the reversal in investor positioning after gold’s run higher earlier in the year.
By the standard used in financial markets, a 22% decline from a January peak marks a clear transition into bear-market territory.
Gold’s drop, therefore, represents more than a routine pullback after a rally. It signals a broad withdrawal from a trade that had been supported by reserve accumulation, geopolitical hedging, and concern over inflation persistence.
Bitcoin funds extend their strongest inflow streak of 2026
While gold was losing ground, US spot Bitcoin exchange-traded funds posted their strongest inflow streak this year.
Farside data show the 12 US spot Bitcoin funds recorded four consecutive weeks of net inflows, with more than $2 billion added during that period. It is the longest run of 2026 and the strongest since August and September 2025, when the funds absorbed more than $3.8 billion.
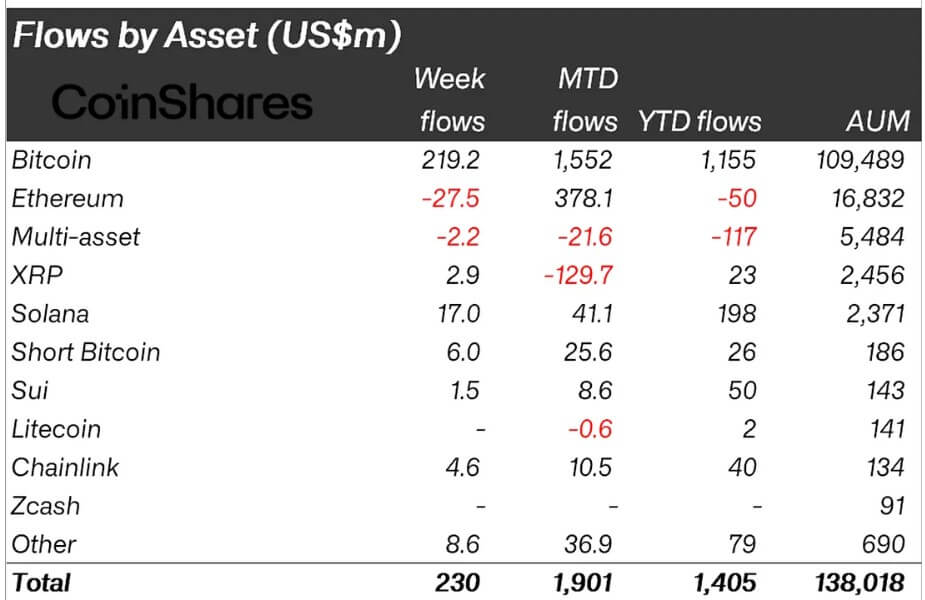
CoinShares data show a similar trend globally. The firm said Bitcoin exchange-traded products have registered $1.5 billion in inflows so far this month.
Those inflows came during a period that included war risk, shifting expectations for US interest rates, and renewed volatility across commodities. Even in that backdrop, institutions continued to use the ETF wrapper to add or maintain Bitcoin exposure, while gold funds were experiencing large redemptions.
Last week, Bitwise said Bitcoin and other major cryptoassets have outperformed US equities and gold since the beginning of March.
The asset manager said the move could point to the early stages of a rotation, while also cautioning that recent price action may reflect temporary volatility or isolated liquidity events. Bitwise added that gold has historically led Bitcoin by four to seven months.
State Street Global Advisors outlined the volatility gap in its March gold monitor. Over a trailing 10-year period, rolling 30-day volatility for Bitcoin averaged about 52.0, compared with 13.6 for gold.
From January 2016 through February 2026, Bitcoin recorded 30 months with losses greater than 8%, while gold recorded one such month, according to the report.
Those figures show the type of exposure investors were taking through Bitcoin ETFs. Buyers were accepting wider swings and deeper drawdowns in return for access to an asset some investors view as a hedge against fiat dilution and policy risk.
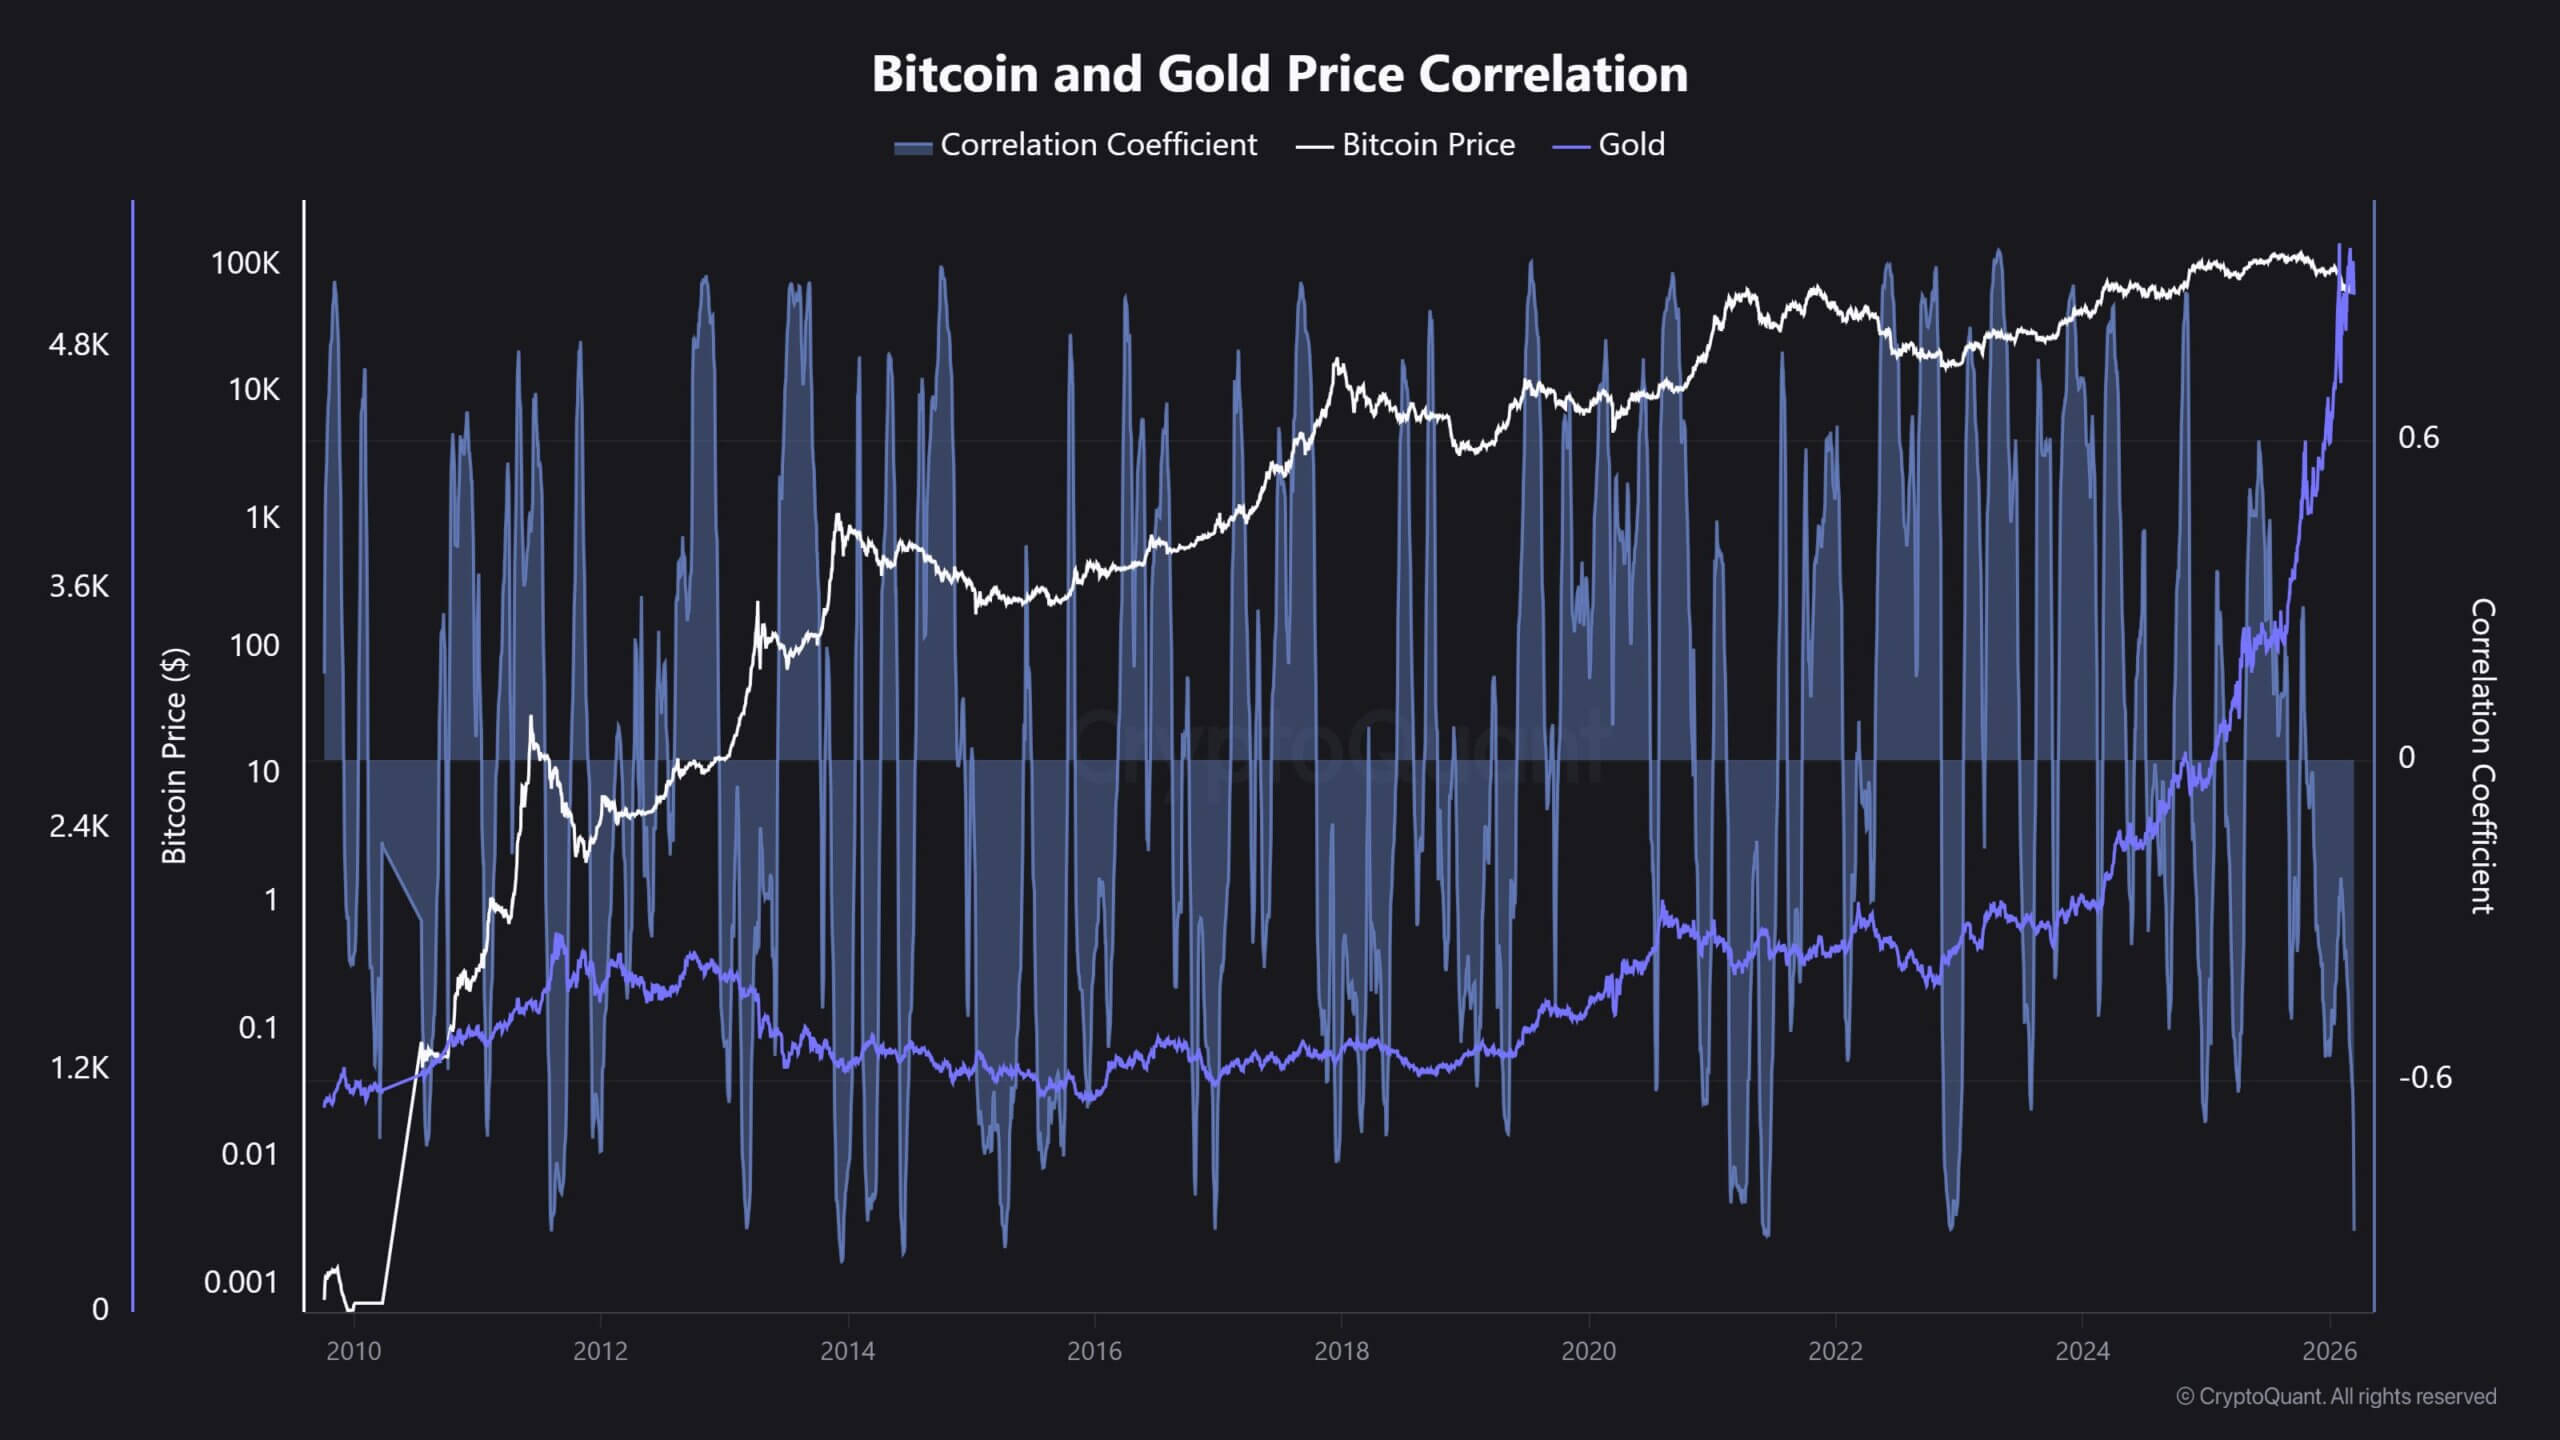
CryptoQuant data also show how far the two assets have diverged. The firm said Bitcoin-to-gold correlation fell to minus 0.88, the lowest reading since November 2022, indicating the two assets were moving in opposite directions with unusual force over the measured period.
Oil and rates may shape the next phase
Gold’s longer-term support has not disappeared, even after the March selloff, and that is part of what makes the current split between gold and Bitcoin more closely watched.
The World Gold Council said total gold demand, including over-the-counter activity, exceeded 5,000 metric tons for the first time in 2025. Gold ETF holdings rose by 801 tons last year, and central banks bought 863 tons. In February 2026 alone, physically backed gold ETFs took in $5.3 billion globally.
Those figures show official-sector buying and long-duration investment demand remained strong heading into this quarter.
The current drawdown, therefore, leaves investors balancing two forces: short-term macro pressure from rates, dollar strength, and liquidity demand, and a structural reserve bid that remained in place through last year and into early 2026.
Oil prices may play a central role in how that balance develops. Several banks raised their 2026 Brent forecasts after the latest Middle East shock. Bank of America lifted its view to $77.50 a barrel, while Standard Chartered raised its forecast to $85.50. Bank of America also outlined an upside path toward $130 in the event of a prolonged supply disruption.
Higher oil prices would feed inflation expectations and could keep the Federal Reserve cautious for longer. That would affect gold and Bitcoin through different channels.
Gold would continue to face pressure from elevated real yields and dollar strength if policy remains restrictive. Bitcoin would remain tied more closely to liquidity conditions, institutional risk appetite, and the willingness of ETF buyers to keep adding exposure through regulated products.
For now, the clearest market signal is the split itself. Gold, long treated as a traditional store-of-value asset during periods of stress, has entered a bear market after falling more than 20% from its January high. Bitcoin, an asset more commonly associated with larger price swings, has continued to gather ETF inflows through the same period.
The post Why investors are pulling back from gold and still buying Bitcoin appeared first on CryptoSlate.
Playnance’s G Coin has moved past the one million holder mark, with the project’s public tracker currently showing 1,155,141 holders.
The milestone follows CryptoSlate’s March 18 coverage, which cited 203,732 holders ahead of the token’s broader market debut, and later launch-week reporting that referenced a 623,272-holder tracker reading. Using those figures, G Coin’s holder base appears about 5.7x larger than the March 18 count and roughly 85% above the later 623,272 reading.
From presale traction to post-launch acceleration
The pace of growth fits the sequence CryptoSlate has tracked over the past week. Ahead of the March 18 Token Generation Event, company materials and CryptoSlate coverage described G Coin as coming to market with more than 200,000 holders and around 13 billion tokens distributed during presale.
On March 16, Playnance also launched GCOIN staking on PlayW3 and said more than 250 million tokens were locked within hours.
MEXC listing and staking added the next signals
Momentum continued after G Coin/USDT went live on MEXC on March 19. CryptoSlate reported that more than 1 billion GCOIN had already been locked in staking shortly after trading opened, while a later launch-week article cited 3.202 billion locked tokens and 623,272 holders from tracker-based reporting.
Those milestones put exchange access, staking participation, and holder distribution on public display at the same time.
Why the one-million-holder mark matters
Holder count is not a perfect proxy for durable adoption, but it is one of the clearest public indicators available in a token’s first stretch of open trading.
In Playnance’s documentation, G Coin is positioned as the utility layer for gameplay interactions and fees, rewards and incentives, partner revenue distribution, and treasury flows across the company’s ecosystem. The same docs describe PlayBlock as a Layer-3 execution layer built for high-frequency applications, with gasless execution, deterministic settlement, transparent on-chain accounting, and sub-second finality.
A utility narrative now faces a market test
Playnance’s white paper frames G Coin as a utility token rather than a claim on profits. It says the token is designed for gameplay, loyalty benefits, missions, and other engagement-based functions; that it does not confer ownership, governance, dividends, or claims on company assets; and that total supply is fixed at 77 billion tokens.
Crossing one million holders gives Playnance a strong launch-week headline. The bigger question now is whether holder growth, staking participation, and broader ecosystem activity continue moving together after the initial listing window. For now, the public tracker and the project’s recent launch timeline suggest G Coin has moved from presale distribution into a broader public-market phase unusually quickly.
Disclaimer: This was a sponsored post brought to you by Playnance.
The post Playnance’s G Coin surpasses 1 million holders as launch-week momentum accelerates appeared first on CryptoSlate.
Bitcoin’s jump back above $70,000 on Monday morning came with unusual clarity.
The move started when Donald Trump posted on Truth Social that the United States and Iran had held “very good and productive conversations” on a “complete and total resolution” of hostilities in the Middle East, and that planned strikes on Iranian power plants and energy infrastructure would be delayed for five days.
Within seconds, global markets repriced. Oil tumbled more than 10%, U.S. stock futures jumped more than 2%, European equities reversed sharp early losses, and Bitcoin sprinted from the upper $67,000s back through $70,000.
Kobeissi estimates the move added about $2 trillion in market value. The rally then reversed slightly after Iran said there had been “no contact” with Washington. By 8:00 a.m. ET, futures were down about 120 points from the peak, erasing roughly $1 trillion.
In Kobeissi’s words, that left the S&P 500 with a total headline-driven swing of about $3 trillion in implied market value in 56 minutes.

Trump’s post was the trigger, but the force came from the macro chain that followed
Before the post, the market had been moving in the opposite direction. Higher crude prices were feeding a stagflation scare. Rising energy costs were threatening to push inflation expectations higher just as growth data had started to soften. Bond yields were climbing again. Bitcoin, gold, and equity futures were all under pressure while rates rose into a more sensitive zone.
In CryptoSlate’s morning analysis of the week ahead, the focus had already shifted from oil alone to the bond market, with the U.S. 10-year yield approaching a level that can tighten financial conditions quickly.
Then the market received a de-escalation signal.
The reaction after Trump’s post filled in the sequence in real time. Brent crude dropped more than 10% as traders stripped out part of the war premium. Dow futures rose about 2.6%, while the FTSE 100 recovered almost all of an earlier 250-point slide. Gold also reversed sharply, with an intraday slide of more than 7% before losses narrowed.
In rates, the U.S. 10-year yield dropped more than 20 basis points to around 4.30% before settling near 4.36% as of press time. Bitcoin followed the same repricing path at high speed, reclaiming $70,000 as the pressure embedded in oil and yields started to ease.
Oil cracked first. Yields backed off. Gold reversed. Equity futures snapped higher. Bitcoin then expressed the same repricing faster than most major assets.
The significance for Bitcoin sits one layer below the spike itself. Nothing about the crypto market changed in a structural sense during those five minutes. The post did not bring a new ETF catalyst, a policy shift from the Fed, or a sudden change in on-chain conditions.
What changed was the macro environment that had been pressing on every risk-sensitive asset for days. The market moved from pricing a wider energy shock to pricing the possibility of a pause.
CryptoSlate’s recent coverage has already mapped that transition.
- On March 7, we argued that oil had become one of Bitcoin’s clearest macro signals.
- On March 9, Bitcoin slipped below $70,000 as oil moved higher and stagflation fears intensified.
- On March 11, the market showed its first instinct during an oil panic, when traders sold Bitcoin rather than treating it as a haven.
- On March 12, Bitcoin held up better even as Brent briefly reclaimed $100, which suggested the market was beginning to separate immediate panic from broader positioning.
- By Monday morning, the center of gravity had shifted again, from oil shock alone to the risk that higher yields would become the dominant problem.
Monday’s move above $70,000 needs to be read inside that framework.
The timing invites a stronger political-economic reading
The U.S. 10-year had been approaching a zone that can become politically and financially difficult very quickly. Mortgage costs respond to it. Equities respond to it. Fiscal sensitivity rises with it. The White House watches it.
My morning piece already outlined the market’s concern around the 4.5% area, especially with Treasury auctions, flash PMIs, jobless claims, and inflation expectations lined up to shape the week. Trump’s post arrived just as the bond market was threatening to become part of the problem in a larger way.
Trump's post could be more than a diplomatic update. It looks like an intervention into a market sequence that was beginning to grow expensive.
Oil was pushing inflation risk back into the system. Rising yields were tightening financial conditions. Gold and stock futures had already moved into defensive positions. A de-escalation signal at that point gave traders permission to reverse the most painful part of the morning’s repricing.
That interpretation rests on incentives and timing, rather than on any official confirmation of motive. It fits the market sequence cleanly. It also fits the broader sensitivity around borrowing costs. The Guardian’s live coverage captured the pressure that rising yields had already started to place on the UK mortgage market, while we had already identified bond yields as the more dangerous extension of the oil shock for Bitcoin.
Once yields started to ease after Trump’s post, the path higher in BTC reopened immediately.
Bitcoin’s own market structure helps explain why the move traveled so fast.
A session shaped by higher oil and rising yields usually creates a defensive posture across crypto. Spot demand softens. Leveraged players hedge. Short exposure can build when macro pressure aligns across rates and energy.
Once the macro impulse flips, crypto often becomes the fastest outlet for the reversal. That appears to be what happened on Monday.
The move through $70,000 reads as a relief repricing amplified by positioning, speed, and the market’s existing sensitivity to macro inputs.
Macro repricing added an important confirming signal
Gold's sharp reversal suggests that traders were taking out part of the immediate war premium rather than rotating into a classic safe-haven structure. Bitcoin moved with that same repricing wave, which places it firmly inside the macro risk complex for this session.
That fits the recent pattern we have shown in our own reporting, where Bitcoin has traded more like a high-beta expression of financial conditions than a defensive shelter during energy-driven stress.
There are still limits to how far Monday’s relief can be extended.
Iranian media quickly pushed back on Trump’s account of the talks. Business Insider noted that oil rebounded from its lows as traders began to question how durable the de-escalation signal really was.
That leaves the market with a pause, rather than with resolution. The difference is important because Bitcoin’s hold above $70,000 now depends less on the post itself and more on whether the broader macro relief can survive a week, which remains difficult to read.
The normal inflation anchor is absent. The Bureau of Economic Analysis release calendar shows that the February PCE will not arrive until April 9, leaving traders leaning more heavily on secondary indicators and Treasury supply.
Our morning analysis highlighted the immediate sequence: flash PMIs on Tuesday, the 2-year auction on Tuesday, the 5-year on Wednesday, jobless claims and the 7-year auction on Thursday, and the final University of Michigan sentiment reading on Friday.
With oil having shaken inflation expectations and bond yields already testing market tolerance, those events now carry more weight for Bitcoin than any crypto-native development on the calendar.
That leaves Bitcoin with a clearer near-term map
If oil stays contained and the U.S. 10-year remains below the earlier stress zone, Monday’s move can become a platform. A reclaimed $70,000 then starts to look like a level the market can build above while it reassesses the inflation path and broader financial conditions.
If oil regains momentum and yields resume their climb, the relief trade loses force quickly. Bitcoin would then move back into the same macro regime that had been dragging on it before Trump posted, one defined by tighter financial conditions, more expensive risk, and a market that still sees stagflation as a live possibility.
The answer to the morning’s initial question is now fairly tight.
Bitcoin jumped almost 5% in five minutes because Trump’s post broke a one-way macro sequence that had been building across oil, rates, metals, and equities.
The post gave traders a reason to cut some of the war premium. Oil fell, yields followed, stocks reversed, gold dropped, and Bitcoin expressed the repricing fastest.
The deeper layer is the one traders will keep watching. Trump’s post arrived at a point where rising oil and rising yields were beginning to feed into a more dangerous mix for financial conditions.
The market response suggests participants understood the signal immediately.
For Bitcoin, the move above $70,000 restored momentum. Whether that level holds now depends on the next phase of the same macro chain, crude, yields, and whether the market believes the relief has enough substance to keep financial conditions from tightening again.
The post Market swings by $3 trillion as Bitcoin price explodes upward in 5 minutes appeared first on CryptoSlate.
Bitcoin climbed back above $70,000 after President Donald Trump said the United States had held “productive conversations” with Iran and would postpone planned strikes on Iranian power plants and energy infrastructure for five days.
In a March 23 post on Truth Social, Trump wrote in capital letters:
“BASED ON THE TENOR AND TONE OF THESE IN DEPTH, DETAILED, AND CONSTRUCTIVE CONVERSATIONS, WHICH WILL CONTINUE THROUGHOUT THE WEEK, I HAVE INSTRUCTED THE DEPARTMENT OF WAR TO POSTPONE ANY AND ALL MILITARY STRIKES AGAINST IRANIAN POWER PLANTS AND ENERGY INFRASTRUCTURE FOR A FIVE DAY PERIOD, SUBJECT TO THE SUCCESS OF THE ONGOING MEETINGS AND DISCUSSIONS.”
Trump said the delay would depend on the outcome of talks that are set to continue through the week.
This eased some of the risk aversion that had spread across global markets earlier in the session.
Data from CryptoSlate showed that the move pushed Bitcoin up about 3.6% on the day to $70,968, after it traded as low as $67,436 intraday.
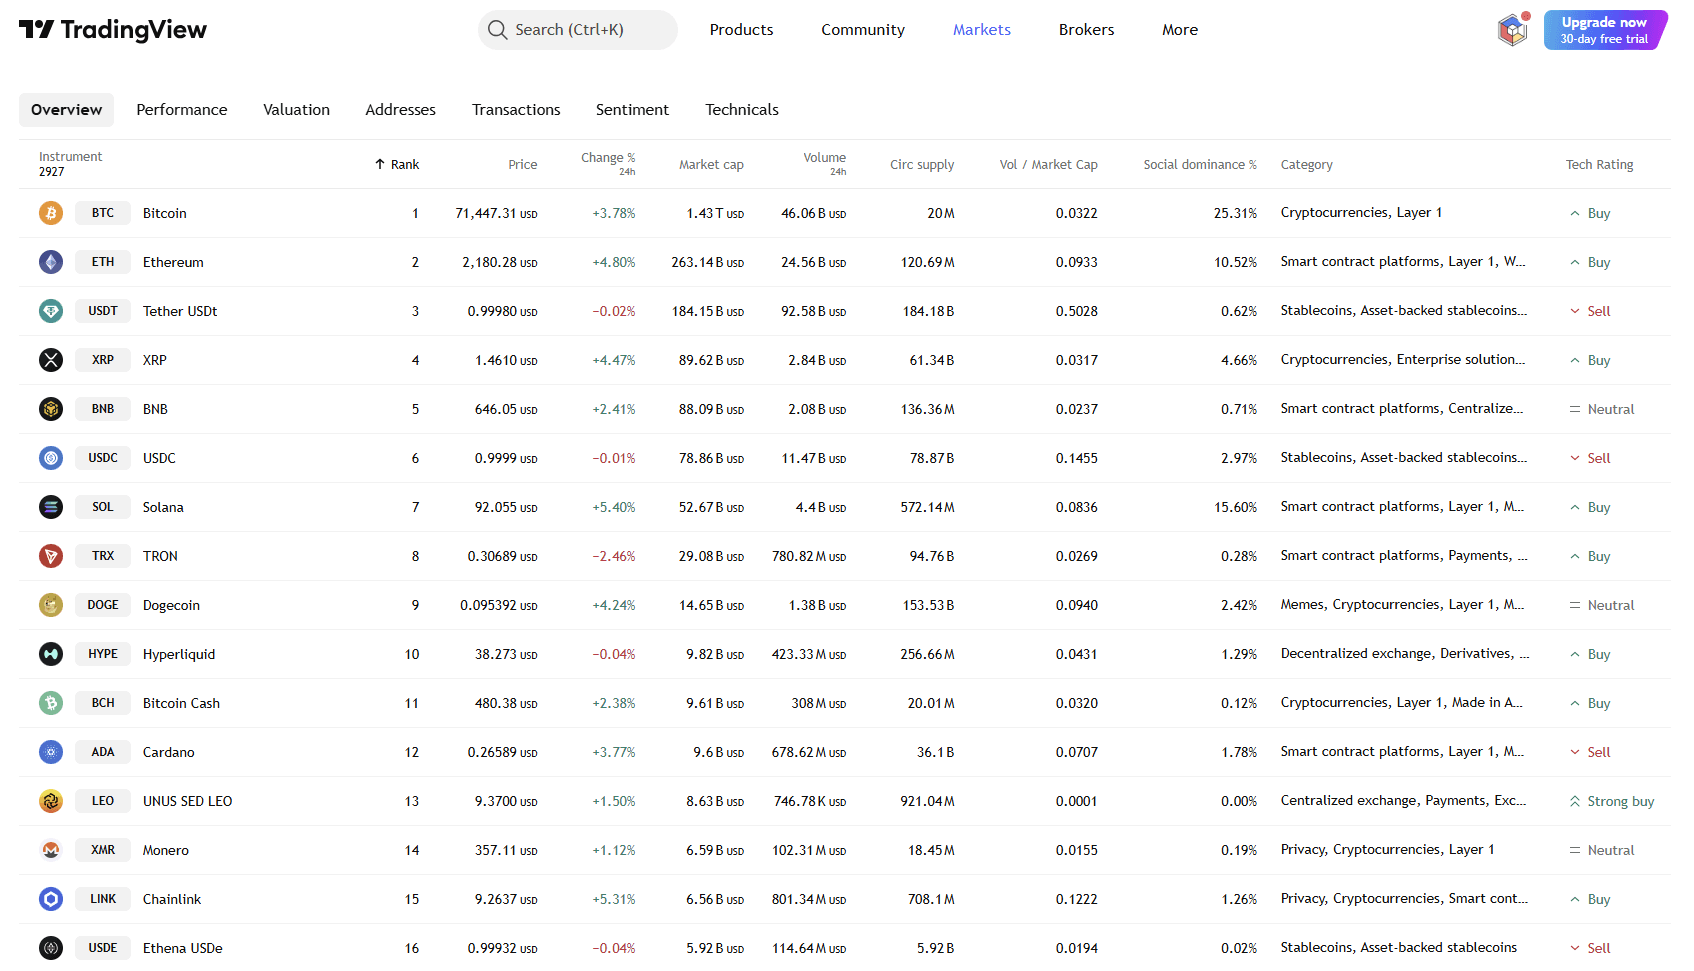
Other digital assets, including Ethereum, XRP, Solana, and the top 10 crypto assets by market capitalization, all registered gains of more than 4% as traders moved back into risk assets following the White House signal.
Following the uptick, short sellers who were betting against upward market momentum lost $271 million in the past hour, bringing their total losses to $364 million over the last 24 hours.
Trump's shifting position on Iran war
This marketwide rebound came after a volatile weekend in which Trump issued a series of shifting statements on the conflict.
Trump had previously threatened to destroy Iranian power infrastructure if the Strait of Hormuz was not reopened, while Iran warned it would retaliate against infrastructure linked to US interests and regional allies.
Those exchanges pushed markets toward a classic risk-off posture earlier on Monday, with oil surging, equities sliding, and investors reassessing the outlook for inflation and interest rates.
Once Trump announced the pause, the reaction spread quickly across asset classes. Oil prices fell sharply as traders reduced some of the geopolitical premium tied to fears of disruption in the Gulf.
Data from Oilprices show that West Texas Intermediate crude dropped 13% to $85.45 a barrel and Brent fell 12% to $98.66 after Trump’s post signaled a temporary opening for diplomacy.
At the same time, US stock futures rebounded more than 2%, reflecting a partial unwind of the defensive positioning that had dominated earlier in the day.
While, Europe’s STOXX 600 reversed losses of more than 2.2% to trade higher, and the dollar gave back earlier gains as investors responded to the prospect of a temporary de-escalation.
The post Bitcoin price jumps above $70,000 as US announces shock pause on Iran strikes appeared first on CryptoSlate.
Cryptoticker
Why is XLM Up?
The primary driver behind the XLM price increase is the news that US President Donald Trump has officially extended the 48-hour deadline previously given to Iran to reopen the Strait of Hormuz. Instead of immediate military action, the administration has granted an additional five-day window for negotiations, citing "productive conversations" with regional leaders. Investors have interpreted this as a cooling of the "war premium," rotating capital back into high-utility assets like Stellar.
What is Stellar Crypto?
Stellar is a decentralized, open-source network designed to facilitate fast, low-cost cross-border payments. Its native token, $XLM (Lumens), acts as a bridge currency to swap different fiat and digital assets. In times of geopolitical uncertainty involving trade routes (like the Strait of Hormuz), payment networks that offer "borderless" efficiency often see increased speculative interest and utility-driven demand.
XLM Price Analysis After the War News: Chart Breakdown
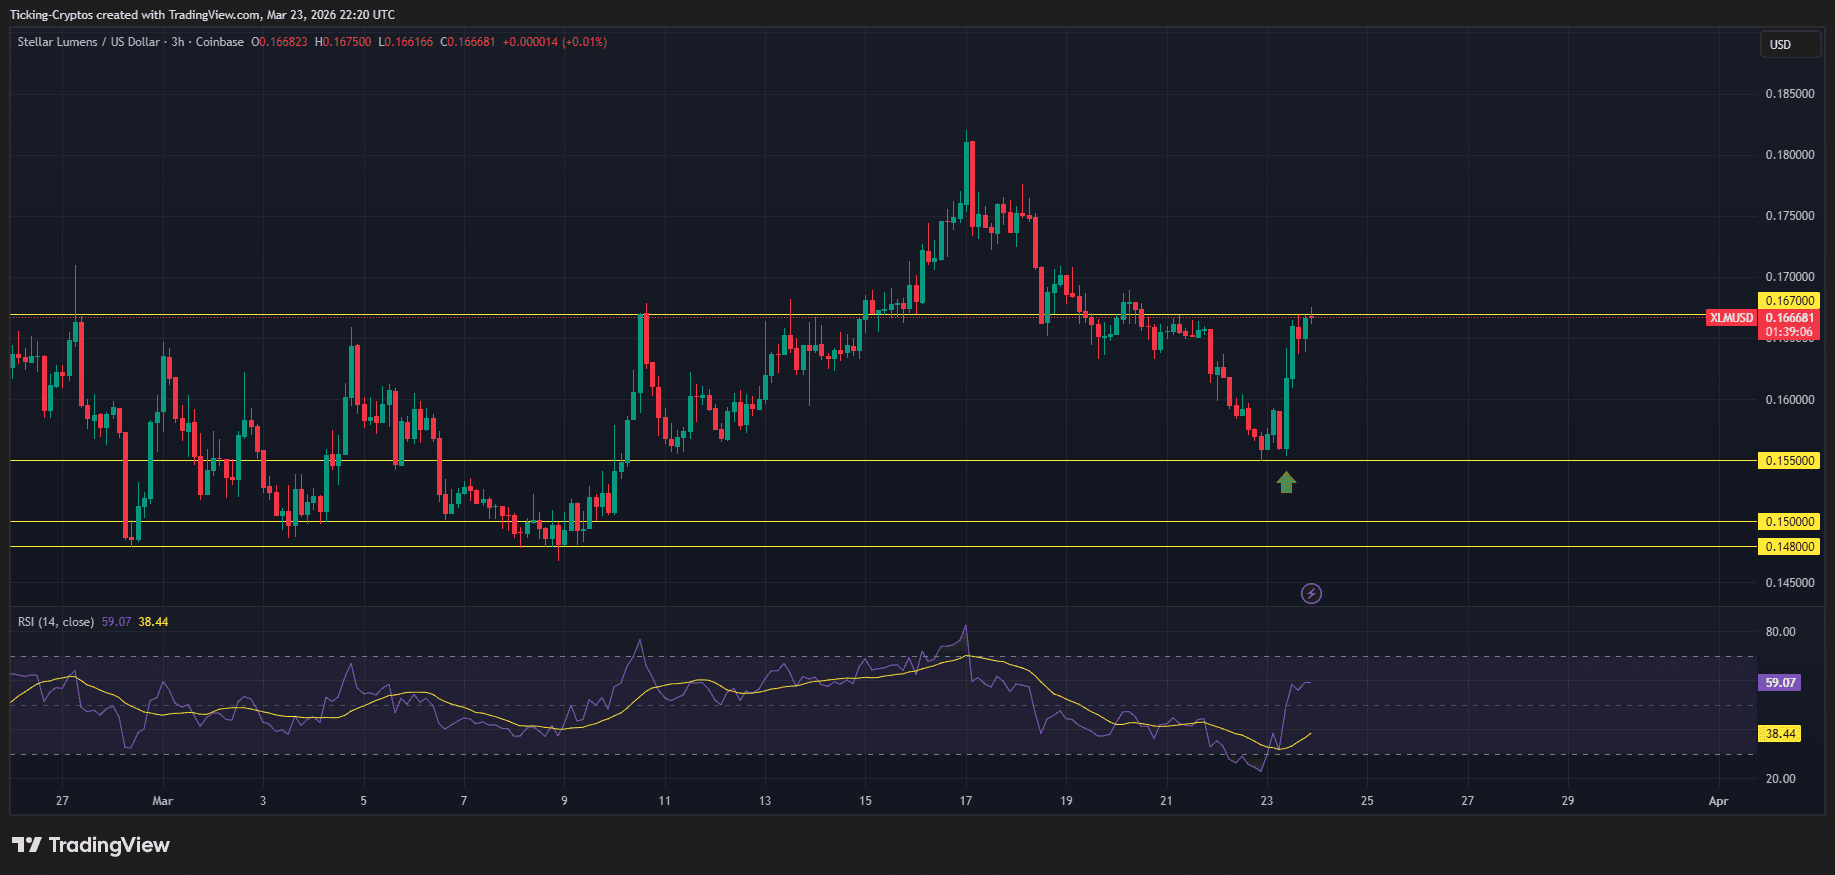
The XLM/USD chart highlights a sharp vertical move following the news. After languishing near the $0.155 support level during the height of the crisis, XLM has successfully breached its immediate resistance.
Key Technical Observations:
- Bullish Impulse: The 7% surge pushed the price toward the $0.168 mark, effectively reclaiming the 20-day Exponential Moving Average (EMA).
- Volume Profile: Trading volume spiked significantly during the announcement, confirming that institutional and retail buyers are stepping in on the "peace talk" narrative.
Target Levels: If the diplomatic momentum continues, the next major hurdle for the XLM price sits at $0.182. Conversely, if talks break down, a retest of the $0.145 zone is highly probable.
Geopolitics and the "Risk-On" Shift
The Strait of Hormuz is a vital artery for 20% of the world's oil and liquefied natural gas. The threat of its closure last weekend sent energy prices skyrocketing and forced a crypto market sell-off. Trump’s decision to extend the deadline to March 28, 2026, has allowed markets to breathe.
According to reports from The Guardian, the shift toward "escorted tankers" and political risk insurance has mitigated the immediate fear of a global energy shock. For XLM, which thrives in a stable global trade environment, this reprieve is a major fundamental tailwind.
What Should Investors Do?
While the 7% jump is encouraging, the situation remains fluid. The "five-day extension" is a temporary bridge, not a permanent resolution. Traders should monitor:
- Official White House Statements: Any pivot back to "maximum pressure" could erase these gains instantly.
- Oil Price Correlation: A continued drop in crude oil prices typically correlates with a stronger "risk-on" sentiment for altcoins.
- Security of Assets: During periods of high volatility, ensuring your tokens are off-exchange is critical. You can view our hardware wallet comparison to find the best security options.
Markets Explode on Trump’s Iran Statement
Global markets surged in a matter of minutes after President Trump announced a 5-day pause on military strikes against Iran’s energy infrastructure, claiming “productive talks” had taken place.
The reaction was immediate and aggressive:
- Over $900 billion added to the US stock market at the open
- Nasdaq futures +4%
- S&P 500 futures +3.9%
- Bitcoin (BTC) +5% within hours
- Oil prices dropped sharply, signaling easing geopolitical risk
In total, some estimates suggest over $2.5 trillion was added across global markets in less than 20 minutes.
A Perfect “Risk-On” Reaction
The move followed a classic macro playbook:
- Stocks rallied on reduced war risk
- Oil crashed as supply fears eased
- Bitcoin surged, benefiting from liquidity and momentum
Even traditional safe havens reacted violently, with gold and silver experiencing one of their most volatile sessions in years, initially dropping before sharply rebounding.
This was a textbook shift into risk-on sentiment.
But There’s One Problem…
Shortly after the rally, Iran officially denied any direct or indirect talks with the United States.
Statements from Iran’s Foreign Ministry and state-linked media contradicted Trump’s claims, rejecting the idea that negotiations had taken place.
This creates a critical disconnect:
👉 Markets are rallying on a de-escalation narrative that may not exist.
Markets Are Pricing Hope — Not Reality
Right now, the market appears to be pricing in:
- A temporary ceasefire
- Potential diplomatic progress
- Reduced geopolitical risk
But if those assumptions are incorrect, the implications are serious.
This isn’t the first time markets have reacted to headlines over confirmed developments, but the scale of this move is unusual.
👉 A single statement triggered nearly $1 trillion in equity inflows.
Why Bitcoin Is Benefiting
Bitcoin’s reaction is particularly interesting.
Unlike gold, which showed mixed signals, Bitcoin moved decisively higher—suggesting:
- Strong liquidity-driven momentum
- Growing perception as a macro asset
- Increased participation from risk-on traders
BTC is no longer just reacting to crypto-native news—it is now deeply integrated into global macro flows.
What Happens Next?
Everything now depends on one key factor:
👉 Is there actually a deal?
If talks are confirmed:
- Markets could continue higher
- Bitcoin may push toward new local highs
- Risk assets remain supported
If tensions escalate again:
- A sharp reversal is likely
- Oil could spike
- Stocks and crypto may retrace quickly
The Bottom Line
Markets just added $900 billion in value based on a narrative that is already being challenged.
That raises a critical question:
👉 Is this rally built on real progress—or on hope?
For now, markets are choosing optimism.
But if that optimism proves wrong, volatility could return just as fast as it disappeared.
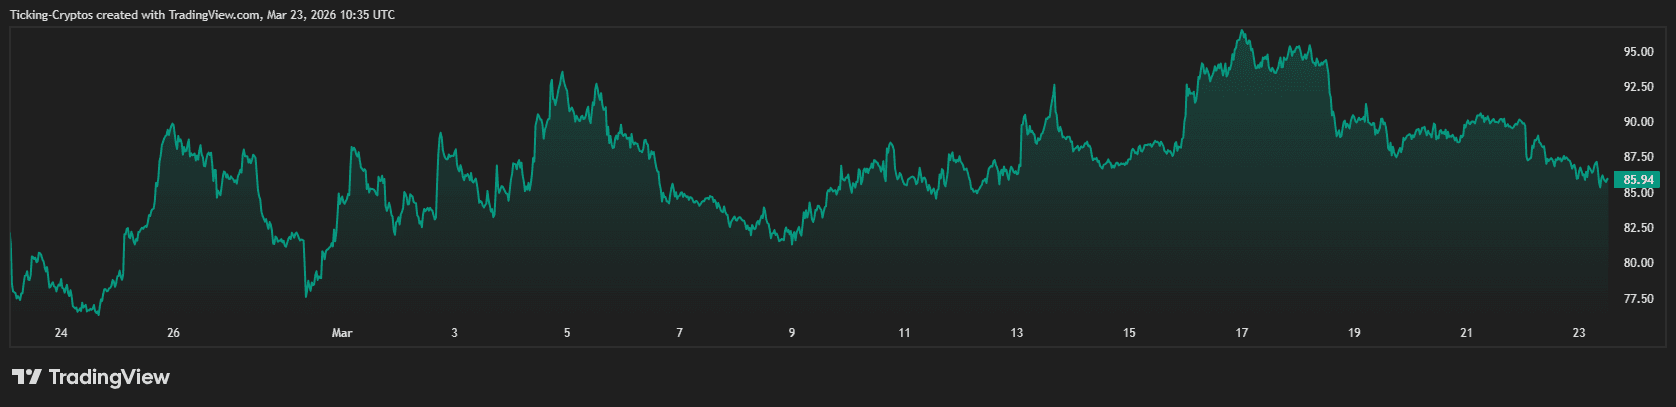
As of March 23, 2026, Solana ($SOL) is positioned at a critical technical juncture. Following a period of intense market-wide volatility triggered by geopolitical shifts in the Middle East and a hawkish "hold" from the Federal Reserve (FOMC), the asset is currently trading between $80 and $90. While the broader market remains cautious, Solana’s internal ecosystem is showing signs of decoupling, driven by massive institutional adoption and the imminent deployment of the Alpenglow consensus upgrade.
Is Solana a Good Buy Now?
Traders looking for a short-term direction should focus on the $92.34 resistance zone. A daily close above this level could catalyze a rally toward $98.65 by the end of March. Conversely, if SOL fails to defend the $86.66 support, a deeper correction toward the $80.00 psychological floor is highly probable.
What Should Driving Solana’s Value in 2026?
In the current 2026 landscape, Solana’s value is increasingly tied to its Network Finality and Institutional Liquidity. Unlike 2024, where retail "meme" activity dominated, the primary drivers now are:
- Spot Solana ETFs: Regulated vehicles providing direct exposure to institutional capital.
- Alpenglow Upgrade: A transition from Tower BFT to a new consensus mechanism aiming for 150ms finality.
- Digital Commodity Status: Confirmed regulatory taxonomy that has stabilized long-term investor sentiment.
Solna Price Analysis: Technical Chart Patterns
Analyzing the current SOL price action, we see a consolidation pattern forming after the mid-March dip.
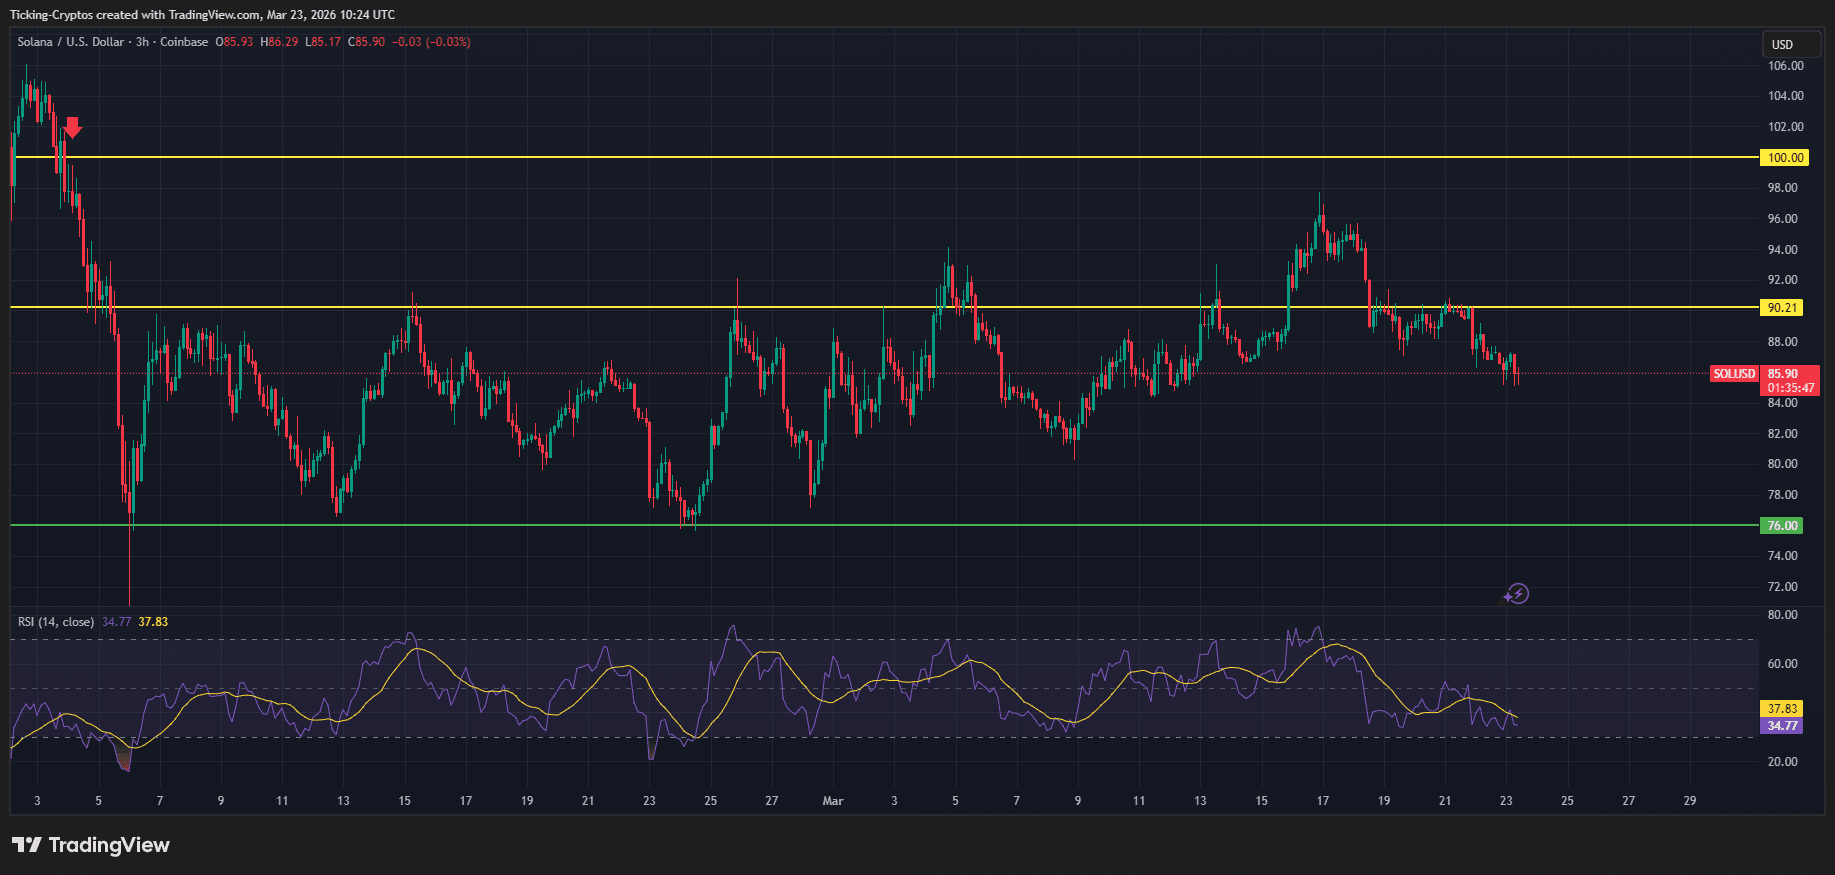
- Moving Averages: SOL is currently hovering near its 20-day EMA ($88.93). Staying above this level is vital for maintaining a bullish "bias." The 50-day SMA at $87.23 serves as a secondary safety net.
- RSI (Relative Strength Index): At 51.63, the RSI is neutral. This suggests the market is "resetting," providing enough room for a significant move without being immediately overbought.
- MACD Signal: We observe a slight bearish divergence on the daily histogram. This indicates that while the price is stable, buying momentum is currently thinning, requiring a fresh catalyst to break overhead resistance.
Solana Price: Key Support & Resistance
| Level Type | Price (USD) | Significance |
|---|---|---|
| Major Resistance | $117.71 | 2025 structural high; targets if $100 breaks. |
| Short-term Ceiling | $92.34 | Immediate hurdle; upper Bollinger Band target. |
| Pivot Point | $88.52 | Current "Fair Value" and 20-day EMA support. |
| Critical Support | $80.27 | The "Line in the Sand"; break here invalidates the bull case. |
Solana Upgrade: The Alpenglow and Firedancer Effect
The stagnant price action masks a massive technical shift. The Alpenglow upgrade is currently rolling out, which promises to reduce transaction finality from 12 seconds to under 150 milliseconds. This makes Solana faster than many centralized servers, a factor that major financial outlets cite as a reason for the record $1.45 billion in cumulative ETF inflows. Institutional players like Goldman Sachs and Electric Capital now hold significant SOL exposure via these ETFs, creating a "floor" of demand that was absent in previous cycles.
Will Solana Price go up? March 2026 Outlook
For the final week of March, the following three factors will dictate SOL's path:
- ETF Inflow Consistency: If net inflows exceed $20M daily, expect a test of $95.
- Geopolitical De-escalation: A reduction in energy-related inflation fears will allow capital to rotate back into "high-beta" assets like Solana.
- Bitcoin Stability: Solana's correlation with $Bitcoin remains high (0.84); a $BTC push past $72k would likely drag SOL above $100.
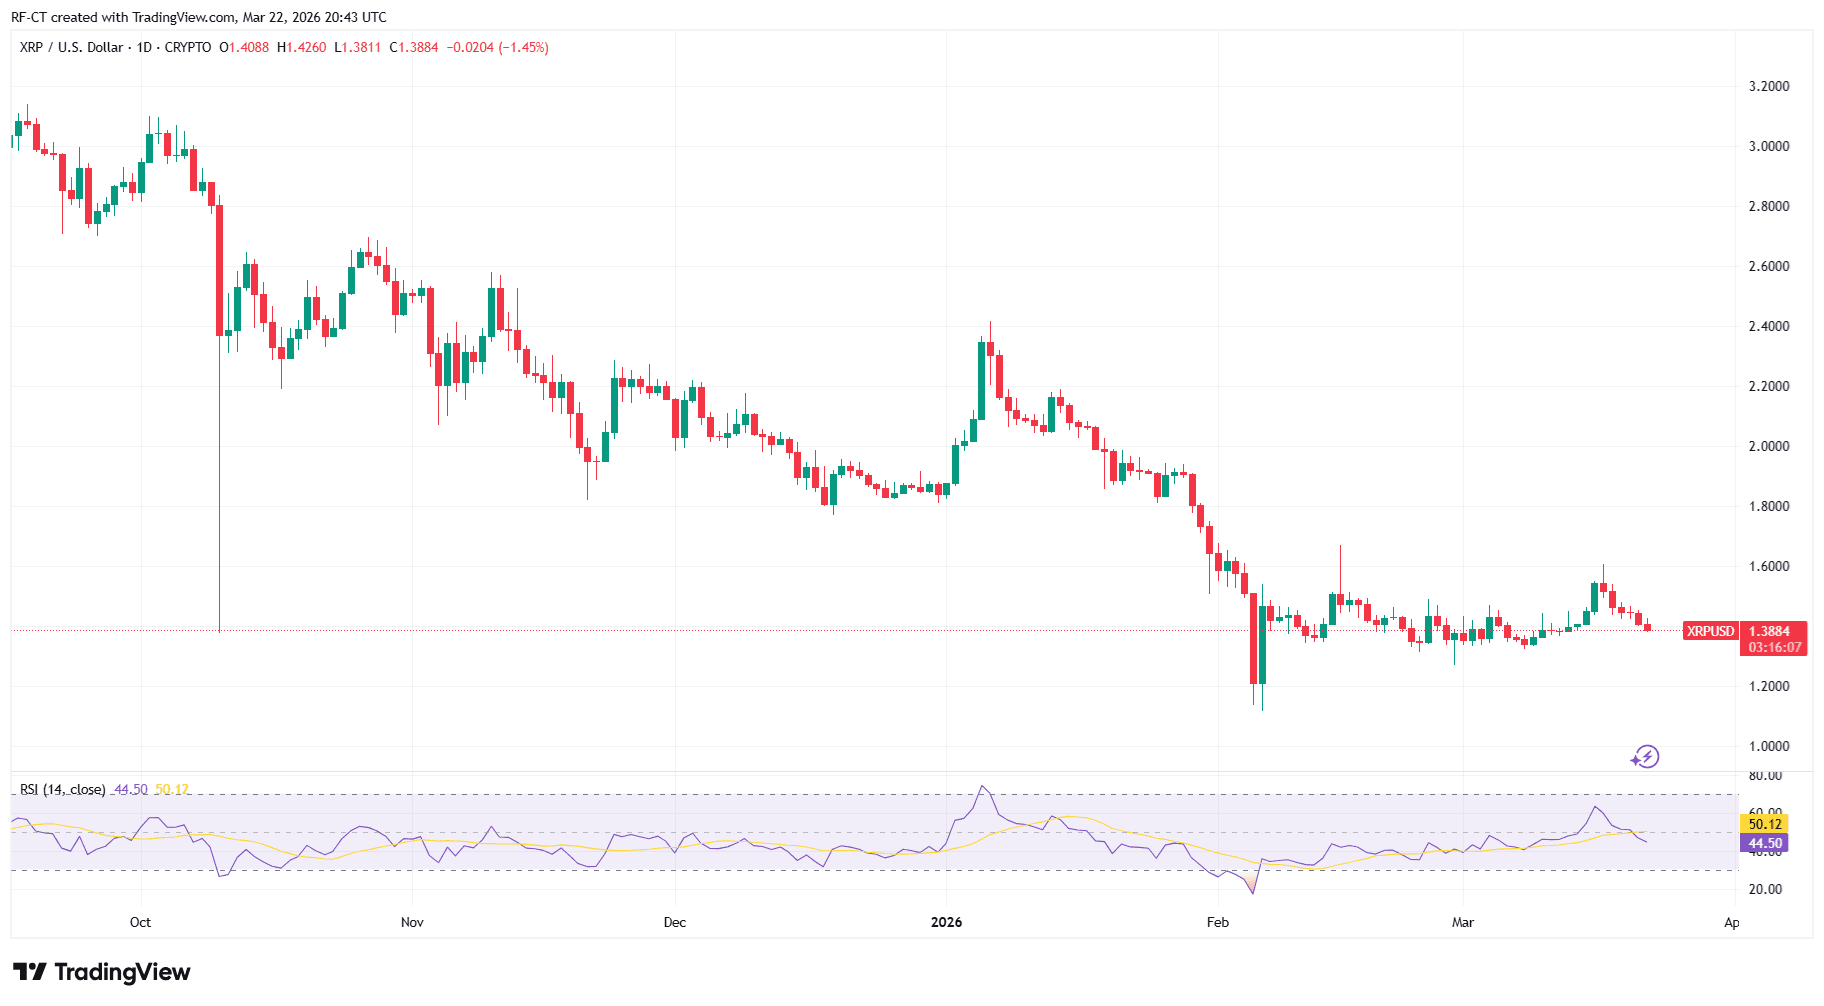
The XRP price is showing notable resilience despite ongoing volatility across the crypto market. While many altcoins struggle to maintain support levels, XRP is holding steady, suggesting that underlying demand remains strong.
As macro uncertainty continues to impact markets, traders are now asking: Is XRP preparing for its next breakout?
XRP price stabilizes near key levels
Currently, the XRP price is trading around the $1.38–$1.42 range, holding above an important short-term support zone.
This level has acted as a strong base in recent sessions, preventing further downside despite broader market pressure driven by macro news and geopolitical tensions.
Holding this zone is critical. If XRP maintains this support, it could build momentum for the next move higher.
Why XRP price is showing strength
Unlike many altcoins, XRP benefits from a unique narrative:
- Ongoing institutional interest
- Strong positioning in cross-border payments
- Continued relevance in regulatory discussions
This combination helps XRP remain relatively stable even when market sentiment shifts.
Additionally, XRP often reacts later than Bitcoin, meaning delayed but stronger moves can follow periods of consolidation.
Key levels to watch next
For the XRP price, traders should closely monitor:
- Support: $1.35 – $1.38
- Resistance: $1.45 – $1.50
👉 A break above $1.50 could trigger a stronger bullish move
👉 A drop below $1.35 may lead to a deeper correction
Right now, XRP is sitting at a decision point.
Conclusion — XRP price at a turning point
The XRP price is currently consolidating at a key level, showing resilience while the broader market remains uncertain.
This type of price action often precedes a larger move.
Whether XRP breaks upward or revisits lower levels will largely depend on overall market sentiment — but one thing is clear:
👉 XRP is not weak — it is waiting.
Stablecoins are rapidly moving from niche crypto tools to a central pillar of the global financial system. While much of the market focuses on Bitcoin volatility and geopolitical tensions, a quieter but far more structural shift is taking place.
From regulatory breakthroughs in the United States to global expansion by major payment companies, stablecoins are positioning themselves as the digital version of the dollar — faster, borderless, and increasingly integrated into everyday finance.
This raises a critical question: are stablecoins quietly becoming the new global dollar?
PayPal and Big Tech Are Accelerating Stablecoin Adoption
One of the clearest signals of this shift comes from PayPal, which has expanded its stablecoin services to over 70 countries. This move significantly lowers the barrier for millions of users to access digital dollars without relying on traditional banking systems.
Unlike earlier crypto adoption cycles driven by speculation, this wave is infrastructure-driven. Payment giants are embedding stablecoins directly into financial ecosystems, allowing users to send, receive, and store value globally in seconds.
This is not just innovation — it is a transformation of how money moves.
US Regulation Is Turning Bullish for Stablecoins
At the same time, regulatory clarity is beginning to emerge in the United States. Coordination between agencies like the U.S. Securities and Exchange Commission and the Commodity Futures Trading Commission is reducing uncertainty that has long slowed crypto adoption.
More importantly, recent discussions between lawmakers and the White House around stablecoin frameworks signal a shift toward integration rather than restriction.
This is a major turning point.
Instead of treating stablecoins as a threat, regulators are increasingly viewing them as an extension of the dollar’s global dominance — but in digital form.
Stablecoins Are Solving Real Global Problems
Stablecoins are gaining traction because they address real-world inefficiencies in traditional finance:
- Cross-border payments remain slow and expensive
- Banking access is limited in many regions
- Currency instability drives demand for dollar-based assets
Stablecoins offer:
- Instant transactions
- Lower fees
- Access to dollar liquidity anywhere in the world
In regions facing inflation or capital controls, stablecoins are already functioning as a practical alternative to local currencies.
A New Financial System Is Emerging
What makes this shift particularly important is its timing.
As geopolitical tensions rise and global trade faces increasing friction, the demand for neutral, digital, and liquid financial tools is growing.
Stablecoins are uniquely positioned at the center of this transformation:
- Backed by fiat currencies
- Integrated into crypto ecosystems
- Increasingly adopted by institutions
This creates a hybrid financial system where traditional and digital finance converge.
Risks and Challenges Still Remain
Despite their rapid growth, stablecoins are not without risks:
- Regulatory fragmentation across countries
- Dependence on underlying reserves
- Centralization concerns
- Potential competition from central bank digital currencies (CBDCs)
However, these challenges are being actively addressed as the market matures and institutions become more involved.
Conclusion — The Rise of the Digital Dollar
Stablecoins are no longer just a crypto niche — they are becoming a core layer of global finance.
With major companies expanding access, regulators moving toward clarity, and real-world demand increasing, stablecoins are quietly evolving into the digital equivalent of the dollar.
This transformation may not be as visible as Bitcoin price swings, but its long-term impact could be far greater.
Decrypt
The derivatives give users synthetic exposure to major U.S. equities while using Bitcoin and other crypto holdings as collateral, with plans to expand into tokenized assets later this year.
Hostplus’s crypto ambition is attempting to meet rising investor demand, even as volatility keeps rivals on the sidelines.
The restructuring comes as analysts say older DeFi models built on token incentives and emissions are increasingly under pressure.
Protesters marched between the San Francisco offices of major AI developers, calling for a pause in the development of more powerful AI systems.
Leading prediction market platforms Polymarket and Kalshi are taking new steps to try and counter insider trading.
U.Today - IT, AI and Fintech Daily News for You Today
Cardano (ADA) is currently navigating a period of intense market duality, with average investor losses hitting 43% even as the network’s underlying ecosystem reaches new adoption milestones.
Ripple CTO David Schwartz has sparked a heated debate over Bitcoin’s long-term viability, claiming that its Proof-of-Work (PoW) consensus mechanism is actually a "centralizing force" that the network is constantly struggling to overcome.
Market is certainly in a spot where comfortable price growth is possible, as multiple support violations is not the best news.
Crypto news digest: XRP reserve on Binance retreats from $2.8B zone; SHIB sees shorts exit in 4 hours; DOGE shows extremely bullish long-short ratio.
Ripple’s stablecoin treasury has executed a massive 30 million RLUSD burn across two transactions today, capping off a week of aggressive supply management that saw 45 million tokens destroyed against just 10 million minted.
Blockonomi
TLDR:
- Ethereum L1 will remain the core settlement and DeFi hub as it scales by several orders of magnitude.
- L2s must now prioritize differentiation and customization over scaling as their primary objective.
- The Ethereum Foundation urges all L2s to meet at least Stage 1 security standards going forward.
- Blobs are only 30% full, giving the EF room to expand capacity as L2 ecosystem demand grows.
The Ethereum Foundation has published a detailed post reshaping how L1 and L2 chains should relate. Written by Josh Rudolf, Julian Ma, and Josh Stark on March 23, 2026, the post updates a model that had not changed in roughly five years.
It addresses scaling, security standards, and cross-chain fragmentation across the broader Ethereum ecosystem.
L1 Retains Its Role as the Core Settlement Layer
Ethereum L1 is described as the primary hub for settlement, shared state, liquidity, and DeFi. The Foundation notes that no other chain matches its adoption, decentralization, and resilience today. L1 is expected to scale by several orders of magnitude while preserving its core values.
ZK technology has matured faster than initially anticipated, opening new scaling paths. This progress was driven by contributions from many teams across the ecosystem. The Foundation remains committed to growing L1 without compromising security or decentralization.
Blobs, a key data availability mechanism for L2s, are currently only around 30% full. The EF stated it feels comfortable expanding blob capacity further as demand grows. This headroom gives L2s room to grow without facing immediate bottlenecks.
The post also outlines plans to improve liquidity access on L1. Faster finality, deposits, and withdrawals are all part of the roadmap. These changes are aimed at making L1 a more accessible foundation for the entire ecosystem.
L2s Must Shift Toward Differentiation and Security
The Foundation’s framing of L2 objectives has shifted considerably. Previously, scaling was the primary goal of L2s. Today, the emphasis is on differentiated features, customization, and controlled execution environments.
L2s are now encouraged to reach at least Stage 1 security standards. This means users must be able to exit safely to L1 even if operators or security councils act maliciously. The Foundation called this passing the “walkaway” test.
Beyond Stage 1, L2s seeking deeper L1 integration are encouraged to pursue Stage 2, synchronous composability, and native rollup status. Native rollups would allow L2s to remove their security councils entirely. This would make their security fully verifiable by L1.
The post also encourages L2s to explore tools like the Open Intents Framework and the Fast Confirmation Rule. These are designed to improve interoperability and capital access across chains. Teams are urged to contribute to synchronous composability workstreams already in progress.
Fragmentation Remains a Priority Problem to Solve
The Foundation acknowledged that fragmentation is the primary downside of a multichain ecosystem. Users and developers currently face UX and platform inconsistencies when moving across chains. Addressing this is listed as a key priority going forward.
The EF plans to work with chains, wallets, and infrastructure providers on better interoperability solutions. The goal is to fix both the user experience and developer platform fragmentation. A clearer L1 and L2 relationship is also expected to reduce narrative fragmentation around Ethereum.
Transparency from L2 teams is also emphasized throughout the post. L2s are expected to clearly communicate their individual security properties to users. The Foundation highlighted the role of L2Beat in monitoring and validating these properties.
The Platform team, led by Josh Rudolf, will serve as an ongoing interface between L2 teams and the core protocol roadmap.
This team is tasked with improving the Ethereum platform as a whole. Regular collaboration with L2 teams is intended to ensure protocol priorities reflect real ecosystem needs.
The post Ethereum Foundation Redefines L1 and L2 Roles in New Ecosystem Vision for 2026 appeared first on Blockonomi.
Key Highlights
- SHIB climbed more than 8% to reach $0.00000615, maintaining position above crucial $0.000006 threshold
- Geopolitical risk declined after reports suggested Trump postponed Iran strike plans, triggering market-wide relief
- Token burn activity exploded 637% over 24 hours, eliminating more than 8 million SHIB from supply
- Spot trading activity surged 67%, while derivatives trading doubled to $194.44 million
- Regulatory classification as a digital commodity by U.S. authorities decreased compliance concerns
Shiba Inu delivered an impressive rally exceeding 8% on March 23, 2026, driving the price to $0.00000615. The meme token maintained its position firmly above the critical $0.000006 threshold during trading hours. Meanwhile, the overall cryptocurrency market expanded 2.57%, bringing total capitalization to $2.42 trillion.

The primary catalyst for this upward movement stemmed from decreased geopolitical concerns. Reports indicated that President Donald Trump delayed potential military operations targeting Iran, creating a five-day diplomatic opportunity. This development lowered immediate conflict probability and sparked positive momentum throughout global financial markets.
Bitcoin climbed approximately 4% in the same timeframe, securing its position above the psychologically important $70,000 mark. Market analysts consider this threshold essential for sustaining bullish momentum across the cryptocurrency sector.
Meme-based tokens demonstrated particularly strong reactions to the improved market atmosphere. The combined market capitalization of meme coins expanded 6% to reach $34.4 billion. Prominent tokens including Dogecoin, Pepe, and Shiba Inu all experienced heightened purchasing interest.
Token Destruction Activity and Circulation Metrics
Shiba Inu’s burn mechanism accelerated dramatically, recording a 637% increase in 24-hour activity. According to Shibburn tracking data, more than 8 million SHIB tokens were permanently eliminated from the circulating supply during this window.
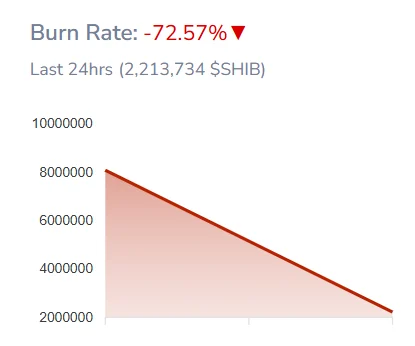
This heightened destruction rate reinforces the token’s deflationary economic model. Reducing available supply theoretically enhances scarcity perception among token holders and investors.
Spot market activity for SHIB expanded 67%, processing 169.65 billion tokens. Derivatives market participation doubled, climbing 100.32% to approximately $194.44 million in trading volume.
Open interest figures rose 10.12% to settle at $45.03 million. This metric indicates that market participants are actively establishing and holding leveraged trading positions.
Chart Analysis and Critical Price Thresholds
The MACD histogram transitioned into positive range, indicating developing bullish momentum. Additionally, the Chaikin Money Flow indicator displayed positive values, confirming genuine capital accumulation rather than temporary speculative activity.
Another OG memecoin on the brink to break out. $SHIB is also looking juicy here, with a potential 350% gain. pic.twitter.com/iiwwFXWAQN
— ray
(@moonbag) March 19, 2026
Should buyers successfully defend the $0.000006 floor, the next upside objectives emerge at $0.0000065 and $0.0000070. Conversely, inability to maintain current support could trigger a retracement toward $0.0000055.
From a regulatory perspective, United States authorities officially designated Shiba Inu as a digital commodity. This classification eliminates regulatory ambiguity that previously created headwinds for various alternative cryptocurrencies.
Financial technology platform OnePay broadened its cryptocurrency trading offerings to incorporate SHIB, potentially providing access to additional retail investor segments.
Current market data shows SHIB trading at $0.00000611, with open interest recorded at $45.03 million and derivatives volume reaching $194.44 million.
The post Shiba Inu (SHIB) Surges 8% as Burn Rate Explodes 637% Higher appeared first on Blockonomi.
Key Highlights
- Shares of NovaBay Pharmaceuticals climbed approximately 19% following the announcement of its transformation into Stablecoin Development Corporation
- The firm will transition its stock symbol from NBY to SDEV starting April 3
- The company has accumulated 2.06 billion SKY tokens — representing approximately 8.8% of circulating supply — valued at roughly $150 million
- The strategic shift was financed through a $134 million private funding round featuring Tether Investments and Framework Ventures
- While Monday brought gains, the stock has declined over 95% since the beginning of the year
Shares of NovaBay Pharmaceuticals experienced a dramatic rally of nearly 19% on Monday as the company unveiled plans to completely abandon its eye care pharmaceutical business in favor of the digital stablecoin sector.
NovaBay Pharmaceuticals, Inc., NBY
The biotech firm announced its intention to adopt the name Stablecoin Development Corporation. Along with the rebrand, the company’s trading symbol will transition from NBY to SDEV on April 3.
Company CEO Michael Kazley characterized the transformation as a strategic bet on the future of digital currency infrastructure. “The name change to Stablecoin Development Corporation reflects our conviction that stablecoins represent the most compelling structural opportunity in digital finance,” Kazley explained in an official statement.
This strategic direction isn’t completely unexpected. In January, NovaBay submitted regulatory filings with the SEC describing its plans to function as an “on-chain holding company framework focused on long-duration participation in protocol-level digital asset ecosystems.”
NBY shares jumped 19% to approximately $1.38–$1.40 following the announcement. However, despite this rally, the stock remains deeply underwater, having lost more than 95% of its value year to date.
Massive SKY Token Position Forms Core of New Business Model
The foundation of NovaBay’s reimagined business strategy revolves around its substantial holdings in SKY, the governance token powering the Sky protocol — which is the rebranded MakerDAO platform that supports the USDS stablecoin.
According to March 16 disclosures, the company controls approximately 2.06 billion SKY tokens. This stake accounts for roughly 8.8% of the token’s total available supply and carries an estimated market value of $150 million. SKY currently trades at $0.073 per CoinGecko data, showing a 15% gain year to date despite broader cryptocurrency market weakness.
The substantial token position was established using capital from a $134 million private placement that closed in January. Major participants in that funding round included Framework Ventures, Tether Investments, and the Sky Frontier Foundation.
Staking Returns and Expansion Strategy
The company’s SKY staking operations have already produced 26.6 million SKY tokens in aggregate rewards. Management indicated plans to continue acquiring additional SKY tokens through open market purchases.
Currently, SKY stands as the sole digital asset authorized under NovaBay’s operational and risk governance framework. However, the company has identified yield-generating stablecoins as a strategic priority for future expansion.
Management described these financial instruments as “productive financial assets that unlock new primitives for savings, treasury management, and capital formation.”
Established in 2000 in California, NovaBay dedicated more than twenty years to developing eye care biotechnology products before executing this dramatic strategic transformation.
The pivot arrives as stablecoin regulatory frameworks gain momentum in the nation’s capital. Congress recently achieved an “agreement in principle” regarding the treatment of stablecoin yield within broader cryptocurrency market structure legislation — representing progress toward comprehensive Senate Banking Committee regulatory measures.
The company’s revised strategy emphasizes acquiring and holding protocol-native digital assets over extended timeframes to capture value from what management terms “protocol-level economic activity.”
Total staking rewards have reached 26.6 million SKY tokens to date, with ongoing initiatives aimed at expanding this position substantially.
The post NovaBay Pharmaceuticals (NBY) Soars 19% Following Stablecoin Transformation Announcement appeared first on Blockonomi.
Quick Overview
- Crypto investment products attracted $230M in weekly inflows, with Bitcoin dominating at $219M
- Solana pulled in $17M during its seventh consecutive week of positive flows, reaching $136M total
- SOL currently trades near $91–92, showing a 5.64% daily gain but a 3% weekly decline
- Technical analysis reveals a rising wedge formation on the 3-day timeframe, indicating possible continuation of downtrend
- Critical price zones: $78 as support level and $95 as resistance, with potential decline to $65–70 range
Solana (SOL) maintains its position in the lower $90 range following a brief uptick, though technical indicators suggest the rally may face challenges ahead.
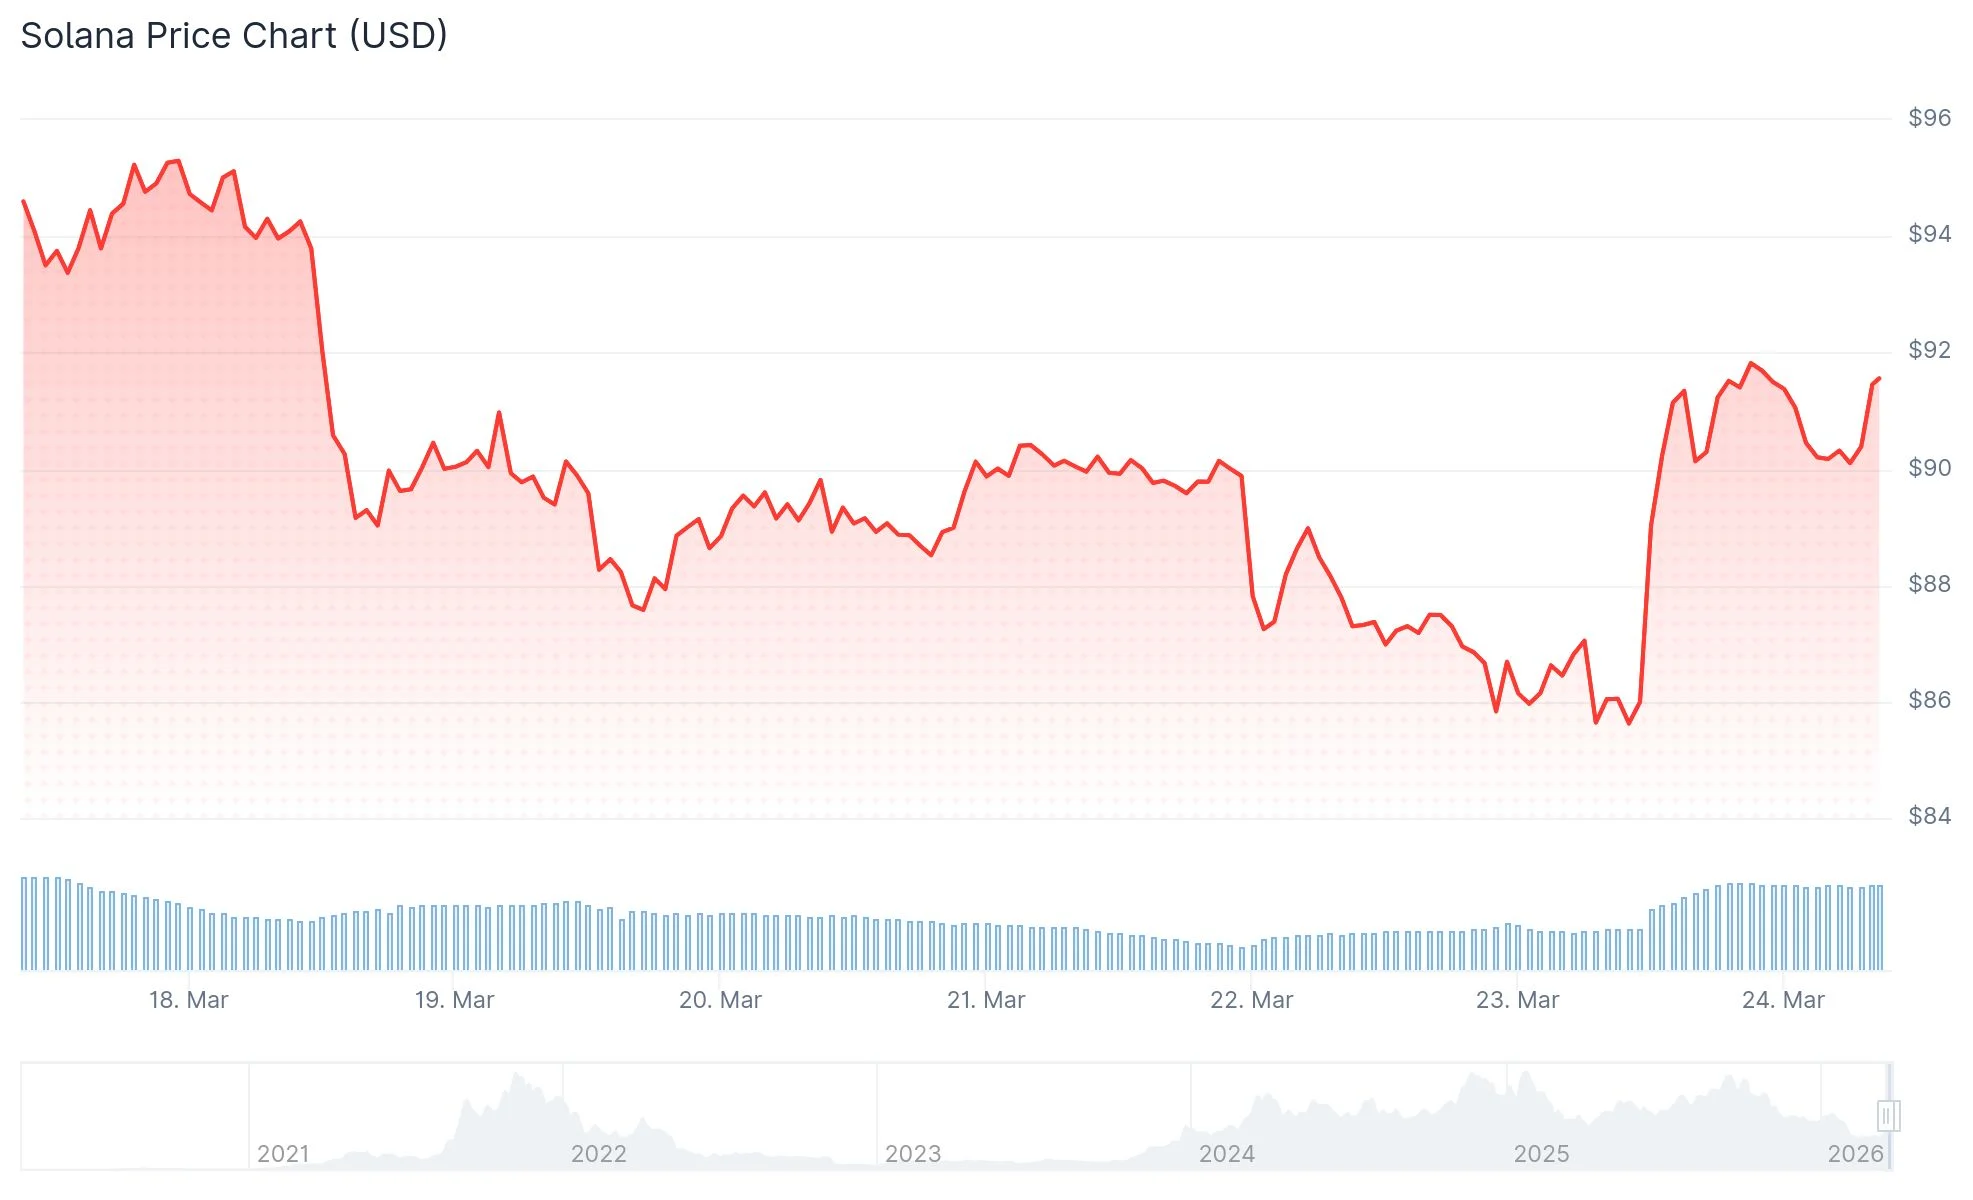
Crypto investment vehicles recorded $230M in aggregate inflows during the previous week, based on CoinShares reporting. Initial trading days showed robust momentum with $635M flowing in, but market sentiment reversed following the Federal Reserve’s policy announcement, resulting in $405M of outflows midweek.
The United States dominated regional capital flows with $153M. Germany recorded $30.2M in additions while Switzerland accounted for $27.5M.
Bitcoin captured the lion’s share of investment interest with $219M in inflows. Ethereum experienced $27.5M in withdrawals, ending its three-week run of positive momentum.
Solana secured $17M in inflows during the most recent week, marking its seventh straight week of net positive flows. The cumulative total across this period now stands at $136M.
SOL was trading at $91.61 as of press time, reflecting a 5.64% increase over the previous 24-hour period. The daily advance notwithstanding, the token remains approximately 3% lower compared to seven days prior.
Rising Wedge Pattern Triggers Caution
Market analyst CryptoBullet identified a rising wedge structure developing on Solana’s 3-day price chart. This technical formation emerged following SOL’s breach below its 200-week moving average, a metric frequently referenced for assessing macro trend health.
$SOL 3D chart
This Rising Wedge looks horrendous
Most likely it will be resolved to the downside
(Trend continuation) pic.twitter.com/0mN75G0KVK— CryptoBullet (@CryptoBullet1) March 22, 2026

Successive rebounds inside the wedge structure display diminishing strength. This behavior indicates buying pressure is gradually fading. A rising wedge pattern that forms after significant price deterioration typically foreshadows trend continuation to the downside.
Should SOL violate the lower boundary of the wedge, additional downside acceleration may materialize. Analyst DrBullZeus identifies $78 as the next support threshold, with breakdown scenarios potentially driving price action toward the $65–70 corridor.
Weekly Timeframe Presents Conflicting Indicators
Examining the weekly chart reveals the 100 and 200 exponential moving averages maintaining upward trajectories, representing constructive long-term structure. Conversely, the 20 and 50 EMAs have stalled, reflecting momentum deceleration.
Bollinger Bands display tight consolidation, a configuration that historically precedes significant directional moves. The Relative Strength Index hovers in the mid-30s — not yet in oversold territory but demonstrating sellers maintain control.
The MACD indicator continues operating in negative space, though diminishing histogram readings suggest selling intensity may be moderating incrementally.
Chainlink and Hyperliquid registered more modest inflow figures of $4.6M and $4.5M respectively throughout the week.
Regarding upside potential, a decisive move beyond $95 could propel SOL toward the $110–$120 range. Extended forecasts from analyst Moonbag project targets of $260–$300 contingent upon SOL recapturing the $180–$200 area.
The Balance of Power metric currently registers negative readings, with selling pressure maintaining the upper hand according to recent data.
The post Solana (SOL) Accumulates $136M in Weekly Inflows Despite Rising Wedge Warning appeared first on Blockonomi.
Key Highlights
- Strategy revealed a $44.1B capital-raising initiative through at-the-market programs to expand Bitcoin holdings
- The initiative encompasses $21B in MSTR common shares, $21B in STRC preferred shares, and $2.1B in STRK preferred shares
- MSTR shares gained more than 2%, reaching the $138–$140 range during trading
- The company acquired 1,031 BTC during the previous week for $76.6M, pushing total holdings to 762,099 BTC
- Strategy has accumulated approximately 90,000 BTC during the initial three months of 2026
Strategy has revealed a comprehensive $44.1 billion fundraising strategy aimed at continuing its Bitcoin accumulation efforts, propelling the company’s shares upward by more than 2% during Monday’s trading session.
The initiative was formally disclosed through an 8-K regulatory filing submitted to the Securities and Exchange Commission. The filing outlines three distinct at-the-market offerings spanning Strategy’s common equity and two separate preferred stock classes.
The bulk of the capital-raising effort includes a $21 billion ATM offering for MSTR common equity alongside an equivalent $21 billion program for STRC perpetual preferred shares. An additional $2.1 billion allocation targets the company’s STRK preferred stock instrument.
Strategy Inc, MSTR
Strategy refrained from establishing a specific timetable for executing these offerings, indicating merely that share sales could occur “from time to time” based on market conditions.
MSTR equity touched an intraday peak of $140 during Monday’s market hours before settling near the $138 level, based on TradingView market information. Bitcoin simultaneously rallied, surpassing the $70,000 threshold.
Strategic Pivot Toward Preferred Equity Instruments
Strategy has increasingly favored preferred stock issuances as its primary funding mechanism for Bitcoin acquisitions, thereby alleviating dilution concerns for MSTR common stockholders. The preferred share structures provide monthly dividend payments to holders while enabling the company to expand its cryptocurrency treasury.
Two weeks prior, Strategy executed sales of 11.8 million STRC shares combined with 2.8 million MSTR common shares, generating proceeds that funded a $1.57 billion Bitcoin acquisition — marking the company’s largest single purchase this year.
For the most recent weekly acquisition, the firm relied exclusively on MSTR common stock. Strategy sold 509,111 shares, netting $76.5 million in proceeds to purchase 1,031 BTC at an average acquisition cost of $74,326 per Bitcoin.
Through its previous $21 billion MSTR ATM program, Strategy had completed approximately $15.9 billion in common stock transactions. The company has additionally executed $20 billion in STRK sales and $4.2 billion in STRC offerings under earlier registered programs.
Expanding Cryptocurrency Holdings
Strategy currently maintains a Bitcoin treasury of 762,099 BTC, purchased at an average acquisition price of $75,694 per coin, representing a total investment of $57.69 billion.
The corporation has expanded its holdings by nearly 90,000 BTC since January 2026. Recent acquisitions this month encompass 17,994 BTC purchased on March 9 and 22,337 BTC acquired on March 16, totaling approximately $2.9 billion in deployment.
Bitcoin currently trades more than 44% below its all-time peak of $126,000, established in October 2025. At that market zenith, Strategy’s Bitcoin portfolio commanded a market value exceeding $78 billion.
At present market valuations, the company faces an unrealized deficit of roughly $3.4 billion, according to DropsTab analytics.
Strategy’s consistent Bitcoin accumulation pattern has persisted on a weekly basis since year-end.
The post Strategy (MSTR) Stock Climbs 2% Following Massive $44.1B Bitcoin Fundraising Announcement appeared first on Blockonomi.
CryptoPotato
PI is cooling down after its most recent rally. Can bulls retake control?
PI Network (PI) Price Predictions: Analysis
Key support levels: $0.15, $0.18
Key resistance levels: $0.20, $0.28
PI Correction Appears Completed
After the price spiked to 30 cents, PI entered a deep correction, falling below 20 cents. At the time of this post, the price is hovering around 19 cents, with 18 cents acting as a key support.
If PI can reclaim a price above 20 cents, bulls will have the upper hand and may attempt a new rally towards 30 cents. So far, the price is making higher highs and higher lows, which is a bullish signal.
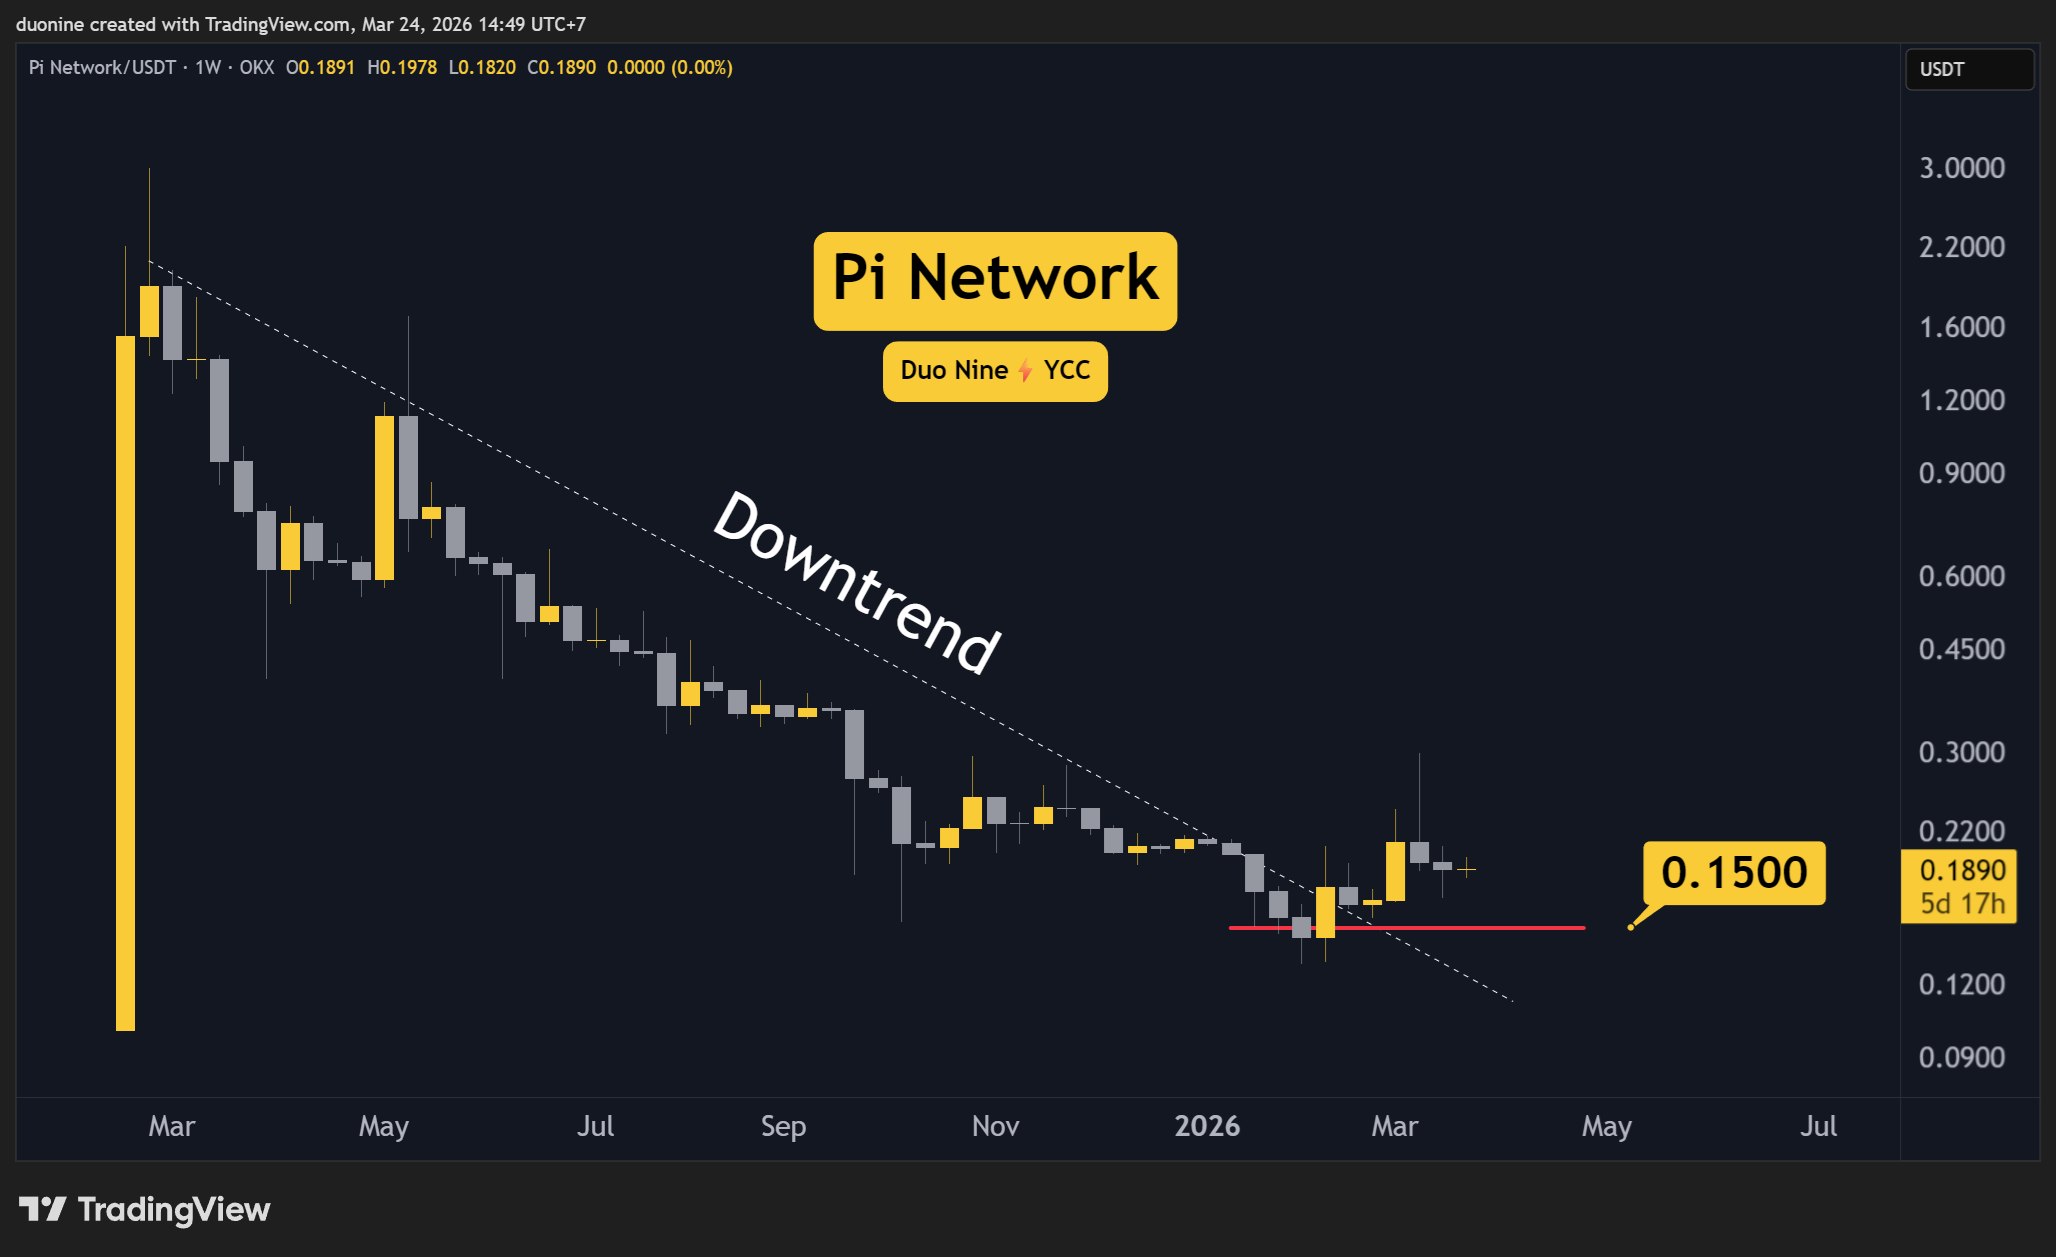
Volume Falls
Since its most recent rally, PI’s volume has been falling. For this reason, bulls may need more time before attempting another go at making new highs. Still, simply holding the price in its current zone puts buyers at an advantage.
This advantage holds as long as the support at $0.15 is not lost. That level is key and must be defended at all costs. Luckily, sellers did not manage to push the price so low during this most recent correction. This shows bulls still maintain the upper hand.

Daily MACD Remains Bearish
The ongoing correction is likely to continue until the daily MACD turns bullish. Right now, the moving averages are falling, and the histogram remains on the negative side. While this is bearish, the MACD also suggests this correction could soon end.
Because the histogram is making higher lows, that shows sellers have lost interest, and the momentum could shift bullish again later this month. This will be an important opportunity for PI to break the resistance at 20 cents and push higher again.

The post Pi Network (PI) Price Predictions for This Week appeared first on CryptoPotato.
The AI-focused token operating on the BNB Chain continues with its immense volatility, but this time in the opposite direction.
After charting massive double- and even triple-digit gains for days and weeks, the token has plummeted by over 70% since its March 22 all-time high amid ongoing scrutiny from the community.
SIREN Dumps Hard
CryptoPotato repeatedly reported SIREN’s massive price gains over the past several days. Recall that the token traded at $0.40 by March 10 before it went on an incredible run that culminated in the late hours of March 22 with an all-time high of $3.65.
This sort of rally is highly unexpected and surprising at the moment, given the overall market conditions. The rest of the crypto market struggles to post 2-3-5% weekly gains, while one altcoin, which had a questionable first year of its existence, stole the show and dwarfed all others.
However, this exponential rise reached its (somewhat expected) end in the past 24 hours. The asset has crashed by over 70% since the aforementioned ATH, and now struggles to remain above $1.00. This intense collapse has pushed it from being among the top 40 alts by market cap to outside of the top 80.
It also came just as many users on X speculated that SIREN could be “the biggest scam of 2026.” The general consensus on X is that this pump was an apparent market manipulation by one entity.
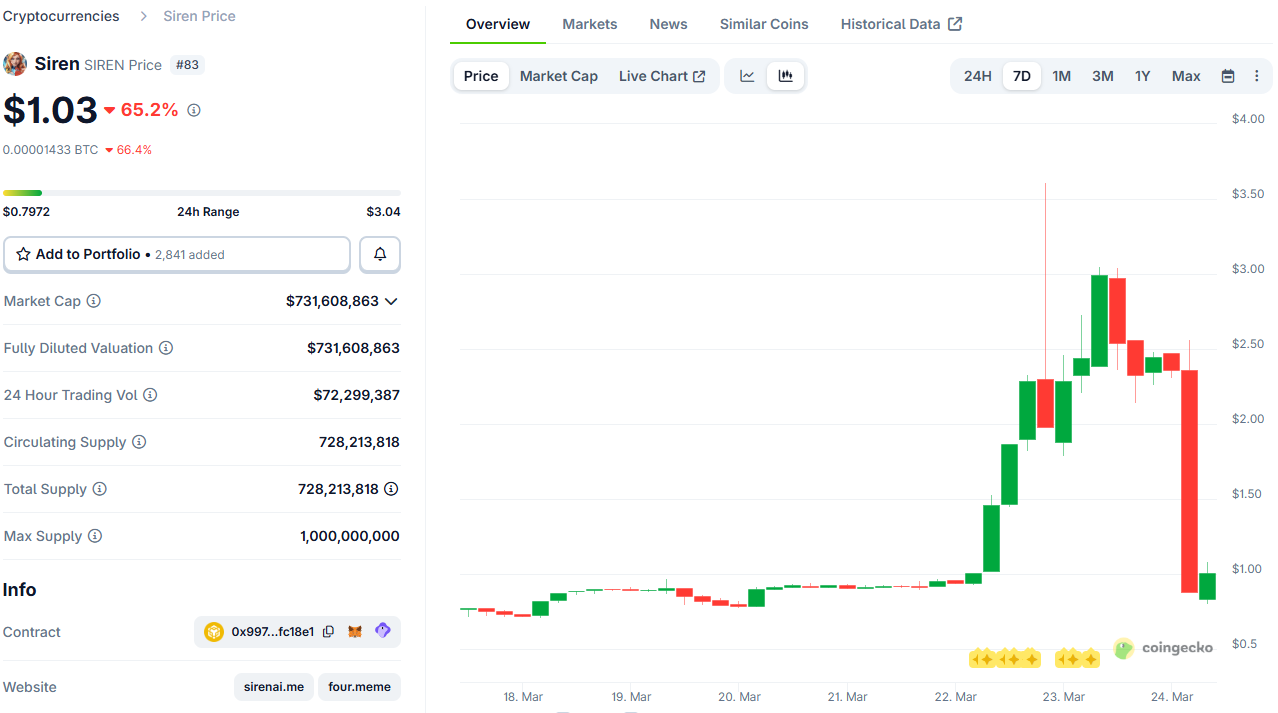
The Warnings
Bubblemaps warned yesterday that a single cluster owns almost 50% of SIREN’s supply. At the asset’s peak price, this was worth roughly $1.5 billion, and the analysts added that “this only ends one way” hours before the actual crash took place.
They added that SIREN launched in February 2025 as the “first on-chain AI agent analyst on BNB.” However, it was “largely abandoned” shortly after launch. They also explained when this one cluster of over 200 wallets purchased the tokens (June and February 2025) and dispersed them to 47 addresses.
Although the cluster’s identity remains officially unknown, it has been linked by ZachXBT and others to DWF Labs.
I started graphing the 48.5% SIREN cluster today on BSC and noticed the addresses link to several obscure DWF affiliated tokens onchain (LADYS, RACA, TOMO, etc)
— ZachXBT (@zachxbt) March 23, 2026
The post SIREN Tanks 70% in a Single Day as ZachXBT and Bubblemaps Sound the Alarm appeared first on CryptoPotato.
XRP is holding steady at $1.4. Where will it go next?
Ripple (XRP) Price Predictions: Analysis
Key support levels: $1.4
Key resistance levels: $1.6
XRP Consolidates Around $1.4
After sellers halted the bullish momentum at the $1.6 resistance, XRP entered a pullback and held well above the key $1.4 support. So far, market participants have found equilibrium at this level, but it is unlikely to last.
Based on the price action, another test of the key resistance appears likely, especially if the support continues to hold in the coming days and weeks. On the other hand, a loss of $1.4 would encourage sellers to push lower.
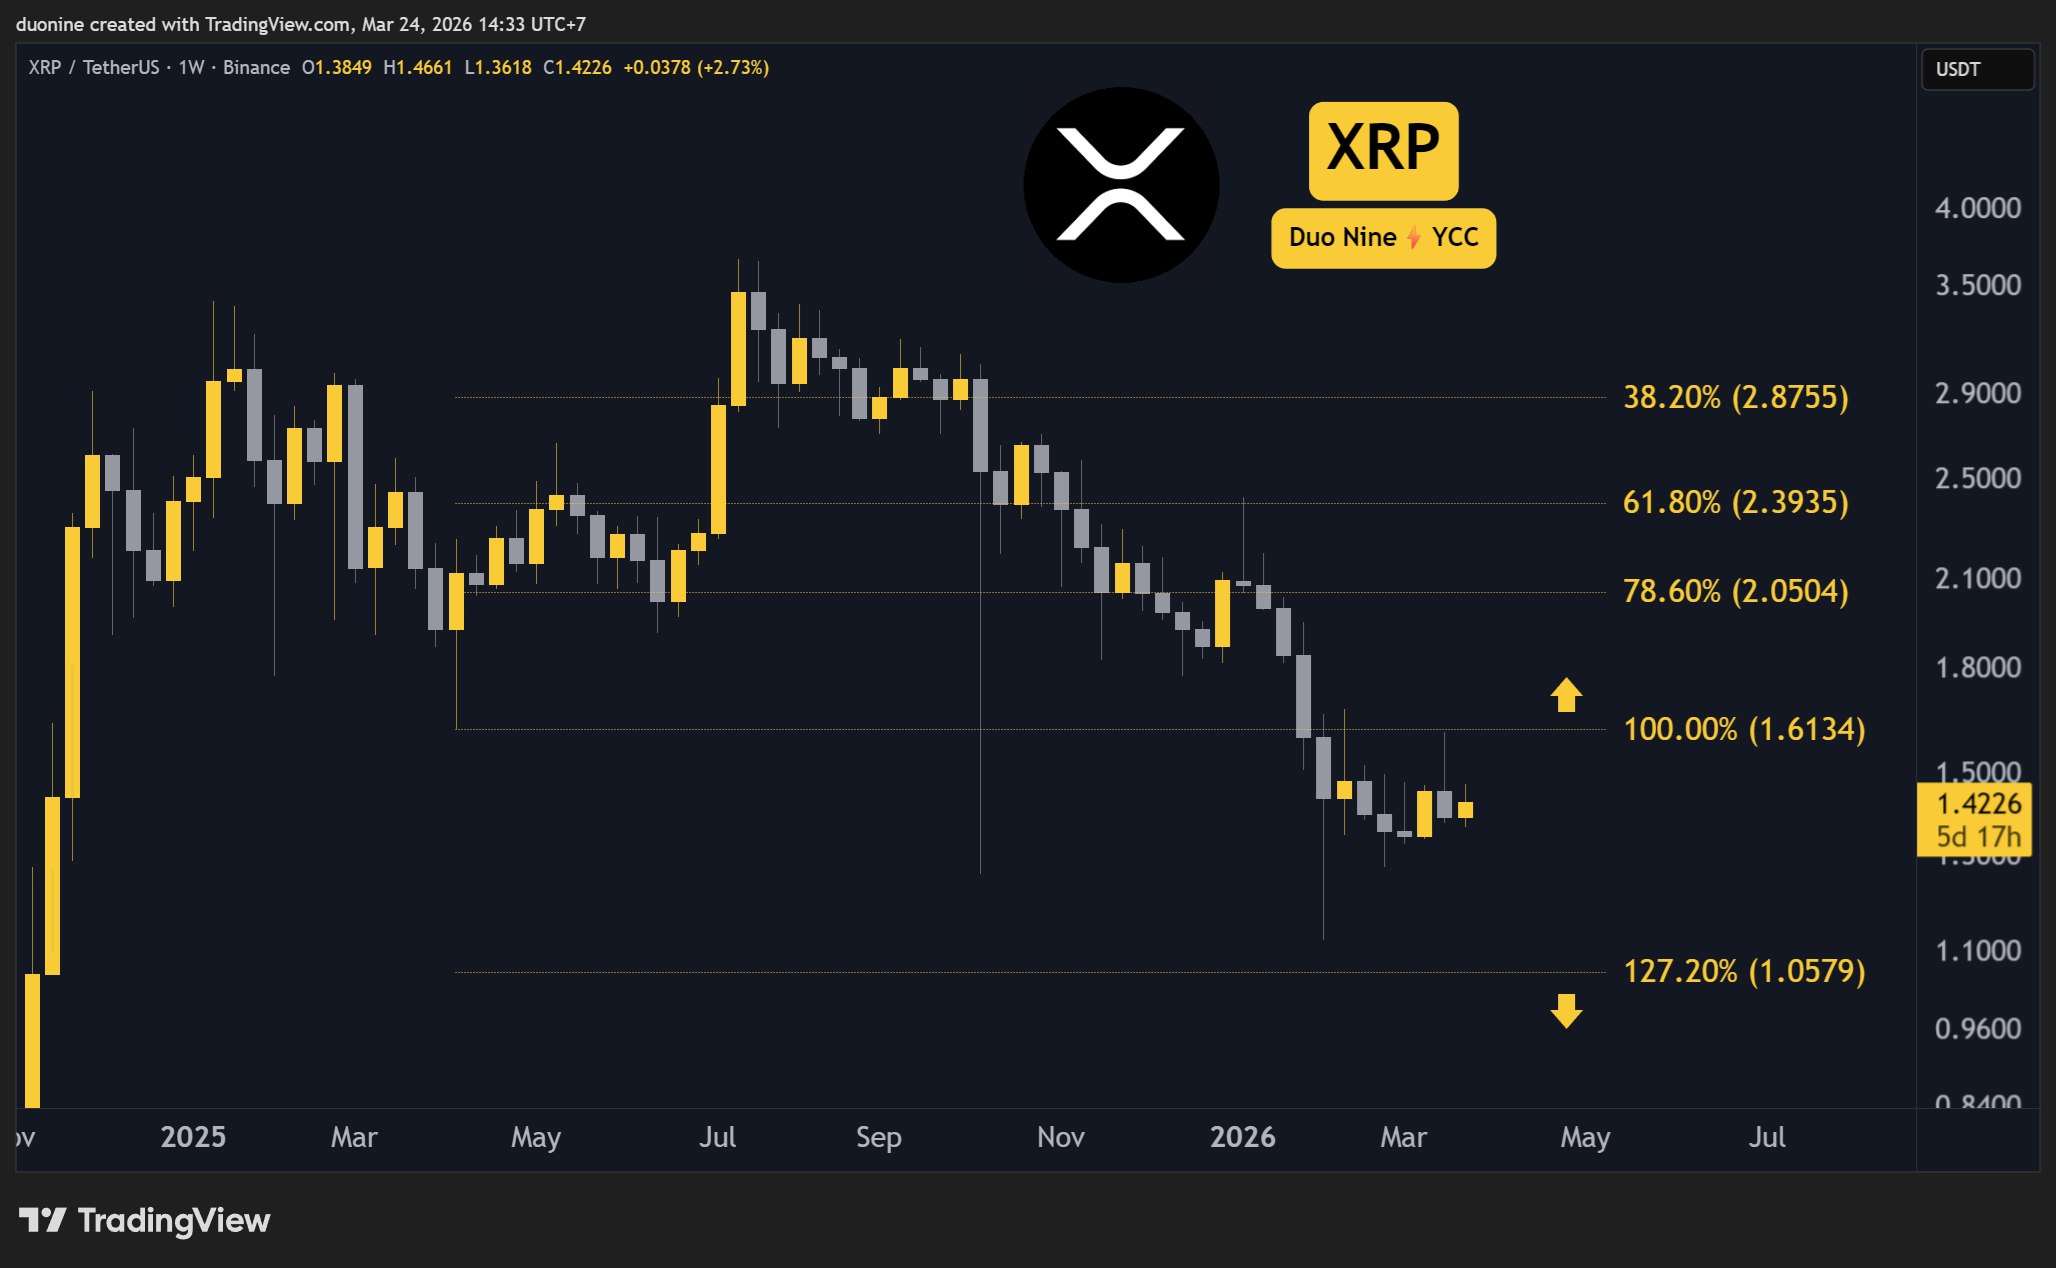
Reversal Postponed
With the resistance at $1.6 still intact, a clear reversal will require more time to materialize and will be confirmed as soon as this level breaks and turns into support. Until then, the price may continue to move sideways.
Volume is also flat, which is indicative of a low volatility period. Nevertheless, when buyers return to re-test the resistance, the volume could spike and send bulls into a new rally.

RSI Bullish Cross Imminent?
On the weekly chart, the RSI appears inches away from a bullish cross. This is an important signal that the market wants to turn bullish. Now the question is if bears will allow it, since so far, they have managed to contain any rally.
Either way, by the end of March, the price could make up its mind by attempting to break away from its current range between $1.4 and $1.6, with pressure building up right now.

The post Ripple (XRP) Price Predictions for This Week appeared first on CryptoPotato.
Bitcoin’s correlation with gold has dropped to 0.9, its lowest level in 3 years.
This is according to analyst Wise Crypto, who noted that similar readings in the past have appeared near major BTC lows, raising the possibility that the asset may be entering a recovery phase.
Correlation Breakdown
According to Wise Crypto’s data, which they shared on X on March 24, Bitcoin is stabilizing while gold is weakening, with the BTC-to-gold ratio down by around 70% from its previous high. Looking at history, the analyst pointed out that such conditions occurred right when Bitcoin stopped falling and started recovering.
There has also been a lot more accumulation by whales, adding to the argument that larger holders are positioning during the current price range.
Additionally, Wise Crypto pointed to recent geopolitical developments, which have added context to BTC’s performance relative to traditional assets.
“Add in macro + geopolitical resilience, and the case builds,” they wrote. “Bitcoin may have already bottomed.”
As we previously reported, the cryptocurrency gained 7% after the start of the U.S.-Iran conflict on February 28, while gold fell 2% and the Nasdaq 100 slipped slightly.
That relative strength came even with sharp intraday swings tied to breaking headlines. And yesterday was another example of just how these headlines affect BTC. At first, the flagship cryptocurrency went up to about $71,500 after U.S. President Donald Trump made remarks about a pause in hostilities between his country and Iran. However, Iran quickly denied the claims, sending BTC back toward $70,000 and contributing to more than $800 million in liquidations.
Meanwhile, gold sank deeper into bear market territory, shedding almost 10% last week, when it registered its weakest performance since September 2011. The poor showing has now seen it drop more than 20% from its all-time high near $5,600 recorded in January.
As Wise Crypto noted,
“If history rhymes, BTC could be gearing up to outperform gold next.”
Easing Short-Term Selling Pressure
On its part, Bitcoin was trading at $71,000 at the time of writing, having gained more than 3% in the last 24 hours. Nonetheless, it is down 5% over 7 days, although the close to 4% uptick across the past month shows the asset may be in consolidation instead of a clear downward trend.
Meanwhile, CryptoQuant contributor Amr Taha says that short-term selling pressure on Binance has dropped off, with the 7-day standard deviation of short-term holder realized profit and loss dropping to 255, a level last seen before BTC caught rebounds of 10% to 14%. For example, there was a similar reading in late February, which was followed by Bitcoin going from around $66,000 to over $75,000.
This drop in volatility suggests that there has been a slowdown in rapid selling from short-term traders, and although losses may still outweigh profits in current flows, it appears that the overall pressure is becoming less erratic, which in the past matched up with more stable price conditions.
The post Gold Crashes While Bitcoin Holds $71K: What This Rare Market Shift Means for BTC appeared first on CryptoPotato.
Cardano is showing classic bottom indicators with active wallets down 43% on their investments over the past year, and ADA dropping over 70% since September, said Santiment on Tuesday.
However, this extreme negative MVRV value (market value to realized value ratio) is generally an indicator of ADA being in an “opportunity” or “buy zone,” they added.
“In a zero-sum game, when average returns are severely negative, this is an indication of a looming turnaround with coins always averaging 0% on MVRV’s across any timeframe,” they said before adding:
“So when other traders are in severe pain, key stakeholders and professional traders are intrigued by this due to the lowered risk of buying or adding on to their positions.”
Cardano Sentiment Crushed
Adding to this pain, Cardano’s Binance funding rate is showing its highest short-to-long ratio since June 2023, meaning traders are heavily betting on further declines.
“This historically is another bottom signal,” they said, explaining that funding rates are always prone to liquidate and “send prices in the direction that traders are expecting the least.”
ADA was once a top ten crypto, but has now fallen to 13th place, below WhiteBIT Coin (WBT) and only just above Bitcoin Cash (BCH).
ADA prices have gained 2.5% over the past 24 hours to reach $0.26, but the asset is down almost 92% from its 2021 all-time high of $3.09 and failed to get anywhere near it in the 2025 crypto market peak.
Average wallets that have been active on the Cardano network over the past year are netting a return of -43% on their investments. Memes aside about the altcoin’s major -71% price decline since September, this extreme negative MVRV value is generally an indicator of $ADA being… pic.twitter.com/LzQRKhobQe
— Santiment (@santimentfeed) March 24, 2026
There was very little discussion or chatter about Cardano on crypto social media, but it is not the only altcoin in pain.
Other Altcoins in Severe Pain
Solana is down almost 70% from its memecoin-driven all-time high in January 2025, with SOL prices hovering around $90 at the time of writing.
Speaking of memecoins, Dogecoin (DOGE) was down 87% from its peak price five years ago, and Bitcoin Cash (BCH) is down a similar amount.
Chainlink (LINK), the once-touted standard for real-world asset tokenization, has not seen any momentum from this narrative, wallowing 83% down from its 2021 all-time high.
Not all altcoins were deep in bear markets, though, with Tron (TRX), Hyperliquid (HYPE), and Leo (LEO) faring much better.
The post Cardano Pain Remains High But ADA May Have Bottomed: Santiment appeared first on CryptoPotato.