Cryptocurrency Posts
Crypto Briefing
Former Kalshi employees launch 5c(c) Capital, raising $35M for a dedicated prediction market fund, focusing on industry infrastructure.
The post Kalshi and Polymarket back $35 million fund as prediction markets boom despite regulatory pressure appeared first on Crypto Briefing.
Bitmine adds $138M in ETH as Ethereum nears $2.2K and Tom Lee says crypto is emerging as a wartime store of value.
The post Bitmine adds $138M ETH as Tom Lee calls crypto a wartime store of value appeared first on Crypto Briefing.
Crypto's resilience amid geopolitical uncertainty highlights market's speculative nature, with potential volatility driven by sentiment shifts.
The post Crypto surges on Iran de-escalation hopes, but conflicting reports add uncertainty appeared first on Crypto Briefing.
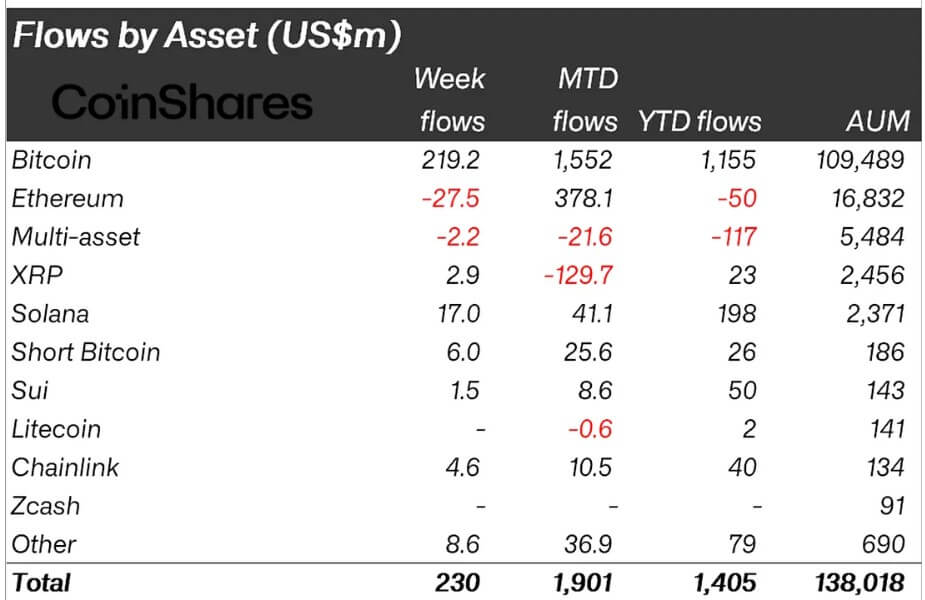
Institutional investors are gravitating towards Bitcoin as a safe haven amid Fed-induced market caution, impacting altcoin dynamics.
The post Bitcoin sees $219M in inflows as digital asset products gain $230M in a cautious week appeared first on Crypto Briefing.
Polymarket's enhanced integrity rules could boost trust and attract institutional investors, but risk alienating crypto-native users.
The post Polymarket publishes enhanced market integrity rules for DeFi platform and US exchange appeared first on Crypto Briefing.
Bitcoin Magazine
Bitcoin Magazine

Capital B Acquires 44 Bitcoin, Boosting Holdings to 2,888 Coins
Capital B, Europe’s first Bitcoin Treasury Company, has completed the acquisition of 44 bitcoin for €2.7 million, bringing its total holdings to 2,888 BTC.
The purchases were executed as part of the company’s ongoing Bitcoin Treasury Company strategy, which aims to increase the number of bitcoin per fully diluted share over time, according to a company press release seen by Bitcoin Magazine.
The company also finalized multiple capital raising operations. An “ATM-type” capital increase with TOBAM generated €0.5 million through the issuance of 669,906 new shares at €0.76 per share.
Additionally, €3 million was raised via share subscription warrants, with €2 million subscribed by TOBAM and €1 million by UTXO Management.
These operations funded the latest BTC acquisition and supported the company’s broader treasury strategy.
Capital B reported a year-to-date (YTD) BTC Yield of 0.72%, equivalent to a gain of 20.4 BTC and €1.2 million. The company also achieved a quarterly BTC Yield of 0.72%, highlighting the incremental growth of its bitcoin holdings relative to fully diluted shares. The average acquisition cost of its BTC portfolio stands at €92,495 per coin, representing a total investment of €267.1 million.
Swissquote Bank Europe SA, a Luxembourg-registered virtual asset service provider (VASP), executed the bitcoin acquisition and provided secure custody through Taurus technology. The company maintains an additional 60 BTC for operational needs, separate from its treasury holdings.
Capital B is listed on Euronext Growth Paris and specializes in data intelligence, artificial intelligence, decentralized technology consulting and development, and corporate treasury.
Bitcoin surges
Bitcoin surged to $71,000 on Monday, rebounding from weekend lows near $67,000, following a sudden easing of geopolitical tensions after Donald Trump announced a five-day pause on planned U.S. strikes against Iran.
The pause came after what Trump described as “very good” and “productive” talks with Tehran, reversing the market’s defensive posture from prior threats to target Iranian energy infrastructure.
Amid this backdrop, Strategy continued its corporate bitcoin accumulation, albeit at a slower pace. Between March 16 and March 22, the company acquired 1,031 BTC for $76.6 million at an average price of $74,326 per coin, funded through common stock sales. This contrasts with the prior two weeks, when Strategy deployed over $1 billion into bitcoin via equity and preferred share offerings, signaling a more measured approach.
Strategy now holds 762,099 BTC, purchased for approximately $57.7 billion at an average cost of $75,694 per coin.
Disclaimer: Bitcoin Magazine is owned by Nakamoto Inc. (NASDAQ: NAKA). Nakamoto Inc. also owns UTXO Management.
This post Capital B Acquires 44 Bitcoin, Boosting Holdings to 2,888 Coins first appeared on Bitcoin Magazine and is written by Micah Zimmerman.
Bitcoin Magazine

Saylor’s Strategy (MSTR) Arms Itself With $44.1 Billion ATM Capacity to Fuel Bitcoin Treasury Expansion
Strategy has moved to sharply expand its capacity to raise capital through at‑the‑market equity and preferred offerings, adding new Wall Street agents and reshaping its preferred stock authorization to favor a key floating‑rate series.
The steps, disclosed in a March 23 Form 8‑K, give the company scope to sell up to an additional $44.1 billion in securities on top of large existing programs.
In the filing, Strategy said it entered joint agreements with Moelis & Company LLC, A.G.P./Alliance Global Partners, and StoneX Financial Inc., adding them as sales agents under its Omnibus Sales Agreement dated November 4, 2025.
That agreement already named TD Securities (USA), The Benchmark Company, Barclays Capital, BTIG, Canaccord Genuity, Cantor Fitzgerald, Clear Street, Compass Point, H.C. Wainwright, Keefe Bruyette & Woods, Maxim Group, Mizuho Securities USA, Morgan Stanley, Santander US Capital Markets, SG Americas Securities, and TCBI Securities doing business as Texas Capital Securities as agents.
Under the joinders, each of Moelis, Alliance, and StoneX becomes an agent on the same contractual footing as the original banks, with the right and obligation to place Strategy’s securities in at‑the‑market, or “ATM,” transactions.
JUST IN: Michael Saylor’s Strategy announces new $42 billion plan to buy more Bitcoin
— Bitcoin Magazine (@BitcoinMagazine) March 23, 2026pic.twitter.com/w2WA2YIzHl
Strategy’s new ATM programs and size
Alongside the added agents, Strategy and the syndicate executed three “Additional Program Addenda” that establish new ATM programs for its Class A common stock (ticker MSTR), its Variable Rate Series A Perpetual Stretch Preferred Stock (STRC), and its 8.00% Series A Perpetual Strike Preferred Stock (STRK).
These addenda operate under Section 8(i) of the Omnibus Sales Agreement and are structured so they do not cancel or limit rights under the underlying framework.
The company then filed new prospectus supplement annexes under its automatic shelf registration statement, which became effective on January 27, 2025.
Those annexes authorize at‑the‑market offerings of:
- Up to $21.0 billion of new Class A common stock (the “New Common ATM Shares”).
- Up to $21.0 billion of new STRC preferred shares (the “New STRC ATM Shares”).
- Up to $2.1 billion of new STRK preferred shares (the “New STRK ATM Shares”).
In other words, Strategy has established new ATM programs to sell up to $21 billion of common stock, $21 billion of STRC preferred, and $2.1 billion of STRK preferred shares.
These programs supplement existing authorizations, with the old STRK program replaced by the new $2.1 billion offering.
These new capacities sit alongside existing shelf authorizations. Strategy had previously registered the sale of about $15.85 billion of common stock and $4.2 billion of STRC preferred under prior annexes and the base prospectus, and it intends to keep using those prior prospectuses until those capacities are fully sold.
In contrast, the company terminated its prior STRK preferred ATM program effective March 22, 2026, and the new $2.1 billion STRK annex replaces that earlier effort.
Strategic tilt in preferred structure
To support this mix of funding options, Strategy also amended its charter with two targeted preferred stock actions. A Certificate of Increase raised authorized shares of STRC preferred from 70,435,353 to 282,556,565, more than tripling the pool available for issuance. A separate Certificate of Decrease reduced authorized STRK preferred shares from 269,800,000 to 40,270,744.
Both certificates were adopted by the board’s Pricing and Financing Committee under authority granted in the company’s Second Restated Certificate of Incorporation and Section 151(g) of the Delaware General Corporation Law.
Strategy also said they secured legal opinions confirming that its new ATM shares — both common and preferred — will be validly issued, fully paid, and non-assessable.
The 8‑K clarifies that no offers or sales are happening yet, and any actual issuances will depend on market conditions, investor demand, and internal decisions.
Overall, the expanded ATM programs and reallocated preferred shares give Strategy flexibility to raise capital while prioritizing floating‑rate preferred issuance over the 8.00% STRK series.
This post Saylor’s Strategy (MSTR) Arms Itself With $44.1 Billion ATM Capacity to Fuel Bitcoin Treasury Expansion first appeared on Bitcoin Magazine and is written by Micah Zimmerman.
Bitcoin Magazine

H100 Eyes Strategic Bitcoin Acquisition to Triple its BTC Holdings and Expand Institutional Scale
H100 Group AB (H100), the Stockholm-based publicly listed bitcoin treasury company, announced a letter of intent (LOI) to acquire Norwegian bitcoin-focused firms Moonshot AS and Never Say Die AS.
The move, if completed, would roughly triple H100’s holdings to around 3,500 BTC, positioning the company among Europe’s largest listed bitcoin treasury firms and enhancing its institutional profile, according to a press release seen by Bitcoin Magazine.
Currently holding 1,051 BTC, the company would add the target companies’ combined 2,450 BTC through the transaction.
The acquisition is structured as a bitcoin-for-bitcoin exchange, meaning ownership in the combined entity will be determined solely by the number of BTC contributed.
This preserves the existing shareholders’ exposure per share while significantly expanding the company’s balance sheet. The deal is set up as an all-share transaction with no cash consideration, consistent with H100’s strategy of bitcoin-based mergers and acquisitions.
The move comes on the heels of H100’s January announcement regarding its combination with Switzerland-based Future Holdings AG, also a bitcoin treasury company, highlighting the firm’s ongoing effort to consolidate institutional-scale bitcoin holdings in Europe.
H100’s backing
Both acquisitions have backing from Adam Back, the British cryptographer and co-founder of Blockstream, reinforcing the network of experienced bitcoin investors involved in the transactions.
Chairman Sander Andersen emphasized the industrial rationale for the deal, citing scale, credibility, and access to capital markets as increasingly important for publicly listed bitcoin firms.
“This transaction would significantly strengthen H100 in all these areas,” Andersen said, noting that the acquisition aligns with H100’s ongoing capital markets and M&A strategy while leaving its listing structure and core operations unchanged.
The target companies bring more than just bitcoin holdings. Moonshot AS and Never Say Die AS are led by seasoned professionals including CEO Eirik Grøttum, a former systematic trader and asset manager, and CIO Peter Warren, a hedge fund veteran with extensive experience across equities, derivatives, and FX markets.
Together with founder Geir Harald Hansen, the pioneer behind the Bitminter BTC mining pool, the Norwegian teams bring operational expertise and technology capabilities expected to complement H100’s treasury management and capital markets activities.
Following completion, the company will remain the listed parent company. Management and board positions are expected to include representatives from both H100 and the acquired firms, ensuring continuity of existing leadership while integrating new expertise.
Current executives, including Andersen and CEO Johannes Wiik, will continue in central roles. Definitive agreements are targeted by April 22, 2026, with completion expected shortly after H100’s annual general meeting on May 21, subject to regulatory approvals and customary conditions.
The company continues to operate its health technology business alongside its bitcoin treasury strategy, combining digital health tools and AI-powered solutions for providers of health and lifestyle services.
The firm said its core business model and listing structure will remain unchanged even as it pursues aggressive growth in bitcoin holdings.
This post H100 Eyes Strategic Bitcoin Acquisition to Triple its BTC Holdings and Expand Institutional Scale first appeared on Bitcoin Magazine and is written by Micah Zimmerman.
Bitcoin Magazine

Bitcoin Price Rockets to $71,000 as Trump Orders Pause on Iran Strikes
Bitcoin price surged to $71,000 on Monday, rebounding from weekend lows near $67,000, as markets reacted to a sudden shift in geopolitical risk after Donald Trump announced a pause on planned U.S. strikes against Iran.
The move, which followed what Trump described as “very good” and “productive” talks with Tehran, triggered a broad relief rally across risk assets.
Bitcoin price rose roughly 5% into the start of the week, reclaiming key technical levels that traders had identified as critical to maintaining bullish momentum.
The announcement marked a sharp reversal from escalating rhetoric over the weekend, when Washington had threatened strikes on Iranian energy infrastructure if shipping lanes through the Strait of Hormuz were not fully reopened. That ultimatum had pushed global markets into a defensive posture, with oil spiking and equities sliding.
Instead, Trump said via social media that the U.S. would delay any military action for five days, citing ongoing discussions and the possibility of a broader de-escalation. “Very good talks” had taken place over the past 48 hours, he said, raising hopes for an end to hostilities that have destabilized the region for weeks.
Iran’s response cast doubt on that narrative. Officials in Tehran denied that any direct dialogue had occurred, describing Trump’s statement as a tactic aimed at lowering energy prices and buying time for potential military planning.
The country has previously warned it would retaliate against energy infrastructure across the Middle East if attacked.
JUST IN: Bitcoin pumps above $71,000 following President Trump’s announcement of potentially ending the war with Iran
— Bitcoin Magazine (@BitcoinMagazine) March 23, 2026
Bitcoin price and broader markets respond
Despite the conflicting accounts, markets focused on the immediate implication: a pause in escalation.
Oil prices dropped sharply on the news, reversing gains tied to fears of supply disruption. Hundreds of vessels remain stranded around the Strait of Hormuz, a chokepoint that handles a significant share of global energy flows, though some tankers have begun cautiously transiting the corridor.
The reopening of the waterway remains a central condition for any sustained de-escalation.
The prospect of strikes on power plants had represented a potential inflection point in the conflict. Targeting electricity infrastructure could trigger cascading humanitarian and economic consequences, particularly in Gulf states reliant on desalination and cooling systems. Iranian threats to expand retaliation to similar targets across the region heightened those concerns, raising the risk of a wider war.
That scenario now appears temporarily delayed, though far from resolved.
On the ground, military activity continues. Israeli forces have expanded operations in both Iran and southern Lebanon, targeting infrastructure and supply routes tied to Hezbollah.
Meanwhile, nuclear safety concerns have resurfaced after reports of military activity near Iran’s Bushehr facility prompted discussions between international and Russian officials. The International Atomic Energy Agency reiterated warnings against any action that could compromise nuclear plant safety.
Gold crashes while Bitcoin price stays strong
Against this backdrop, Bitcoin price reflects a market recalibrating its view of geopolitical risk.
The asset had shown resilience throughout the conflict, holding a firm floor near $66,000 even as traditional safe havens faltered.
Gold, which typically benefits from geopolitical stress, has declined in recent sessions, while equities faced sustained pressure from rising yields and energy volatility.
Bitcoin price’s response to the latest developments reinforces a shifting narrative. Rather than trading purely as a risk asset, it has begun to absorb flows during periods of macro uncertainty, particularly when confidence in traditional hedges weakens.
For now, it seems like the market hinges on a five-day window with peace talks to continue this coming week.
Elsewhere, Strategy added 1,031 bitcoin for $76.6 million last week, slowing its recent aggressive accumulation despite holding one of the largest corporate bitcoin positions.
At the time of writing, the bitcoin price is slightly shy of $71,000.

This post Bitcoin Price Rockets to $71,000 as Trump Orders Pause on Iran Strikes first appeared on Bitcoin Magazine and is written by Micah Zimmerman.
Bitcoin Magazine

Strategy (MSTR) Buys $76.6 Million in Bitcoin, Slowing Recent Accumulation Pace
Strategy made a smaller-scale bitcoin purchase last week, adding to a balance sheet that has grown into one of the largest corporate holdings of the asset, even as market conditions shift and the firm sits on a sizable unrealized loss.
Led by executive chairman Michael Saylor, Strategy disclosed that it acquired 1,031 bitcoin for $76.6 million between March 16 and March 22, according to a regulatory filing. The purchases were made at an average price of $74,326 per coin and funded through the sale of common stock.
The pace marks a sharp slowdown from the prior two weeks, when the company deployed more than $1 billion into bitcoin through a mix of equity issuance and preferred share offerings. The shift suggests a more measured approach after a period of aggressive accumulation tied to capital market activity.
Strategy now holds 762,099 BTC, acquired for roughly $57.7 billion at an average cost of $75,694 per coin.
With Bitcoin trading near $71,000, the position carries an unrealized loss estimated at several billion dollars. The gap between cost basis and market price underscores the firm’s continued exposure to bitcoin’s price swings, even as it maintains a long-term accumulation strategy.
Saylor signaled the purchase ahead of the official announcement, posting an update to the company’s bitcoin acquisition tracker with the message “The Orange March Continues.” The firm has already acquired 43,346 BTC this month for roughly $3.05 billion.
JUST IN: Michael Saylor's Strategy purchased 1,031 bitcoin for $76.6 million
— Bitcoin Magazine (@BitcoinMagazine) March 23, 2026
Strategy is racking in bitcoin
The company’s approach has centered on raising capital through equity markets and redirecting proceeds into bitcoin, a model that has drawn both support and scrutiny.
Supporters view the strategy as a levered bet on bitcoin’s long-term appreciation, while critics point to dilution risk and balance sheet concentration.
Last week’s purchases were funded entirely through at-the-market sales of Class A shares. Strategy sold more than 500,000 shares to finance the latest acquisition and still retains billions of dollars in remaining capacity under its issuance program.
In contrast, there was no issuance tied to its preferred stock offerings during the period, a departure from recent weeks when those instruments played a larger role.
Market conditions may also be shaping the firm’s cadence. Bitcoin has traded in a narrow range in recent sessions, reflecting a mix of macro pressure and cautious sentiment. Price action has remained below Strategy’s average acquisition cost, limiting the immediate impact of continued buying on its balance sheet.
At the same time, broader risk markets showed signs of stabilization. U.S. equities moved higher in premarket trading, and Strategy’s shares edged up alongside bitcoin’s rebound toward the $70,000 level.
The move followed a pause in geopolitical escalation after the Trump administration delayed potential strikes tied to tensions in the Middle East, easing pressure on energy markets and risk assets.
At the time of writing, Bitcoin is trading slightly shy of $71,000 and MSTR is trading near $139 a share.
 Buys $76.6 Million in Bitcoin, Slowing Recent Accumulation Pace 2")
This post Strategy (MSTR) Buys $76.6 Million in Bitcoin, Slowing Recent Accumulation Pace first appeared on Bitcoin Magazine and is written by Micah Zimmerman.
CryptoSlate
Gold has fallen into bear-market territory after giving up its gains for the year, even as US spot Bitcoin exchange-traded funds (ETFs) continued to attract fresh money, pushing the two assets onto sharply different paths.
Spot gold traded near $4,388 an ounce on March 23, according to goldprice.org, down about 22% from its Jan. 29 record of $5,594.82. The decline accelerated after the latest Middle East conflict began on Feb. 28. Since then, gold has dropped about 17%, reversing the advance that had carried it higher in the opening weeks of 2026.
At the same time, institutional money continued to flow into the US spot Bitcoin ETF market. Data from Farside Investors show the funds took in about $2.42 billion of net inflows across the four calendar weeks ended March 20.
The divergence has drawn attention across macro and digital-asset markets because gold and Bitcoin are often discussed in similar terms during periods shaped by inflation concerns, currency dilution, and geopolitical stress.
Over the past month, however, investors treated them very differently. Gold faced liquidation pressure as cash demand rose and rate expectations stayed elevated. Bitcoin, through the ETF structure, continued to draw allocations through brokerage and advisory channels.
The move also stands out because gold had entered 2026 with strong momentum. Its retreat now meets the widely used market definition of a bear market: a decline of 20% or more from a recent peak. Bitcoin, by contrast, has held up well enough to keep ETF buyers engaged through the same stretch of volatility.
Gold gives back early-year gains as rates stay high and investors raise cash
Gold’s decline has unfolded against a macro backdrop that has become less supportive for assets that tend to benefit from lower yields and a softer dollar.
The Federal Reserve held interest rates steady in March and projected the benchmark rate at 3.4% at the end of 2026, while core personal consumption expenditures inflation remained at 2.7%. That combination reinforced the view that policy may stay restrictive longer than investors expected earlier this year.
For bullion, the effect is direct. Higher rates raise the opportunity cost of holding a non-yielding asset. A firmer dollar adds pressure by making gold more expensive for buyers using other currencies.
Those forces intensified as investors also sought cash and liquidity after the Middle East shock forced a repricing of growth, inflation, and energy expectations.
Fund-flow data captured the shift quickly. LSEG Lipper data showed global gold and precious-metals funds posted about $5.19 billion in weekly net outflows through March 18, the largest weekly withdrawal since at least August 2018. In the same week, money market funds took in $32.57 billion.
That rotation suggests investors moved toward liquidity and away from positions that had benefited from earlier inflation and geopolitical hedging demand.
Gold’s decline, therefore, fits into a broader portfolio adjustment in which preserving flexibility became more important as markets reassessed the likely path of monetary policy and commodity prices.
The selloff also arrived after a period in which gold’s long-term support looked firm. Central-bank demand had helped underpin the bullion market through 2025, and the reserve case remained intact as 2026 began.
The recent drop shows how forcefully short-term macro conditions can overwhelm that structural support over a matter of weeks.
Additional fund data point in the same direction. The largest US gold-backed ETF, SPDR Gold Shares (GLD), recorded $7.07 billion in outflows in March, according to market data.
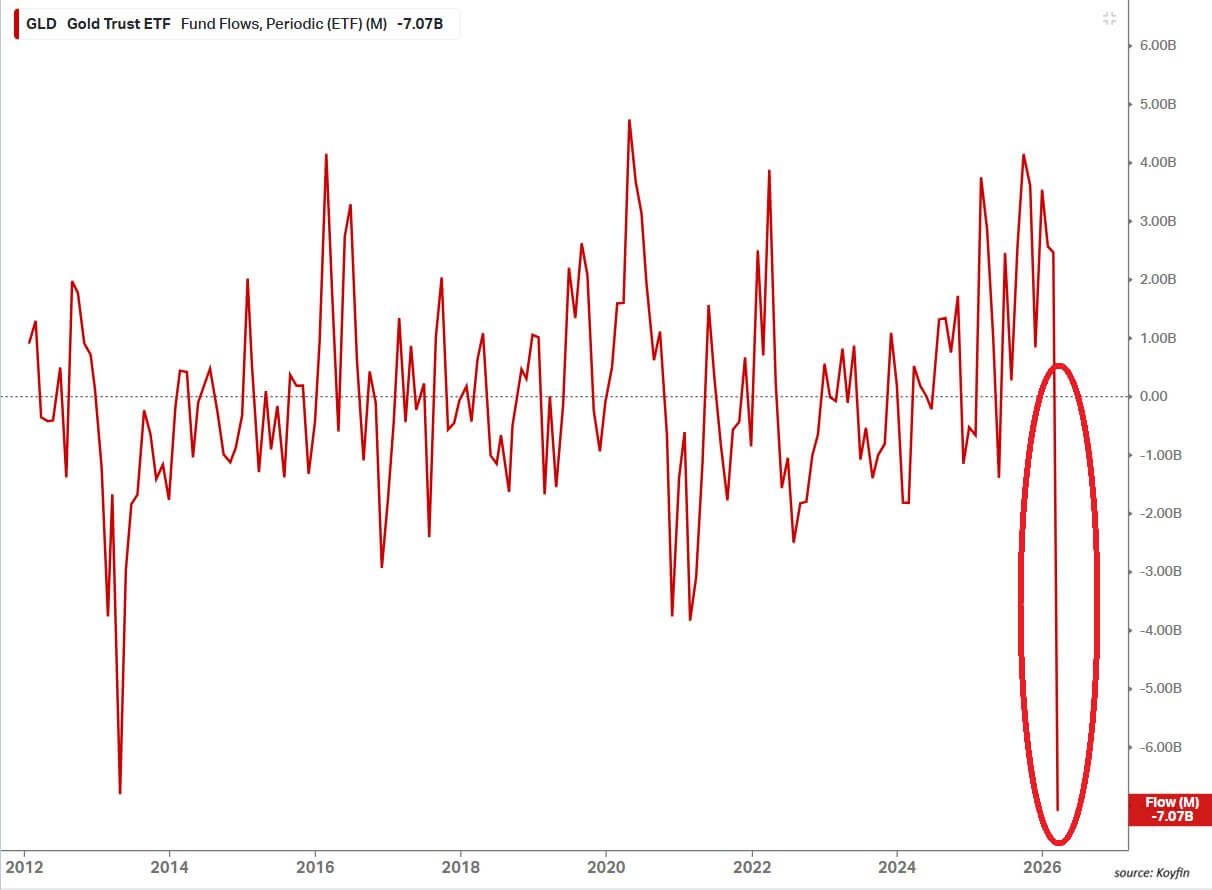
That exceeded the previous monthly record withdrawal of $6.8 billion in April 2013. The pace of redemption reflected the speed of the reversal in investor positioning after gold’s run higher earlier in the year.
By the standard used in financial markets, a 22% decline from a January peak marks a clear transition into bear-market territory.
Gold’s drop, therefore, represents more than a routine pullback after a rally. It signals a broad withdrawal from a trade that had been supported by reserve accumulation, geopolitical hedging, and concern over inflation persistence.
Bitcoin funds extend their strongest inflow streak of 2026
While gold was losing ground, US spot Bitcoin exchange-traded funds posted their strongest inflow streak this year.
Farside data show the 12 US spot Bitcoin funds recorded four consecutive weeks of net inflows, with more than $2 billion added during that period. It is the longest run of 2026 and the strongest since August and September 2025, when the funds absorbed more than $3.8 billion.
CoinShares data show a similar trend globally. The firm said Bitcoin exchange-traded products have registered $1.5 billion in inflows so far this month.
Those inflows came during a period that included war risk, shifting expectations for US interest rates, and renewed volatility across commodities. Even in that backdrop, institutions continued to use the ETF wrapper to add or maintain Bitcoin exposure, while gold funds were experiencing large redemptions.
Last week, Bitwise said Bitcoin and other major cryptoassets have outperformed US equities and gold since the beginning of March.
The asset manager said the move could point to the early stages of a rotation, while also cautioning that recent price action may reflect temporary volatility or isolated liquidity events. Bitwise added that gold has historically led Bitcoin by four to seven months.
State Street Global Advisors outlined the volatility gap in its March gold monitor. Over a trailing 10-year period, rolling 30-day volatility for Bitcoin averaged about 52.0, compared with 13.6 for gold.
From January 2016 through February 2026, Bitcoin recorded 30 months with losses greater than 8%, while gold recorded one such month, according to the report.
Those figures show the type of exposure investors were taking through Bitcoin ETFs. Buyers were accepting wider swings and deeper drawdowns in return for access to an asset some investors view as a hedge against fiat dilution and policy risk.
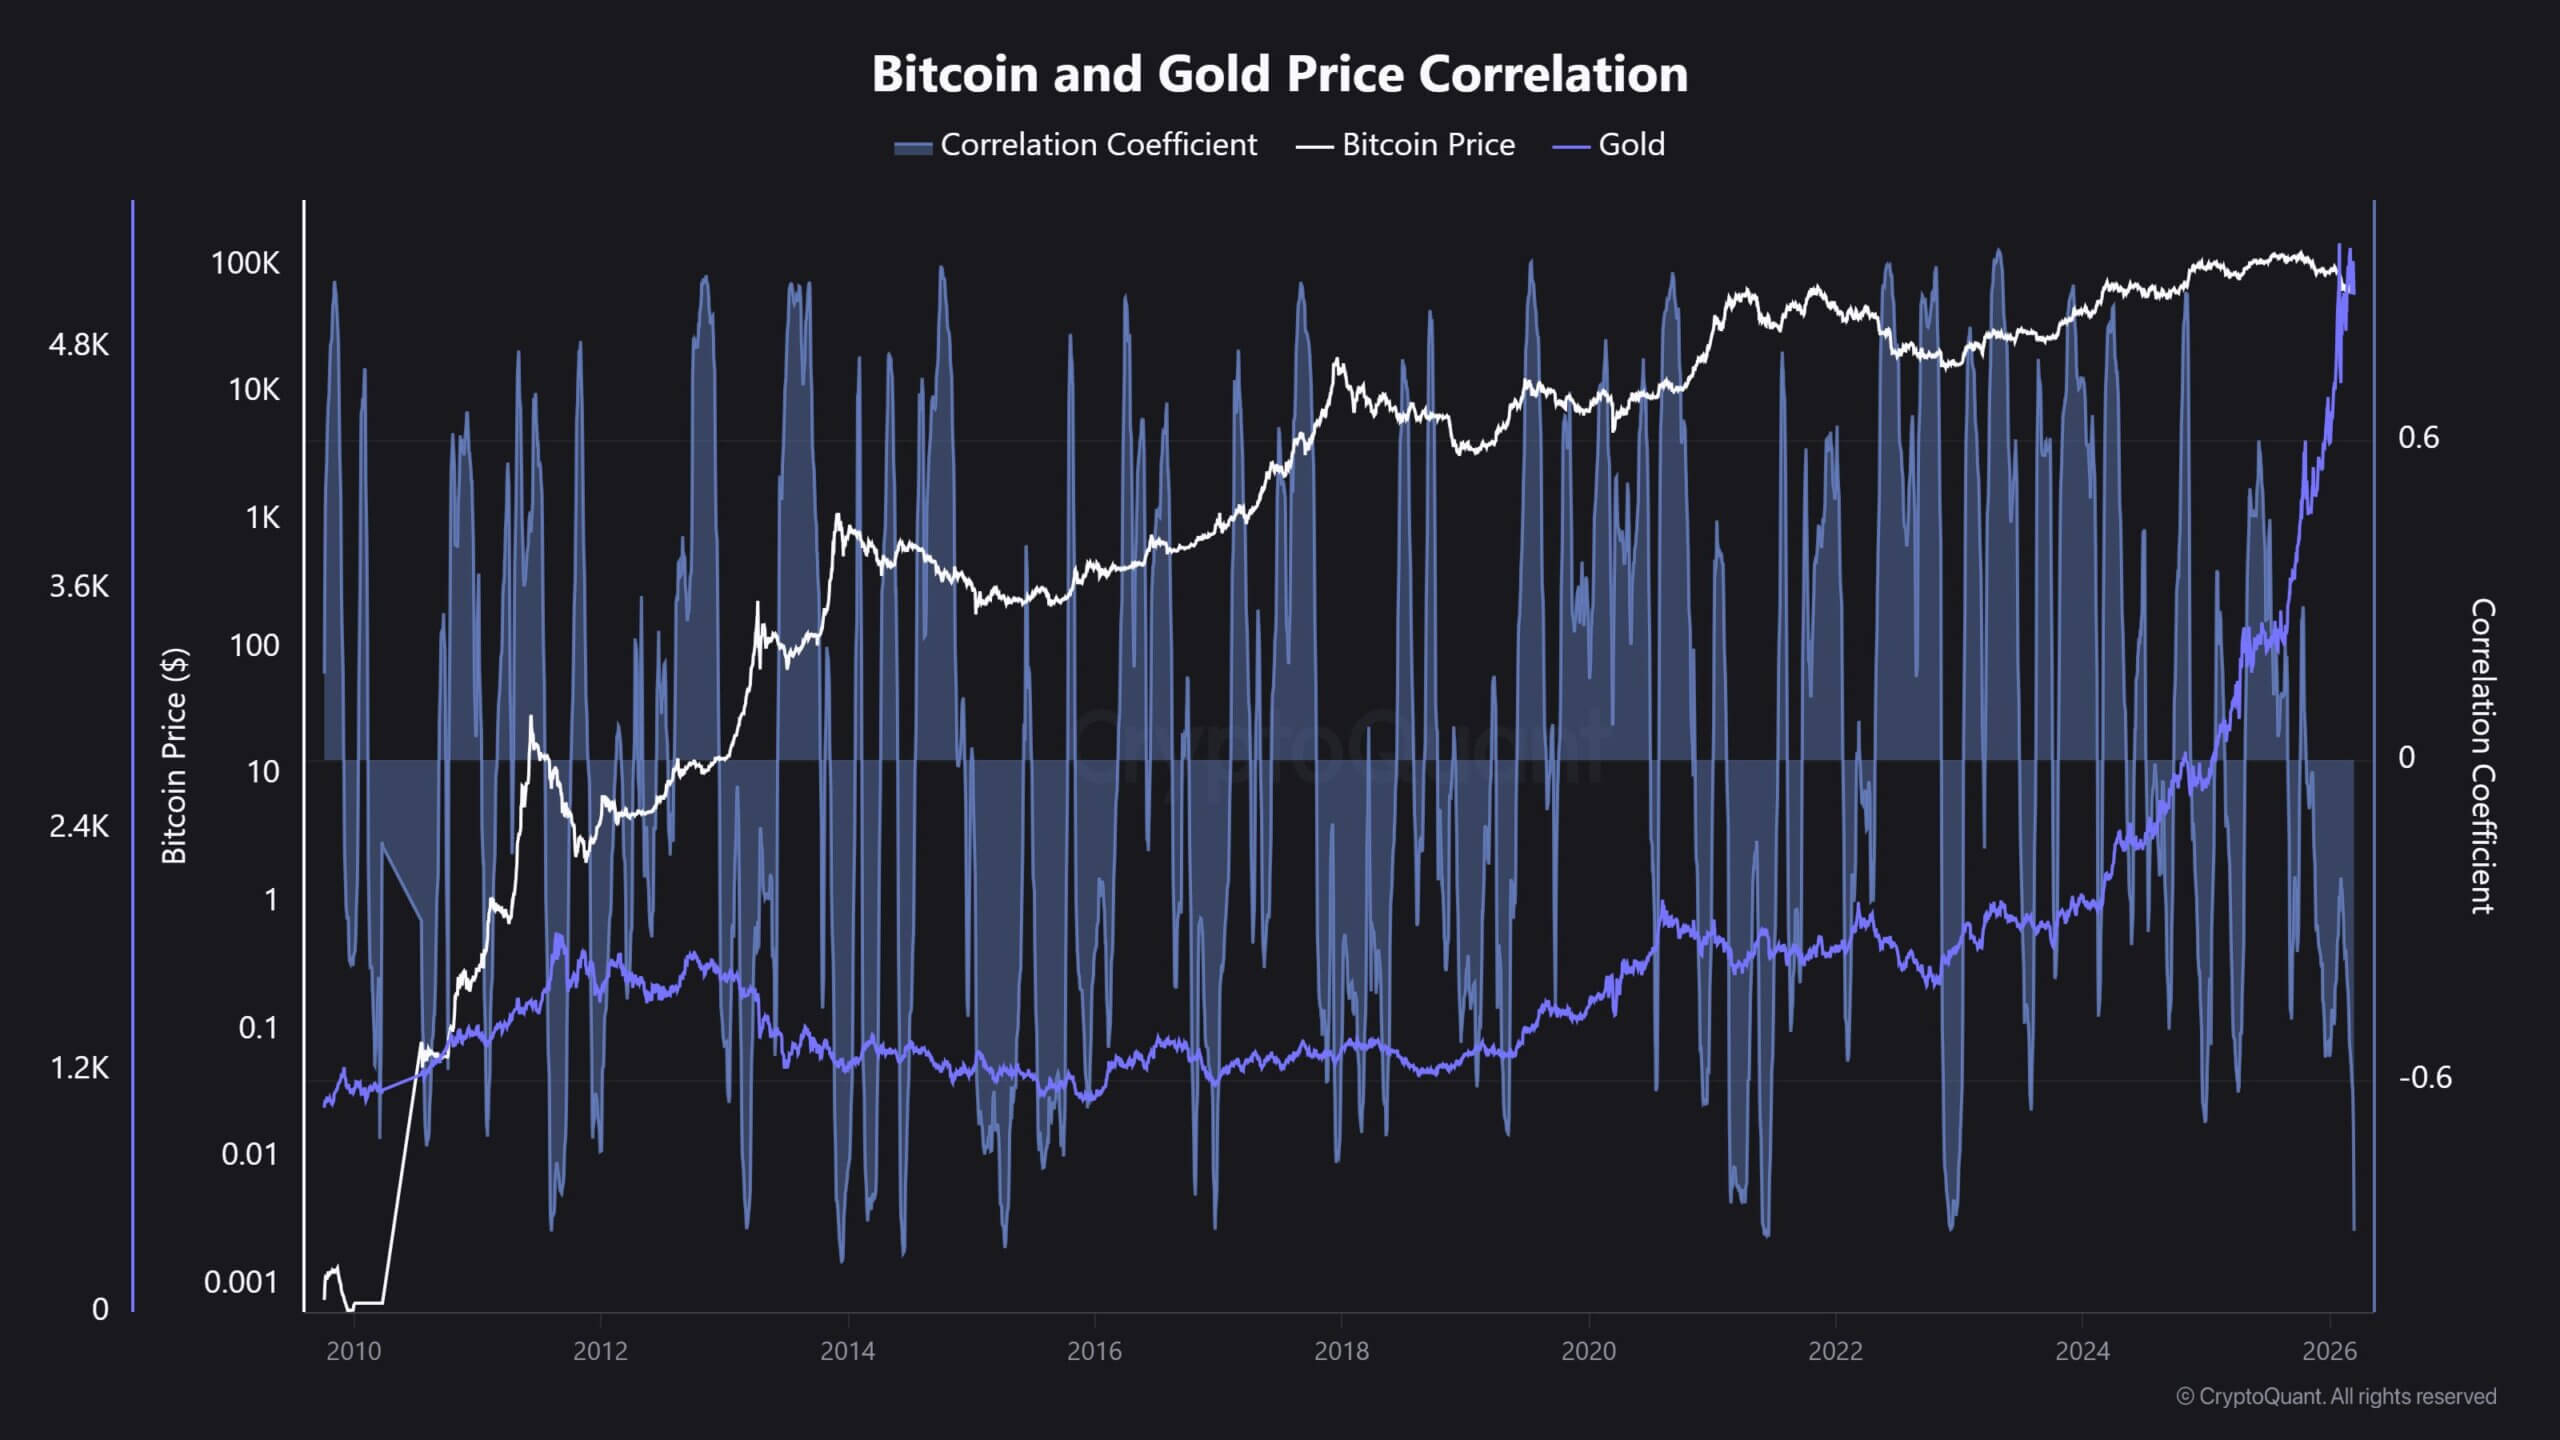
CryptoQuant data also show how far the two assets have diverged. The firm said Bitcoin-to-gold correlation fell to minus 0.88, the lowest reading since November 2022, indicating the two assets were moving in opposite directions with unusual force over the measured period.
Oil and rates may shape the next phase
Gold’s longer-term support has not disappeared, even after the March selloff, and that is part of what makes the current split between gold and Bitcoin more closely watched.
The World Gold Council said total gold demand, including over-the-counter activity, exceeded 5,000 metric tons for the first time in 2025. Gold ETF holdings rose by 801 tons last year, and central banks bought 863 tons. In February 2026 alone, physically backed gold ETFs took in $5.3 billion globally.
Those figures show official-sector buying and long-duration investment demand remained strong heading into this quarter.
The current drawdown, therefore, leaves investors balancing two forces: short-term macro pressure from rates, dollar strength, and liquidity demand, and a structural reserve bid that remained in place through last year and into early 2026.
Oil prices may play a central role in how that balance develops. Several banks raised their 2026 Brent forecasts after the latest Middle East shock. Bank of America lifted its view to $77.50 a barrel, while Standard Chartered raised its forecast to $85.50. Bank of America also outlined an upside path toward $130 in the event of a prolonged supply disruption.
Higher oil prices would feed inflation expectations and could keep the Federal Reserve cautious for longer. That would affect gold and Bitcoin through different channels.
Gold would continue to face pressure from elevated real yields and dollar strength if policy remains restrictive. Bitcoin would remain tied more closely to liquidity conditions, institutional risk appetite, and the willingness of ETF buyers to keep adding exposure through regulated products.
For now, the clearest market signal is the split itself. Gold, long treated as a traditional store-of-value asset during periods of stress, has entered a bear market after falling more than 20% from its January high. Bitcoin, an asset more commonly associated with larger price swings, has continued to gather ETF inflows through the same period.
The post Why investors are pulling back from gold and still buying Bitcoin appeared first on CryptoSlate.
Playnance’s G Coin has moved past the one million holder mark, with the project’s public tracker currently showing 1,155,141 holders.
The milestone follows CryptoSlate’s March 18 coverage, which cited 203,732 holders ahead of the token’s broader market debut, and later launch-week reporting that referenced a 623,272-holder tracker reading. Using those figures, G Coin’s holder base appears about 5.7x larger than the March 18 count and roughly 85% above the later 623,272 reading.
From presale traction to post-launch acceleration
The pace of growth fits the sequence CryptoSlate has tracked over the past week. Ahead of the March 18 Token Generation Event, company materials and CryptoSlate coverage described G Coin as coming to market with more than 200,000 holders and around 13 billion tokens distributed during presale.
On March 16, Playnance also launched GCOIN staking on PlayW3 and said more than 250 million tokens were locked within hours.
MEXC listing and staking added the next signals
Momentum continued after G Coin/USDT went live on MEXC on March 19. CryptoSlate reported that more than 1 billion GCOIN had already been locked in staking shortly after trading opened, while a later launch-week article cited 3.202 billion locked tokens and 623,272 holders from tracker-based reporting.
Those milestones put exchange access, staking participation, and holder distribution on public display at the same time.
Why the one-million-holder mark matters
Holder count is not a perfect proxy for durable adoption, but it is one of the clearest public indicators available in a token’s first stretch of open trading.
In Playnance’s documentation, G Coin is positioned as the utility layer for gameplay interactions and fees, rewards and incentives, partner revenue distribution, and treasury flows across the company’s ecosystem. The same docs describe PlayBlock as a Layer-3 execution layer built for high-frequency applications, with gasless execution, deterministic settlement, transparent on-chain accounting, and sub-second finality.
A utility narrative now faces a market test
Playnance’s white paper frames G Coin as a utility token rather than a claim on profits. It says the token is designed for gameplay, loyalty benefits, missions, and other engagement-based functions; that it does not confer ownership, governance, dividends, or claims on company assets; and that total supply is fixed at 77 billion tokens.
Crossing one million holders gives Playnance a strong launch-week headline. The bigger question now is whether holder growth, staking participation, and broader ecosystem activity continue moving together after the initial listing window. For now, the public tracker and the project’s recent launch timeline suggest G Coin has moved from presale distribution into a broader public-market phase unusually quickly.
Disclaimer: This was a sponsored post brought to you by Playnance.
The post Playnance’s G Coin surpasses 1 million holders as launch-week momentum accelerates appeared first on CryptoSlate.
Bitcoin’s jump back above $70,000 on Monday morning came with unusual clarity.
The move started when Donald Trump posted on Truth Social that the United States and Iran had held “very good and productive conversations” on a “complete and total resolution” of hostilities in the Middle East, and that planned strikes on Iranian power plants and energy infrastructure would be delayed for five days.
Within seconds, global markets repriced. Oil tumbled more than 10%, U.S. stock futures jumped more than 2%, European equities reversed sharp early losses, and Bitcoin sprinted from the upper $67,000s back through $70,000.
Kobeissi estimates the move added about $2 trillion in market value. The rally then reversed slightly after Iran said there had been “no contact” with Washington. By 8:00 a.m. ET, futures were down about 120 points from the peak, erasing roughly $1 trillion.
In Kobeissi’s words, that left the S&P 500 with a total headline-driven swing of about $3 trillion in implied market value in 56 minutes.

Trump’s post was the trigger, but the force came from the macro chain that followed
Before the post, the market had been moving in the opposite direction. Higher crude prices were feeding a stagflation scare. Rising energy costs were threatening to push inflation expectations higher just as growth data had started to soften. Bond yields were climbing again. Bitcoin, gold, and equity futures were all under pressure while rates rose into a more sensitive zone.
In CryptoSlate’s morning analysis of the week ahead, the focus had already shifted from oil alone to the bond market, with the U.S. 10-year yield approaching a level that can tighten financial conditions quickly.

Then the market received a de-escalation signal.
The reaction after Trump’s post filled in the sequence in real time. Brent crude dropped more than 10% as traders stripped out part of the war premium. Dow futures rose about 2.6%, while the FTSE 100 recovered almost all of an earlier 250-point slide. Gold also reversed sharply, with an intraday slide of more than 7% before losses narrowed.
In rates, the U.S. 10-year yield dropped more than 20 basis points to around 4.30% before settling near 4.36% as of press time. Bitcoin followed the same repricing path at high speed, reclaiming $70,000 as the pressure embedded in oil and yields started to ease.
Oil cracked first. Yields backed off. Gold reversed. Equity futures snapped higher. Bitcoin then expressed the same repricing faster than most major assets.
The significance for Bitcoin sits one layer below the spike itself. Nothing about the crypto market changed in a structural sense during those five minutes. The post did not bring a new ETF catalyst, a policy shift from the Fed, or a sudden change in on-chain conditions.
What changed was the macro environment that had been pressing on every risk-sensitive asset for days. The market moved from pricing a wider energy shock to pricing the possibility of a pause.
CryptoSlate’s recent coverage has already mapped that transition.
- On March 7, we argued that oil had become one of Bitcoin’s clearest macro signals.
- On March 9, Bitcoin slipped below $70,000 as oil moved higher and stagflation fears intensified.
- On March 11, the market showed its first instinct during an oil panic, when traders sold Bitcoin rather than treating it as a haven.
- On March 12, Bitcoin held up better even as Brent briefly reclaimed $100, which suggested the market was beginning to separate immediate panic from broader positioning.
- By Monday morning, the center of gravity had shifted again, from oil shock alone to the risk that higher yields would become the dominant problem.
Monday’s move above $70,000 needs to be read inside that framework.
The timing invites a stronger political-economic reading
The U.S. 10-year had been approaching a zone that can become politically and financially difficult very quickly. Mortgage costs respond to it. Equities respond to it. Fiscal sensitivity rises with it. The White House watches it.
My morning piece already outlined the market’s concern around the 4.5% area, especially with Treasury auctions, flash PMIs, jobless claims, and inflation expectations lined up to shape the week. Trump’s post arrived just as the bond market was threatening to become part of the problem in a larger way.
Trump's post could be more than a diplomatic update. It looks like an intervention into a market sequence that was beginning to grow expensive.
Oil was pushing inflation risk back into the system. Rising yields were tightening financial conditions. Gold and stock futures had already moved into defensive positions. A de-escalation signal at that point gave traders permission to reverse the most painful part of the morning’s repricing.
That interpretation rests on incentives and timing, rather than on any official confirmation of motive. It fits the market sequence cleanly. It also fits the broader sensitivity around borrowing costs. The Guardian’s live coverage captured the pressure that rising yields had already started to place on the UK mortgage market, while we had already identified bond yields as the more dangerous extension of the oil shock for Bitcoin.
Once yields started to ease after Trump’s post, the path higher in BTC reopened immediately.
Bitcoin’s own market structure helps explain why the move traveled so fast.
A session shaped by higher oil and rising yields usually creates a defensive posture across crypto. Spot demand softens. Leveraged players hedge. Short exposure can build when macro pressure aligns across rates and energy.
Once the macro impulse flips, crypto often becomes the fastest outlet for the reversal. That appears to be what happened on Monday.
The move through $70,000 reads as a relief repricing amplified by positioning, speed, and the market’s existing sensitivity to macro inputs.

Macro repricing added an important confirming signal
Gold's sharp reversal suggests that traders were taking out part of the immediate war premium rather than rotating into a classic safe-haven structure. Bitcoin moved with that same repricing wave, which places it firmly inside the macro risk complex for this session.
That fits the recent pattern we have shown in our own reporting, where Bitcoin has traded more like a high-beta expression of financial conditions than a defensive shelter during energy-driven stress.
There are still limits to how far Monday’s relief can be extended.
Iranian media quickly pushed back on Trump’s account of the talks. Business Insider noted that oil rebounded from its lows as traders began to question how durable the de-escalation signal really was.
That leaves the market with a pause, rather than with resolution. The difference is important because Bitcoin’s hold above $70,000 now depends less on the post itself and more on whether the broader macro relief can survive a week, which remains difficult to read.
The normal inflation anchor is absent. The Bureau of Economic Analysis release calendar shows that the February PCE will not arrive until April 9, leaving traders leaning more heavily on secondary indicators and Treasury supply.
Our morning analysis highlighted the immediate sequence: flash PMIs on Tuesday, the 2-year auction on Tuesday, the 5-year on Wednesday, jobless claims and the 7-year auction on Thursday, and the final University of Michigan sentiment reading on Friday.
With oil having shaken inflation expectations and bond yields already testing market tolerance, those events now carry more weight for Bitcoin than any crypto-native development on the calendar.
That leaves Bitcoin with a clearer near-term map
If oil stays contained and the U.S. 10-year remains below the earlier stress zone, Monday’s move can become a platform. A reclaimed $70,000 then starts to look like a level the market can build above while it reassesses the inflation path and broader financial conditions.
If oil regains momentum and yields resume their climb, the relief trade loses force quickly. Bitcoin would then move back into the same macro regime that had been dragging on it before Trump posted, one defined by tighter financial conditions, more expensive risk, and a market that still sees stagflation as a live possibility.
The answer to the morning’s initial question is now fairly tight.
Bitcoin jumped almost 5% in five minutes because Trump’s post broke a one-way macro sequence that had been building across oil, rates, metals, and equities.
The post gave traders a reason to cut some of the war premium. Oil fell, yields followed, stocks reversed, gold dropped, and Bitcoin expressed the repricing fastest.
The deeper layer is the one traders will keep watching. Trump’s post arrived at a point where rising oil and rising yields were beginning to feed into a more dangerous mix for financial conditions.
The market response suggests participants understood the signal immediately.
For Bitcoin, the move above $70,000 restored momentum. Whether that level holds now depends on the next phase of the same macro chain, crude, yields, and whether the market believes the relief has enough substance to keep financial conditions from tightening again.
The post Markets reversed over $3 trillion this morning as Bitcoin price exploded above $70k in 5 minutes appeared first on CryptoSlate.
Bitcoin climbed back above $70,000 after President Donald Trump said the United States had held “productive conversations” with Iran and would postpone planned strikes on Iranian power plants and energy infrastructure for five days.
In a March 23 post on Truth Social, Trump wrote in capital letters:
“BASED ON THE TENOR AND TONE OF THESE IN DEPTH, DETAILED, AND CONSTRUCTIVE CONVERSATIONS, WHICH WILL CONTINUE THROUGHOUT THE WEEK, I HAVE INSTRUCTED THE DEPARTMENT OF WAR TO POSTPONE ANY AND ALL MILITARY STRIKES AGAINST IRANIAN POWER PLANTS AND ENERGY INFRASTRUCTURE FOR A FIVE DAY PERIOD, SUBJECT TO THE SUCCESS OF THE ONGOING MEETINGS AND DISCUSSIONS.”
Trump said the delay would depend on the outcome of talks that are set to continue through the week.
This eased some of the risk aversion that had spread across global markets earlier in the session.
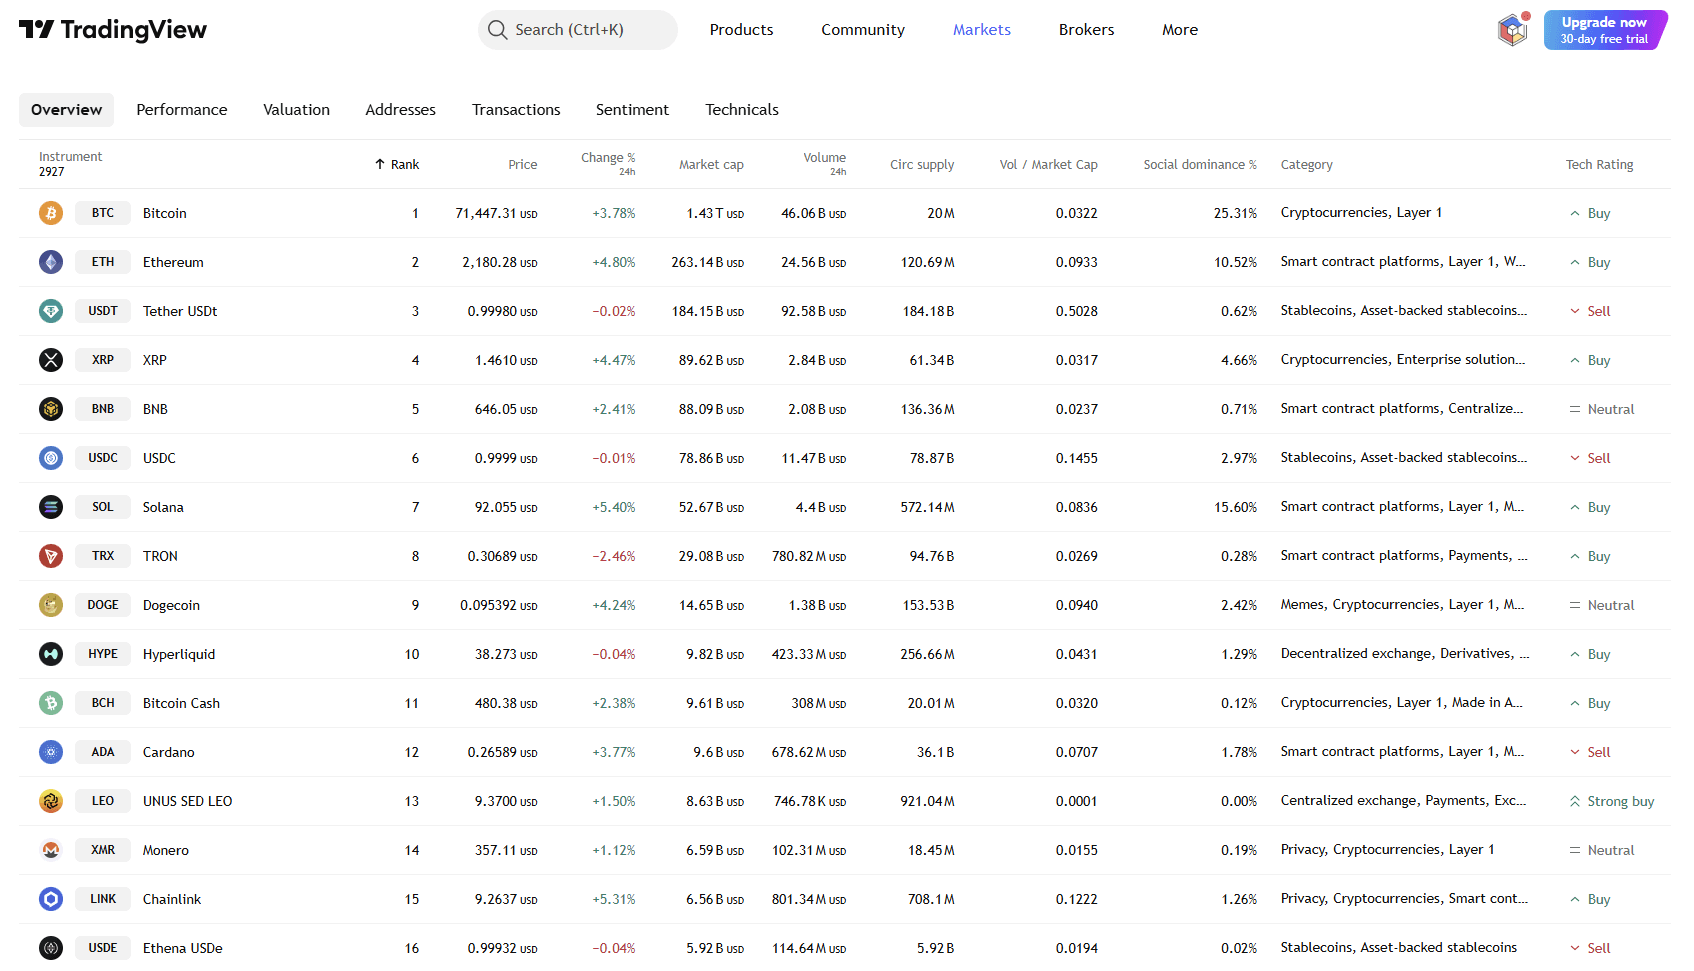
Data from CryptoSlate showed that the move pushed Bitcoin up about 3.6% on the day to $70,968, after it traded as low as $67,436 intraday.
Other digital assets, including Ethereum, XRP, Solana, and the top 10 crypto assets by market capitalization, all registered gains of more than 4% as traders moved back into risk assets following the White House signal.
Following the uptick, short sellers who were betting against upward market momentum lost $271 million in the past hour, bringing their total losses to $364 million over the last 24 hours.
Trump's shifting position on Iran war
This marketwide rebound came after a volatile weekend in which Trump issued a series of shifting statements on the conflict.
Trump had previously threatened to destroy Iranian power infrastructure if the Strait of Hormuz was not reopened, while Iran warned it would retaliate against infrastructure linked to US interests and regional allies.
Those exchanges pushed markets toward a classic risk-off posture earlier on Monday, with oil surging, equities sliding, and investors reassessing the outlook for inflation and interest rates.
Once Trump announced the pause, the reaction spread quickly across asset classes. Oil prices fell sharply as traders reduced some of the geopolitical premium tied to fears of disruption in the Gulf.
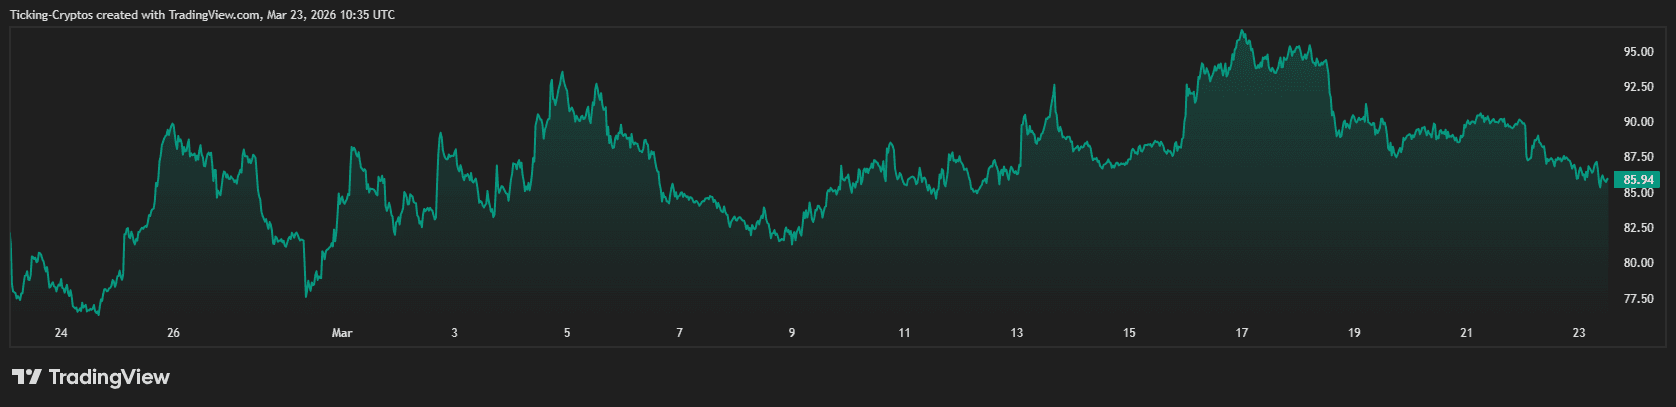
Data from Oilprices show that West Texas Intermediate crude dropped 13% to $85.45 a barrel and Brent fell 12% to $98.66 after Trump’s post signaled a temporary opening for diplomacy.
At the same time, US stock futures rebounded more than 2%, reflecting a partial unwind of the defensive positioning that had dominated earlier in the day.
While, Europe’s STOXX 600 reversed losses of more than 2.2% to trade higher, and the dollar gave back earlier gains as investors responded to the prospect of a temporary de-escalation.
The post Bitcoin rockets to $70,000 as Trump announces shock pause on Iran strikes appeared first on CryptoSlate.
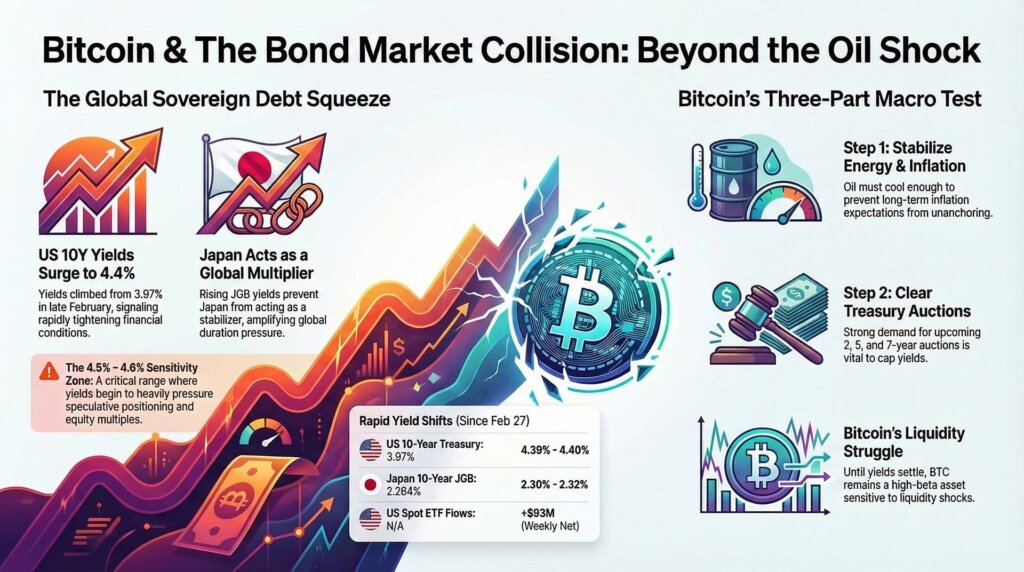
Bond markets, not oil alone, may decide Bitcoin’s fate this week
The market is still treating oil as the center of the current macro shock.
Market conditions after this weekend point somewhere else. Oil is the spark, bond markets are the channel, and Bitcoin is trading inside that channel as the week begins.
That is the setup now facing investors.
The geopolitical shock still carries weight. Crude can reshape inflation expectations, complicate central-bank decisions, and hit risk sentiment in a single move. The bigger issue, however, is what that energy shock is doing to sovereign debt markets at a moment when investors were already questioning how much inflation relief they could realistically expect in 2026.
That shift in focus takes the conversation from oil to yields, from yields to global bond pricing, and then directly to Bitcoin.
Bitcoin is operating in a market where the long end of the curve has become impossible to ignore.
Right now, the long end is under pressure.
The core thesis is straightforward: markets have already priced in war risk through energy, while the next repricing phase is centered on whether that energy shock becomes persistent enough to keep long-term yields elevated, delay policy relief, and tighten financial conditions across the board.
Every risk asset feels that process, and Bitcoin sits especially close to it because it still straddles two roles. In the short run, it behaves like a liquidity-sensitive macro asset. Over a longer horizon, it still carries the appeal of a hard-asset hedge.

That tension sits at the center of the current setup.
The Kobeissi Letter moved closer to the right framework this weekend, arguing that oil prices are no longer the only threat to markets and that bond markets will play a major role in determining how long Washington can maintain pressure in the Iran conflict. The key takeaway from that argument lies in the market mechanics.
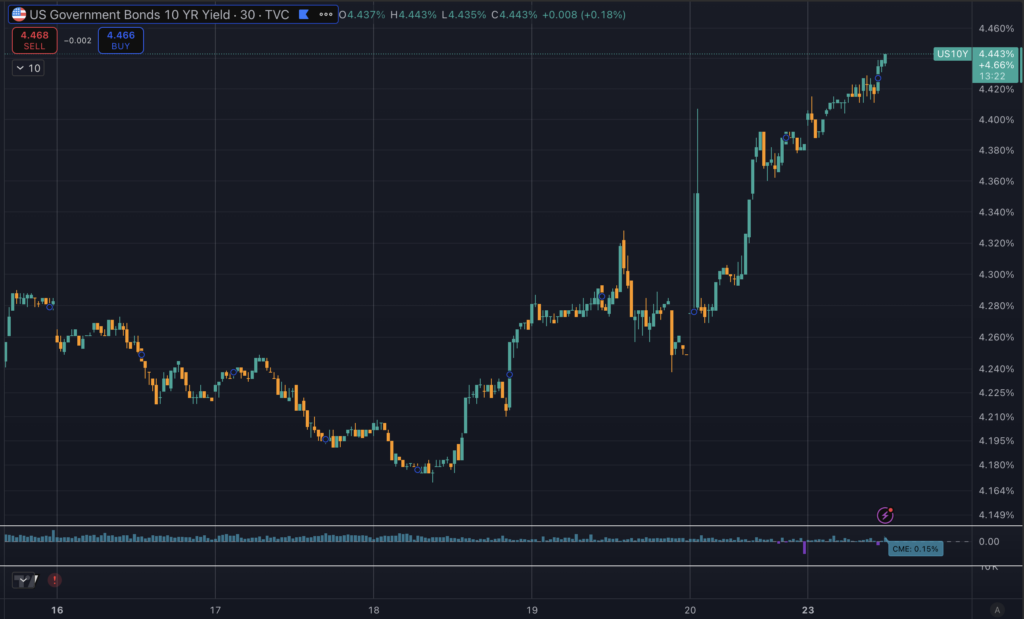
The U.S. 10-year yield climbed sharply after the war began on Feb. 28. Official Treasury data shows it moved from 3.97% on Feb. 27 to 4.39% by March 20, with live trading pushing it back toward the 4.4% area on Monday. That move is large enough to confirm that yields have risen quickly and that the bond market is applying real pressure on broader financial conditions.
Yield zone becomes the binding constraint for risk assets
The 4.50% to 4.60% zone on the 10-year deserves a more careful description. It reads best as a politically and financially sensitive range, rather than a fixed tripwire that forces an immediate response.
Markets rarely move with that kind of precision. Even so, recent experience suggests the White House pays close attention when the long end rises far enough to threaten broader risk conditions.
For Bitcoin, the implication is clear. The central question is no longer limited to whether oil moves higher. The more important issue is whether oil remains firm enough to keep inflation fears alive and lift yields into a range that pressures duration, equity multiples, and speculative positioning at the same time.
That is why the yield response deserves the bulk of investor attention.
The broader macro backdrop offers little relief.
The Federal Reserve held rates at 3.50% to 3.75% last week and signaled that the Middle East situation adds another layer of uncertainty to the policy outlook. The surrounding data reinforced that caution.
February CPI came in at 2.4% year over year, with core at 2.5%. February PPI ran hotter on a monthly basis. Payroll growth has cooled, and consumer sentiment has weakened. The University of Michigan’s preliminary March reading also showed inflation expectations rising, with gasoline prices standing out as a visible pressure point for households.
That combination leaves markets facing a difficult mix, softer growth signals arriving alongside renewed inflation anxiety.
Bitcoin tends to struggle when that mix starts feeding directly into the term premium.

Japan now deserves a much bigger place in the conversation
One of the most underappreciated risks in the current environment is that this has expanded beyond a U.S. Treasury move. Japanese government bond yields have also moved higher since Friday, with the 10-year JGB rising from 2.264% on March 20 into roughly the 2.30% to 2.32% range on Monday.
Longer-dated yields moved higher as well, with the 30-year and 40-year both pressing upward.
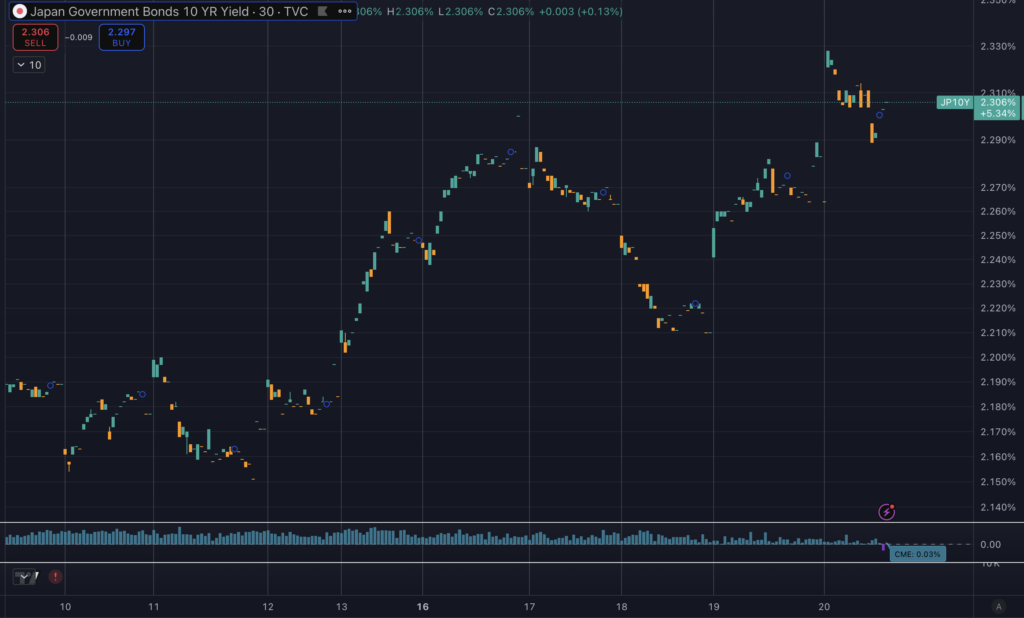
At the same time, 10-year JGB futures remained pinned near recent lows after Friday’s selloff instead of staging a convincing rebound.
That development adds another layer to the macro pressure.
Japan matters in global duration markets because rising JGB yields can influence capital flows, relative-rate pricing, hedging decisions, and the broader cost of money worldwide.
When JGBs reprice higher while Treasuries and gilts remain under pressure, the market begins to treat the energy shock as a global bond-market event rather than a localized oil panic.
That shift creates another challenge for Bitcoin.
The Bank of Japan reinforced that theme last week when it acknowledged that crude prices had risen significantly and warned that higher oil would place upward pressure on consumer prices.
The BOJ did not signal panic, but it also did nothing to cool the sense that inflation risk is broadening. Markets had already been pricing meaningful odds of another BOJ hike, and reports that Japan is considering trimming buybacks of inflation-linked bonds have only added to the sense that local inflation expectations are stirring again.
That leaves Japan acting less like a stabilizer and more like an amplifier.
Bitcoin traders often want the asset treated as digital gold during geopolitical stress. Price action has so far pointed to a more complicated reality. When the oil shock hit, traders sold Bitcoin instead of moving into it as a traditional haven. That response does not invalidate the hard-asset case over a longer horizon. It does show that timing plays a crucial role.
Bitcoin can still attract a more defensive bid later, especially if the policy response to weaker growth becomes more aggressive or if investors begin focusing more intensely on fiat credibility and sovereign debt sustainability. In the first stage of a liquidity shock, rising yields still create a hostile backdrop.
The week ahead carries unusual weight
This week does not include the usual PCE inflation anchor, because February U.S. PCE has been pushed back to April 9.
As a result, markets will lean more heavily on secondary signals. That raises the importance of Treasury auctions, PMI data, jobless claims, and survey-based inflation expectations.
Those releases form the scoreboard for the week.
Tuesday’s flash PMIs will offer an early sense of whether business activity is absorbing the shock or beginning to wobble. The 2-year Treasury auction lands the same day, followed by the 5-year on Wednesday and the 7-year on Thursday. Friday brings the final University of Michigan sentiment reading and an updated look at inflation expectations.
If the auctions come in weak and inflation-expectations data stay firm, the 10-year could move toward the mid-4% range quickly. That environment would keep Bitcoin under pressure even if oil pauses. Under that scenario, BTC would likely remain inside the market’s liquidity bucket as investors reprice higher-for-longer conditions.
A different path is also possible. If auctions clear well, PMIs soften enough to cap the long end, and inflation expectations cool, yields could stabilize even without a dramatic collapse in crude. That would offer a more constructive opening for Bitcoin.
Markets could begin shifting away from immediate concern over sticky inflation and toward a broader view in which the growth hit from the shock eventually outweighs the energy spike itself.
That is the point where Bitcoin’s hard-asset appeal can start to re-enter the conversation more forcefully.
Bitcoin market structure still looks intact
Spot prices have pulled back from recent highs, yet institutional demand has continued to show through in pockets of the market. U.S. spot ETF flows for the week ending March 20 were still net positive overall (+$93 million), even though the final sessions weakened.
Futures basis also remained positive. That combination suggests a market that is still engaged and still highly sensitive to macro conditions, rather than one facing broad internal collapse.
Which brings the focus back to bonds.
Bitcoin’s next move may depend less on the next jump in crude and more on whether the bond market decides the inflation shock is temporary or persistent. Oil created the initial shock. Treasuries are shaping how tight financial conditions become, and Japan is increasingly reinforcing that repricing instead of easing it.
Bitcoin now faces a three-part macro test this week.
- Can oil stabilize quickly enough to keep inflation fears from building further.
- Can Treasury auctions prevent another sharp move higher in the long end.
- Can Japan avoid turning a U.S. bond selloff into a broader global duration squeeze.
If those pressures keep building, Bitcoin is likely to stay under strain and trade like a high-beta macro asset. If those pressures begin to ease, even partially, BTC has room to recover as markets start separating immediate war-driven stress from the wider monetary path ahead.
The current setup therefore runs deeper than crude alone. Oil started the fire, bonds are determining how far it spreads, and Japan is adding evidence that the repricing in sovereign debt is global.
Until the rate market settles, Bitcoin remains caught in the middle.
[Update 11:23 GMT: Rates nearing 4.5% have coincided with President Trump issuing a statement declaring “THE UNITED STATES OF AMERICA, AND THE COUNTRY OF IRAN, HAVE HAD, OVER THE LAST TWO DAYS, VERY GOOD AND PRODUCTIVE CONVERSATIONS REGARDING A COMPLETE AND TOTAL RESOLUTION OF OUR HOSTILITIES IN THE MIDDLE EAST.” Bitcoin jumped 4.5% immediately.]
The post Bitcoin focus shifts from oil to bonds as US and Japan 10-year yields spike into a critical week appeared first on CryptoSlate.
Cryptoticker
Markets Explode on Trump’s Iran Statement
Global markets surged in a matter of minutes after President Trump announced a 5-day pause on military strikes against Iran’s energy infrastructure, claiming “productive talks” had taken place.
The reaction was immediate and aggressive:
- Over $900 billion added to the US stock market at the open
- Nasdaq futures +4%
- S&P 500 futures +3.9%
- Bitcoin (BTC) +5% within hours
- Oil prices dropped sharply, signaling easing geopolitical risk
In total, some estimates suggest over $2.5 trillion was added across global markets in less than 20 minutes.
A Perfect “Risk-On” Reaction
The move followed a classic macro playbook:
- Stocks rallied on reduced war risk
- Oil crashed as supply fears eased
- Bitcoin surged, benefiting from liquidity and momentum
Even traditional safe havens reacted violently, with gold and silver experiencing one of their most volatile sessions in years, initially dropping before sharply rebounding.
This was a textbook shift into risk-on sentiment.
But There’s One Problem…
Shortly after the rally, Iran officially denied any direct or indirect talks with the United States.
Statements from Iran’s Foreign Ministry and state-linked media contradicted Trump’s claims, rejecting the idea that negotiations had taken place.
This creates a critical disconnect:
👉 Markets are rallying on a de-escalation narrative that may not exist.
Markets Are Pricing Hope — Not Reality
Right now, the market appears to be pricing in:
- A temporary ceasefire
- Potential diplomatic progress
- Reduced geopolitical risk
But if those assumptions are incorrect, the implications are serious.
This isn’t the first time markets have reacted to headlines over confirmed developments, but the scale of this move is unusual.
👉 A single statement triggered nearly $1 trillion in equity inflows.
Why Bitcoin Is Benefiting
Bitcoin’s reaction is particularly interesting.
Unlike gold, which showed mixed signals, Bitcoin moved decisively higher—suggesting:
- Strong liquidity-driven momentum
- Growing perception as a macro asset
- Increased participation from risk-on traders
BTC is no longer just reacting to crypto-native news—it is now deeply integrated into global macro flows.
What Happens Next?
Everything now depends on one key factor:
👉 Is there actually a deal?
If talks are confirmed:
- Markets could continue higher
- Bitcoin may push toward new local highs
- Risk assets remain supported
If tensions escalate again:
- A sharp reversal is likely
- Oil could spike
- Stocks and crypto may retrace quickly
The Bottom Line
Markets just added $900 billion in value based on a narrative that is already being challenged.
That raises a critical question:
👉 Is this rally built on real progress—or on hope?
For now, markets are choosing optimism.
But if that optimism proves wrong, volatility could return just as fast as it disappeared.
As of March 23, 2026, Solana ($SOL) is positioned at a critical technical juncture. Following a period of intense market-wide volatility triggered by geopolitical shifts in the Middle East and a hawkish "hold" from the Federal Reserve (FOMC), the asset is currently trading between $80 and $90. While the broader market remains cautious, Solana’s internal ecosystem is showing signs of decoupling, driven by massive institutional adoption and the imminent deployment of the Alpenglow consensus upgrade.
Is Solana a Good Buy Now?
Traders looking for a short-term direction should focus on the $92.34 resistance zone. A daily close above this level could catalyze a rally toward $98.65 by the end of March. Conversely, if SOL fails to defend the $86.66 support, a deeper correction toward the $80.00 psychological floor is highly probable.
What Should Driving Solana’s Value in 2026?
In the current 2026 landscape, Solana’s value is increasingly tied to its Network Finality and Institutional Liquidity. Unlike 2024, where retail "meme" activity dominated, the primary drivers now are:
- Spot Solana ETFs: Regulated vehicles providing direct exposure to institutional capital.
- Alpenglow Upgrade: A transition from Tower BFT to a new consensus mechanism aiming for 150ms finality.
- Digital Commodity Status: Confirmed regulatory taxonomy that has stabilized long-term investor sentiment.
Solna Price Analysis: Technical Chart Patterns
Analyzing the current SOL price action, we see a consolidation pattern forming after the mid-March dip.
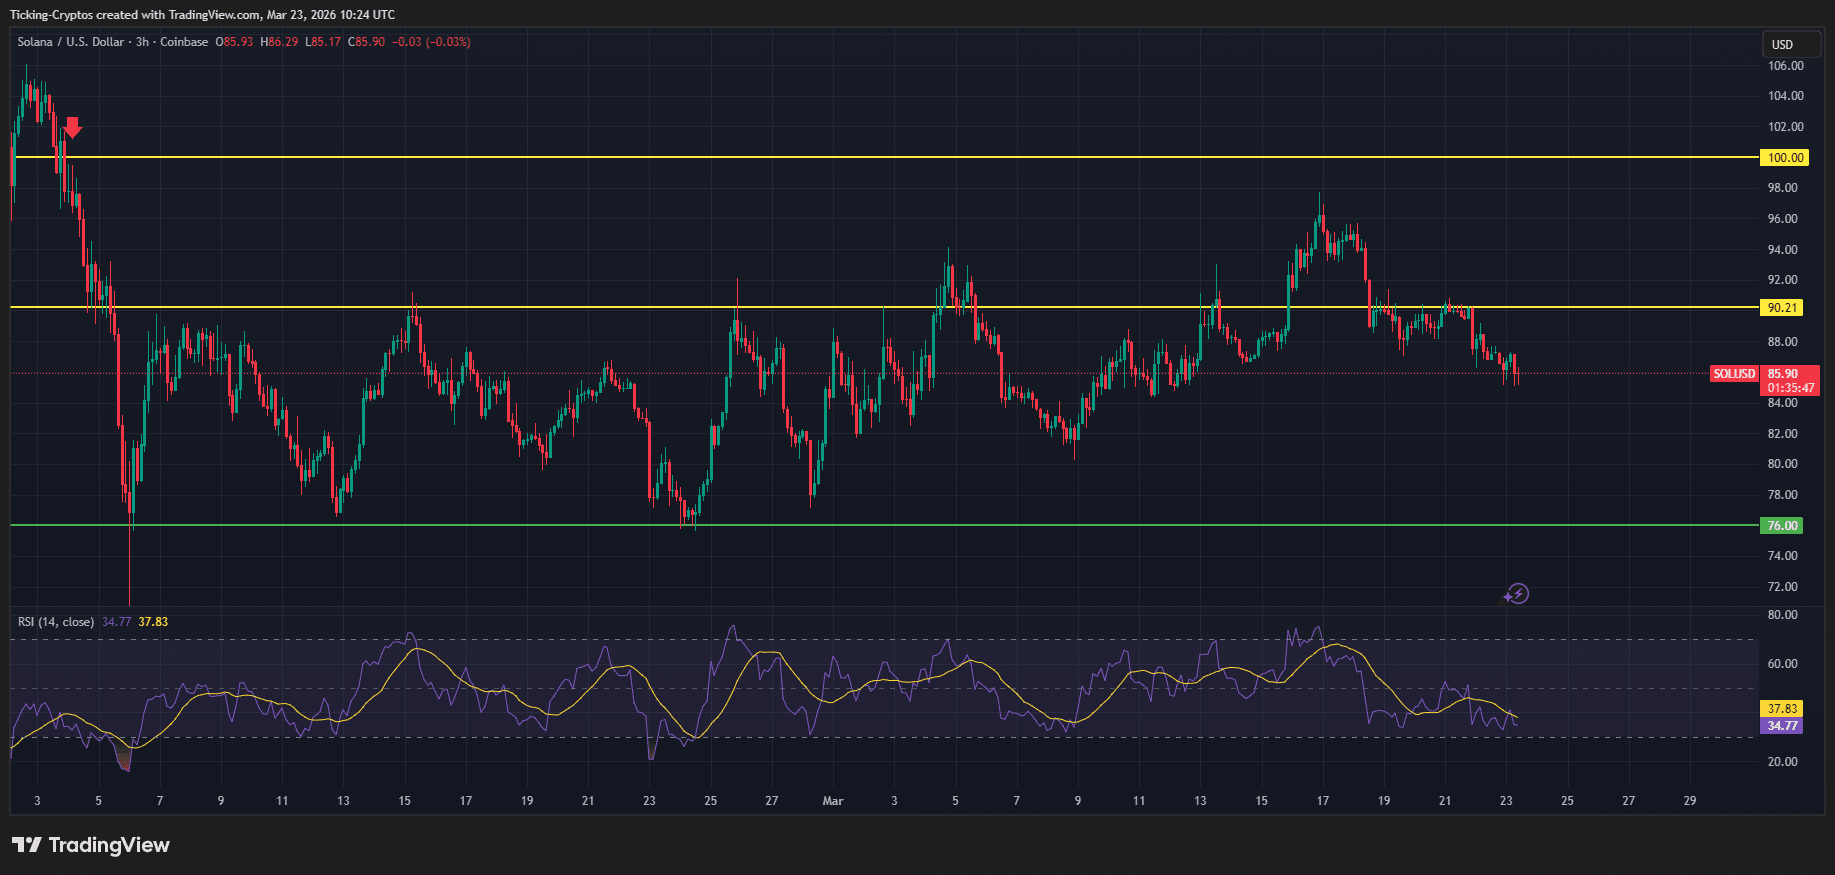
- Moving Averages: SOL is currently hovering near its 20-day EMA ($88.93). Staying above this level is vital for maintaining a bullish "bias." The 50-day SMA at $87.23 serves as a secondary safety net.
- RSI (Relative Strength Index): At 51.63, the RSI is neutral. This suggests the market is "resetting," providing enough room for a significant move without being immediately overbought.
- MACD Signal: We observe a slight bearish divergence on the daily histogram. This indicates that while the price is stable, buying momentum is currently thinning, requiring a fresh catalyst to break overhead resistance.
Solana Price: Key Support & Resistance
| Level Type | Price (USD) | Significance |
|---|---|---|
| Major Resistance | $117.71 | 2025 structural high; targets if $100 breaks. |
| Short-term Ceiling | $92.34 | Immediate hurdle; upper Bollinger Band target. |
| Pivot Point | $88.52 | Current "Fair Value" and 20-day EMA support. |
| Critical Support | $80.27 | The "Line in the Sand"; break here invalidates the bull case. |
Solana Upgrade: The Alpenglow and Firedancer Effect
The stagnant price action masks a massive technical shift. The Alpenglow upgrade is currently rolling out, which promises to reduce transaction finality from 12 seconds to under 150 milliseconds. This makes Solana faster than many centralized servers, a factor that major financial outlets cite as a reason for the record $1.45 billion in cumulative ETF inflows. Institutional players like Goldman Sachs and Electric Capital now hold significant SOL exposure via these ETFs, creating a "floor" of demand that was absent in previous cycles.
Will Solana Price go up? March 2026 Outlook
For the final week of March, the following three factors will dictate SOL's path:
- ETF Inflow Consistency: If net inflows exceed $20M daily, expect a test of $95.
- Geopolitical De-escalation: A reduction in energy-related inflation fears will allow capital to rotate back into "high-beta" assets like Solana.
- Bitcoin Stability: Solana's correlation with $Bitcoin remains high (0.84); a $BTC push past $72k would likely drag SOL above $100.
The XRP price is showing notable resilience despite ongoing volatility across the crypto market. While many altcoins struggle to maintain support levels, XRP is holding steady, suggesting that underlying demand remains strong.
As macro uncertainty continues to impact markets, traders are now asking: Is XRP preparing for its next breakout?
XRP price stabilizes near key levels
Currently, the XRP price is trading around the $1.38–$1.42 range, holding above an important short-term support zone.
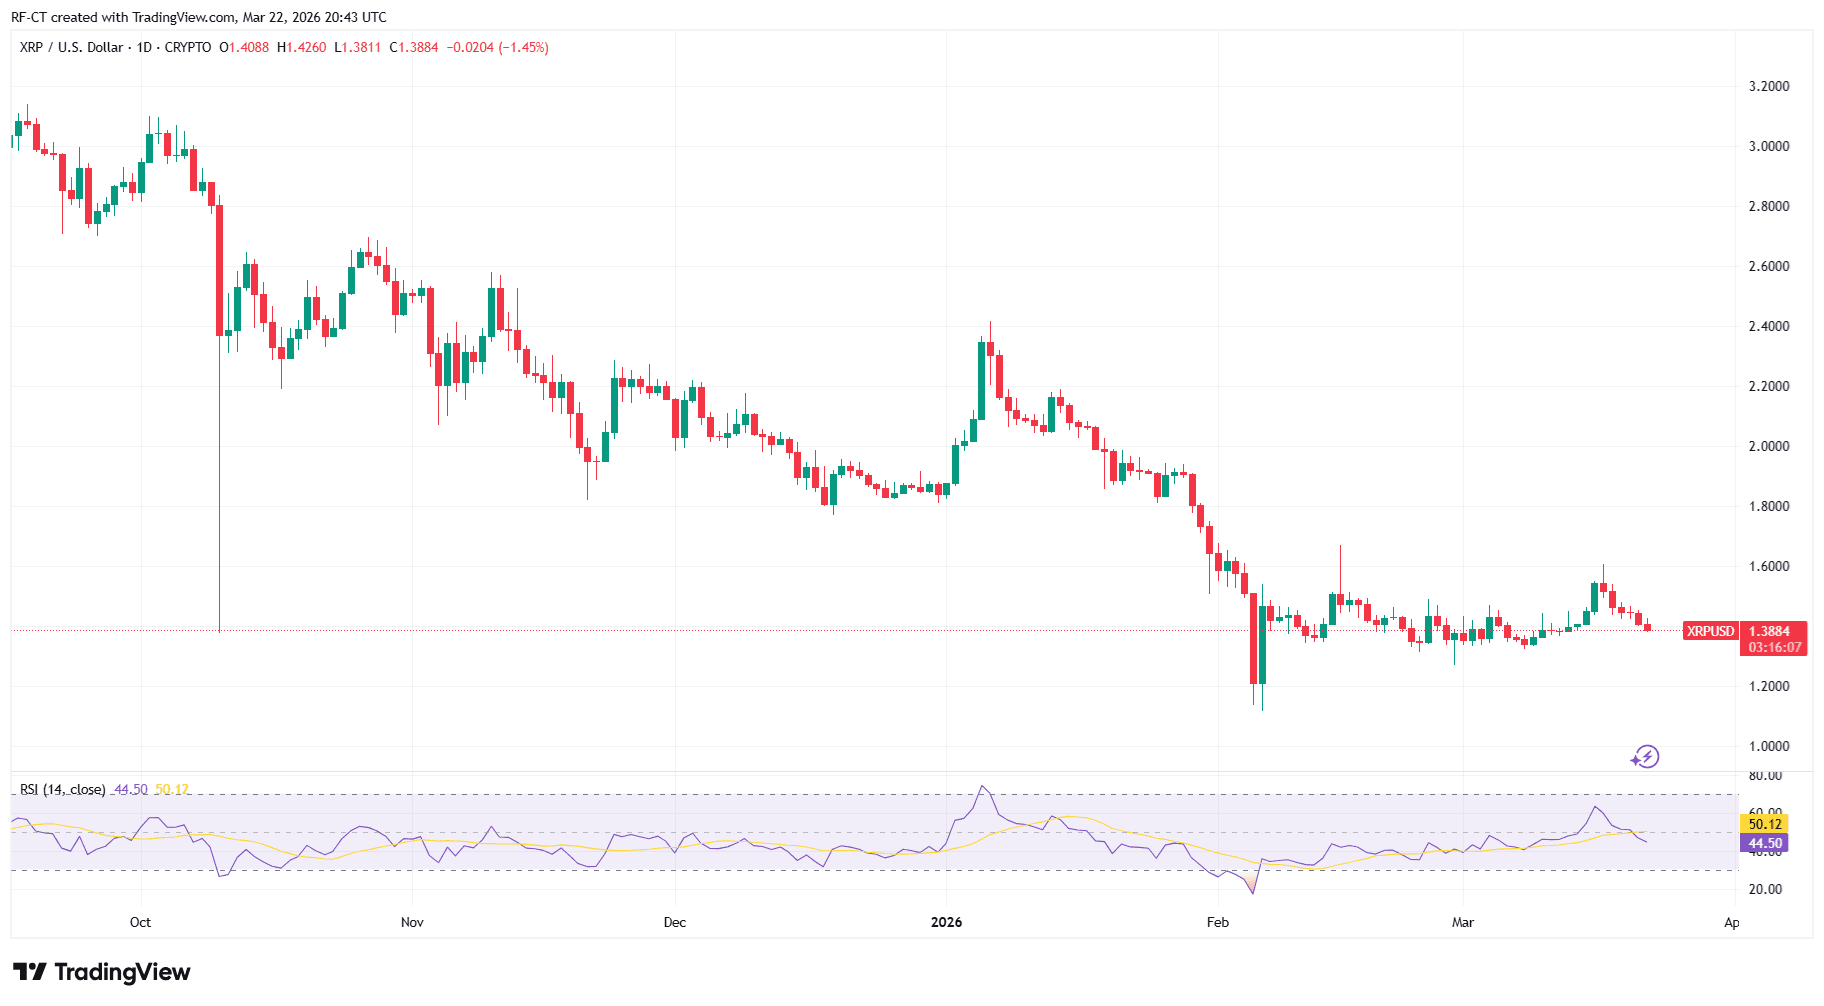
This level has acted as a strong base in recent sessions, preventing further downside despite broader market pressure driven by macro news and geopolitical tensions.
Holding this zone is critical. If XRP maintains this support, it could build momentum for the next move higher.
Why XRP price is showing strength
Unlike many altcoins, XRP benefits from a unique narrative:
- Ongoing institutional interest
- Strong positioning in cross-border payments
- Continued relevance in regulatory discussions
This combination helps XRP remain relatively stable even when market sentiment shifts.
Additionally, XRP often reacts later than Bitcoin, meaning delayed but stronger moves can follow periods of consolidation.
Key levels to watch next
For the XRP price, traders should closely monitor:
- Support: $1.35 – $1.38
- Resistance: $1.45 – $1.50
👉 A break above $1.50 could trigger a stronger bullish move
👉 A drop below $1.35 may lead to a deeper correction
Right now, XRP is sitting at a decision point.
Conclusion — XRP price at a turning point
The XRP price is currently consolidating at a key level, showing resilience while the broader market remains uncertain.
This type of price action often precedes a larger move.
Whether XRP breaks upward or revisits lower levels will largely depend on overall market sentiment — but one thing is clear:
👉 XRP is not weak — it is waiting.
Stablecoins are rapidly moving from niche crypto tools to a central pillar of the global financial system. While much of the market focuses on Bitcoin volatility and geopolitical tensions, a quieter but far more structural shift is taking place.
From regulatory breakthroughs in the United States to global expansion by major payment companies, stablecoins are positioning themselves as the digital version of the dollar — faster, borderless, and increasingly integrated into everyday finance.
This raises a critical question: are stablecoins quietly becoming the new global dollar?
PayPal and Big Tech Are Accelerating Stablecoin Adoption
One of the clearest signals of this shift comes from PayPal, which has expanded its stablecoin services to over 70 countries. This move significantly lowers the barrier for millions of users to access digital dollars without relying on traditional banking systems.
Unlike earlier crypto adoption cycles driven by speculation, this wave is infrastructure-driven. Payment giants are embedding stablecoins directly into financial ecosystems, allowing users to send, receive, and store value globally in seconds.
This is not just innovation — it is a transformation of how money moves.
US Regulation Is Turning Bullish for Stablecoins
At the same time, regulatory clarity is beginning to emerge in the United States. Coordination between agencies like the U.S. Securities and Exchange Commission and the Commodity Futures Trading Commission is reducing uncertainty that has long slowed crypto adoption.
More importantly, recent discussions between lawmakers and the White House around stablecoin frameworks signal a shift toward integration rather than restriction.
This is a major turning point.
Instead of treating stablecoins as a threat, regulators are increasingly viewing them as an extension of the dollar’s global dominance — but in digital form.
Stablecoins Are Solving Real Global Problems
Stablecoins are gaining traction because they address real-world inefficiencies in traditional finance:
- Cross-border payments remain slow and expensive
- Banking access is limited in many regions
- Currency instability drives demand for dollar-based assets
Stablecoins offer:
- Instant transactions
- Lower fees
- Access to dollar liquidity anywhere in the world
In regions facing inflation or capital controls, stablecoins are already functioning as a practical alternative to local currencies.
A New Financial System Is Emerging
What makes this shift particularly important is its timing.
As geopolitical tensions rise and global trade faces increasing friction, the demand for neutral, digital, and liquid financial tools is growing.
Stablecoins are uniquely positioned at the center of this transformation:
- Backed by fiat currencies
- Integrated into crypto ecosystems
- Increasingly adopted by institutions
This creates a hybrid financial system where traditional and digital finance converge.
Risks and Challenges Still Remain
Despite their rapid growth, stablecoins are not without risks:
- Regulatory fragmentation across countries
- Dependence on underlying reserves
- Centralization concerns
- Potential competition from central bank digital currencies (CBDCs)
However, these challenges are being actively addressed as the market matures and institutions become more involved.
Conclusion — The Rise of the Digital Dollar
Stablecoins are no longer just a crypto niche — they are becoming a core layer of global finance.
With major companies expanding access, regulators moving toward clarity, and real-world demand increasing, stablecoins are quietly evolving into the digital equivalent of the dollar.
This transformation may not be as visible as Bitcoin price swings, but its long-term impact could be far greater.
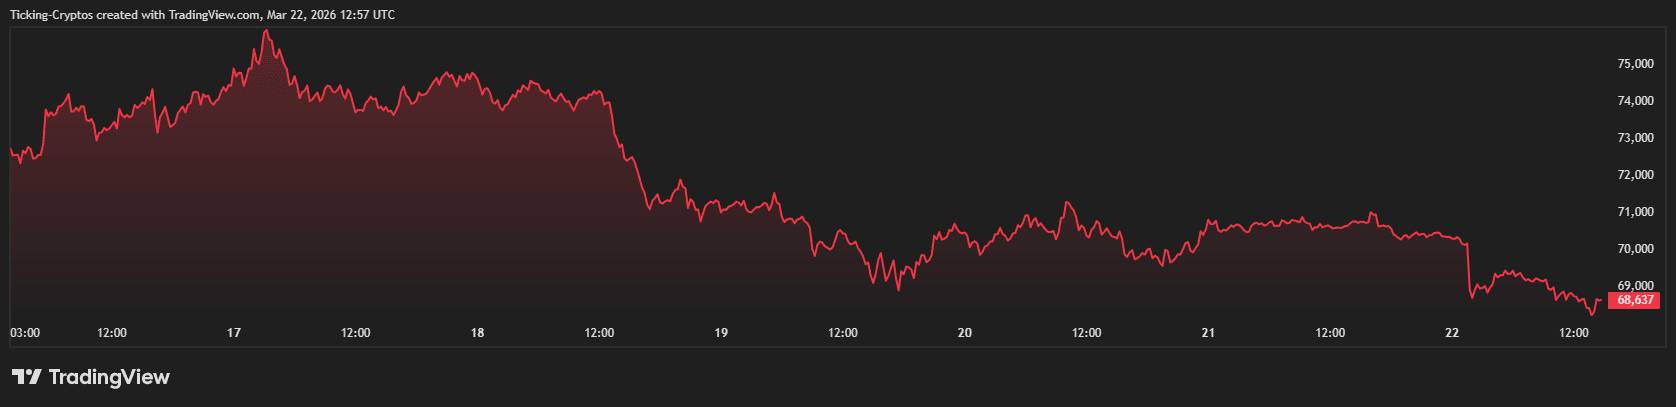
Bitcoin Price Analysis: The Current Market State
The digital asset market is currently at a critical crossroads as we move through March 2026. After hitting local highs, the $Bitcoin price has retraced to stabilize around the $68,500 – $69,500 zone. While some retail investors view this sideways movement as a sign of weakness, professional traders recognize it as a high-probability "coiling" phase. This period of consolidation often precedes a massive directional breakout, offering a unique window for those looking to trade Bitcoin with a structured approach.
Bitcoin Price Prediction: Is $75,000 Next?
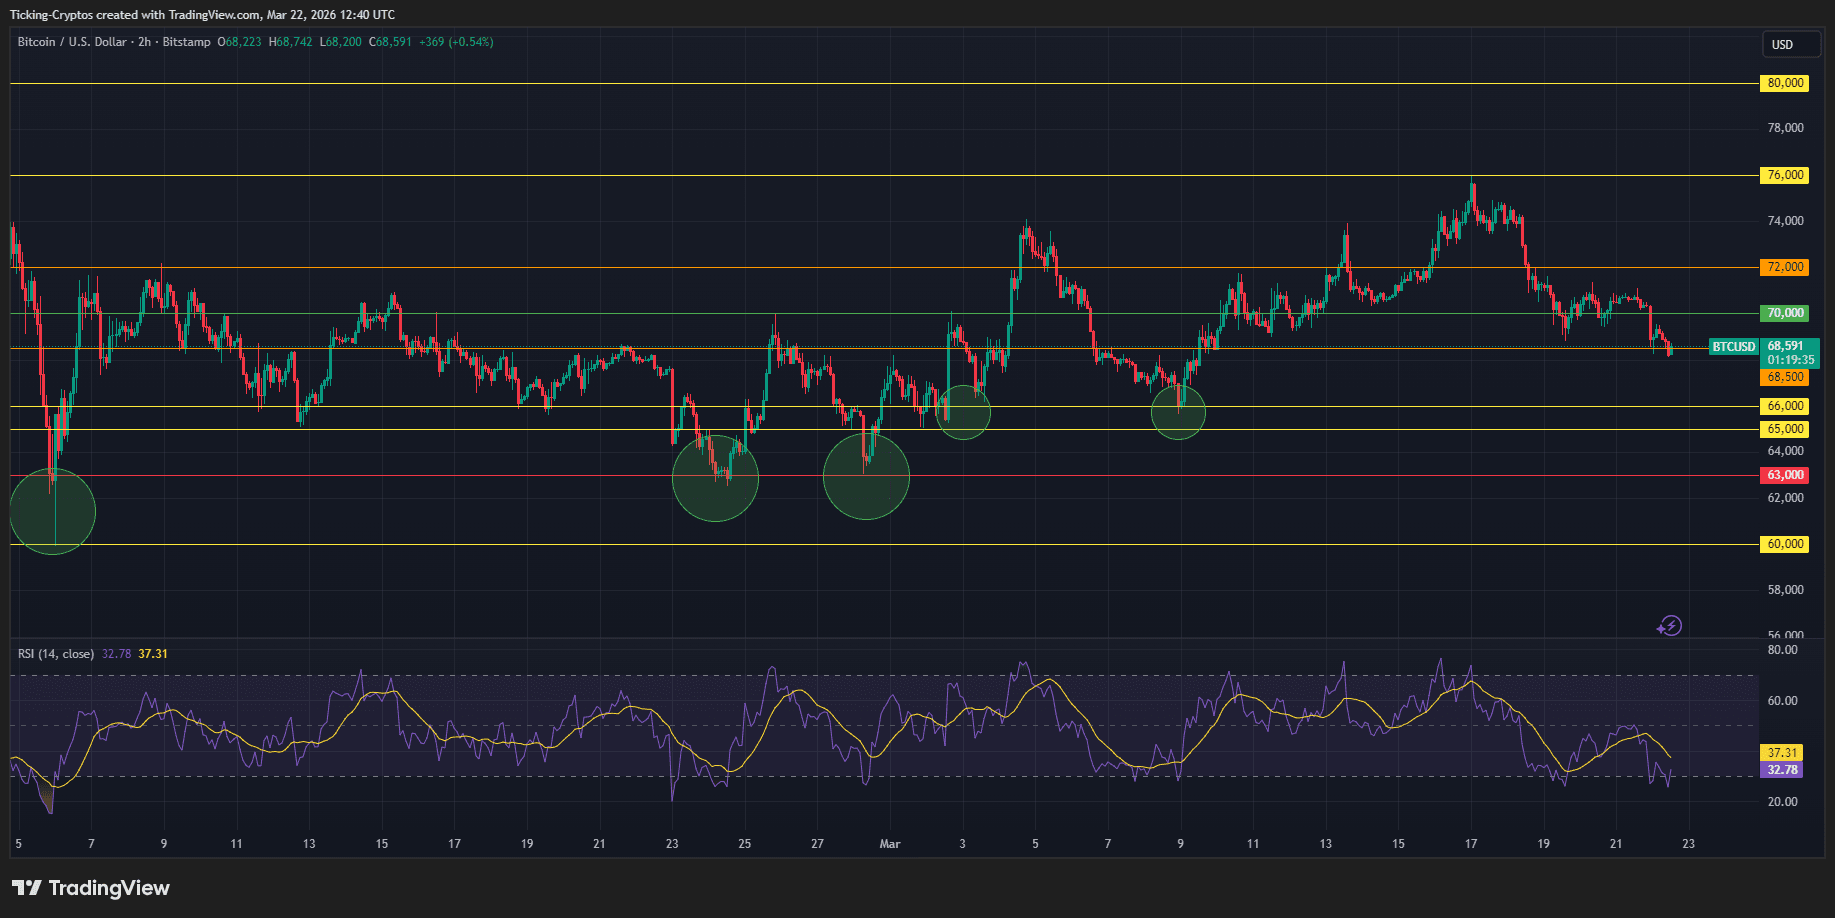
Current data suggests that the Bitcoin price prediction for the remainder of Q1 2026 hinges on the $70,000 psychological level. As of March 22, 2026, BTC is trading at approximately $68,625, showing a slight cooling off from the recent rally. For traders, this "easy period" refers to the clear technical boundaries currently in play on the BTC-USD chart, which allow for well-defined risk management and high-reward entries before the next volatility spike.
Defining the Bitcoin Price Action and Volatility
To capitalize on this movement, it is essential to understand the BTC/USD price action. Price action refers to the movement of a security's price plotted over time. In the current context, we are observing a "Bull Flag" on the daily chart. Trading this successfully involves identifying support (where buying pressure starts) and resistance (where selling pressure begins).
Technical Breakdown: Key Levels for the Bitcoin Price
Looking at the current market structure, we can see a distinct pattern emerging. After the "flash crash" of late 2025, the market spent months finding a floor.
The Technical Setup
- Support Zone: $65,000 - $68,000. This area has been defended vigorously by institutional "whales."
- Resistance Zone: $72,000 - $76,000. This is the ceiling that must be cracked for a move toward $100k.
- Correlation Factors: BTC currently shows an increasing correlation with the S&P 500. According to data from Bloomberg, this often precedes a period of heightened volatility in the Bitcoin price.
Pro Strategy to Trade Bitcoin During Consolidation
During this period, the most effective way to make money is not by guessing the direction, but by reacting to the levels. Here is a professional strategy to trade Bitcoin right now:
- The Range Play: Buy near the $67,500 support with a tight stop-loss at $66,000. Target the upper resistance at $72,000.
- The Breakout Entry: Set a "Buy Stop" order at $72,500. If the Bitcoin price breaks this level with high volume, it confirms a bullish reversal.
- The Hedge: Use hardware wallets for long-term holdings while keeping only trading capital on top-tier exchanges.
Fundamental Catalysts Driving the Bitcoin Price
While the charts look technical, fundamentals are driving the sentiment. The Federal Reserve’s stance in 2026 has kept "risk-on" assets under pressure. However, the increasing adoption of BTC as a reserve asset provides a long-term regulatory tailwind. This "flight to quality" is why the Bitcoin price is outperforming the broader market.
Bitcoin Price Metrics
| Indicator | Status | Trading Action |
|---|---|---|
| RSI (14) | 52 (Neutral) | Wait for divergence |
| Fear & Greed | 26 (Fear) | Contrarian Buy Opportunity |
| Moving Average | Trending Up | Maintain Long Bias |
| Institutional Flow | Positive | Accumulate on Dips |
- Summary for Traders: The current Bitcoin price prediction suggests we are in a "calm before the storm" phase. By utilizing a disciplined strategy to trade Bitcoin and keeping a close eye on the $70,000 pivot point, traders can position themselves for the next leg of the bull cycle.
Decrypt
An individual was arrested in Spain for their alleged role in the violent kidnapping of Ledger co-founder David Balland and his wife last year.
The Swedish Bitcoin treasury firm signed a letter of intent to acquire Moonshot and Never Say Die in an all-stock deal.
The bill, from Adam Schiff (D-CA) and John Curtis (R-UT), has already been condemned by one of America’s top prediction market platforms.
BitMine Immersion Technologies now holds more than $10 billion worth of Ethereum, leading the ETH treasury pack as the asset rebounds.
Strategy shared plans to issue $44 billion in equity, a move aimed at providing its Bitcoin-buying machine with fuel for future purchases.
U.Today - IT, AI and Fintech Daily News for You Today
Billionaire quant investor Cliff Asness has dismissed the idea of Bitcoin as a diversifying safe haven, providing technical evidence that the cryptocurrency is currently trading in lockstep with traditional "risk-on" equities.
As Michael Saylor's Strategy hits 762,099 BTC, Peter Schiff mocks a "losing" 4.5% weekly trade. But with new SEC filings opening a massive $44.1 billion liquidity channel through STRC and STRK, is Saylor building an unstoppable Bitcoin machine?
Shibarium is undergoing an infrastructure upgrade, with key details shared with the Shiba Inu community.
Cardano is reversing its negative price trend as volume jumped over the past 24 hours.
As crypto and bank reps review the stablecoin deal on Capitol Hill, all eyes are on the guest list. While official attendees remain private, Ripple's deep ties to the Clarity Act make their presence the big question.
Blockonomi
Key Highlights
- Bitmine acquired 65,341 ETH during the past week, valued at approximately $138 million based on current market rates
- Company’s aggregate ETH position now reaches 4.66 million tokens — representing 3.86% of total circulating supply
- Acquisition velocity has accelerated over three straight weeks, surpassing the previous weekly average of approximately 50,000 ETH
- BMNR shares advanced more than 3% while ETH traded near $2,144
- Executive Chairman Tom Lee projects ETH is approaching the conclusion of a “mini-crypto winter”; the company maintains roughly $7 billion in unrealized losses
Bitmine Immersion Technologies (BMNR) continues its aggressive Ethereum accumulation strategy. The treasury firm acquired 65,341 ETH during the previous week — marking the third straight week of escalating purchases — as it reinforces a position that has accumulated substantial paper losses while maintaining aggressive expansion.
Bitmine Immersion Technologies, Inc., BMNR
This recent acquisition, valued at approximately $138 million based on prevailing market rates, pushes Bitmine’s aggregate holdings to 4,660,903 ETH. With tokens priced near $2,072 each, the treasury position exceeds $9 billion in value.
The company now owns roughly 3.86% of ETH’s 120.7 million token circulating supply. This percentage continues expanding as Bitmine increases its weekly acquisition rate, which historically averaged between 45,000 and 50,000 ETH.
Cash holdings expanded in tandem with crypto acquisitions, hitting $1.1 billion. The firm also maintains 196 Bitcoin, $200 million allocated to Beast Industries, and $95 million in Eightco Holdings. Combined crypto, cash, and speculative investment holdings totaled $11.0 billion as of March 22.
Investors reacted positively. BMNR shares climbed over 3% following the announcement as Ethereum price approached $2,144.
Staking Infrastructure Growth
Beyond accumulation, Bitmine is pursuing an aggressive staking strategy. As of March 23, the company had staked 3,142,643 ETH — approximately 67% of total holdings. This staked position currently produces $184 million in annualized staking revenue.
Tom Lee stated Bitmine has staked more Ethereum than any competing entity worldwide. When operations reach full capacity, projected annual rewards could reach $272 million, calculated using a 2.83% seven-day yield. The prevailing Composite Ethereum Staking Rate stands at 2.75%.
The firm is developing its Made in America Validator Network (MAVAN), collaborating with three staking service providers in preparation for an anticipated early 2026 launch.
Significant Paper Losses Persist
The strategy carries substantial downside risk. Notwithstanding the acquisition momentum, Bitmine currently holds approximately $7 billion in unrealized losses as ETH valuations have declined in recent months, per DropsTab analytics.
Lee maintains confidence in his investment thesis. “Our base case is ETH is in the final stages of the ‘mini-crypto winter,'” he stated in Monday’s announcement.
Bitmine holds the distinction of operating the world’s largest Ethereum treasury and ranks second among all global crypto treasuries, trailing only Michael Saylor’s Strategy, which controls 762,099 Bitcoin purchased for roughly $57.69 billion.
As of March 23, Ethereum was trading in the $2,072 to $2,144 range.
The post Bitmine (BMNR) Stock Gains 3% Following $138M Ethereum Acquisition Spree appeared first on Blockonomi.
Key Takeaways
- ARK Invest’s Cathie Wood limited her stock purchases to just three companies last week: Figma, Arcturus Therapeutics, and 10x Genomics
- The firm acquired 337,381 Figma shares totaling more than $8.1 million on March 20
- Circle Internet Group, a cryptocurrency-related holding, saw ARK divest 45,998 shares worth approximately $5.9 million from ARKK and ARKW
- Despite reporting 40% revenue expansion in recent earnings, Figma shares have plummeted 83% from their 2025 peak
- Additional sales included positions in Teradyne, Bullish, Guardant Health, and Butterfly Network
Cathie Wood, who leads ARK Invest as founder and chief executive, demonstrated unusually restrained buying activity last week, acquiring positions in only three companies while markets experienced their fourth consecutive week of losses. All three primary equity benchmarks registered declines throughout this timeframe.
This limited purchasing activity marked a departure from Wood’s typical pattern of more aggressive accumulation during market downturns, catching the attention of market watchers.
The trio of stocks receiving fresh capital included Figma, Arcturus Therapeutics, and 10x Genomics. Simultaneously, the investment firm reduced exposure to multiple holdings, most notably Circle Internet Group, which operates in the cryptocurrency sector.
Figma operates a cloud-native design platform serving teams building websites, applications, and other digital experiences. On March 20, ARK accumulated 337,381 shares distributed between its ARKK and ARKW exchange-traded funds, representing an investment of $8,171,367.
Figma, Inc., FIG
Shares have tumbled 83% from last summer’s highs, following a remarkable surge that pushed the stock more than four times above its $33 initial public offering price. Yet the company’s fundamentals remain robust, with its latest quarterly results showing 40% top-line expansion, accelerating from 38% in the prior period.
The platform’s net dollar-retention metric reached 136%, indicating that existing clients increased their spending by 36% year-over-year. This represents the best performance on this indicator in 24 months.
Wall Street forecasts anticipate revenue growth moderating to 30% in the current year and 20% in the following year. The company’s lack of consistent profitability has been a headwind for investor sentiment.
Cryptocurrency Exposure Trimmed With Circle Internet Sale
In the digital asset space, ARK liquidated 45,998 shares of Circle Internet Group distributed across ARKK and ARKW, generating proceeds of $5,902,923. The firm had been systematically reducing this position throughout the week.
Circle Internet operates in the cryptocurrency infrastructure sector and plays a significant role in the USD Coin stablecoin market.
Additional divestitures included 19,206 Teradyne shares for $5,807,894, 103,379 Bullish shares generating $4,093,808, and 9,621 Guardant Health shares for $857,038. The firm also exited 182,353 Butterfly Network shares, receiving $723,941.
Biotechnology Focus: Arcturus and 10x Genomics Additions
Arcturus Therapeutics leverages messenger RNA platforms to create therapies targeting uncommon respiratory and hepatic conditions. ARK added to this position on three separate days during the trading week, culminating in a Friday purchase of 22,773 shares valued at $153,034 through the ARKG ETF.
The company has experienced declining revenues for three consecutive years, with projections suggesting further contraction through 2026. Nevertheless, management recently announced an extension of its financial runway through at least mid-2028.
10x Genomics manufactures scientific instruments for life sciences research, notably its Chromium system designed for single-cell genomic sequencing. ARK purchased 192,658 shares distributed between ARKK and ARKG last week, investing $3,541,054.
The stock debuted at $38 per share and currently trades near half that valuation. The company remains unprofitable, and its own 2026 revenue outlook suggests a contraction when adjusting for licensing revenues from prior-year patent settlements.
The post ARK Invest’s Cathie Wood Snaps Up Just 3 Stocks in Quiet Trading Week appeared first on Blockonomi.
Key Highlights
- In December 2025, FedEx introduced a global AI literacy initiative reaching more than 400,000 team members
- Accenture collaborated with FedEx to develop the training, delivered via the LearnVantage platform
- The curriculum adapts to individual roles and continuously updates as AI capabilities advance
- FedEx’s entire executive leadership team dedicated two days in Silicon Valley to evaluate AI vendor options
- FDX shares have climbed approximately 50% year-over-year, supported by strong quarterly results
FedEx has introduced a comprehensive AI education initiative targeting its complete global team of over 400,000 workers. Unveiled in December 2025, the training program emerged from a collaboration with technology consulting powerhouse Accenture and operates on the LearnVantage learning platform.
FedEx Corporation, FDX
The curriculum follows a tailored approach, customizing content based on employee responsibilities. A package handler receives fundamentally different instruction compared to a software engineer or international trade specialist. This strategic design ensures AI knowledge penetrates every operational level, extending far beyond technology departments.
The program stands out due to exceptional executive involvement. Prior to launch, FedEx’s complete senior leadership team dedicated two consecutive days away from headquarters, traveling to Silicon Valley. They participated in rapid-fire meetings with multiple AI vendors to identify the optimal partnership.
“I have never seen an organization’s full C-suite take off for a two-day to just learn,” said Vishal Talwar, FedEx’s executive vice president and chief data and information officer.
FDX stock has surged nearly 50% during the past twelve months, with recent quarterly earnings generating enthusiastic investor reaction. Shares were trading approximately 0.87% higher at press time.
Inside the AI Training Program
Workers have flexibility in completing their coursework—sessions can be taken during regular shifts, administrative hours, or personal time. Talwar characterized the initiative as a “living curriculum” that undergoes monthly and quarterly updates, distinguishing it from static training programs.
FedEx actively promotes peer learning networks beyond individual coursework. Data science professionals have established dedicated groups for knowledge exchange and identifying practical applications. The company also hosts hackathon events to encourage innovation.
The organization monitors what Talwar calls AIQ—essentially an AI competency score—as employees advance through modules. He emphasized the metric evaluates development rather than purely performance outcomes.
“We are measuring progress around AI, not necessarily just success,” he said.
Industry Context and Workforce Challenges
This upskilling effort unfolds amid operational restructuring. FedEx has shuttered facilities and eliminated positions in markets spanning Kansas to France as part of comprehensive efficiency measures. Competitor UPS recently disclosed 30,000 workforce reductions, following 48,000 cuts in 2025.
FedEx executives position AI as an enabler rather than a workforce substitute, emphasizing technology’s role in employee capability enhancement. An encouraging indicator: frontline personnel are pursuing corporate positions at increased rates following training implementation.
Accenture’s 2026 Pulse of Change research reveals just 28% of companies have integrated ongoing AI education. FedEx joins this select minority with an open-ended program designed for long-term adaptation.
The company delivered its latest earnings this week to positive market reception. FedEx unveiled new AI-powered capabilities in early February, including enhanced digital package tracking and streamlined returns management for shipping clients.
The post FedEx (FDX) Stock Surges as Company Trains 400,000+ Employees in AI Literacy appeared first on Blockonomi.
Key Takeaways
- Bernstein’s Stacy Rasgon highlighted unrelenting AI chip demand, triggering a 5.1% gain in ASML shares
- Though Rasgon’s note didn’t explicitly mention ASML, market participants linked the analysis to semiconductor equipment demand
- Bank of America reaffirmed its Buy rating with a €1,598 target following discussions with Asian investors
- BofA identifies ASML as a “prime beneficiary” of expanding EUV technology and increased memory capital expenditures
- BofA’s 2028 revenue projection of €52 billion appears cautious; the firm anticipates a capital markets update later this year
ASML Holding experienced a sharp rally exceeding 5% on Monday following back-to-back optimistic assessments from prominent Wall Street analysts that renewed investor attention on the Dutch semiconductor equipment giant.
ASML Holding N.V., ASML
The upward momentum began with commentary from Bernstein’s Stacy Rasgon. While his analysis didn’t explicitly reference ASML, equity markets quickly drew the connection.
Rasgon’s research centered on the wider AI semiconductor sector, maintaining that demand “currently shows no signs of slowing” despite this year’s volatility in AI-related equities.
He spotlighted Broadcom (AVGO) as particularly promising, projecting potential for the company to quadruple its 2025 earnings to exceed $20 per share. Nvidia (NVDA) could see earnings expand from below $5 last year to $12 or higher by 2027. ASML shares were trading near $1,369 during market hours, reflecting approximately 3.9% gains.
The Supply Chain Connection to ASML’s Growth Story
The investment logic is straightforward: escalating AI chip demand translates to higher revenues for semiconductor designers including Nvidia and Broadcom. This ripples through to manufacturing partners like TSMC, which must increase production capabilities. Capacity expansion directly requires additional equipment — precisely what ASML manufactures.
Rasgon further emphasized persistent supply bottlenecks stemming from inadequate chip manufacturing capacity. This creates an ideal backdrop for sustained demand in ASML’s lithography systems.
While ASML trades at a premium 46.5 times trailing earnings, Wall Street projects 19% compound annual earnings growth over the coming five years. If Rasgon’s AI demand forecast proves accurate, such expansion could validate current valuation levels.
Bank of America Projects Strength Through 2027 and Beyond
In parallel, Bank of America’s Didier Scemama released findings following investor consultations throughout Asia.
His central conclusion: the memory semiconductor cycle is “likely to remain strong through at least 1H27E.” This outlook bolsters ASML’s order pipeline well into the next fiscal year.
BofA outlined three critical growth drivers. First, high-NA EUV technology adoption is projected for 2028, led by TSMC and SK Hynix. Equipment availability reached 80% at 2025’s close and should hit 90% by end of 2026. Scemama forecasts 15 high-NA system deliveries in 2028.
Second, low-NA EUV capacity constraints are expected by Q4 2027, with 22 system deliveries scheduled that year. BofA suggests ASML may announce EUV capacity expansions during 2026.
Third, BofA anticipates ASML will host a capital markets presentation later this year, potentially elevating its 2030 revenue guidance to a range between €53.7 billion and €65.4 billion.
BofA’s current 2028 revenue model stands at €52 billion, which the firm characterizes as “increasingly conservative” relative to Street consensus.
Bank of America maintained its Buy recommendation and €1,598 price objective, positioning ASML as its preferred name within the semiconductor equipment space.
The post ASML (ASML) Stock Surges 5% as Wall Street Analysts Reaffirm AI Chip Momentum appeared first on Blockonomi.
Key Takeaways
- Bernstein’s Stacy Rasgon assigns ‘outperform’ rating to Broadcom, describing its current valuation as “absurdly attractive”
- Analyst sees no indication of weakening AI demand trends
- Most recent quarter delivered 16% revenue growth and 173% profit surge
- Rasgon projects EPS exceeding $20 by fiscal 2027, compared to $5.12 trailing twelve months
- Cantor Fitzgerald holds Overweight rating with $525 target; Rosenblatt sets $500 price objective
Broadcom (AVGO) shares climbed 4.7% during Monday’s trading session following a highly optimistic research note from Bernstein analyst Stacy Rasgon, who highlighted the semiconductor giant as a premier investment opportunity in the AI infrastructure space.
Broadcom Inc., AVGO
Rasgon assigned an “outperform” rating to Broadcom and disclosed that Bernstein maintains a position in the stock within its proprietary portfolio. The analyst issued a parallel recommendation on Nvidia (NVDA), which advanced 1.65% during the same session.
The timing of this upgrade carries particular significance. Broadcom reached a peak of $413 per share on December 10 of the previous year, subsequently declining approximately 22% as broader market enthusiasm for artificial intelligence investments waned.
Rasgon challenged this negative sentiment directly. “AI demand currently shows no signs of slowing,” he stated, referencing Broadcom’s latest quarterly performance as evidence. The company reported a 16% increase in revenue alongside a remarkable 173% surge in profitability.
With AVGO shares trading near $321, Rasgon characterizes the valuation as compelling. His analysis forecasts earnings per share reaching $20 or higher for fiscal year 2027, implying the stock currently trades at approximately 16 times forward earnings based on present pricing.
Breaking Down The Earnings Projection
That forward valuation multiple becomes particularly noteworthy when considering Broadcom‘s starting point. The company generated only $5.12 per share during the trailing twelve-month period. Achieving $20 by fiscal 2027 would represent approximately 400% earnings expansion over two years — translating to roughly 100% annual growth.
Even when measured against trailing earnings, the stock commands around 60 times earnings. Rasgon’s thesis is clear: if the projected growth trajectory materializes, today’s 60x multiple will appear modest in retrospect.
Additional Wall Street analysts are expressing similar confidence. On March 5, Cantor Fitzgerald reaffirmed its Overweight rating alongside a $525 price objective, responding to Broadcom’s Q1 fiscal 2026 earnings release.
Cantor highlighted management guidance indicating that networking solutions could comprise as much as 40% of total AI-related revenues. The firm also increased its earnings estimates, now projecting $23–$25 per share as attainable, up from its previous $20 forecast for fiscal 2027.
Multiple Firms Raise Price Targets
Rosenblatt similarly updated its outlook on March 5, increasing its price target to $500 while maintaining a Buy recommendation. The firm referenced CEO Hock Tan’s statements that fiscal 2027 revenue visibility has “significantly improved.”
Both research firms emphasized the $100 billion AI chip revenue threshold as a critical benchmark. Cantor projects Broadcom will exceed that figure during fiscal 2027, forming the foundation of both firms’ positive outlooks.
Cantor positioned Broadcom as a top selection alongside Nvidia[[/LINK_END_3]], strengthening the perspective that AI semiconductor demand remains resilient despite recent share price volatility.
Broadcom conducts operations through two primary divisions: Semiconductor Solutions and Infrastructure Software.
At the time of publication, AVGO was changing hands at $321.15, representing a $11.29 gain for the session, with a market capitalization of roughly $1.5 trillion.
The post Broadcom (AVGO) Stock Surges Nearly 5% on Bernstein’s Bullish AI Upgrade appeared first on Blockonomi.
CryptoPotato
While the second-largest cryptocurrency has registered a significant rebound over the past month, it remains at risk of plummeting to drastically low levels during this cycle.
On the other hand, some important indicators suggest that the worst might be over and the price could be gearing up for a major rally.
The Critical Point
Ethereum, just like many other leading digital assets, has been on a roller coaster lately. Its price hovered between $2,000 and $2,400 during the past week and is currently at nearly $2,200 (per CoinGecko’s data).
The lower level was reached over the weekend when POTUS threatened to destroy the Iranian power plants if the country refused to open the key oil corridor, the Strait of Hormuz. Back then, X user Ted noted that ETH temporarily lost its $2,100 support zone, arguing that the next key level is $2,000. The analyst predicted that breaking below that mark could lead to a “cascading liquidation.”
ETH managed to hold its ground and headed north today following Donald Trump’s recent de-escalation remarks (despite being refuted by Iran).
Another analyst who stressed the importance of the $2K psychological level is Merlijn The Trader. He believes that holding above that zone could open the door to a major bull run to a new all-time high of $12,000, whereas losing it would break nine years of support.
Just a few days ago, Ali Martinez assumed that Ethereum had entered a “generational buy zone” because the asset’s Market Value to Realized Value (MVRV) had dropped below 1. He reminded that in the past, such a development was followed by triple and even quadruple price explosions.
Most recently, he outlined several MVRV pricing bands designed to serve as a roadmap. $1,655 was depicted as the most important support level, $2,356 as the first major resistance to reclaim, $2,647/$3,639 as mid-term breakout targets, and $4,632/$5,624 as long-term “expansion” zones.
Mixed Signals From These Indicators
Over the weekend, the number of ETH coins stored on crypto exchanges registered another sharp drop, falling to a nearly 10-year low of roughly 15 million units. This trend suggests that investors continue to move their holdings from centralized platforms to self-custody, showing that they are not preparing for any mass sell-offs.
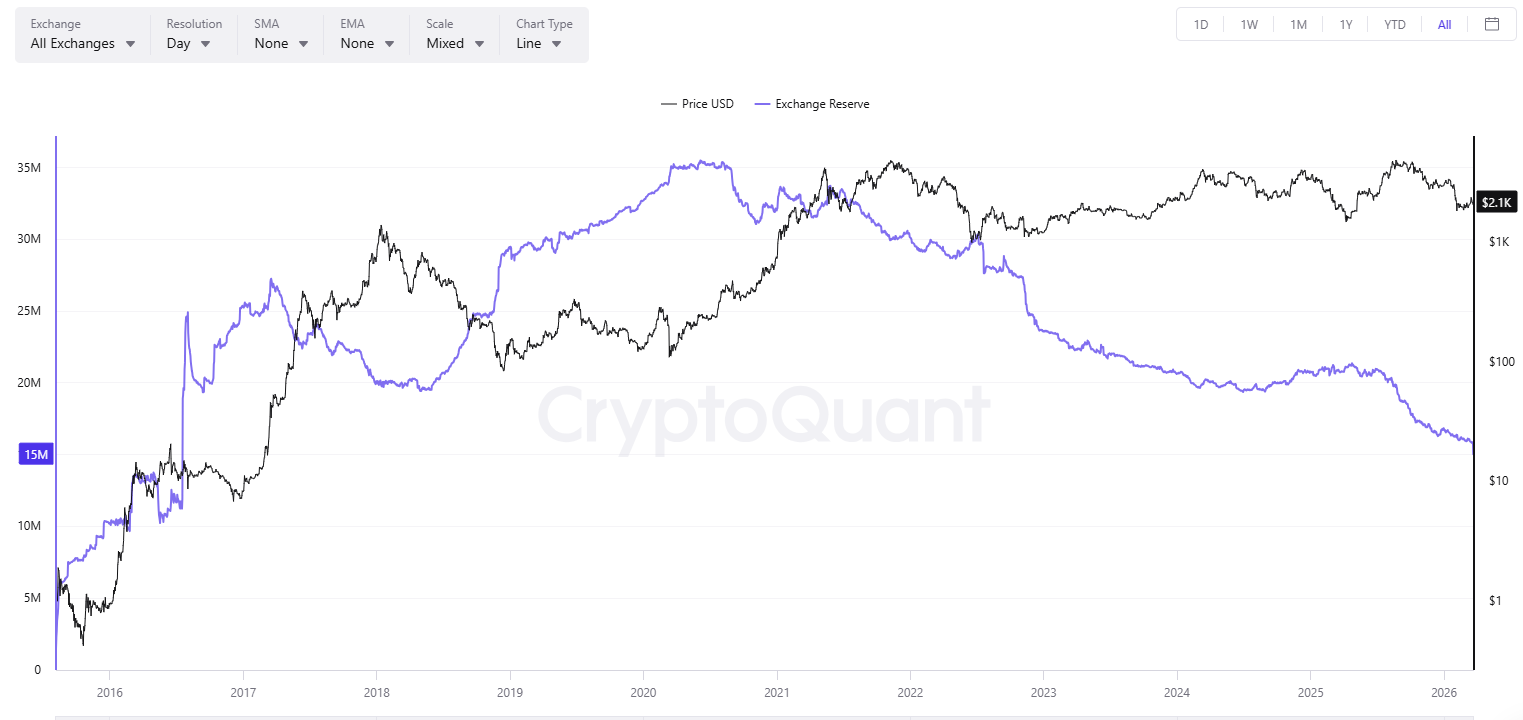
Conversely, the asset’s Relative Strength Index (RSI) hints that another move south might be on the horizon. The indicator’s ratio has surged past 70, suggesting that ETH has entered overbought territory and could be on the verge of a correction. Meanwhile, any readings beneath 30 signal that the valuation has fallen too much in a short period of time, meaning it might be time for a rebound.

The post Ethereum (ETH) on the Edge: Critical Level Stands Between New Bull Run and a Major Crash appeared first on CryptoPotato.
Digital asset investment products posted $230 million in net additions last week, in a slowdown relative to recent trends. Although concerns around the Iran conflict have affected sentiment, CoinShares stated that the reaction to the US Federal Reserve’s Wednesday meeting and its “hawkish pause” signal appears to be the dominant factor.
Data across the week points to a sharp reversal in activity. Early momentum was strong. The first two days alone brought in $635 million. This was followed by a sharp downturn after the FOMC announcement, with $405 million in withdrawals. The situation stabilized toward the end of the week, as pressure had reduced by Friday.
Polarized Bets on Bitcoin
According to the latest edition of CoinShares’ Digital Asset Fund Flows Weekly Report, investment activity last week was led by Bitcoin, which attracted $219 million. Meanwhile, products betting against the BTC still drew $6 million, demonstrating “ongoing polarised views for the asset.” Solana maintained momentum with $17 million and extended its run to seven consecutive weeks, lifting its recent total to $136 million.
Chainlink and Hyperliquid registered $4.6 million and $4.5 million, respectively. XRP added $2.9 million, while Sui amassed $1.5 million. Ethereum, on the other hand, saw $27.5 million in capital outflow and ended three weeks of consistent investor interest.
Interestingly, all regions reported positive investor activity last week. The United States led with $153 million in inflows for the period. Germany and Switzerland also posted significant figures of $30.2 million and $27.5 million. Meanwhile, Canada and Australia saw comparatively smaller additions of $9.3 million and $3.9 million, respectively.
Bitcoin Rebounds
Bitcoin climbed above $71,400 on Monday, alongside the rest of the crypto market, after US President Donald Trump said the United States and Iran held “very good and productive conversations” aimed at easing Middle East tensions. Following the remarks, the leading asset rose more than 4% over the past day as markets reacted to signs of potential de-escalation.
According to experts at Bitunix, until energy supply chains stabilize and policy direction is re-anchored, Bitcoin will remain constrained between overhead liquidity resistance above 74,000 and uneven demand below.
“Its volatility will continue to be dictated by external macro transmission channels rather than endogenous trend formation.”
The post Bitcoin Dominates While Ethereum Breaks Streak in Volatile $230M Week appeared first on CryptoPotato.
Bitcoin is struggling to regain its footing after a brutal correction from its October 2025 highs near $125K, with the price currently hovering around $71,100. The broader trend remains firmly bearish, and despite several attempts at recovery, BTC has yet to reclaim any major structural level that would shift the outlook in favor of the buyers.
Bitcoin Price Analysis: The Daily Chart
On the daily timeframe, BTC is trading inside a well-defined descending channel, with both the 100-day MA (~$80k) and 200-day MA (~$92k) sloping downward overhead. The $75k-$80k zone has flipped to resistance after acting as support for much of late 2025, and every recovery attempt since February has been rejected in that area.
Immediate support sits at the $60k-$62k band, which held during the sharp February wick. A breakdown below that level would bring the $50k zone into play, which is a scenario the RSI, now recovering from oversold territory near 20, is not yet pricing in. On the other hand, the buyers need a decisive close above $75K to start changing the daily structure, and pave the way for further upside above $80k.
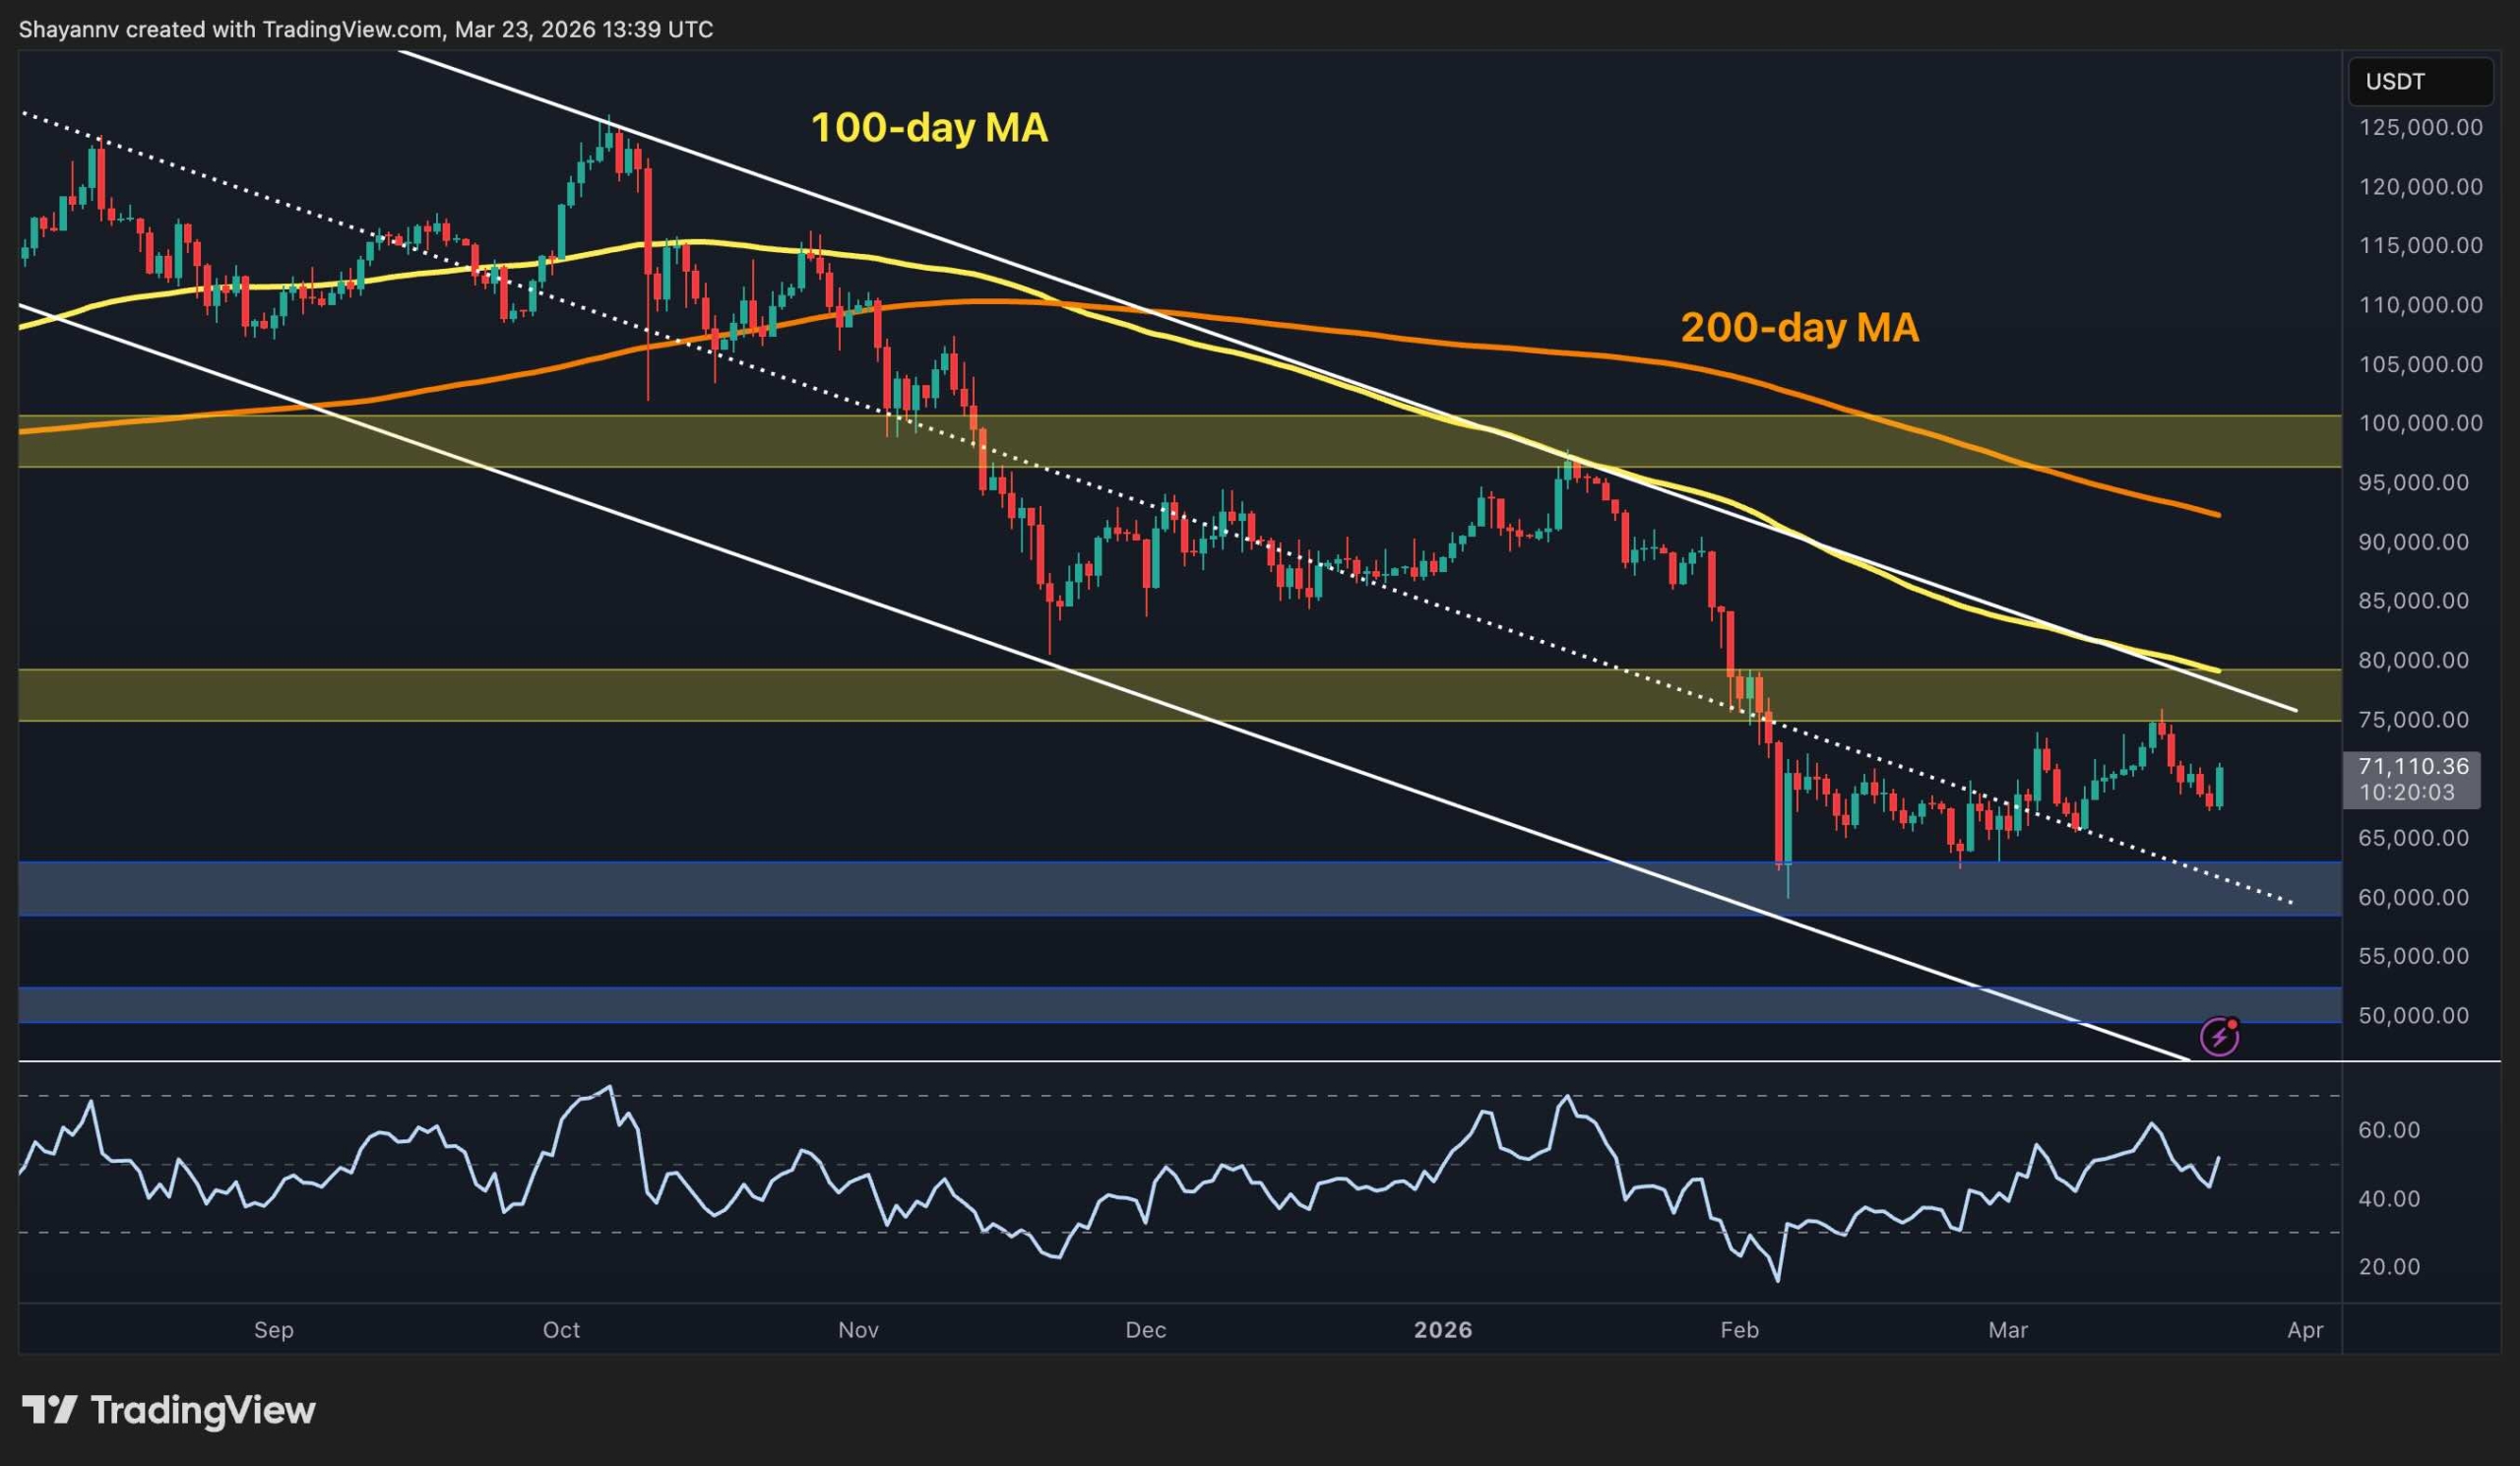
BTC/USDT 4-Hour Chart
Zooming into the 4-hour chart, BTC has been forming a rising channel since late February, with the price compressing between the trendlines roughly bounded by $66k and $75k at the moment. The recent push toward the upper boundary was rejected, and the asset has since pulled back to the $68k zone. However, the market is now experiencing a significant bounce and is currently around $71k, sitting near the middle of the pattern.
The RSI on this timeframe is also recovering from the low-40s and ticking upward, which marginally favors buyers in the short term. However, the $74k-$76k resistance band remains the critical level to clear. A confirmed breakdown below the channel’s lower trendline near $66k would likely accelerate selling toward the daily support zone.

Sentiment Analysis
The Coinbase Premium Index tells a concerning story about US-based demand. Since the October peak, the index has been predominantly negative, flipping green only briefly and inconsistently. This is a sign that retail and institutional buyers on Coinbase are not driving price action. The most recent reading of -0.02 continues that trend.
What’s particularly notable is the contrast with mid-2025, when the premium stayed consistently positive throughout Bitcoin’s rally toward $125K. The current persistent negativity suggests US market participants remain on the sidelines or are actively distributing, which makes any sustained recovery harder to justify from a demand perspective. Therefore, the price would need to clear key resistance levels before US investors’ sentiment shifts bullish again.

The post Bitcoin Price Analysis: BTC Must Break This Level to Reverse the Bearish Trend appeared first on CryptoPotato.
XRP has been in a sustained downtrend since its July 2025 peak, losing ground against both the dollar and Bitcoin over the past eight months. With the price still trapped below key moving averages and inside a descending channel, the broader structure remains bearish heading into the final stretch of Q1 2026.
Ripple Price Analysis: The USDT Pair
XRP is trading around $1.42 after bouncing from the February low near $1.20, a level that has held as key horizontal support. The recovery, however, remains shallow. The price is still well beneath the 100-day and 200-day MAs sitting near $1.80 and $2.10, which represent the next major resistance levels to watch.
A sustained close above $1.80 would be the first sign of bullish momentum returning, while a breakdown below $1.20 exposes XRP to a retest of the $1.00 psychological level and even drop much deeper. The RSI has also recovered from deeply oversold territory but is hovering around the midpoint, offering no clear directional conviction just yet.
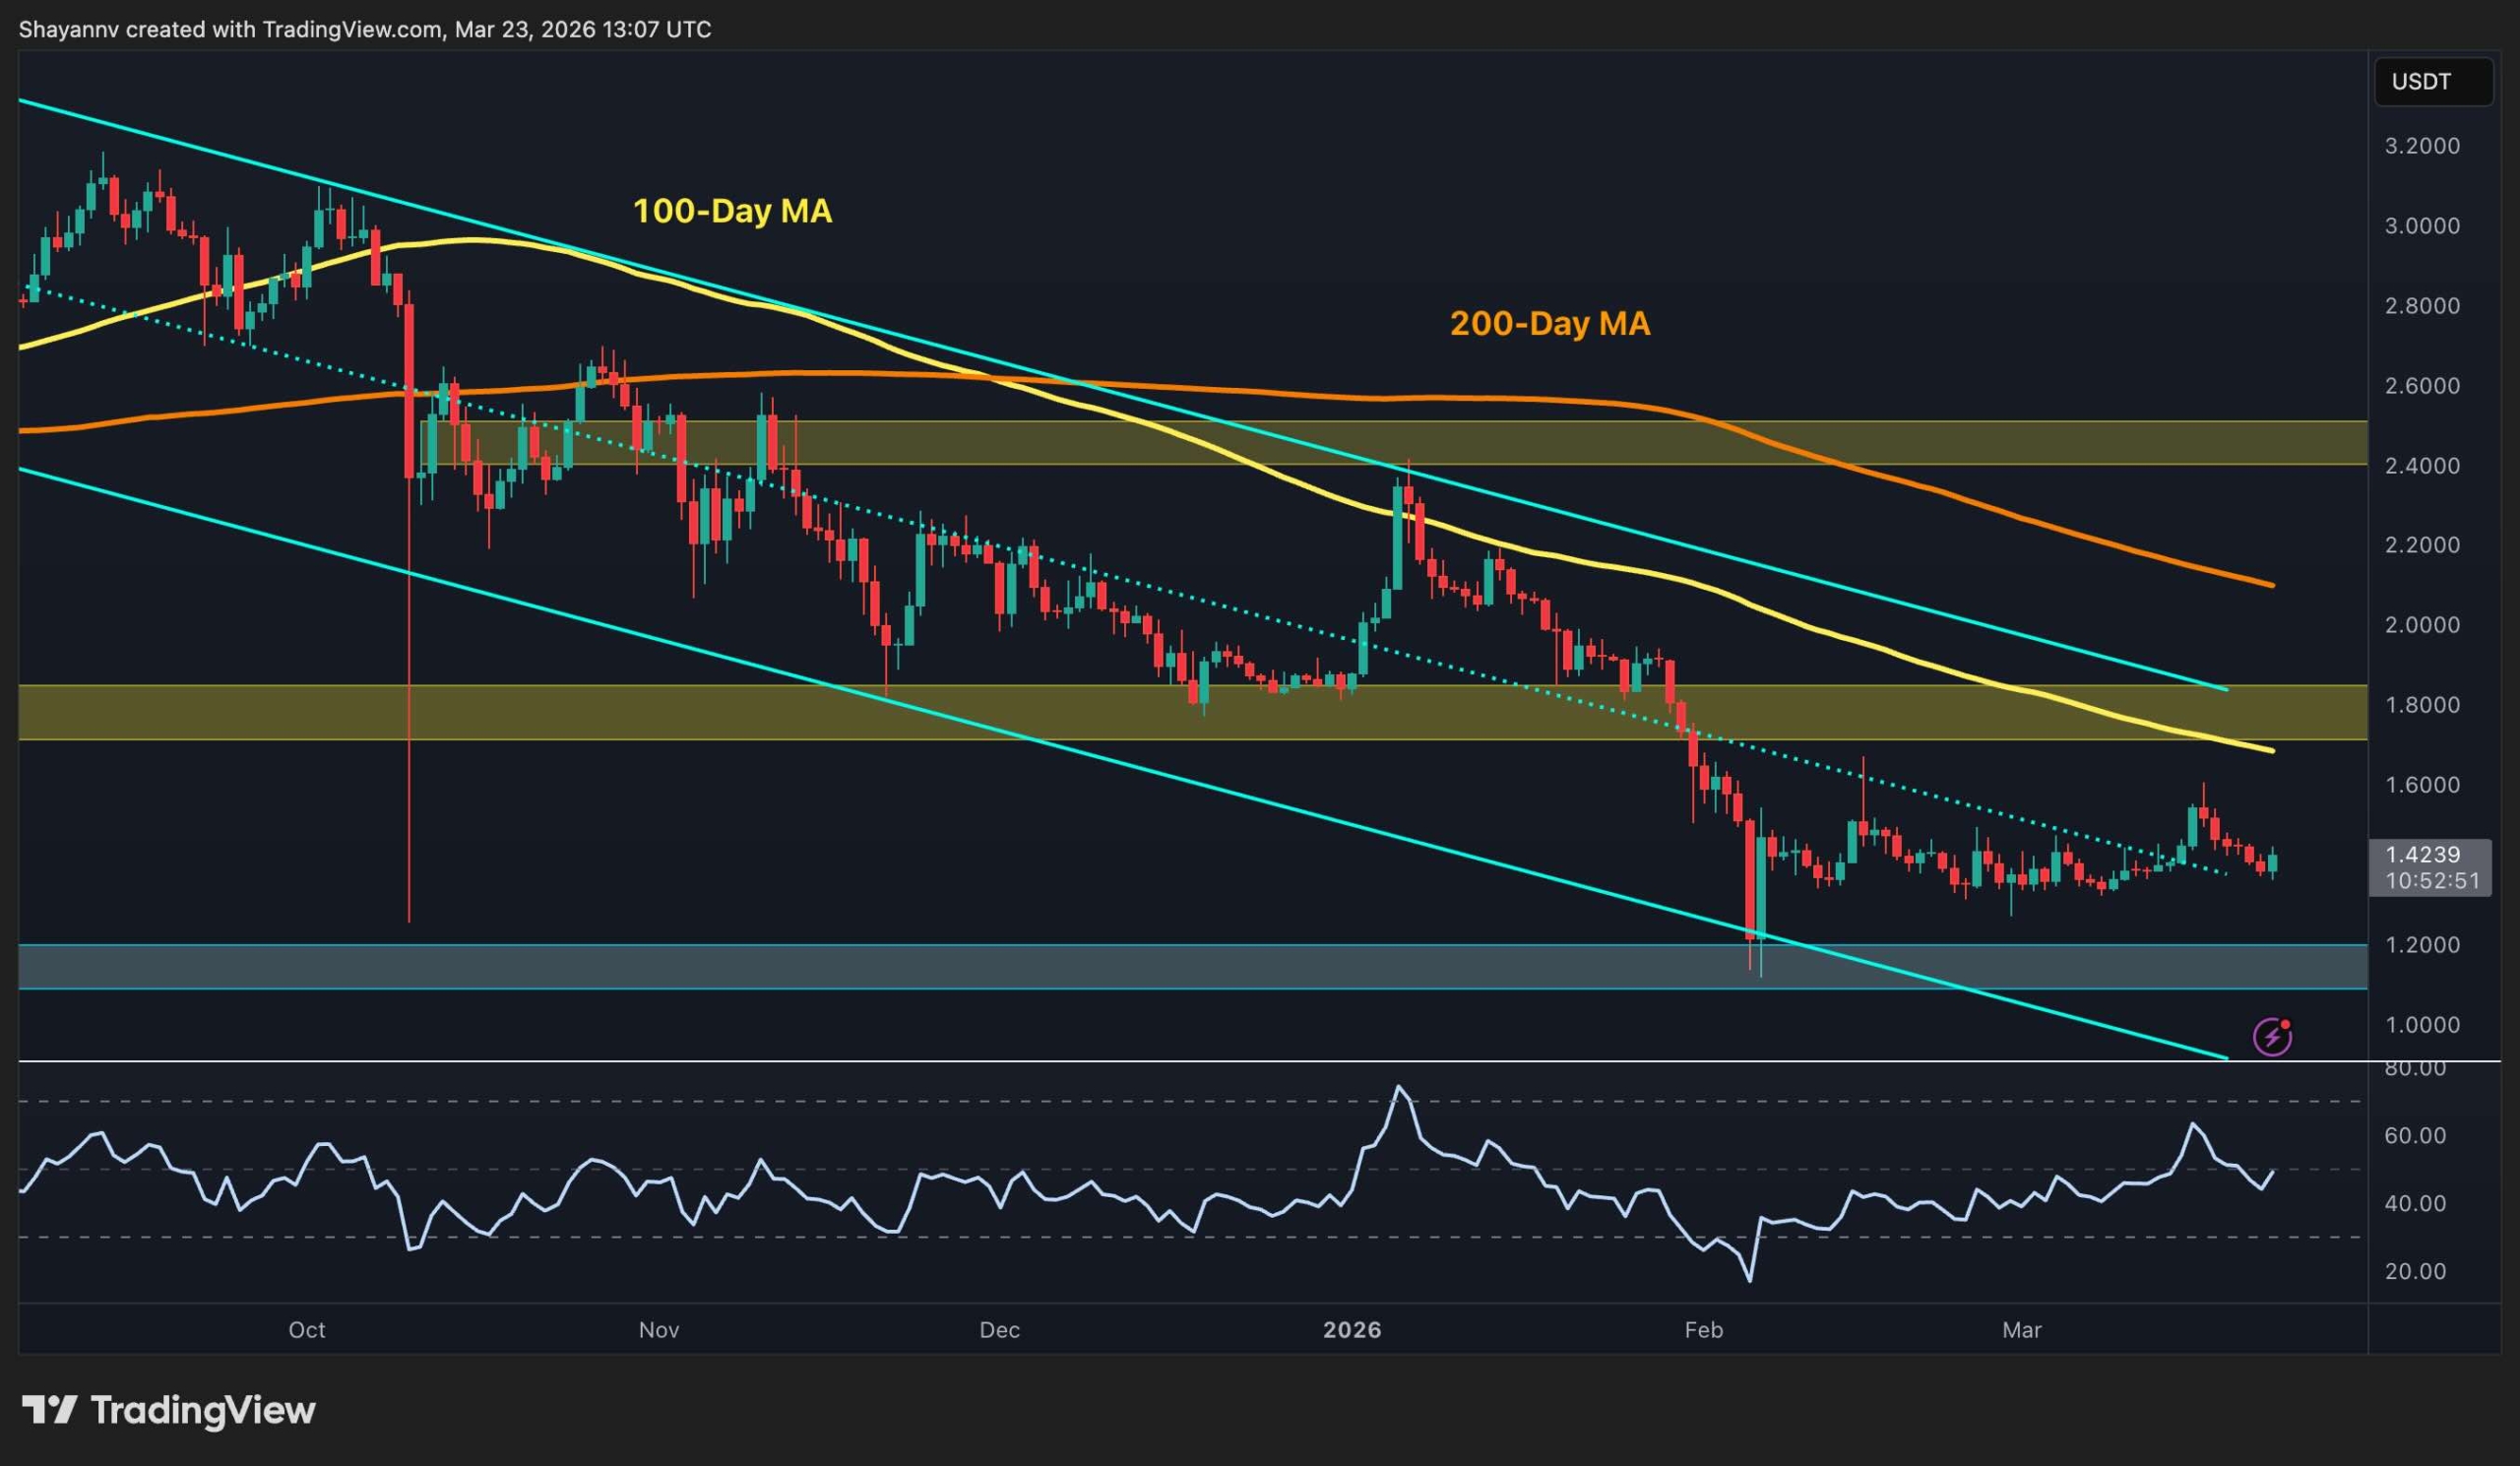
The BTC Pair
XRP/BTC is hovering near 2,020 sats, deep within a months-long descending channel and below both the 100-day (2,100 sats) and 200-day (~2,200 sats) moving averages. The resistance band at 2,500 sats has capped every recovery attempt since October 2025.
The 2,000 sats support zone has held on a closing basis, and the RSI is recovering from its most oversold level of the correction cycle, which is a modest positive sign. But unless XRP breaks above the channel’s upper trendline and reclaims the 100-day and 200-day moving averages, the path of least resistance remains to the downside.

The post Ripple Price Analysis: XRP Recoveries Stay Weak Below This Key Level appeared first on CryptoPotato.
Ethereum is attempting to stabilize after an extended corrective phase. The asset is showing early signs of recovery from the $1.8k demand zone. However, despite the recent bounce, the broader market structure remains under pressure, and the current move appears more like a relief rally than a confirmed trend reversal.
The key challenge for bulls lies in reclaiming higher timeframe resistance levels while maintaining momentum. So far, every push upward has been met with selling pressure, suggesting that market participants are still using rallies as exit liquidity.
Ethereum Price Analysis: The Daily Chart
On the daily timeframe, Ethereum continues to trade within a well-defined bearish structure, printing lower highs and lower lows over the past few months. The price remains below both the 100-day and 200-day moving averages, located around the $2.5k and $3.2k marks, respectively. They are acting as dynamic resistance and reinforcing the overall downtrend bias.
The recent bounce from around $1.8k was technically significant, as this level has historically served as a strong demand zone. The move pushed ETH toward the $2.2k–$2.4k resistance region, which aligns with a previous breakdown area and a key supply zone. However, the price action has stalled here, with multiple rejections indicating that sellers are still firmly in control at higher levels.
A decisive daily close above $2.4k would be the first meaningful sign of strength, potentially shifting market structure and opening the door toward the next major resistance at $2.8k. On the downside, if ETH fails to hold above the psychological $2k level, the market could revisit $1.8k. A breakdown below this support would likely accelerate bearish momentum and expose lower levels, potentially triggering panic selling.
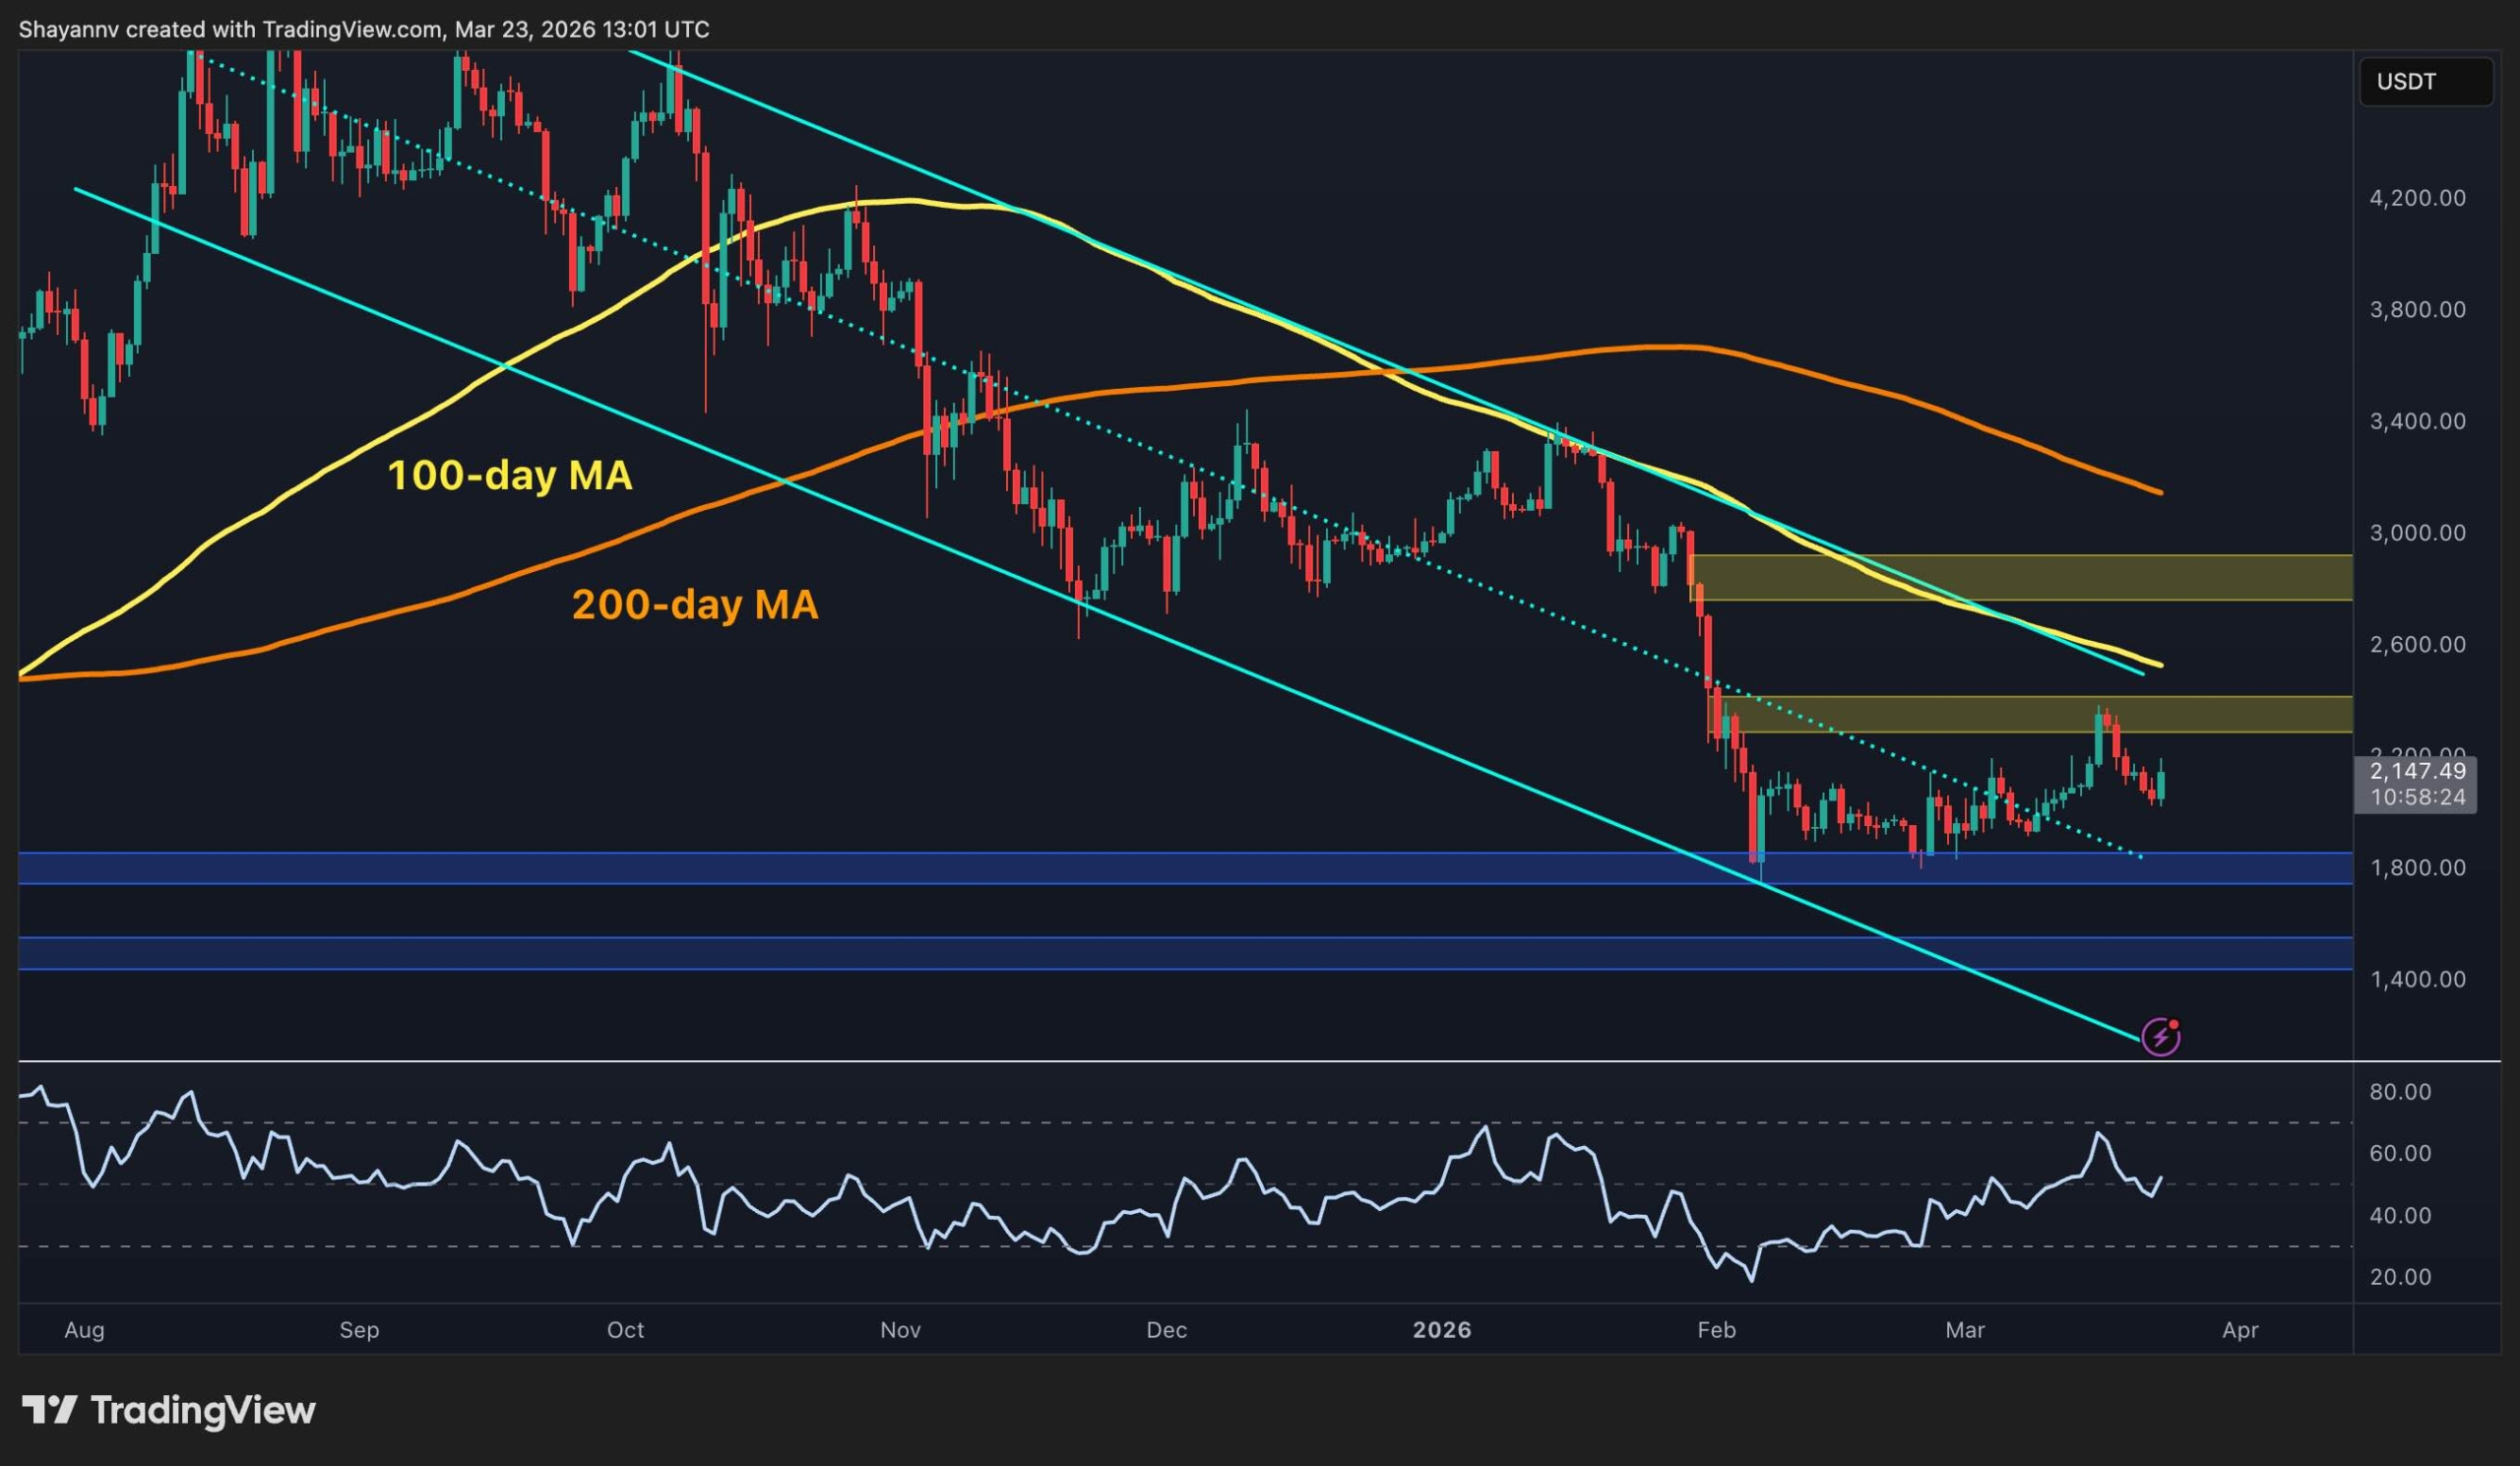
ETH/USDT 4-Hour Chart
Zooming into the 4-hour timeframe, ETH had been forming an ascending channel, which typically signals a controlled bullish retracement within a broader downtrend. This structure was supported by higher lows and relatively steady buying pressure.
However, the recent price action near the $2.3k–$2.4k resistance resulted in a fake breakout, where the asset briefly pushed above the channel resistance and supply zone, only to be quickly rejected. This type of move often traps late buyers and signals exhaustion in bullish momentum.
Following the rejection, ETH dropped back inside the channel and is now trading around $2,150. The loss of momentum is further confirmed by RSI, which showed an overbought signal at the recent highs, indicating that, despite higher prices, buying strength was weakening. Yet, in another interesting development, ETH has jumped significantly from the lower boundary of the channel, indicating that another test of the higher trendline and the $2.4k supply zone could be expected in the coming days.

Sentiment Analysis
From a sentiment perspective, the Taker Buy Sell Ratio has recently shown a noticeable uptick, moving toward and slightly above the neutral 1.0 level after almost 2 years. This indicates that aggressive buyers (market takers) are becoming more active, suggesting a short-term increase in demand.
However, context is crucial. This increase comes after a prolonged period where the ratio remained below 1.0, reflecting dominant selling pressure. In such scenarios, sudden spikes in buying activity during a broader downtrend can sometimes represent short-term relief rallies rather than the beginning of a sustained uptrend.
Additionally, the lack of strong follow-through in price despite rising buy pressure suggests that passive sellers are still absorbing demand. For a more convincing bullish signal, the ratio would need to remain consistently above 1.0 while being accompanied by higher highs in price.

The post The $2.4K Fakeout: Why ETH’s Latest Rally Might Just Be a Bull Trap (Ethereum Price Analysis) appeared first on CryptoPotato.