Cryptocurrency Posts
Crypto Briefing
Phantom's CFTC relief could enhance crypto trading efficiency and innovation, potentially influencing regulatory approaches to digital assets.
The post Phantom secures CFTC no-action relief to facilitate trading with registered brokers appeared first on Crypto Briefing.
RVI's investments in Stripe and ElevenLabs democratize access to high-growth tech sectors, potentially reshaping retail investment dynamics.
The post Robinhood Ventures Fund I invests in Stripe and ElevenLabs appeared first on Crypto Briefing.
Alibaba's Wukong AI platform could redefine enterprise automation, intensifying competition and influencing AI integration strategies globally.
The post Alibaba unveils Wukong AI agent platform ahead of earnings appeared first on Crypto Briefing.
Mastercard's acquisition of BVNK could accelerate the integration of stablecoins into mainstream finance, enhancing global payment systems.
The post Mastercard to acquire stablecoin firm BVNK for up to $1.8B appeared first on Crypto Briefing.
Vietnam's move to regulate crypto exchanges could enhance domestic economic control, reduce capital outflows, and challenge foreign dominance.
The post Vietnam shortlists firms for first regulated crypto platforms appeared first on Crypto Briefing.
Bitcoin Magazine
Bitcoin Magazine

Strategy (MSTR) is About to Have More Bitcoin Than BlackRock’s IBIT
Strategy (MSTR) is closing in on BlackRock’s iShares Bitcoin Trust (IBIT), with the gap in Bitcoin holdings shrinking to a level that could be erased within the next couple of weeks.
Recent data shows IBIT holding roughly 781,000 BTC, while Strategy holds about 761,000 BTC. The difference, now around 40,000 BTC, has tightened as Strategy accelerates its accumulation pace, according to investor Mark Harvey.
The shift reflects diverging models. IBIT holdings rise and fall based on investor inflows and outflows into its spot ETF, while Strategy raises capital through equity and preferred share issuance to fund direct Bitcoin purchases.
This allows Strategy to acquire Bitcoin independent of ETF demand cycles.
Strategy has added significant volume in recent weeks, including two multibillion-dollar purchases in March that pushed its total higher. Last week, the company bought 2,337 bitcoin for about $1.57 billion.
The company continues to frame its performance around Bitcoin accumulation and “BTC Gain” as a proxy for net income under its Bitcoin-centric strategy.
Over the first two weeks of March 2026, Strategy acquired 40,332 BTC and posted a 3.0% yield, reinforcing its aggressive treasury approach, according to Michael Saylor.
Year to date, the firm has accumulated 88,568 BTC with a 3.4% yield, signaling sustained momentum behind its balance sheet transformation.
NEW: Michael Saylor's Strategy could surpass BlackRock's BTC holdings in the next couple weeks
— Bitcoin Magazine (@BitcoinMagazine) March 17, 2026pic.twitter.com/7i70XB0pBN
Bitcoin and Strategy’s strong March
Bitcoin has posted eight consecutive days of gains, a rare streak seen only 15 times since its creation, with past instances delivering a median 30-day return of about 19%, according to Bitcoin Magazine Pro data.
Bitcoin recently climbed from below $66,000 to $76,000 before easing back near $73,800, even as historical patterns show such rallies can precede sharp pullbacks like the 30% drop four years ago.
Bitcoin’s latest surge comes after the asset bottomed near $63,000 in February during heightened geopolitical tensions linked to the Iran–Israel War.
Since then, prices have staged a steady recovery as macroeconomic conditions stabilized and investor confidence returned.
Bitcoin has outperformed other assets like gold and the S&P 500.
Markets received a boost over the weekend after signs of easing tensions around the Strait of Hormuz, one of the world’s most important oil shipping routes.
For now, traders are watching whether bitcoin price can maintain support above the $72,000 region.
A sustained hold above that level could open the door to a push toward $80,000, which previously acted as a key support zone before the early-2026 correction.
Shares of MSTR are pushing $150 a share today.
This post Strategy (MSTR) is About to Have More Bitcoin Than BlackRock’s IBIT first appeared on Bitcoin Magazine and is written by Micah Zimmerman.
Bitcoin Magazine

Vietnam Begins to Restrict Overseas Crypto Trading, Domestic Licensing Race Accelerates
Vietnam is preparing to restrict access to overseas cryptocurrency platforms as regulators push forward with a plan to launch the country’s first licensed digital asset exchanges, according to a government document reviewed by Reuters.
The Ministry of Finance is drafting rules that would prohibit Vietnamese citizens from trading on foreign exchanges such as Binance, OKX, and Bybit. The move aligns with a five-year pilot program designed to bring crypto trading under domestic supervision while limiting capital outflows.
The policy shift comes as Vietnam ranks among the most active cryptocurrency markets globally. Data from Chainalysis shows Vietnamese users transacted more than $200 billion in digital assets in the 12 months through June 2025, placing the country fourth on its global adoption index. Crypto usage in Vietnam spans remittances, savings, and gaming, reflecting integration into daily financial activity.
Under the proposed framework, only locally licensed platforms would be permitted to operate, requiring users to migrate away from international exchanges.
Authorities say the approach aims to strengthen oversight, reduce fraud risks, and retain transaction-related revenue within the domestic economy.
A Vietnamese crypto licensing arms race begins
At least five firms have passed an initial qualification round for exchange licenses, including affiliates of Techcombank, VPBank, and LPBank, along with VIX Securities and Sun Group.
The licensing regime sets a high bar for entry. Applicants must meet a minimum charter capital requirement of 10 trillion Vietnamese dong, or roughly $400 million, and comply with strict standards covering governance, cybersecurity, and anti-money laundering controls. Foreign ownership is capped at 49%, signaling a preference for domestic control over key market infrastructure.
The effort builds on a legal shift that began in 2025, when Vietnam’s National Assembly recognized crypto assets as property under the Law on Digital Technology Industry. While cryptocurrencies remain non-legal tender, the change established a foundation for regulated market development.
Officials and industry representatives say restricting offshore trading could redirect liquidity toward domestic platforms, though it may limit access to global markets.
Authorities are also considering a tax framework that could include a levy on crypto transactions conducted through licensed exchanges. Details remain under review as regulators finalize the structure of the pilot program.
The first licensed exchanges could launch as early as March 2026. The outcome of the pilot is expected to shape Vietnam’s long-term approach to digital asset regulation and position the country within the broader Southeast Asian crypto market.
This post Vietnam Begins to Restrict Overseas Crypto Trading, Domestic Licensing Race Accelerates first appeared on Bitcoin Magazine and is written by Micah Zimmerman.
Bitcoin Magazine

Capital B Raises €3 Million to Expand Bitcoin Treasury Holdings
Capital B, also known as The Blockchain Group, announced a €3 million capital raise on Tuesday alongside amendments to existing convertible bonds, as the company moves to accelerate its Bitcoin treasury strategy.
The Paris-listed firm said the financing includes €2 million raised through share subscription warrants subscribed by TOBAM and €1 million from UTXO Management. The transaction is structured through the issuance of 27.39 million warrants, each priced at €0.11 and exercisable into ordinary shares.
According to the company, proceeds from the raise could support the acquisition of approximately 36 additional bitcoin, potentially bringing total holdings to 2,880 BTC. The move aligns with Capital B’s stated objective of increasing bitcoin exposure on a per-share basis over time.
Alongside the capital raise, the company also announced adjustments to the conversion prices of three tranches of convertible bonds subscribed by TOBAM.
The conversion price for the A-03 tranche was reduced from €6.24 to €3.12 per share, while A-04 was adjusted from €5.174 to €2.59, and A-05 from €3.656 to €1.83.
The revised terms also introduce additional incentives for bondholders. Upon conversion, each bond will now grant a share subscription warrant with a two-year maturity. In addition, conversion conditions tied to share price thresholds have been removed for the A-03 and A-04 tranches, allowing holders to convert at any time.
Europe’s first Bitcoin Treasury Company
Capital B said the changes are intended to enhance flexibility for investors and support the execution of its treasury strategy. Capital B has positioned itself as Europe’s first “Bitcoin Treasury Company,” a model focused on accumulating bitcoin as a core balance sheet asset while growing bitcoin per fully diluted share.
The exercise price of the newly issued warrants will be set at the higher of €1.01 or a metric tied to the company’s bitcoin holdings, referred to as “mNAV 1.1.” This metric reflects a 10% premium to the per-share value of the company’s bitcoin reserves, calculated on a fully diluted basis.
The transaction was carried out under an existing shareholder authorization granted at the company’s June 2025 general meeting, allowing for capital increases without preferential subscription rights for existing shareholders in favor of specific investors.
Capital B operates across multiple business lines, including data intelligence, artificial intelligence, and decentralized technology consulting, but has started to work on bitcoin accumulation as a central component of its corporate strategy.
The announcement reflects a broader trend of companies adopting bitcoin-focused treasury strategies, using capital markets instruments to increase exposure to bitcoin.
Yesterday, Strategy, led by Michael Saylor, disclosed the purchase of 22,337 additional bitcoin for approximately $1.57 billion.
The acquisition increased the company’s total holdings to 761,068 BTC, with a combined market value of roughly $50 billion.
Disclaimer: Bitcoin Magazine is owned by Nakamoto Inc. (NASDAQ: NAKA). Nakamoto Inc. also owns UTXO Management.
This post Capital B Raises €3 Million to Expand Bitcoin Treasury Holdings first appeared on Bitcoin Magazine and is written by Micah Zimmerman.
Bitcoin Magazine

Bitcoin Price Surges Above $75,000 as Bullish Momentum Builds
The bitcoin price climbed above $75,000 on Monday evening extending a sharp rebound that has lifted the asset nearly 25% from its February lows and reignited bullish sentiment across the crypto market.
The world’s largest cryptocurrency broke through the psychological $75,000 level during U.S. trading hours after spending several weeks consolidating in a tight range.
The move marks Bitcoin’s strongest price since early February and reflects improving risk appetite across global markets.
Bitcoin price’s latest surge comes after the asset bottomed near $63,000 in February during heightened geopolitical tensions linked to the Iran–Israel War. Since then, prices have staged a steady recovery as macroeconomic conditions stabilized and investor confidence returned.
Bitcoin’s price has outperformed other assets like gold and the S&P 500.
Markets received a boost over the weekend after signs of easing tensions around the Strait of Hormuz, one of the world’s most important oil shipping routes.
Two commercial tankers reportedly transited the waterway on Sunday for the first time since the conflict began, after Iran indicated its shipping restrictions would apply only to vessels linked to its adversaries.
JUST IN: Bitcoin pumps back to $75,000!
— Bitcoin Magazine (@BitcoinMagazine) March 17, 2026pic.twitter.com/Tqz6rwTTGg
Strategy buys into the bitcoin price game
At the same time, corporate demand for bitcoin continues to expand. Earlier Monday, Strategy, led by Michael Saylor, disclosed the purchase of 22,337 additional bitcoin for approximately $1.57 billion.
The acquisition increased the company’s total holdings to 761,068 BTC, with a combined market value of roughly $50 billion.
Institutional interest is also building internationally. Tokyo-listed investment firm Metaplanet recently secured about $255 million from global investors to accelerate its bitcoin treasury strategy, with additional warrants that could raise total funding to more than $530 million for future purchases.
Despite the rally, market participants remain cautious about declaring a full breakout.
Bitcoin price experienced several rebounds of similar magnitude during the 2022 crypto downturn before eventually falling to cycle lows below $16,000 following the collapse of FTX.
For now, traders are watching whether bitcoin price can maintain support above the $75,000 region. A sustained hold above that level could open the door to a push toward $80,000, which previously acted as a key support zone before the early-2026 correction.
Jack Mallers, CEO of Strike, has recently argued that the current market structure favors long-term accumulation, urging investors to “turn on your DCA,” referring to the dollar-cost averaging strategy of buying Bitcoin prices at regular intervals regardless of price.
According to Mallers, bitcoin price is trading near historically important support zones and prolonged consolidation periods often provide some of the best opportunities to steadily accumulate the asset ahead of major market moves.

This post Bitcoin Price Surges Above $75,000 as Bullish Momentum Builds first appeared on Bitcoin Magazine and is written by Micah Zimmerman.
Bitcoin Magazine

Bitcoin at Key Support Levels — Why Jack Mallers Says Turn On DCA Now
Few people are as close to the center of the Bitcoin industry as Jack Maller. A young, tech-savvy CEO of a major Bitcoin exchange in the United States, partnered with Tether, the most profitable company in recent history, the son of Chicago traders, Jack, is plugged in. In his podcast, BLABLA, he has been ringing the bell over the past few weeks, “It’s time to turn on your DCA”.
But what does DCA even mean? An acronym for “dollar cost average,” it is an investment strategy ported into Bitcoin that has become the gold standard recommendation to Bitcoin fans across the industry. Turning on your DCA means buying bitcoin on a regular basis, regardless of the price. Why does this work? Well its quite simple actually. If you buy regardless of the price on a weekly basis for example, you will buy as much of the lower prices as you will the higher ones. In fact, bitcoin tends to spend significant portions of time in ‘consolidation’, which is another word for neither going up nor down, but rather going sideways. This is a great opportunity to accumulate sats.
Every time you buy bitcoin at a price lower than you bought before, you are lowering your ‘dollar cost average’ or rather, the average cost of your total bitcoin in dollar terms. Eventually, because of Bitcoin’s unmatched and inelastic scarcity, combined with its network-like growth, the price tends to go up, and when it goes up, it does so quickly. Most people miss the opportunity to buy at the perfect time, right before a major move up. But Bitcoiners doing DCA will already have an optimal average price, perfectly set up to profit from a large move up. As a result, you can end up with an average purchase price curve that looks something like this, right before a major bull run.

There are other profound benefits to the Bitcoin DCA strategy. Because it involves small, manageable investments over a long period of time, the amount risked at any single point in the investment journey is relatively small. Investing, for example, 10% of your disposable income a month in Bitcoin would not be a heavy burden, making bear markets not just tolerable but actually turning them into incredible investment opportunities.
Multiple exchanges have also implemented automated Bitcoin DCA features, such as Kraken, Strike, Swan, and Bull Bitcoin, which cover many countries throughout the world. The automated aspect of this strategy can not be overstated. Compared to the high stress, intense cognitive load of a professional trader, automated Bitcoin DCA is a walk in the park, and it yields comparable results!
Books like The Art of Execution cover long-term studies done on professional traders on Wall Street, demonstrating that most lose money, and of those that do earn money, lose for 10 years straight before becoming good enough to make it. The human capital required to become a good trader is not cheap, but Bitcoin DCA is set it and forget it; you can go do something else with your life while your Bitcoin stack grows.
You can calculate the long-term value of the Bitcoin DCA strategy with a variety of tools online, such as this BM Pro calculator which lets you see what would have happened if you had started buying say $100 of Bitcoin every two weeks, back in 2017. Needless to say, the results are incredible.

In recent years, Gold has started performing very well with DCA as well, but those calculations are mostly dwarfed by its meteoric rise in 2025. Historically, Gold has much longer cycles than Bitcoin, and can easily stay still for many years after a big move, being the giant that it is. Whereas Bitcoin has a lot more upside overall and its cycles are much shorter, arguably leading to better returns if played right.
Now Is The Time To Start Your DCA
Why now, you might ask? Isn’t it always good to have your Bitcoin DCA on? Well, there’s a great question, and implicit in Jack Maller’s quote, the answer is no. Technically, you can start your DCA at the top of a bull market and end up with a great average down purchase price by the time the next bull market takes off. But you certainly would be better off not buying the top.
The following is not investment advice and does not represent the opinion of Bitcoin Magazine or BTC Inc. They are the opinions of the author alone.
The problem, of course, is that no one knows where the top of the market is; if they did, they’d be rich! Their strategy would get discovered, replicated by others, removing its competitive advantage over time. That’s the nature of markets; secret knowledge only works while it is secret. When it becomes public, the rest of the market adapts.
Since Bitcoin DCA does not attempt to price the top, it avoids the issue entirely. But many people turn off DCA when they feel the market is nearing a top, and tops historically only happen after crossing the previous all-time high price from a previous cycle. So, despite the math, some do turn off their DCA, only to turn it back on when a clear bear market has begun.
So is Bitcoin in a bear market? Sort of. The price is down 50%From the top, but it also dropped very quickly, suggesting a reaction to larger macro events, which in turn means that most of the pain is likely behind us. There’s also a variety of technical price indicators that are flashing green, suggesting we are far closer to the bottom than we are to the top. In other words, it is time to get in.

Weekly RSI, a momentum indicator, is in oversold territory historically for Bitcoin. You can go back a decade in Bitcoin, and every time the weekly RSI reaches levels this low, it signals a bottom. The Mayer multiple, which compares Bitcoin to the 200-day moving average, is also in the buy zone territory.


The fear and greed index for Bitcoin and the broader crypto market has been at extreme fear for a while now, and you know what they say. If there’s blood on the streets, it’s time to buy.
There’s also a historical analysis that looks at percentage-based corrections in Bitcoin from the top of the market to the bottom. These corrections tend to be smaller over time, with the last bear market drawdown going as far down as 77%. We are currently at about 51% correction, if we were to go down 70%, it would mean we are already more than half way down. So closer to the bottom than we are to the top.


Notice we are already halfway through the Bitcoin halving cycle as well, with the next halving expected in early 2028. The last halving was anticipated with bitcoin making all-time highs near the halving, as the metric has become widely known, for the same reasons, we might see an anticipation of the halving again this cycle. Historically speaking, we are not likely to see a correction deeper than 70% from the top, an extreme scenario that would push Bitcoin to $40,000 temporarily.
Dips of the sort are also less likely given the institutional adoption of Bitcoin, which has massively expanded the liquidity of this market. If we did go that far down, those prepared to buy would find an incredible opportunity, but it would be speculation and a trading mindset to try to catch the absolute bottom, hence why low-risk, consistent DCA is so great.
Finally, we have the death cross and colden cross combo. Pitting off the 50-day moving average versus the 200-day moving average leads to a fairly predictable dynamic. Markets sell before the 50-day crosses below the 200-day. And they pump before the 50-day crosses above the 200-day. Bitcoin has now crossed above the 50 day moving average, if it can stay there or continue to consolidate around the $70,000 mark, it will be very well positioned for a run up deeper into 2026 as the golden cross occurs, probably signaling the beginning of a new bull market.

Macro Economic Trends
AI stonks have been soaking up a lot of liquidity and investment this cycle, with roughly a trillion dollars invested in AI infrastructure in the past handful of years. The market is broadly bullish on AI continuing its disruption path. I don’t think it takes a genius to say that an “AI fear and greed index” would be way over on the greed side right now. It may be that AI has brought us to a new paradigm of only up for AI stocks and tech, but that kind of thinking is usually a sell sign. If there is some sort of event in the next year or two akin to the dot-com crash that leads to a serious AI correction, we may see speculative and investment capital look for other options beyond AI, bringing liquidity back to Bitcoin. Though it is arguably still early to call this.


Meanwhile, U.S. debt yield, or the interest on the debt of the U.S. Government, has stalled out with signs from the FED that lower rates are coming. Trump nominated Kevin Warsh as the next Chair of the Federal Reserve back in January, and his confirmation — while stuck in the Senate — is likely to go through soon, signaling a looser monetary policy, aligned with Trump’s broader economic strategy, which favours lower interest rates and more money printing, coupled with aggressive growth and deregulation.
The Fed funds’ effective fund rate is also trending down, signaling cheaper money coming into the market, likely in part due to more money printing by the Fed, since U.S. bonds are not particularly attractive to foreign investors during this time of geopolitical tension.

Fundamental Analysis
As far as fundamental trends or changes to Bitcoin, the only question that has emerged is in relation to quantum computing and whether it can break Bitcoin’s cryptography. This fear, uncertainty, and doubt (FUD), while new to many investors, is not new to Bitcoin technologists. Broad consensus within the Bitcoin industry remains that quantum computing advancements remain mostly hype and have a long way to go before they become a threat to Bitcoin.
Meanwhile, Bitcoin core developers have been actively discussing long-term solutions to quantum for at least a couple of years now, though as far back as the Satoshi era. Formal improvement proposals have already been drafted, and software is well on its way to reach maturity, should it be needed to deal with a quantum threat. So overall, investors who sold due to quantum FUD might find themselves on the wrong side of the trade.
The Barrier To Entry Into Bitcoin
So yes, most signs suggest that it is time to turn on your Bitcoin DCA. And the good news is, there are only a couple of things people need to really understand about Bitcoin to benefit from it. Why is its supply limited, and how does it remain limited? And how to protect it long term via good self-custody. These essential skills in Bitcoin are not trivial to acquire; they do demand some study and interest from investors, but they are simple hobbies compared to the knowledge requirements of becoming a professional trader or investor who can survive the volatility and unpredictability of the market.
In terms of understanding Bitcoin’s economics, Bitcoin Magazine has a premium selection of books on the topic, any of which is likely to give you the fundamentals and much more in an eloquent and enjoyable way. And when it comes to self-custody, Bitcoin Magazine also has a fresh review of excellent tools, written by yours truly, for the year 2026.
This post Bitcoin at Key Support Levels — Why Jack Mallers Says Turn On DCA Now first appeared on Bitcoin Magazine and is written by Juan Galt.
CryptoSlate
For most of its life, Solana's brand was straightforward: fast infrastructure for whatever crypto wanted to do at volume.
By year four, that mostly meant memecoins, and it stayed that way until year five.
Solana became known for being the infrastructure for high-profile, and sometimes controversial, memecoin launches. A few cases include President Donald Trump-linked TRUMP memecoin and the LIBRA token endorsed by the Argentinian president, Javier Milei.
Blockworks data showed that memecoins accounted for nearly 30% of Solana's average monthly DEX activity in 2025. The reputation of an on-chain casino was accurate.
Although the brand hasn't flipped, something else happened: institutions started building there anyway.
In January 2026, Ondo brought more than 200 tokenized US stocks and ETFs to Solana, backed 1:1 by securities held with US-registered broker-dealers.

WisdomTree enabled native minting of its tokenized funds on the network, with institutional clients able to purchase, hold, and manage positions on-chain.
Solana's February payments report said Visa, PayPal, and Worldpay are building across treasury management, remittances, payouts, and merchant settlement.
Citi explored tokenizing bills of exchange for trade finance in collaboration with PwC and Solana.
The re-rating case: serious money no longer requires degen activity to disappear first.
The barbell takes shape
What makes this move non-obvious is that Wall Street didn't wait for cultural cleansing.
Traditional finance infrastructure often demands sterile environments before deployment, as banks don't typically move into venues where 70% of monthly trading activity involves tokens named cartoon frogs.
However, Solana's institutional adopters appear to have made a different calculation: they need fast settlement, low fees, and liquid rails more than they need brand distance from speculation.
The tokenized stocks structure reveals that logic. Ondo's implementation runs mint and redeem windows 24/5, with on-chain transferability between those windows.
Registered broker-dealers hold the securities, and the blockchain handles the movement layer. That separation lets institutions use Solana's speed without adopting its culture.
WisdomTree's move carries similar implications. The firm extended its existing tokenized fund infrastructure to include Solana as a venue for minting and management.
Institutional clients can now buy, hold, and manage positions there alongside whatever else lives on the network.
The SEC granted special relief allowing intraday trading in tokenized shares of WisdomTree's money market fund, indicating that regulators are working with these structures.
The payments narrative follows the same pattern.

Visa said US banks started settling with it in USDC over Solana, while Worldpay said merchants will be able to settle with USDG on Solana. PayPal positioned PYUSD on Solana to make the stablecoin faster and cheaper for commerce.

These firms needed to process transactions reliably at scale, with the memecoin narrative becoming irrelevant.
| Company / Project | What launched on Solana | What it signals | Key detail |
|---|---|---|---|
| Ondo | 200+ tokenized U.S. stocks and ETFs | Capital markets distribution | Backed 1:1 by securities with U.S.-registered broker-dealers |
| WisdomTree | Tokenized funds | Regulated fund infrastructure | Native minting and institutional position management on-chain |
| Visa | USDC settlement | Treasury / payments rail | U.S. banks settling with Visa over Solana |
| Worldpay | USDG merchant settlement | Merchant payments | Settlement layer for commerce |
| PayPal | PYUSD on Solana | Faster/cheaper payments | Commerce-focused stablecoin usage |
| Citi + PwC | Bills of exchange tokenization exploration | Trade finance | Institutional experimentation |
Why the infrastructure play works
The financial argument for Solana turns on distribution.
Ethereum still holds about $15.6 billion in tokenized asset value excluding stablecoins, according to RWA.xyz, compared to Solana's $1.84 billion. BNB Chain sits between them at roughly $2.95 billion.
Jupiter, Solana's primary DEX aggregator, provides a consumer-facing onramp for tokenized products that Ethereum's infrastructure doesn't readily support.
Ondo's tokenized stocks launched via Jupiter integration, allowing retail users to access these securities through the same interface they use for memecoin trading.
That creates distribution power: the same wallets, the same UX, and the same liquidity sources applied to regulated securities.
The payment volume supports the rail thesis more than any single product launch.
Solana processed $650 billion in stablecoin transactions in February 2026, more than doubling its previous record, while stablecoin supply exceeded $15 billion.
Those figures show the network already handles money-like flows at an institutional scale, which makes the “financial rail” framing plausible.
RWA.xyz shows about $1.68 billion of Solana's $1.84 billion tokenized asset value as distributed on-chain, roughly 91.6% in portable form.

The 30-day RWA transfer volume surpassed $2 billion. For comparison, the entire tokenized stocks category across all chains is valued at about $1.08 billion. It has a monthly transfer volume of $2.3 billion, with Ondo holding roughly $644 million and about 60% platform market share.
These numbers demonstrate that tokenized assets on the network move at a meaningful scale.

Macro forces behind the bet
Solana's institutional turn sits within a broader recalibration.
McKinsey's base case projects roughly $2 trillion in tokenized assets by 2030, with a range of $1 trillion to $4 trillion. BCG forecasts that tokenized fund AUM alone could exceed $600 billion by 2030.
Citi's 2030 stablecoin outlook raised its issuance forecast to $1.9 trillion base case and $4 trillion bull case, with potential transaction activity reaching $100 trillion to $200 trillion.
Those projections assume blockchains transition from an asset class to a market infrastructure.
Besides, regulatory conditions turned in Solana's favor. On Mar. 5, the FDIC, Federal Reserve, and OCC said eligible tokenized securities should generally receive the same capital treatment as non-tokenized securities, calling the capital rule “technology neutral.”
That removes one barrier to participation in traditional institutions: banks can now hold tokenized securities without incurring punitive capital requirements simply for choosing blockchain settlement.
Yet despite efforts by names such as Nasdaq, rights structures stay uneven.
McKinsey stressed that regulation-heavy infrastructure creates friction in adoption. Payward recently noted that xStocks have surpassed $25 billion in total transaction volume, including more than $4 billion settled on-chain.
As a result, the landscape is one in which investors are trading billions of dollars‘ worth of tokens that don't yet make them shareholders.
Additionally, the tokenized stocks category stay tiny globally, meaning a single compliance shock or operational failure could upend the entire narrative.
What's open now
Despite not resolving the memecoin-versus-institutions tension, Solana turned the tension into a product.
The infrastructure, now treated as a venue for memecoin launches, hosts over 200 of Ondo's tokenized stocks, WisdomTree's regulated funds, and Visa's USDC settlement flows.
The re-rating case assumes institutions care more about throughput, cost, and liquidity than they care about brand adjacency to speculation.
Solana processed $650 billion in stablecoin transactions last month. It handles a 3,000-fold increase in annual RWA trading volume. It attracted Visa, PayPal, Worldpay, WisdomTree, Ondo, and Citi as active participants.
Taken together, those facts support the rail thesis.
The bear case assumes pilots stay pilots. Announcements multiply, but secondary liquidity stays shallow. Institutions prefer Ethereum for serious size, or they build permissioned systems that avoid public blockchains entirely.

Solana's ex-stablecoin RWA stays below $2.5 billion, while memecoin bursts continue to dominate revenue and public perception.
What determines the outcome is whether banks, asset managers, and payment processors treat blockchain infrastructure as technology or as something chosen for brand alignment.
Solana turns six with both identities intact. The memecoin casino still operates at full volume, while Wall Street built its infrastructure on top of it anyway.
The post As Solana turns six years old, the “memecoin chain” is quietly listing 200 plus tokenized stocks for Wall Street appeared first on CryptoSlate.
Michael Saylor’s Strategy bought 22,337 Bitcoin for about $1.57 billion last week, using a funding mix led by its variable-rate perpetual preferred stock, STRC.
The March 16 announcement showed the company paid an average of $70,194 per Bitcoin in the purchase. The buy lifted Strategy’s holdings to 761,068 Bitcoin, valued at about $56.5 billion at prevailing prices, and ranked among the five largest single-week acquisitions in the company’s history.
The financing mix carried the more important signal. Strategy sold 11.9 million STRC shares during the previous week for about $1.18 billion of proceeds, or roughly 75% of the cash used for the purchase. Another $396 million came from the sale of 2.8 million shares of MSTR Class A common stock.
For most of the past years, investors could read the Strategy model mainly through MSTR. The company sold common stock into a market that valued the shares at a premium to the Bitcoin on its balance sheet, then turned that capital into more Bitcoin.

STRC expands that model by bringing in a different buyer base, one centered on income-oriented investors seeking yield and principal stability rather than only high-beta Bitcoin exposure. The preferred stock pays an annualized dividend of 11.50%, distributed monthly in cash, and is structured to trade near its $100 par value.
The company has therefore widened the pool of capital it can use for Bitcoin purchases. That shift has been evident in the most recent transactions, where preferred stock provided the majority of the funding.
Notably, the prior week pointed in the same direction. Strategy bought 17,994 Bitcoin for $1.28 billion using a similar mix of preferred and common issuance.
Over the two weeks, the company deployed nearly $2.85 billion, with STRC funding most of it. Thus, this pace has turned STRC from a supporting instrument into a principal financing lever.
STRC becomes a larger part of the machine
The speed of STRC’s growth helps explain why the conversation around Strategy has changed.
On Feb. 1, Strategy reported $3.4 billion of STRC notional outstanding, according to the company’s capital tracker. By March 16, that figure had climbed to about $5.02 billion.

This nearly 50% increase in six weeks gave Strategy a larger preferred base to tap at a time when it was accelerating Bitcoin purchases.
Saylor underlined that momentum in a post on X, saying STRC is now the most liquid preferred stock by trading volume, ahead of offerings from Kohlberg Kravis Roberts & Co. and Boeing.
Notably, Strategy also said its Bitcoin per share increased 3.0% in the first two weeks of March, driven by growing demand for STRC.

Adam Livingston, a Bitcoin analyst, argued that the instrument’s scaling could reshape Strategy’s BTC buying power.

According to him:
“The growth of STRC will be crazy…Strategy could add $40 BILLION of Bitcoin this year. For sure.”
Livingston’s estimate was based on a conservative scenario. He noted that Strategy raised $1.557 billion from STRC over the last two weeks and said that, even if the company maintained that pace for only 20 of the 41 remaining weeks in the year, it would still raise about $16 billion from STRC alone.
His framework then added the possibility of growth in the preferred program, fuller months of STRC issuance, and additional MSTR sales.
Livingston’s estimate is an outside view rather than company guidance, but the recent funding mix helps explain why it has gained traction.
Strategy now sells common stock for momentum-driven capital and preferred stock for yield-seeking capital, then converts both into Bitcoin. A larger preferred channel means the company can fund additional purchases without relying as heavily on common issuance every time it wants to expand the treasury.
The climb toward 1 million Bitcoin
The accelerated funding mechanism places Strategy on a trajectory to reach 1 million Bitcoin by the end of the year.
From Feb. 1 to March 16, the company added 47,566 Bitcoin, averaging about 1,081 Bitcoin per day.
To reach 1 million Bitcoin by Dec. 31, Strategy would need another 238,932 Bitcoin, which works out to about 824 Bitcoin per day for the rest of the year. The required pace sits below what the company has sustained since early February.
Meanwhile, the cost of that target remains large. At a Bitcoin price of about $73,369, buying 238,932 Bitcoin would require about $17.53 billion. At $85,000 per Bitcoin, the figure rises to about $20.31 billion.
Reaching the 1 million threshold would give MicroStrategy control over 4.76% of Bitcoin’s maximum supply of 21 million coins, an increase from its current 3.62% share.
Following the 2024 halving event, miners are expected to produce only about 130,500 new Bitcoins between mid-March and the end of the year.
To meet its target, Strategy would need to absorb 183% of all newly mined coins during this period, requiring significant purchases from the existing secondary market.
Meanwhile, Rachael Lucas, an analyst at BTC Markets, said the current pace also has implications beyond the 1 million mark.
She said that at Strategy’s recent daily acquisition rate, the company could surpass the estimated 1.1 million Bitcoin attributed to Bitcoin’s pseudonymous creator, Satoshi Nakamoto, as early as March 2027.
In the near term, the company’s pace also puts it on a trajectory to overtake BlackRock’s iShares Bitcoin Trust, the largest Bitcoin fund, which held about 571,700 Bitcoin as of press time.
On current momentum, Strategy’s lead over other corporate holders and large fund vehicles would continue to widen.
The case for 1 million Bitcoin, therefore, rests on more than one large weekly purchase. It rests on whether Strategy can keep raising capital at a rate that supports sustained buying into a market with limited incremental supply.
Premium and payout pressures remain central
Meanwhile, the accumulation strategy faces specific structural and financial vulnerabilities. The model relies entirely on the market valuing the Bitcoin-focused firm's equity at a premium compared to the underlying BTC on its balance sheet.
Data from Strategy shows that its mNAV stands at 1.18. That premium supports issuance on terms that remain accretive to Bitcoin on a per-share basis.
A sharp compression of this premium, potentially triggered by a decline in Bitcoin prices, rising interest rates, or shifting investor sentiment, would severely restrict the firm’s ability to continue purchasing at the current scale.
Moreover, the reliance on STRC introduces substantial cash obligations. With a notional outstanding amount of $5.02 billion and an annualized rate of 11.50%, the preferred stock generates a cash dividend requirement of approximately $578 million annually, or $48 million per month.
Notably, Strategy has disclosed a $2.25 billion reserve earmarked for preferred dividends and interest on debt.

Still, Jeff Dorman, chief investment officer at Arca, highlighted the long-term solvency concerns tied to the company’s interest expenses.
Dorman stated that the interest coverage ratio is the ultimate determinant of long-term solvency, noting that the firm generates zero earnings before interest and taxes, leaving it without interest coverage.
He also highlighted the growing annual burden of interest and dividend payments, which currently exceed $1 billion, suggesting the firm will eventually exhaust its options to service these obligations.
Considering this, Dorman outlined several potential long-term outcomes for the company. The first scenario involves continuous Bitcoin price appreciation, allowing Strategy to issue equity perpetually to stay afloat. A second path involves the company halting its dividend payments, a move Dorman views as highly logical and certain to end the current accumulation cycle.
In a third scenario, Strategy could sell a portion of its Bitcoin annually to cover payments. Dorman argued this action would immediately destroy the investment narrative surrounding the stock.
However, a fourth possibility entails the company using its Bitcoin to acquire a cash-flowing business to service the debt, transitioning into a BTC-denominated holding company.
Meanwhile, Dorman also noted the possibility of a default if Bitcoin prices crash to levels where the firm’s assets fall below the value of its debt, estimating this threshold around $20,000 per Bitcoin.
Finally, he suggested Bitcoin could evolve into a productive asset, allowing Strategy to earn yield through lending or selling calls to cover its expenses.
Dorman characterized the current structure as a clever arrangement with significant underlying vulnerabilities. He said:
“As I've always said, there are no covenants in the debt that force MSTR to sell the BTC (forced selling is not a risk)… but voluntary selling to cover interest & dividend payments is a real risk. And if you don't believe he will ever do that, then you have to recognize that he will eventually stop the dividend.”
He observed that four distinct stakeholder groups, including BTC holders, MSTR debt holders, the firm's preferred shareholders, and its common shareholders, currently feel secure in their positions.
However, Dorman concluded that these four groups possess conflicting foundational assumptions.
According to him, while these classes can coexist in the near term, they hold mutually exclusive views on the company’s ultimate financial path, creating a fundamental long-term risk for the corporate structure.
The post Strategy on course to hit 1 million BTC this year — and STRC is the clearest reason why appeared first on CryptoSlate.
Bitcoin’s recovery is evolving into a broader market comeback as spot ETF inflows rebound, buyer activity returns after February’s sell-off, and fresh institutional accumulation helps push BTC back above $75,000.
Bitcoin pushed above $75,000 in Asia trading hours, extending a rebound that's getting harder to dismiss as a simple bounce. Wall Street is putting fresh money into spot ETFs, on-chain data is showing buyers are stepping back in, and Strategy is still buying a lot of Bitcoin.
Even mainstream media outlets described Bitcoin as an “oasis of calm” while war-driven volatility rattled almost every other market, a label crypto doesn't usually get during a geopolitical shock.
That's what makes this spike much more interesting than your average green day. There's more than one engine under the hood that's driving Bitcoin out of its winter slump. The price is higher, that's for sure, and trying to breach critical resistance levels that would cement its position in the mid-$70,000s.
But the rally is also being reinforced by ETF flows, renewed buyer aggression, corporate accumulation, and a macro backdrop that makes BTC look like a significantly better investment than almost everything else.
Up until a week ago, you had an easy argument against every bounce, as most were reflex rallies in an extremely oversold market. But this one is harder to dismiss so easily, because the buying is coming from several directions at once.
Wall Street is buying again
The best proof for this lies in ETFs. Farside data shows that spot Bitcoin ETFs saw $199.4 million in inflows on March 16, marking the sixth consecutive day of inflows after two days of heavy redemptions.
As expected, BlackRock's IBIT was responsible for the majority of the intake, seeing $139.4 million in inflows, while Fidelity's FBTC added $64.5 million. Six consecutive green days aren't a fluke, and they show that money is returning to the biggest, most established institutional wrappers.

However, ETFs don't explain every Bitcoin move, and they're not enough to turn every recovery into a full-blown bull rally. What they can tell you is whether institutional capital is joining the move or standing back, and right now it's eager to get a piece of the action.
March inflows have topped $1.34 billion as of press time, taking a sharp turn from February's aggressive withdrawals. After more than a month of fading demand and very little momentum, this sure is a real reset in sentiment.
CryptoSlate has already been tracking that turn. Our March 1 report asked the question whether the signs of rebound the market saw after the February slump were temporary or tactical. And now, just a couple of weeks later, the answer is pretty constructive: the same ETF complex that spent weeks dragging the price down is now giving some ballast to the recovery.
On-chain data shows us that this is a well-fueled recovery. Data from Qryptoquant showed buyer activity has returned after an aggressive selling period in February. While buying pressure remains significantly lower than the peaks we saw last fall, it's still a meaningful change from last month's seller-heavy market.
Having buyers back means there's potential for a stronger rally on a stronger foundation, because price can bounce off short covering alone.

The numbers we're seeing aren't market-changing on their own, but they represent such a sharp turn from Bitcoin's structure just days ago.
That point lands harder because Bitcoin’s structure looked shakier just days ago. Last week, CryptoSlate noted that derivatives were doing much of the work while spot participation lagged as Bitcoin struggled to remain above $71,000.
But the March 1 setup looks much healthier than that. The leverage is still there and won't be going away anytime soon, but it's now joined by ETF inflows and clear on-chain evidence of renewed accumulation.
Bitcoin is getting help from more than one direction
Then there's Strategy. The company bought 22,337 BTC for about $1.57 billion between March 9 and March 15, for an average of $70,194 per coin. That brought its total holdings above 761,000 BTC. At this point, every Strategy purchase adds real demand to the market, which feeds a familiar public narrative of institutional conviction.
Even people tired of Michael Saylor can read the message: a very large balance-sheet buyer isn't treating this move as an opportunity to de-risk and is actively leaning into it. So, the price is up, ETFs are positive, and the largest and loudest corporate bull is still shopping for more BTC.
Macro is doing part of the work, too. Bloomberg reported that Bitcoin was a pocket of calm amid the Iran conflict, which jolted broader markets. A significant part of the market started treating Bitcoin as a hedge against the Iran risk, helping the rest of the crypto market recover even as stocks struggled.
While we're still a long way away from Bitcoin being a textbook safe haven, this decoupling from stocks shows more investors are willing to treat it as a resilient macro asset.

There's still a significant leverage component here. We most likely wouldn't have seen this big a bounce without a significant amount of short liquidations. That's normal in a fast Bitcoin rally, especially in a market that loves derivatives so much.
But the difference here is that short covering no longer carries the whole rebound, as ETF flows are positive, buyers are getting stronger, and a major corporate accumulator is back accumulating. Put all of this together, and you've got a recovery that seems to have finally found its footing.
The hard part's not over yet, though. Bitcoin is still well below its ATH, and a good stretch in March won't erase the weaknesses that built up over the past three months. But today's step is stronger, broader, and easier to believe than any of the other rebound headlines we've seen this year.
The market no longer has to rely on a single explanation; it now has several, and for once, they're all pulling in the same direction.
The post Bitcoin price jumps as global markets shake, fueled by ETFs and institutional buying appeared first on CryptoSlate.
Bitcoin’s power law enters a 2026 stress test as Giovanni’s new chart shifts the debate from price targets to regime signals
Bitcoin Power Law chart creator Giovanni Santostasi has added a new layer to one of crypto’s most durable valuation models.
The chart shifts attention to Bitcoin's movements away from the trend line, with a field of green and red rays that track Bitcoin’s 10-day local growth rate in log-log space against the long-run power-law curve.
For years, the Bitcoin Power Law was mostly shown as a time-based price corridor, with attention fixed on whether spot traded above, below, or near the trend line. Giovanni’s latest version shifts the focus to motion.
In Giovanni’s framing, each ray is a direct measurement of Bitcoin’s local growth rate in log-log space, with angle and length encoding slope. Green marks periods when the price grows faster than the long-run power law, while red marks slower growth or decline.
With 10-day averaging, the chart reads less like noise and more like a vector field around Bitcoin’s long-run power-law attractor.

CryptoSlate’s earlier coverage treated the power law as a framework that could point to six-figure valuations while also warning that it did not encode broader market forces.
Recently, we sharpened the falsifiability question, noting that a prolonged stall near the high-$60,000s would eventually put the model’s rising floor under direct pressure.

In 2026, the live debate is whether the model still helps explain Bitcoin after U.S. spot ETFs, tighter macro linkages, and rising mining difficulty changed the market’s plumbing.
Two current reference points show the tension. A live page from Newhedge places the power-law centerline near $124,477 and the floor near $52,280.
A separate calculator from Bitbo projects a 2026 power-law price of about $142,782. Those levels leave room for both a recovery case and a stress case.
Bitcoin does not need to revisit old highs immediately for bulls to argue the long-run structure still holds. But it also does not need to trade below the floor for critics to say the model has lost day-to-day relevance in an institutional market.
| Reference point | Level | Use in the article |
|---|---|---|
| Live power-law centerline | $124,477 | Shows where the long-run trend sits in 2026 |
| Live power-law floor | $52,280 | Shows where a credibility test would become sharper |
| 2026 projected power-law price | $142,782 | Gives a longer-horizon estimate for year-end framing |
The visual update also helps explain something the older line chart could not show as clearly: the pattern of overshoot and mean reversion across halving eras.
Giovanni says the four halving cycles appear as alternating green and red clusters, with each bull market pulling the price above the attractor and each bear market pulling it back. That creates a cleaner way to describe a recurring structure that looks less like a straight-line forecast and more like a series of regime changes around a long-run path.
The 2026 test extends beyond the line
Bitcoin’s deviations from the power law can now be linked to hard numbers outside the model. ETF flow data, mining difficulty, and downside bank forecasts all point to a 2026 market that can move sharply around the attractor without settling the bigger debate.
Start with ETF flows. Data from flows compiled by Farside show cumulative net inflows into U.S. Bitcoin ETFs of about $56.1 billion as of March 16.
BlackRock’s IBIT accounted for about $63.1 billion of cumulative net inflows, while GBTC still showed roughly $25.9 billion in cumulative net outflows. The recent sequence was uneven.
Total flows came in at +$461.9 million on March 4, then -$227.9 million on March 5 and -$348.9 million on March 6, before turning back to +$167.1 million on March 9, +$246.9 million on March 10, and +$180.4 million on March 13.
Those figures fit the regime view better than the old “near the line” framing. In 2026, Bitcoin can absorb hundreds of millions in ETF demand one day and face meaningful outflows the next.
The new chart gives that back-and-forth a visual language.
Green clusters can now be read not only as speculative heat around a halving cycle, but also as intervals when macro allocators and ETF buyers push price growth above the long-run pace. Red clusters can be read as periods when those flows cool or reverse.
Mining data points in the same direction. In late February, a report said Bitcoin difficulty jumped 15% to 144.4T, the largest percentage increase since 2021, while hashrate recovered to 1 zettahash per second.
That shows that the system’s security bill kept rising even as prices failed to cleanly snap back to the centerline. Capital continues to build the network even when price action looks slower than the long-run fit.
A second chart posted in reply to Giovanni’s update points in a similar direction. D Cane’s chart plots Bitcoin’s estimated production cost, derived from mining difficulty, on a log-log chart, a format often used to compare values that grow over long periods.
A regression line (a statistical best-fit line used to show the overall relationship between variables) runs through the data and yields an R² of 0.9845, a metric indicating how closely the data follow that trend.
It suggests one possible mechanism for why Bitcoin can keep returning toward a long-run scaling relationship; time, mining difficulty, and price may be more linked than daily market narratives imply. But the article should stop there. The regression is a supporting visual, not consensus evidence.

There is also, however, a bearish read on the same data. A February report said Standard Chartered cut its end-2026 Bitcoin target to $100,000 and warned that BTC could slide to $50,000 before recovering. That range sits close enough to the live floor to keep pressure on the model without requiring a total breakdown.
It gives skeptics a clean argument: if a large bank’s downside case nearly overlaps the floor, then the power law in 2026 may be less a destination than a boundary line that the market keeps testing.
A 2026 view of the model comes down to scenarios, not conviction
We no longer need to debate whether Bitcoin can still be fitted to a power law. We should perhaps still question what the model says when outside forces are strong enough to pull the price away from the centerline for months at a time.
Bitcoin could stay above the floor, trade below the centerline for long stretches, and that does not force a final verdict on the model.
Under that setup, the power law persists as a long-run organizing framework, while short-run moves are driven by ETF allocations, macro positioning, and mining economics. Giovanni’s field would show repeated shifts between green and red without a decisive trend break.
That outcome fits the current mix of positive cumulative ETF demand, uneven daily flows, and a network that remains expensive to secure.
A move back toward the centerline, then toward the broader 2026 projection, would mean a recovery toward the $124,477 trend level and potentially toward the $142,782 estimate later in the year.
The mechanism is plain, steadier ETF inflows, less pressure from rates, and a market willing to pay for scarcity again after a slow patch.
In that setup, the new visualization becomes more than chart art. It becomes a way to describe a genuine re-acceleration in local growth rates before price itself catches up to the long-run curve.
If Bitcoin keeps trading weak enough, long enough, the floor becomes the main reference point. A move toward the $50,000 to $70,000 area would not automatically invalidate the model, but it would sharpen the criticism already present in our earlier reporting.
The framework is historical first and causal second. The power law does not include policy, liquidity, or leverage. If those outside variables dominate for long enough, the line will remain on the chart while losing its force in the market.
| Scenario | Range or marker | What would likely drive it |
|---|---|---|
| Base case | Above $52,280 floor, below $124,477 centerline for long stretches | Mixed ETF flows and steady network growth without a strong macro tailwind |
| Bull case | Return toward $124,477 and possibly $142,782 | More persistent ETF demand and renewed momentum above the long-run pace |
| Bear case | $50,000 to $70,000 pressure zone | Weak flows, macro strain, and a longer stay below the model midpoint |
That leaves Giovanni’s latest version in a stronger place than a simple target chart, but a weaker place than a law in the strict sense.
It gives us a way to describe Bitcoin as a system that oscillates around a durable path. It does not settle what force keeps that path intact. In 2026, that distinction sits at the center of the debate.
Crypto markets now have tools that did not exist when the early power-law charts began to circulate at scale, spot ETFs with daily creation and redemption data, a mining sector operating at industrial intensity, and broader macro traders who can treat Bitcoin as part of a cross-asset book.
The line held through Bitcoin’s retail adolescence. The field now tries to explain Bitcoin’s institutional adulthood.
That is why the chart deserves another look. We don't have a clean answer on where Bitcoin will trade tomorrow, but we have a sharper way to examine the next few months.
If Bitcoin climbs back toward the centerline, the power law will look less like a relic and more like a regime model that adapted to a bigger market.
If price keeps sagging while the floor rises underneath it, the market will get the test CryptoSlate flagged earlier.
The line will still be there. The open question is whether traders still treat it as an attractor.
The post New Bitcoin power law chart turns $124k into the ETF-era battleground appeared first on CryptoSlate.
The President-backed effort to set broader rules for US crypto markets is nearing a political deadline in Congress as banks press lawmakers and regulators to block stablecoin companies from offering rewards that resemble interest on deposits.
The fight has become one of the central unresolved questions in Washington’s crypto agenda. At stake is whether dollar-linked digital tokens remain focused on payments and settlement or gain features that make them more competitive with bank accounts and money market funds.
The Senate’s market-structure bill, known as the CLARITY Act, has stalled after negotiations broke down over so-called stablecoin yield.
Industry participants and lobbyists say late April or early May is shaping up as the practical window for the bill to move if it is to have a realistic chance before the election-year calendar tightens.

CRS sharpens the legal question
Congressional Research Service has framed the issue more narrowly than the public fight around it.
In a March 6 report, CRS said the GENIUS Act bars stablecoin issuers from paying yield directly, but may not fully settle the status of what it called a “three-party model,” in which an intermediary such as an exchange stands between issuer and end user.
CRS said the act does not clearly define “holder,” leaving room for debate over whether intermediaries can still pass economic value through to customers. That ambiguity has become one of the main reasons banks want Congress to revisit the issue in the broader market-structure bill.
Banks say even limited rewards could turn stablecoins into a stronger competitor for deposits, especially at regional and community lenders.

However, crypto firms argue that incentives tied to payments, wallet usage or network activity would help digital dollars compete with older payment rails and could widen their role in mainstream finance.
That split also reflects different views of what stablecoins are becoming.

If lawmakers treat them mainly as payment instruments, the logic for tighter limits on rewards becomes stronger. However, if lawmakers see them as part of a broader shift in how value moves through digital platforms, the argument for limited incentives becomes easier to make.
Bank groups have urged lawmakers to close what they call a loophole before reward structures spread more widely. They say allowing rewards on idle balances would encourage deposit migration away from banks, reducing a key funding source for loans to households and businesses.
Standard Chartered estimated in January that stablecoins could draw about $500 billion from US bank deposits by the end of 2028, with smaller lenders facing the greatest strain.

The banking industry has also tried to show lawmakers that the position carries consumer backing. The American Bankers Association (ABA) recently published the results of a Morning Consult survey on stablecoins, fintech innovation and regulatory preferences.
According to the survey, respondents, by a 3-to-1 margin, said they agreed with congressional prohibitions on stablecoin rewards if the question raised the prospect of reduced funds available to banks to lend in the community and support economic growth. By a 6-to-1 margin, respondents said stablecoin laws should be cautious and should avoid steps that could undermine the existing financial system, particularly community banks.
However, crypto firms have pushed back by arguing that banks are trying to protect their funding model by limiting competition from digital dollars.
Industry advocates, including Coinbase CEO Brian Armstrong, have argued that stablecoin issuers operate under stricter reserve requirements than banks under the GENIUS Act, which requires issued stablecoins to be fully backed by cash or cash equivalents.
The volume story has raised the stakes in Washington
The market’s scale has made the rewards dispute harder to dismiss as a niche argument.
Boston Consulting Group estimated that only about $4.2 trillion of roughly $62 trillion in gross stablecoin transfer volume last year represented real economic activity after stripping out bots, exchange flows, and other internal movements.
That gap between headline volume and underlying economic use helps explain why the debate over rewards has taken on greater importance.
If stablecoins remain largely a settlement tool for trading and market structure, lawmakers may find it easier to keep them boxed in as payment instruments. If rewards help them become a widely used store of cash inside consumer apps, the pressure on banks could rise more quickly.
As a result, the White House tried to broker a compromise earlier this year that would have allowed some rewards in narrow use cases, such as peer-to-peer payments, while barring returns on idle holdings. Crypto companies accepted that framework, but banks rejected it, leaving the Senate talks at an impasse.
However, even if Congress does not act, regulators may still narrow the path for reward structures.
In a proposed rule to implement the GENIUS Act, the Office of the Comptroller of the Currency (OCC) said it would presume an issuer is effectively paying prohibited yield if it funds an affiliate or related third party that then pays yield to stablecoin holders.
That signals the administration may try to police the issue through rulemaking if lawmakers fail to produce a legislative fix.
Congress is running short on time
The fight now has two tracks. Congress is debating whether to settle the matter in statute, while regulators are moving to define how far companies can go under the law already on the books.
For the Senate bill, the calendar itself has become a source of pressure.
Alex Thorn, Galaxy Digital's head of research, wrote on X:
“If Clarity doesn’t pass committee by the end of April, odds of passage in 2026 become extremely low. This needs to hit the Senate floor by early May. Floor time is running out, and the odds diminish every day that passes.”
Thorn also expressed caution about the chances of a breakthrough even if the rewards fight is resolved, saying:
“The framing right now is that the dispute over stablecoin rewards is holding up the Clarity Act. But even if compromise is reached on rewards, there are very likely to be other hurdles.”
Those challenges could include regulations pertaining to the decentralized finance sector, the powers of regulators, or “even ethics,” Thorn said.
The issue of crypto regulation is likely to become a larger political battleground ahead of the midterm elections in November. That adds another layer of urgency to the current impasse, because a delayed bill would have to compete with a more crowded political calendar and a harder legislative path.
Prediction markets reflect that shift in sentiment. In early January, Polymarket placed the odds of passage at 80%. After recent setbacks, including Armstrong calling the current version of the bill unworkable, the odds moved closer to 50%.
Data from Kalshi shows that the bill has only a 7% chance of passage before May and 65% before the end of the year.
Failure would leave more to regulators and the market
The consequences of failure reach beyond the current dispute over rewards. The CLARITY Act is meant to define when crypto tokens are securities, commodities or otherwise, and to provide a clearer legal framework for how the market is overseen.
If the bill stalls, the industry would remain more dependent on guidance, rulemaking and future political turnover.
That is one reason market participants have focused so heavily on the bill’s fate. Bitwise CIO Matt Hougan argued earlier this year that the Clarity Act would cement the current pro-crypto regulatory environment into law. Without it, he said, a future administration could reverse the current policy push.
Hougan wrote that if the bill fails, crypto would enter a “show me” period and have three years to make itself indispensable to the everyday lives of regular Americans and the traditional financial industry.
In that view, future gains would depend less on investors pricing in a durable legislative win and more on whether stablecoins, tokenized assets, and related products can prove broader real-world adoption.
That creates two distinct paths for the market. Passage could lead investors to price in the growth of stablecoins and tokenization sooner. Failure could leave future growth more contingent on adoption and more exposed to skepticism about whether Washington’s current support will survive the next turn in politics.

For now, the next move belongs to Washington. If senators can revive the market-structure bill this spring, lawmakers may still define how far stablecoins can go in sharing value with users and how much of the broader crypto framework can be locked into statute. If they cannot, regulators appear ready to draw at least part of that line themselves.
Either way, the issue now reaches beyond whether stablecoins are part of finance. The fight has moved to how they will function inside it, and who gets paid as they grow.
The post Congress has only weeks left to convince banks on crypto CLARITY Act or risk losing it to midterms appeared first on CryptoSlate.
Cryptoticker
Ripple’s native token, $XRP, reclaimed the $1.50 price level. This move comes after weeks of tightening volatility, where the asset was compressed within a massive technical structure. As the broader crypto market shows signs of a renewed bullish cycle, XRP's recent price action suggests that the long-awaited move toward psychological resistance levels may be underway.
XRP Price Prediction: The Road to $2.00
The current technical setup confirms that XRP is targeting the $2.00 milestone. This projection is based on a "measured move" following the breach of a multi-week consolidation pattern. If XRP-USD can maintain its position above the $1.45 support zone, the next liquidity pocket sits between $1.85 and $2.10.
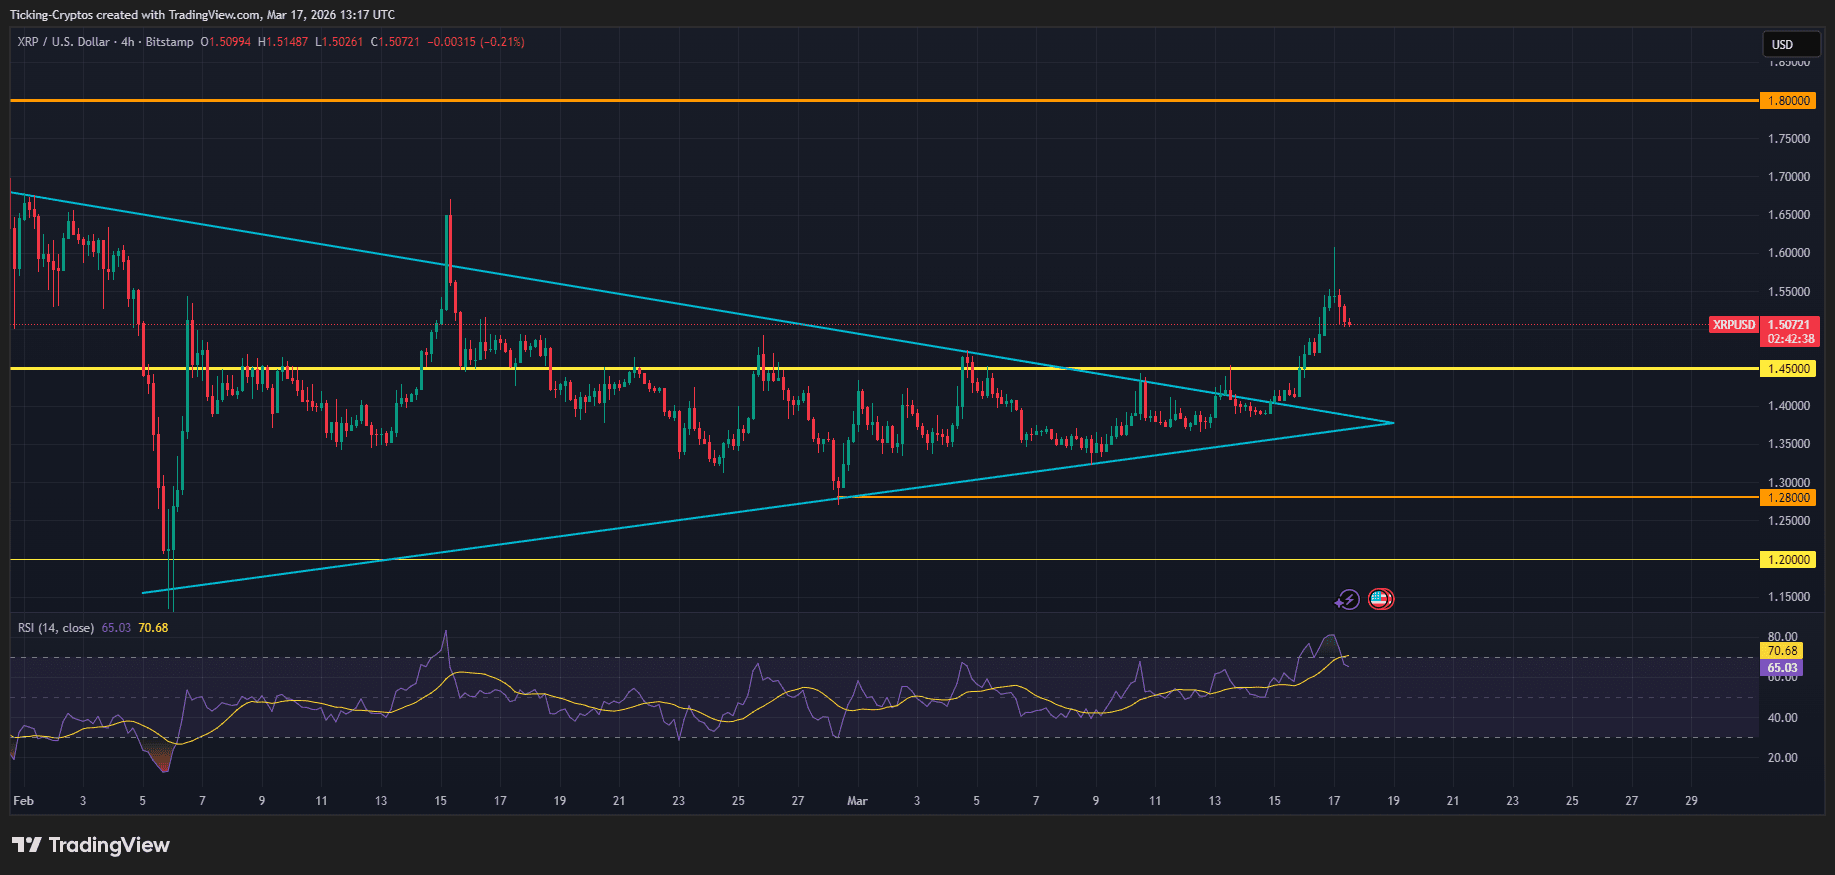
The Symmetrical Triangle
A symmetrical triangle is a chart pattern characterized by two converging trendlines connecting a series of sequential peaks and troughs. In XRP’s case, this pattern represented a period of "equilibrium" where buyers and sellers were in a deadlock. Typically, a breakout from this formation indicates that the prevailing trend—in this case, the bullish momentum from late 2025—is ready to resume with high volume.
The Breakout: How XRP Breached the Triangle
The most critical development in the recent XRP-USD price action is the upward breach from the triangle formation. Since February 2026, XRP has been making lower highs and higher lows, narrowing into an apex near the $1.38 mark.
On March 14, trading volume surged by over 300%, providing the necessary fuel for XRP to pierce the upper descending trendline. This "breach" was not merely a wick but was followed by a daily candle close above the resistance, effectively flipping it into a support floor. Technical analysts often view this specific type of exit from a triangle as a signal that the "accumulation phase" is over and the "markup phase" has begun.
Technical Indicators Supporting the $2 Target
Beyond the triangle breakout, several other indicators point toward a continued rally:
- Moving Averages: XRP is now trading comfortably above its 50-day and 200-day Exponential Moving Averages (EMAs).
- Relative Strength Index (RSI): The RSI is currently at 64, suggesting that while the asset is gaining strength, it is not yet "overbought" (which typically occurs above 70).
- Institutional Inflows: According to data from CoinShares, XRP-specific investment products have seen over $1.3 billion in cumulative inflows this year, providing the structural liquidity needed to sustain a move to $2.00.
Key Support and Resistance
| Level | Type | Significance |
|---|---|---|
| $1.38 - $1.42 | New Support | The previous triangle resistance now acts as a floor. |
| $1.56 | Current Pivot | XRP is consolidating here to build momentum for the next leg. |
| $1.80 | Minor Resistance | A historical supply zone from early 2026. |
| $2.00 | Major Target | The primary psychological and technical goal for the current rally. |
Ethereum (ETH) has bounced back strongly, rising more than 20% over the past eight days. While much of the market focused on Bitcoin’s volatility, Ethereum moved higher in the background. The rally is being driven by growing institutional interest and clearer regulatory support, two factors that are starting to change how major financial players approach the Ethereum network.
Why is Ethereum Price UP?
The recent Ethereum price pump is driven by a convergence of institutional liquidity and regulatory clarity. Specifically, the Federal Reserve's decision to allow tokenized securities as bank collateral and BlackRock’s launch of its iShares Staked Ethereum Trust (ETHB) have provided the necessary fundamental support for ETH to decouple from minor market corrections.
Tokenization and Staked ETFs
To understand why these developments are "game-changers," we must define the two pillars supporting this rally:
- Tokenized Securities: These are traditional assets (like stocks or bonds) represented as digital tokens on a blockchain.
- Staked ETFs: Unlike a standard spot ETF, a staked ETF (like ETHB) actually participates in the network's consensus, earning a "yield" or dividend for its shareholders by securing the network.
1. The Fed’s Green Light: Tokenized Assets as Collateral
On March 6, 2026, the Federal Reserve, alongside the OCC and FDIC, issued a landmark clarification. U.S. banks are now officially permitted to use tokenized securities as collateral for loans.
Why This Matters for Ethereum
Regulators confirmed that as long as the tokenized version confers the same legal rights as the traditional asset, it will receive the same capital treatment. Crucially, the Fed stated this applies regardless of whether the blockchain is permissioned or permissionless (public).
- Liquidity Influx: Trillions of dollars in "off-chain" value (Treasuries, equities) can now migrate to Ethereum.
- Ethereum as the "Settlement Layer": Since Ethereum remains the dominant hub for Real-World Assets (RWAs), this ruling cements $ETH role as the global plumbing for modern finance.
2. BlackRock’s ETHB: The First Dividend-Paying Crypto ETF
On March 12, 2026, BlackRock launched the iShares Staked Ethereum Trust (ticker: ETHB). While the market already had spot ETH ETFs, ETHB is the first from a major issuer to offer staking rewards directly to shareholders.
Key Features of ETHB:
- Yield Generation: The fund stakes between 70% and 95% of its holdings.
- Monthly Distributions: Investors receive monthly cash payouts, similar to a high-yield dividend stock.
- Institutional Infrastructure: BlackRock partnered with Figment and Coinbase Prime to manage the validator sets, bringing "Enterprise-Grade" security to the staking process.
"The ETHB launch transforms Ethereum from a speculative commodity into a productive, yield-bearing asset for the average 401k investor." — Market Insight
Comparison: Spot ETH vs. Staked ETH ETFs
| Feature | Spot ETH ETF (e.g., ETHA) | Staked ETH ETF (ETHB) |
|---|---|---|
| Primary Goal | Price Tracking | Price + Yield |
| Income Source | None | Staking Rewards (~2-3% Net) |
| Risk Profile | Market Volatility | Volatility + Slashing Risk |
| Target Audience | Traders | Long-term Income Seekers |
Fundamental Divergence
For months, analysts have noted a divergence: Ethereum's network fundamentals (Total Value Locked, Active Addresses, and Layer 2 scaling) were hitting record highs while the Ethereum price lagged. This 20% pump suggests the "valuation gap" is finally closing.
Markets Rally Ahead of President Trump’s Speech
Global markets are reacting strongly ahead of President Donald Trump’s expected White House speech today, with equities surging and oil prices falling after reports that the United States is allowing some oil tankers to pass through the Strait of Hormuz to stabilize global supply.
The development comes after days of heightened geopolitical tensions involving Iran and the United States. The Strait of Hormuz is one of the world’s most critical energy chokepoints, responsible for transporting roughly 20% of global oil supply.
Reports that tankers are now being allowed to pass through the strait have eased fears of a major disruption to global energy markets. As a result, oil prices dropped sharply, triggering a powerful rally across U.S. stock markets.
$1 Trillion Added to U.S. Stocks
The market reaction has been immediate. U.S. equities surged at the open, with major indexes posting strong gains.
The S&P 500, Nasdaq, Dow Jones, and Russell 2000 all climbed significantly as investors interpreted the tanker news as a signal of possible de-escalation in the Middle East conflict.
Tech stocks led the rally, with major companies such as Nvidia, Meta, Tesla, Apple, and Google all trading higher. In total, the U.S. stock market added hundreds of billions of dollars in market value, approaching the $1 trillion mark during the early session.
The logic behind the rally is straightforward: if oil supply remains stable, inflation pressure may ease, which could reduce economic uncertainty and support risk assets.
Oil Prices Drop After Hormuz News
Energy markets were extremely sensitive to the situation in the Strait of Hormuz over the past week. Any threat to the route can send oil prices soaring due to fears of supply disruptions.
However, the latest reports suggesting the United States is allowing some tankers to pass through the strait have helped calm markets.
Oil prices dropped sharply after the announcement, reinforcing the perception that global supply chains may remain intact despite ongoing geopolitical tensions.
For financial markets, lower oil prices often translate into lower inflation expectations, which tends to support stocks and other risk assets.
All Eyes on President Trump’s Announcement
President Trump is expected to address the situation during a White House press conference later today. Investors are closely watching the speech for signals about the next steps in U.S. policy.
Key questions markets are asking include:
- Will the U.S. officially confirm that tanker traffic through Hormuz is being stabilized?
- Will there be a broader international coalition protecting the shipping route?
- Could the speech signal de-escalation or further military action?
Markets have already partially priced in a positive outcome, meaning the tone of the speech could play a decisive role in determining the next move across global assets.
Could Bitcoin Be the Next Market Mover?
While traditional markets have already reacted, the cryptocurrency market is watching closely.
Bitcoin has recently shown surprising resilience during geopolitical instability. In many cases, major macro developments initially move traditional markets such as oil and equities before spilling over into crypto.
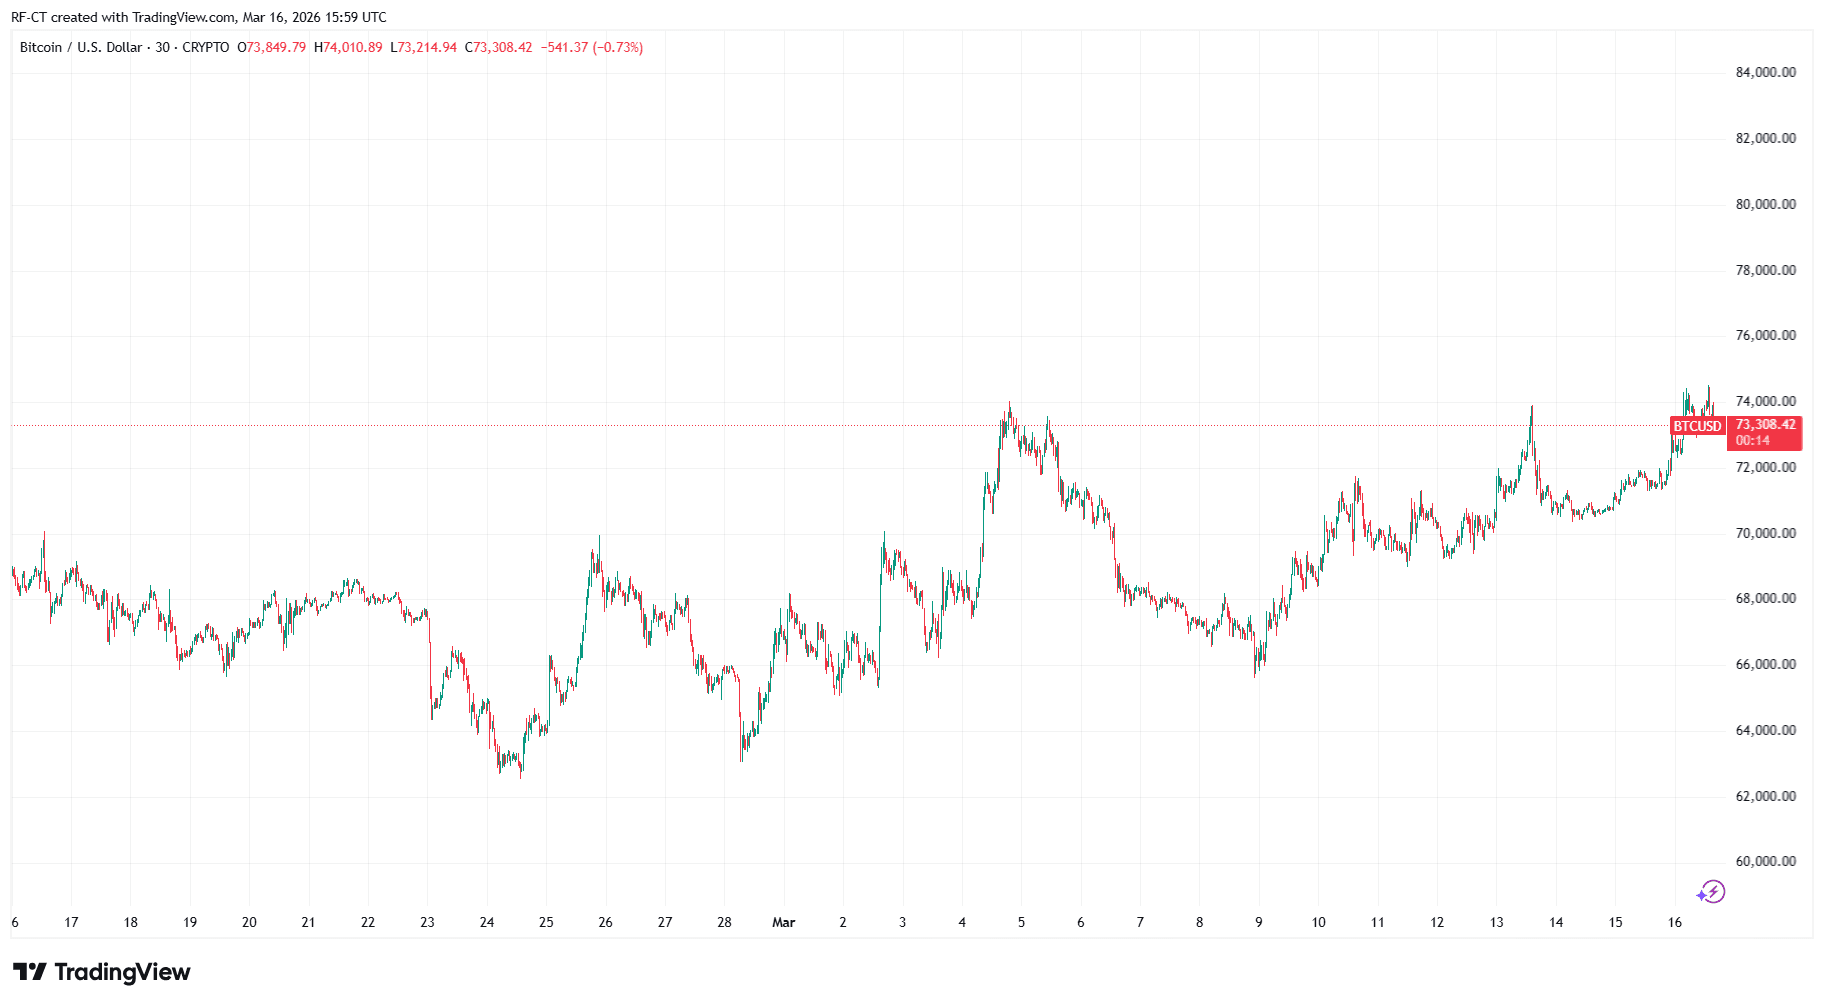
If global risk sentiment continues improving, capital could rotate back into digital assets, potentially supporting Bitcoin and the broader crypto market.
On the other hand, if the speech signals escalation or renewed uncertainty, volatility could return across both traditional and crypto markets.
For now, Bitcoin traders are waiting to see whether the macro rally in equities will translate into momentum for the crypto market as well.
Conclusion
With oil prices dropping and U.S. stocks surging ahead of President Trump’s speech, global markets are positioning for potential stabilization in the Strait of Hormuz situation.
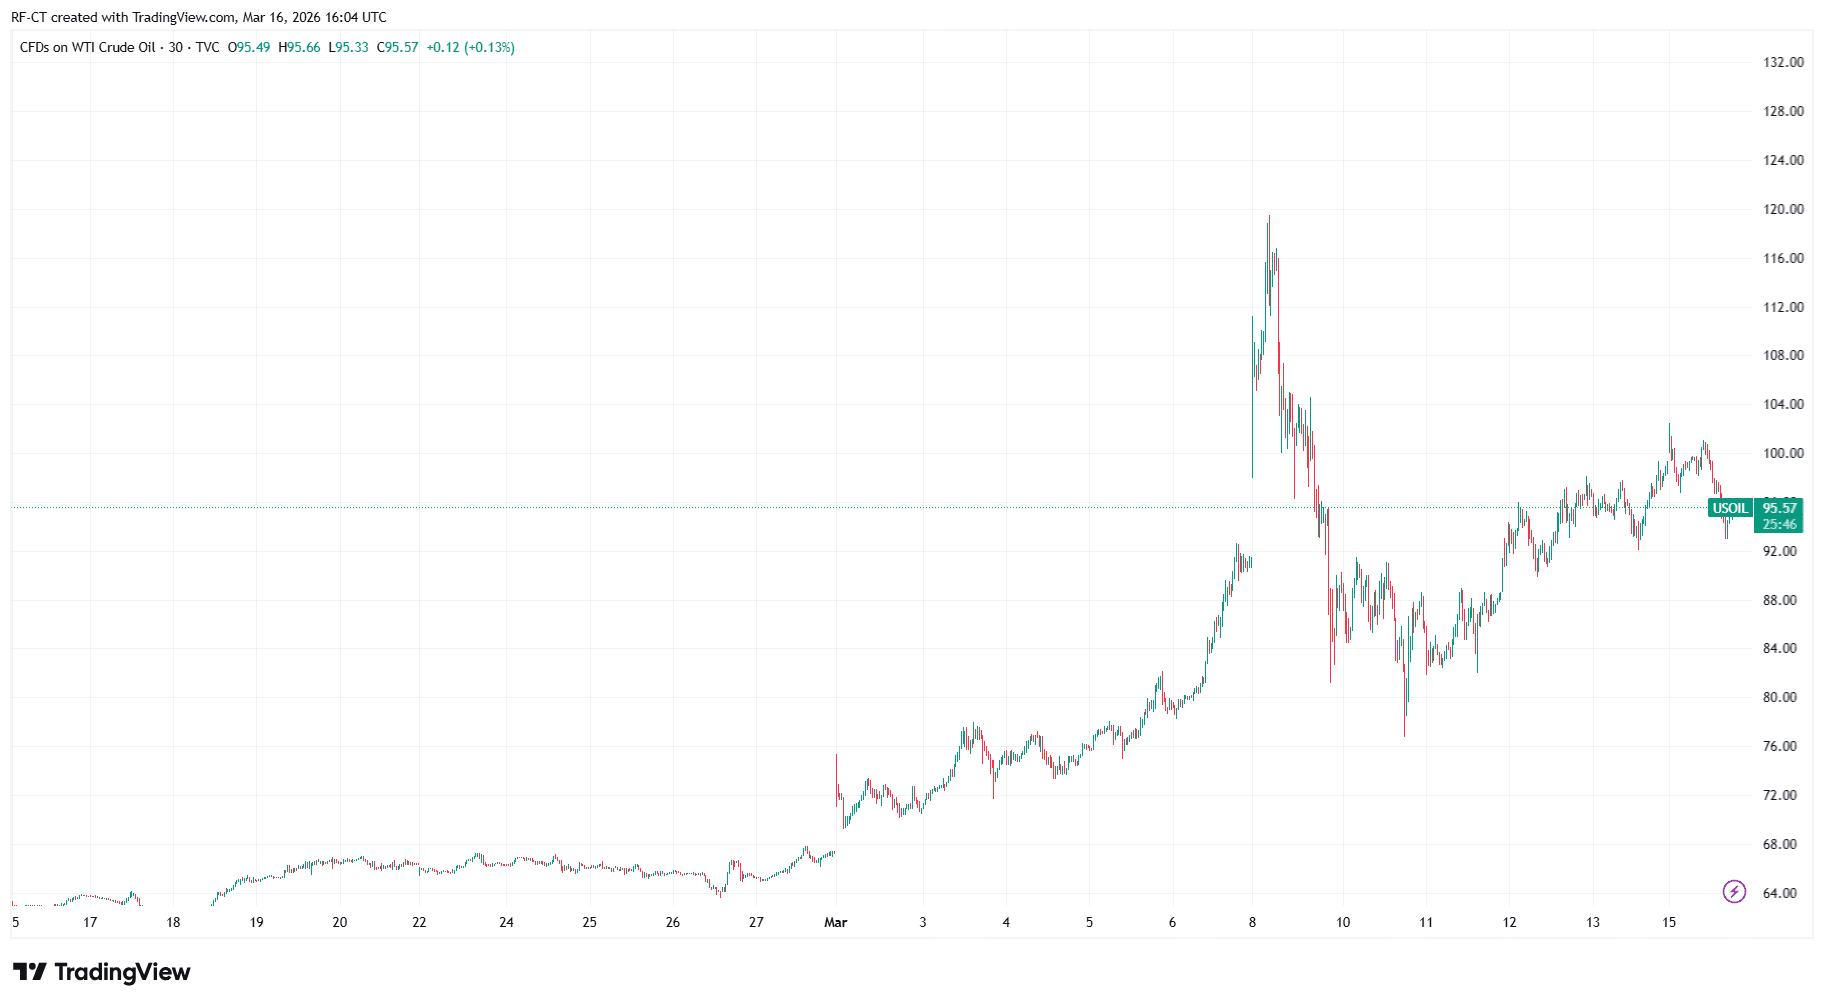
However, the final market reaction will likely depend on the tone and details of the announcement. Investors across equities, commodities, and cryptocurrencies are now waiting to see whether the speech confirms de-escalation — or introduces a new wave of uncertainty.
If risk appetite continues improving, Bitcoin could become the next asset to react.
While U.S. President Donald Trump has actively lobbied for a multinational military coalition to reopen the strategic waterway, Beijing has formally responded with a message of de-escalation. The friction between the world's two largest economies, coupled with a tightening energy supply, has positioned Bitcoin as a focal point for investors seeking a hedge against systemic risk.
China Sidesteps Military Engagement in the Strait
In a direct response to President Trump’s call for China to deploy warships to the Strait of Hormuz, the Chinese Foreign Ministry has signaled a firm preference for diplomacy over military intervention. Foreign Ministry spokesperson Lin Jian stated on Monday that "all parties should immediately cease military operations" to prevent a regional catastrophe that could further cripple global economic growth.
The Strait of Hormuz is a critical chokepoint through which approximately 20% of the world’s oil flows. Trump’s administration argued that since China is a major beneficiary of Middle Eastern oil, it should share the burden of securing the passage. Instead of joining the U.S.-led coalition, China is prioritizing "head-of-state diplomacy," though Trump has threatened to delay his upcoming summit with Xi Jinping if cooperation is not met.
Bitcoin Price Analysis: BTC Price Breaches $73K
Amidst this geopolitical standoff, the Bitcoin price has shown remarkable resilience. After consolidating near $70,000 for much of early March, the premier cryptocurrency surged past $73,000 today, marking an 8% increase over the past week.
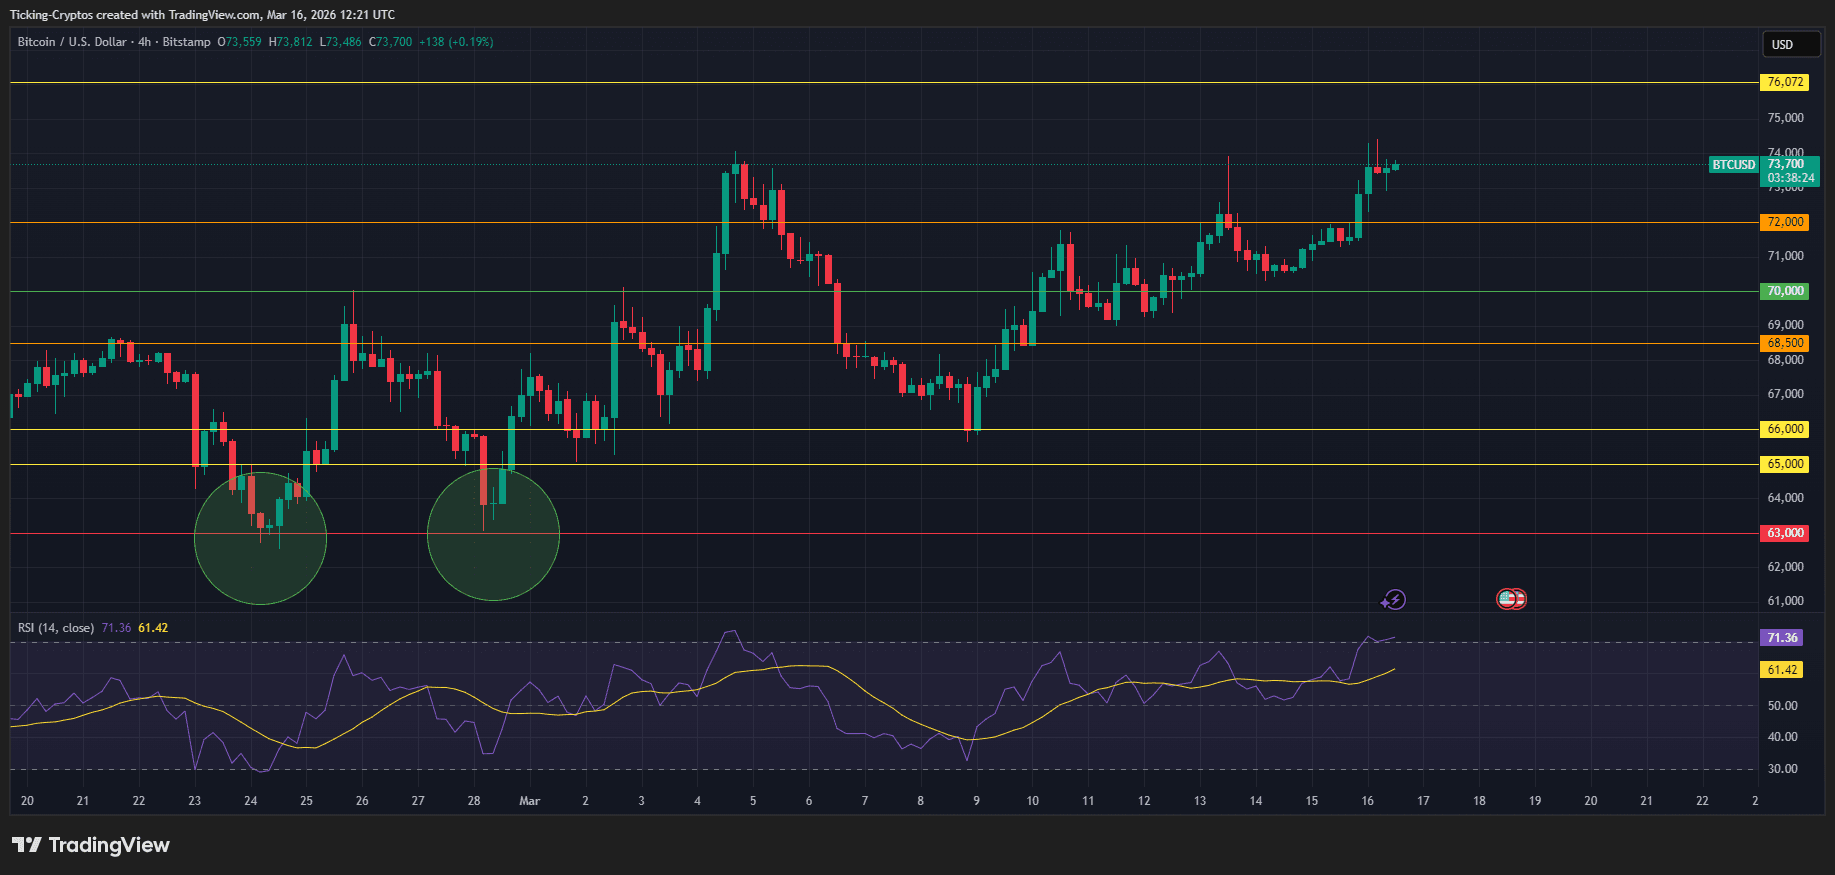
Technical Targets and Resistance
Market analysts are now eyeing the $75,000 level as the next immediate target. The breakout above $73,400—a level aligned with the 50-period moving average—suggests that the "Expertise" of the bulls is currently dominating the narrative.
- Immediate Support: $70,000 (Psychological barrier)
- Resistance Zone: $74,500 – $75,200
- Weekly Gain: +8.3%
The rising appetite for $Bitcoin reflects a shift in market sentiment. While the S&P 500 has faced pressure due to soaring oil prices (now exceeding $100 per barrel), BTC is increasingly being viewed as a "digital gold" alternative.
Why China's Stance Matters for Markets
China's refusal to join the military coalition adds a layer of uncertainty to global trade. If the Strait remains blocked and the U.S. continues its unilateral military pressure, energy prices are expected to stay elevated. For the crypto market, this often translates to two scenarios:
- Inflationary Hedge: Persistent high energy costs drive inflation, traditionally a bullish catalyst for BTC.
- Safe Haven Shift: As traditional exchange platforms see increased volatility in equities, capital flows toward decentralized assets.
Bitcoin Prediction: The Road to $75,000
As the "Who, What, and Why" of this crisis unfold, the path to $75,000 for Bitcoin seems clear, provided it can maintain its support above $72,000. Investors are closely watching the upcoming diplomatic meetings, as any further escalation in the Middle East or a breakdown in U.S.-China trade talks could provide the final push needed for BTC to hit new all-time highs.
As of today, March 16, 2026, $Ethereum is up 7% in the past 24 hours with 13% gain over the past week.
This sudden volatility to the upside has liquidations of short positions reaching over $123 million, suggesting that the "bear trap" may have finally snapped shut. With institutional interest peaking due to the launch of products like the BlackRock iShares Staked Ethereum ETF (ETHB), the path toward $3,000 appears increasingly clear—provided key support zones hold.
Is the Ethereum Bull Run Back?
The short answer is: Potentially, but confirmation is key. The break above $2,250 is the first higher-high Ethereum has printed on the daily chart in months. For this to transition from a "relief rally" to a full-blown bull run, $ETH must now flip $2,250 into a support floor and challenge the next major liquidity cluster near $2,450.
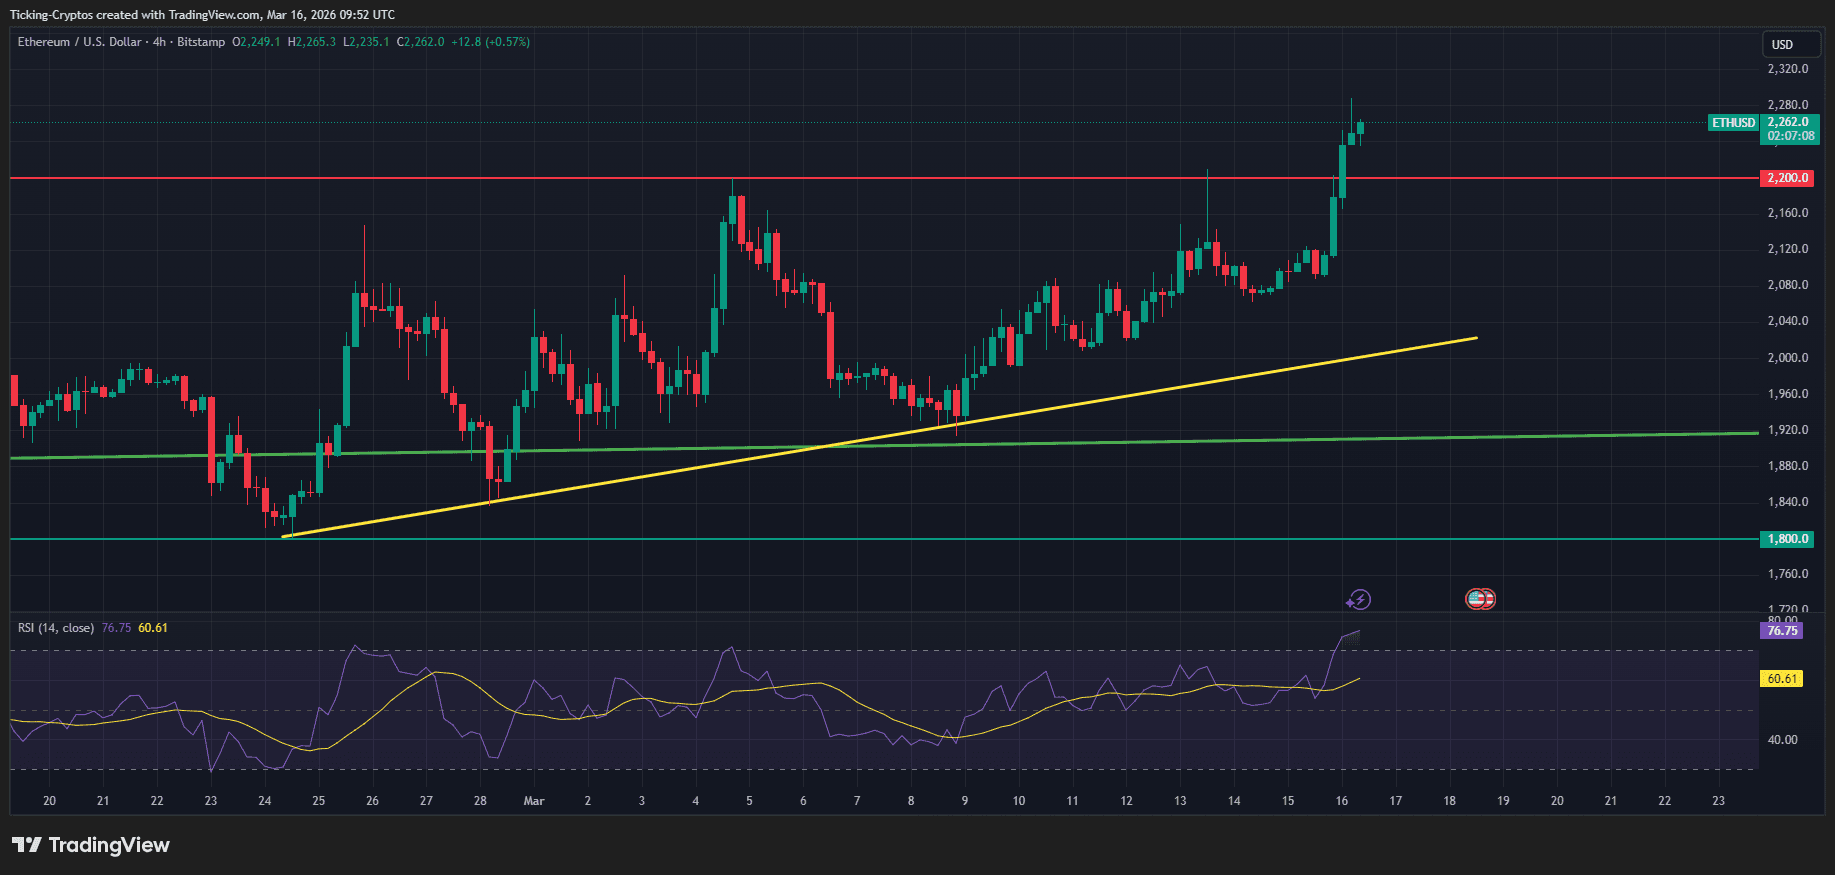
Current Market Performance at a Glance:
| Metric | Value |
|---|---|
| Current Price | $2,260 - $2,270 |
| 24h Change | +7.2% |
| 7d Change | +13.1% |
| Key Resistance | $2,450 / $3,000 |
| Critical Support | $2,200 / $2,050 |
Ethereum Price Prediction: Breaking Down the Chart
Analyzing the recent technical structure, the breakout occurred following a "double-bottom" pattern near the $1,950 zone. The charts indicate a sharp vertical move that has pushed the Relative Strength Index (RSI) into the bullish 60-65 range, suggesting there is still room for growth before reaching "overbought" territory.
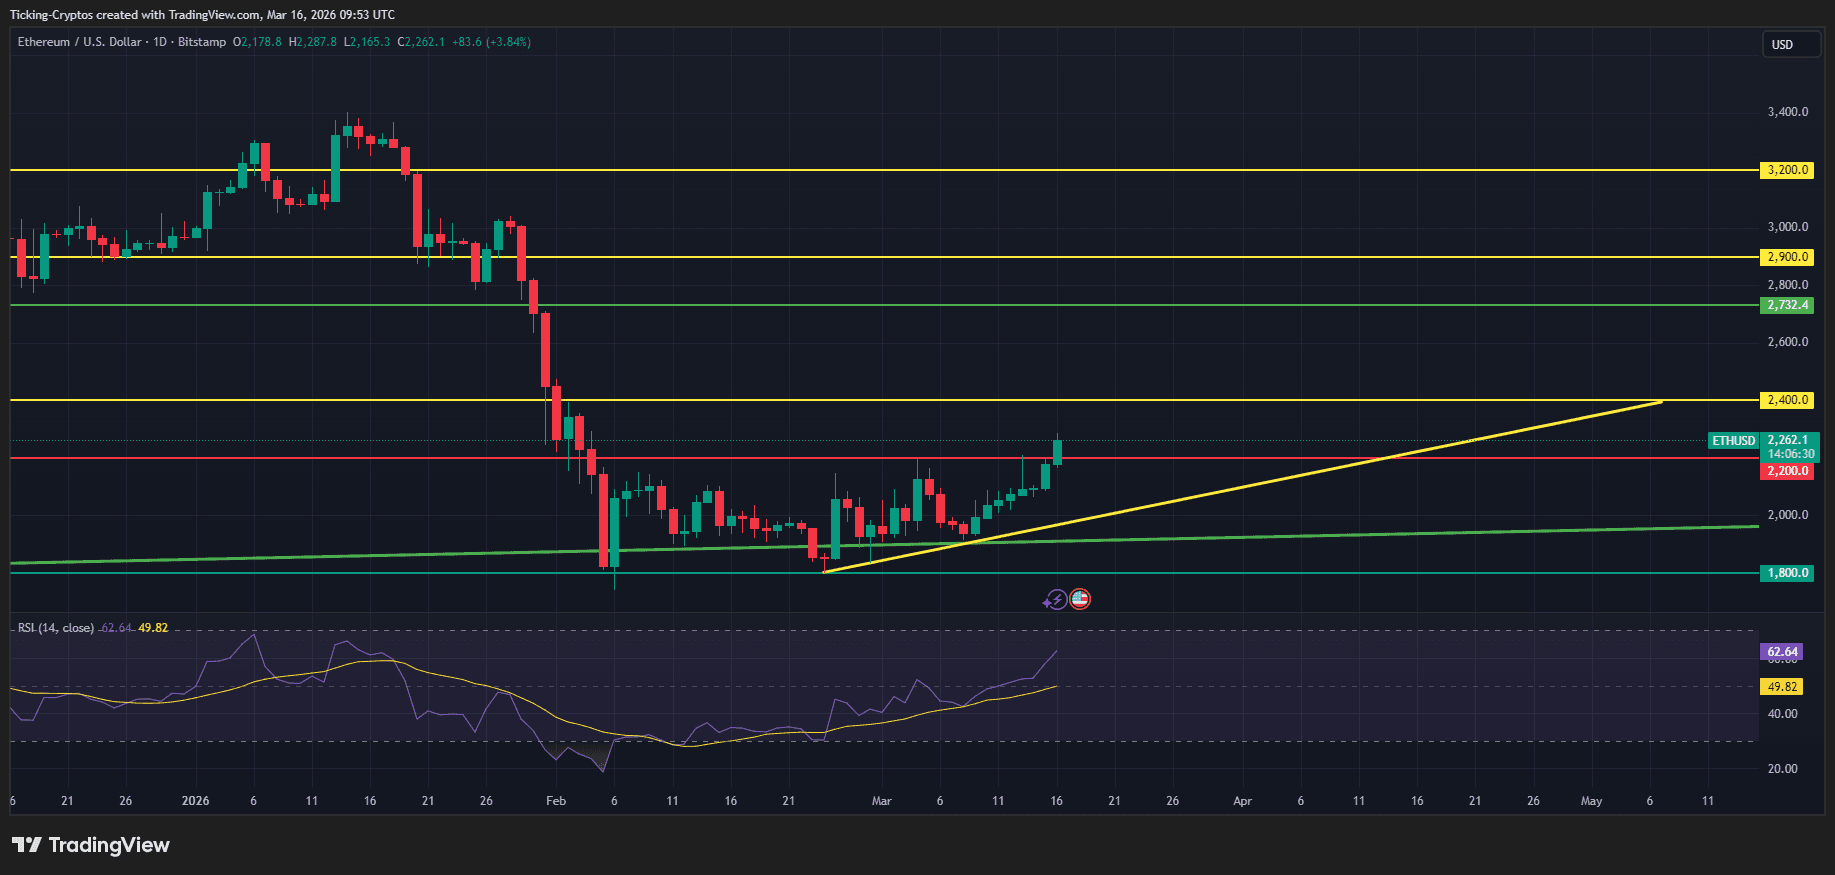
Ethereum Price Target After the Rally
The next logical target for bulls is the $3,000 mark. This level isn't just a psychological milestone; it represents a major historical supply zone where Ethereum struggled during the previous quarter. If the current momentum continues, driven by increased on-chain activity and ETF inflows, we could see a test of $3,000 by late April 2026.
Ethereum Risk Areas
Despite the optimism, the bull run is not yet "guaranteed." Technical analysts point to two critical risk areas:
- $2,200 Support: If ETH fails to hold above this level on a daily close, the current breakout might be labeled a "fakeout."
- $2,050 Support: This is the line in the sand. If Ethereum breaks below $2,050, it invalidates the current bullish structure, suggesting that the market remains in a long-term downtrend and the bull run has not yet started.
Expert Insight: "The $2,150 to $2,250 range has been a thick liquidity node. Breaking above it with high volume is a strong signal, but we need to see the crypto market stabilize here to avoid a sharp rejection," notes a senior analyst at CoinDesk.
Institutional Catalysts: BlackRock and ETF Inflows
A major driver behind this 7% pump is the surging institutional adoption. The recently launched BlackRock iShares Staked Ethereum ETF (ETHB) saw over $15.5 million in trading volume on its debut. Unlike standard ETFs, this product offers exposure to staking rewards, making it highly attractive for pension funds and large-scale investors looking for yield in a volatile market.
Decrypt
A new toolkit aims to allow AI agents to prove that a real person stands behind them when interacting online.
Strategy just made its biggest Bitcoin buy of 2026, and Kalshi is running a $1 billion March Madness bracket contest.
Mastercard said Tuesday that it will acquire stablecoin infrastructure firm BVNK in an effort to connect fiat and crypto payment rails.
Tokenization platform Theo plans to introduce a "gold-powered" stablecoin, which is set to generate yield from two independent sources.
AI and privacy tokens have emerged as leaders after Bitcoin’s $75K retest, with experts citing infrastructure demand over speculative memes.
U.Today - IT, AI and Fintech Daily News for You Today
Zcash is gaining popularity once again as, for whatever reason, investors are catching up with privacy coins.
Cardano might end monthly negative performance with price and on-chain metrics soaring.
Dogecoin breakout might be closer than usual as top analyst flags Heikin Ashi setup.
XRP Ledger fees are in the spotlight as nonempty wallets set the ATH as adoption grows.
This morning on the crypto market, PayPal takes PYUSD global to fight Ripple, 237 billion SHIB leave exchanges and Citi lowers BTC target to $112,000.
Blockonomi
Key Highlights
- Robinhood Ventures Fund I (RVI) has finalized strategic investments in Stripe and ElevenLabs
- Approximately $14.6M in Stripe Class B Common Stock was acquired through secondary market transactions on March 9, 2026
- Around $20M in ElevenLabs Series D Preferred Stock was purchased via primary transaction on March 12, 2026
- Following its NYSE debut on March 6, 2026, RVI raised $658.4M at $25 per share during its initial public offering
- The fund’s private company holdings now total nine investments with plans for continued expansion
Robinhood Ventures Fund I (RVI), the closed-end investment vehicle created by Robinhood Markets (HOOD), has finalized strategic stakes in two prominent private enterprises: Stripe (STRIP) and ElevenLabs.
On March 9, 2026, the fund acquired $14,577,645 worth of Stripe Class B Common Stock through secondary market transactions. This was followed by a $19,999,971 investment in ElevenLabs Series D Preferred Stock on March 12, executed as a primary round transaction.
The combined deployment totals approximately $34.5 million across two of the most sought-after names in today’s private investment landscape.
Robinhood Markets, Inc., HOOD
Debuting in February 2026, RVI secured approximately $658.4 million through its initial public offering at a $25 price point per share. Trading commenced on the New York Stock Exchange under the RVI ticker on March 6, 2026 — providing everyday investors unprecedented access to pre-IPO investment opportunities.
“We’re excited to add Stripe and ElevenLabs to Robinhood Ventures Fund I and are proud to offer retail investors access to these frontier companies,” said Sarah Pinto, President of Robinhood Ventures Fund I.
Portfolio Additions: Stripe and ElevenLabs
Established in 2010, Stripe maintains dual headquarters in South San Francisco and Dublin. The fintech giant provides comprehensive payment processing, revenue optimization, and financial management solutions for businesses ranging from startups to enterprises.
London-based ElevenLabs, founded in 2022, specializes in cutting-edge AI audio technology, including voice synthesis and speech solutions. The platform serves millions globally through voice agent systems, content creation applications, and developer-focused APIs.
The ElevenLabs investment represents a primary transaction — capital flowing directly into the company’s operations. Conversely, the Stripe acquisition occurred in secondary markets, with RVI purchasing shares from existing stakeholders rather than the company treasury.
Building a Nine-Company Portfolio
Following these latest acquisitions, RVI’s portfolio has expanded to nine private companies. Previous investments include notable names like Databricks, Ramp, and Revolut, among other high-growth private firms.
As a closed-end fund structure, RVI trades on public exchanges similar to traditional stocks, yet its underlying holdings consist of private company equity positions — not publicly available securities.
Robinhood positioned the fund as a democratizing force, enabling retail investors to access investment opportunities traditionally reserved for institutional players and accredited investors with substantial net worth.
RVI management has indicated plans to continue expanding the portfolio with additional private company investments, though no specific acquisition timeline has been publicly disclosed.
While the Stripe investment was previously announced, the ElevenLabs transaction received official confirmation on March 17, 2026.
The post Robinhood (HOOD) RVI Fund Completes $34.5M Investment in Stripe and ElevenLabs appeared first on Blockonomi.
TLDR
- Major defense contractors have declined roughly 1% since the Iran conflict commenced
- Initial four days of operations consumed approximately $11 billion, with $5.7 billion spent on interceptor missiles
- Defense industry stocks were already positioned at historically elevated price-to-earnings ratios
- Military budgets increasingly favor AI, unmanned systems, and space technologies over traditional platforms
- New administrative policies limit stock buybacks and dividend distributions for contractors failing delivery benchmarks
America’s leading defense manufacturers were expected to benefit substantially from the Iran conflict. The reality has proven quite different.
The top five U.S. defense companies — Lockheed Martin, Northrop Grumman, General Dynamics, Boeing, and RTX — have collectively dropped approximately 1% since hostilities began. Market participants remain hesitant, even as surface-level analysis suggests robust demand ahead.
Lockheed Martin Corporation, LMT
The conflict has rapidly depleted American weapons inventories. During just the opening four days of operations, costs approached $11 billion. Interceptor systems accounted for roughly $5.7 billion of this total, with Patriot and Thaad air-defense platforms bearing the heaviest usage.
Such rapid consumption creates supply chain challenges. Reports indicate the U.S. may be reallocating air-defense systems from the Korean Peninsula to address shortfalls in other theaters.
Conventional wisdom suggests depleted inventories translate into substantial replenishment contracts for manufacturers. Yet market behavior tells a different story — and several factors explain this disconnect.
Stocks Were Already Priced for Growth
Defense equities had experienced substantial appreciation before the Iran situation escalated. The five dominant contractors have surged approximately 50% collectively since June 2024’s presidential debate. Four companies now trade near 26 times forward earnings — approaching historical peaks.
When securities already reflect optimistic growth assumptions, additional positive developments frequently fail to drive further gains. Market expectations had already incorporated much of the potential upside.
Underlying demand fundamentals remain solid. Pentagon leadership had advocated for accelerated missile manufacturing long before this engagement. Multi-year production expansion contracts were executed earlier this calendar year. Current U.S. defense appropriations stand at an unprecedented $1 trillion, while European NATO partners have elevated their military expenditure targets to 5% of GDP. Asian allies including Japan, South Korea, and India have similarly expanded defense allocations.
President Trump has advocated for a $1.5 trillion defense budget by fiscal year 2027, though congressional authorization remains uncertain. The administration has yet to present formal budget proposals for the upcoming fiscal cycle.
The Shift Toward Defense Tech
A significant challenge facing established contractors involves budget allocation trends. Within current military appropriations, funding for traditional weapons programs remains essentially flat. Meanwhile, budgets supporting emerging capabilities — artificial intelligence, unmanned systems, and space-based assets — are expanding at rates exceeding 20% annually.
The Iran engagement has highlighted this strategic tension. American and allied forces have deployed expensive interceptor missiles and manned aircraft against inexpensive Iranian Shahed drones costing mere tens of thousands of dollars per unit. This cost asymmetry is accelerating evaluation of more economical countermeasures.
Smaller defense technology firms have capitalized on this reorientation. During the trailing twelve months, an exchange-traded fund emphasizing emerging defense tech companies gained 67%, outpacing the 54% return of an ETF concentrated in major contractors.
The Trump administration has implemented financial constraints on prime contractors. An executive directive from earlier this year prohibits dividend payments and share repurchase programs until contractors verify on-schedule, on-budget delivery performance. This policy could pressure near-term earnings per share metrics.
Remember: Preserve all tokens like [[EMBED_0]], [[IMG_0]], [[LINK_START_0]], [[LINK_END_0]], [[SCRIPT_0]], [[FIGURE_0]] etc. exactly as they appear. These are placeholders for embeds, images, and links that must not be changed.
The post Why Defense Stocks Aren’t Rallying Despite Billions Spent on Iran Conflict appeared first on Blockonomi.
TLDR
- On Tuesday, Qualcomm unveiled a massive $20 billion share repurchase authorization
- This new buyback program supplements the existing $2.1 billion plan currently in place with no set expiration
- Following the announcement, QCOM shares climbed over 3%, providing relief after a year-to-date decline exceeding 24%
- Additionally, the chipmaker increased its quarterly dividend by 3.4% to $0.92 per share, totaling $3.68 annually
- CEO Cristiano Amon emphasized shareholder value and the company’s continued diversification strategy
Qualcomm has experienced a challenging year in the markets. With shares declining more than 24% since the start of January, Tuesday’s corporate announcement provided a much-needed boost for investor sentiment.
QUALCOMM Incorporated, QCOM
The San Diego-headquartered semiconductor company revealed that its board of directors has greenlit a new $20 billion stock buyback initiative. Shares of QCOM advanced over 3% following this disclosure.
This repurchase authorization supplements an existing program with approximately $2.1 billion remaining from an initiative launched in November 2024. Like its predecessor, the new program includes no expiration timeline.
Qualcomm simultaneously announced an increase to its quarterly cash dividend of roughly 3.4%, elevating the payout from $0.89 to $0.92 per common share. This adjustment brings the annualized dividend to $3.68.
Shareholders will receive the enhanced dividend for quarterly distributions made after March 26.
Chief Executive Officer Cristiano Amon characterized these actions as consistent with the company’s commitment to delivering shareholder value. “We remain focused on stockholder returns and executing on our ongoing diversification opportunities,” he stated.
The strategic timing of this buyback announcement appears deliberate. Qualcomm shares have faced considerable headwinds stemming from a worldwide memory chip shortage that has disrupted handset production among its primary customer base.
Memory Crunch Hits Customers
Handset manufacturers—representing Qualcomm’s primary revenue source—have been significantly affected by the memory supply constraints, creating downstream pressure on QCOM shares. Apple along with leading Android device producers depend heavily on Qualcomm’s chip technology.
This external pressure explains much of the stock’s substantial year-to-date erosion and suggests management views current valuation levels as an attractive entry point for capital deployment.
Diversification Push Continues
Qualcomm has aggressively pursued expansion beyond its traditional smartphone chip business. The corporation has made significant investments in data center processor technology and autonomous driving systems.
This diversification approach serves as a buffer against the smartphone market volatility currently impacting the company’s financial performance.
The $20 billion commitment represents a substantial capital allocation decision. Relative to Qualcomm’s market capitalization entering Tuesday’s session, a repurchase program of this magnitude constitutes a significant percentage of the company’s overall valuation.
Qualcomm has not specified a completion timeline for the new buyback program, consistent with its open-ended structure.
The enhanced quarterly dividend will be distributed to shareholders of record after the March 26 implementation date.
The post Qualcomm (QCOM) Stock Jumps 3% on Massive $20B Share Repurchase Plan appeared first on Blockonomi.
TLDR
- Partnership between OpenAI and Amazon Web Services (AWS) established Friday enables AI sales to federal government personnel
- The partnership encompasses government operations across both classified and unclassified levels
- AWS assumes responsibility for marketing OpenAI’s offerings to federal clients, with revenue shared between partners
- This arrangement strengthens OpenAI’s Department of Defense agreement secured following Anthropic’s contract termination
- Sam Altman, OpenAI’s CEO, previously modified the Pentagon agreement to incorporate additional safety provisions
A new partnership between OpenAI and Amazon Web Services will enable the distribution of artificial intelligence solutions to employees across U.S. federal government agencies. The arrangement includes provisions for both classified and unclassified government operations.
According to two sources with firsthand knowledge of the arrangement, the partnership was formalized on Friday, as The Information reported.
The arrangement designates Amazon’s sales force to market OpenAI’s technology and services to prospective government clients. Revenue generated from these sales will be shared with OpenAI.
Given AWS’s established position as a leading cloud infrastructure provider for numerous U.S. government organizations, the company represents an ideal distribution channel for OpenAI to access federal procurement opportunities.
This collaboration also bolsters a distinct Department of Defense agreement that OpenAI secured in late February. The DoD contract materialized following the termination of the Department’s arrangement with Anthropic.
Industry sources estimate the Pentagon agreement’s value in the millions of dollars. The contract represents OpenAI’s strategic expansion into the federal government sector.
Sam Altman, OpenAI’s chief executive, previously acknowledged that the Pentagon contract had been expedited. Following the situation with Anthropic, he admitted the company “shouldn’t have rushed” the process.
Enhanced Safety Provisions in Pentagon Agreement
Altman subsequently introduced updated language to the Pentagon contract. A key provision specifies that “the AI system shall not be intentionally used for domestic surveillance of U.S. persons and nationals.”
Altman further noted that the Defense Department provided assurances that OpenAI’s technology would remain off-limits to intelligence organizations like the NSA.
“There are many things the technology just isn’t ready for, and many areas we don’t yet understand the tradeoffs required for safety,” Altman said.
He further conceded the implementation appeared disorganized. “We were genuinely trying to de-escalate things and avoid a much worse outcome, but I think it just looked opportunistic and sloppy,” he said.
Government AI Competition Intensifies
In July 2025, Anthropic secured a $200 million Department of Defense contract. This made Anthropic the inaugural AI company to implement its models within mission-critical workflows on classified networks.
Last year, Google, OpenAI, and xAI each obtained DoD contract awards valued at up to $200 million.
Neither Amazon nor OpenAI provided immediate responses to Seeking Alpha’s requests for commentary.
The AWS collaboration enables OpenAI to extend its reach throughout the federal government ecosystem beyond defense applications. AWS’s pre-existing relationships with government entities provide OpenAI with access to agencies that would otherwise be difficult to penetrate independently.
The Information initially disclosed the AWS partnership on Monday, March 17.
The post OpenAI Partners with AWS to Distribute AI Solutions to Federal Government Agencies appeared first on Blockonomi.
TLDR
- Nebius (NBIS) soared approximately 15% Monday following confirmation of a massive $27 billion AI infrastructure agreement with Meta Platforms
- The deal includes $12 billion in guaranteed capacity spanning five years, alongside $15 billion in supplementary compute resources linked to NVIDIA Vera Rubin technology
- Shares retreated roughly 8.9% Tuesday when the company unveiled plans for a $3.75 billion convertible bond issuance to finance data center expansion
- CrowdStrike (CRWD) announced a collaboration with Nebius to embed its Falcon security suite within Nebius AI Cloud infrastructure
- Citi analysts launched coverage on NBIS with a Buy recommendation and $169 target price, while categorizing the investment as “High Risk”
Nebius Group experienced a turbulent 48-hour stretch in the market. The AI cloud infrastructure provider rocketed nearly 15% higher Monday before surrendering a substantial portion of those advances Tuesday — even as it secured a significant cybersecurity collaboration and received its first major Wall Street rating.
Nebius Group N.V., NBIS
Monday’s explosive move was fueled by a landmark agreement with Meta Platforms. According to the announcement, Nebius will provision $12 billion worth of dedicated computing resources to Meta across the next half-decade, with initial deployment scheduled for early 2026. Meta has additionally pledged to acquire another $15 billion in capacity connected to Nebius’s forthcoming NVIDIA Vera Rubin infrastructure rollouts — pushing the aggregate contract value to $27 billion.
“We are pleased to expand our partnership with Meta as part of securing more large, long-term capacity contracts,” said Nebius CEO Arkady Volozh.
The Meta announcement followed closely behind another significant development: a strategic alliance with NVIDIA revealed last week, which included a $2 billion equity investment from the semiconductor giant. That arrangement calls for collaborative development of next-generation hyperscale cloud infrastructure tailored for artificial intelligence applications.
Convertible Bond Offering Spooks Investors
Sentiment reversed course Tuesday. Nebius disclosed intentions to secure $3.75 billion via convertible note issuances — comprising two separate series maturing in 2031 and 2033 — earmarked for data center construction financing. Shares tumbled approximately 8.5% to $118.60 as market participants expressed concern over possible shareholder dilution should noteholders exercise conversion rights.
Nebius has set an ambitious goal of achieving 5 gigawatts of AI-focused power capacity by decade’s end, a dramatic escalation from merely 170 megawatts of operational capacity recorded last year. Success would position the company at roughly 5% of what Citi forecasts as a 110-gigawatt worldwide AI data center ecosystem.
Notwithstanding Tuesday’s selloff, Citi launched coverage on NBIS with a Buy designation and $169 valuation objective. Analyst Tyler Radke emphasized Nebius’s unique combination of data center infrastructure, proprietary hardware capabilities, and emerging cloud software offerings as distinguishing factors within the neocloud competitive landscape.
Radke acknowledged material risks, however. Nebius only commenced independent public trading in 2024 after separating from Yandex’s international operations. Meta and Microsoft collectively represent approximately 40% of projected 2026 recurring revenue streams — a concerning customer concentration level. Citi has formally designated the equity as “High Risk.”
“NBIS is positioned to gain share within an AI compute market that itself is more than doubling every two years,” Radke said.
CrowdStrike Brings Falcon to Nebius AI Cloud
Separately, CrowdStrike revealed a strategic partnership with Nebius to incorporate its Falcon cybersecurity architecture into Nebius AI Cloud offerings. The arrangement enables Nebius clients to execute AI workloads while maintaining continuity with their existing CrowdStrike security frameworks.
“Working with CrowdStrike means customers can run AI workloads on our full-stack platform without disrupting the security controls they already rely on,” said Nebius CRO Mark Boroditsky.
Morgan Stanley recently elevated CrowdStrike from Equalweight to Overweight, citing platform robustness and endpoint market potential. RBC Capital likewise reaffirmed its Outperform stance following impressive ARR expansion and increased fiscal 2027 projections.
CRWD stock was up 3.30% on the session.
The post Nebius (NBIS) Stock Volatility: $27B Meta Deal, $3.75B Bond Raise, and CrowdStrike Alliance appeared first on Blockonomi.
CryptoPotato
XRP is showing a modest recovery attempt, but the bigger picture still looks cautious on both the USDT and BTC pairs. The price has bounced from recent lows, and short-term momentum has improved, yet XRP is still trading below major moving averages and within broader bearish structures. That means buyers are improving the short-term picture, but they have not fully changed the trend yet.
Ripple Price Analysis: The USDT Pair
On the XRP/USDT chart, the cross-border token has pushed up toward the $1.50 psychological level after spending several sessions consolidating above the $1.10 to $1.20 support zone. This bounce is constructive, especially with RSI pushing higher, but XRP still sits below the descending trendline, 100-day and 200-day moving averages, and the heavy $1.75 to $1.80 resistance area. That zone remains the first major test for buyers.
If the asset can reclaim that region, the next upside target would be the broader $2.40 to $2.50 supply zone. But the price must also break above the 200-day moving average, located around $2.10, before reaching this zone. Until then, the current move looks more like a relief bounce inside a larger downtrend than a confirmed reversal. But as long as the price holds above the $1.10 to $1.20 base, buyers still have a platform to build on.
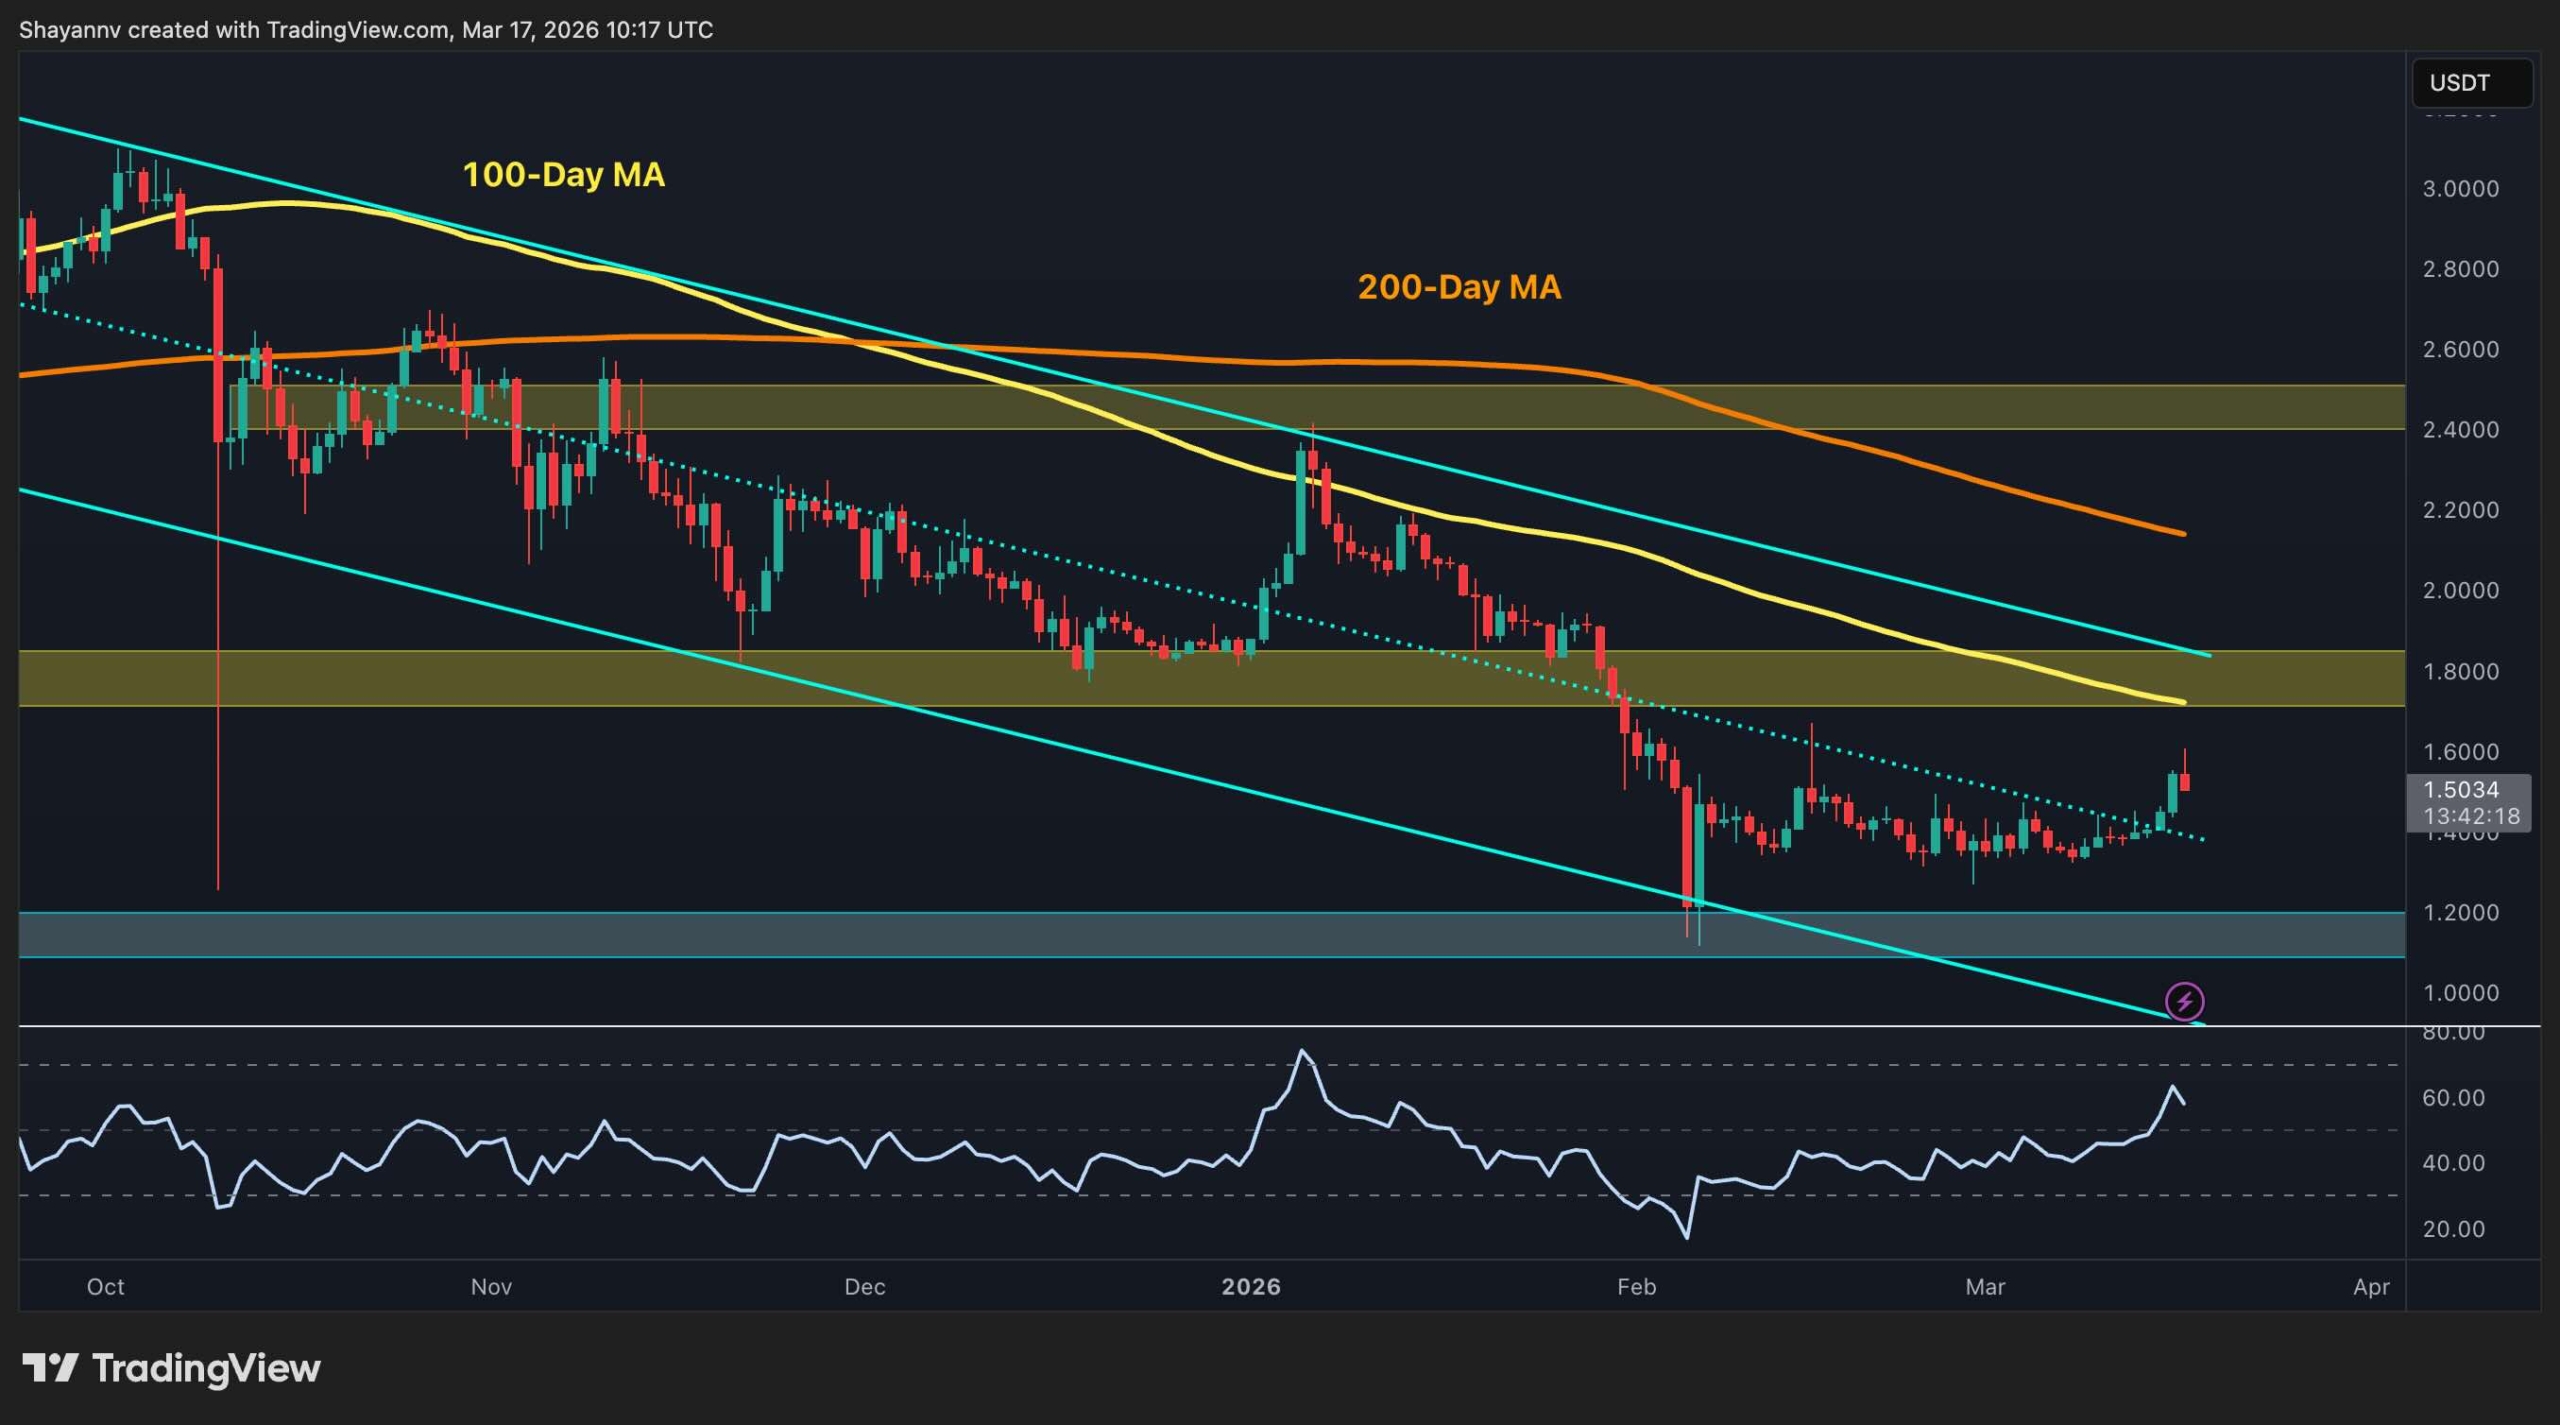
The BTC Pair
Against Bitcoin, XRP is also trying to stabilize after holding the key 2,000 sats support area. The pair has bounced back above 2,000 sats and is now attempting to regain some short-term momentum, but it remains below both the 100-day and 200-day moving averages, which continue to cap the structure from above.
The first important resistance on the XRP/BTC chart sits around 2,200 sats, where the two major moving averages are located. The next key horizontal level will be the 2,400 to 2,500 sats area. A clean move above those levels would improve the outlook and suggest that relative weakness versus Bitcoin is starting to fade. If the pair gets rejected again, though, the 2,000 sats zone remains the key support to watch, with a break below it reopening the path toward the lower boundary of the channel around 1,700 sats.

The post Ripple Price Prediction: What’s Next for XRP After Reclaiming Key Resistance? appeared first on CryptoPotato.
There’s a specific type of crypto participant who doesn’t chase price charts. They look for infrastructure. They look for systems that generate Bitcoin — not promises of Bitcoin, not tokens that might convert to Bitcoin someday — but actual BTC, flowing from real network activity.
That participant is exactly who Bitcoin Everlight was built for.
And right now, during an open presale window, those participants are beginning to activate shards.
The question worth asking isn’t whether Bitcoin validation infrastructure is interesting. It clearly is. The question is whether this particular platform has built something worth getting into early — and what “early” actually looks like in practice.

A Network That Pays You in the Only Coin That Matters
Strip away the terminology for a moment and Bitcoin Everlight is doing something genuinely simple: it runs a distributed Transaction Validation Node network, and it shares the fees that network generates with the people who participate in it.
Those fees are paid in BTC.
Not in a governance token. Not in a project-native coin whose value depends entirely on whether the project succeeds. In Bitcoin — the asset that has been the benchmark for the entire crypto industry for over a decade.
The platform introduced Everlight Shards as its participation layer: a simplified activation model sitting on top of the validation node framework. Everlight users don’t need a technical background or a rack of mining equipment. They acquire BTCL tokens, hit a tier threshold, and the shard activates — pulling them into the network automatically.
The project completed dual smart contract audits through Spywolf and Solidproof, alongside dual KYC verifications through Spywolf and Vital Block — all completed before the presale opened.

From First Token to First Reward — The Actual Process
The path from zero to active shard is four steps long, and none of them require anything technical.
You acquire BTCL tokens. The presale is live right now at $0.0008 per token, with entry points beginning at $50 — meaning the barrier to getting a position in this network is quite low.
Once your holdings reach a tier threshold, your shard activates automatically based on the USD value committed at the time of purchase. There’s no manual trigger, no application, no waiting for approval.
From that point, your activated shard participates in validation through the distributed infrastructure — passively, continuously, without any ongoing management on your end.
Rewards begin flowing immediately upon activation. During the presale phase, those rewards are paid in BTCL at a fixed rate tied to your tier. After mainnet launches, the model transitions to performance-based BTC distribution — meaning what you earn scales with how much real transaction activity moves through the network.
How the Shard Tiers Are Structured
The shard tier structure is built around three activation levels, each one carrying a different reward rate and a different level of network participation:
Azure Shard activates at $500 and earns up to 12% APY in BTCL during the presale phase, transitioning to BTC earnings at mainnet.
Violet Shard activates at $1,500 and earns up to 20% APY during presale — the mid-tier entry point for participants looking to deepen their position in the network.
Radiant Shard activates at $3,000 with up to 28% APY during presale, representing the highest participation tier currently available.
Users who hold tokens below any threshold aren’t locked out — they hold a dormant shard position that activates the moment their balance crosses the next tier. The system is designed to reward genuine alignment with the network instead of short-term speculation.

The Thing Most Crypto Reward Systems Get Wrong
The vast majority of passive reward models in crypto share one structural flaw: the reward is the same token you already own. Your earnings are denominated in the project’s own asset, which means their real-world value is completely circular — it depends on whether other people keep buying the same thing you bought.
Bitcoin Everlight breaks that loop. Post-mainnet rewards come from BTC-denominated transaction routing fees generated by actual network usage. Participation isn’t rewarded with inflation. It’s rewarded with a share of real economic activity, paid in an asset that doesn’t depend on the platform’s own price performance to have value.
That’s the structural difference. And for participants thinking beyond the presale phase — thinking about what they’re holding a year from now — it’s the part worth paying attention to.

Six Days. Phase 1 Pricing. Then It Changes.
Bitcoin Everlight’s Phase 1 presale has 472,500,000 tokens remaining at $0.0008 per token. The window is approximately six days from today.
When Phase 1 closes, the pricing available right now closes with it. Shards activated during this phase lock in at the earliest available entry point — and the BTCL rewards begin accumulating from the moment of activation, not from some future launch date.
As Bitcoin Everlight continues expanding its validation infrastructure, early participants are beginning to explore what the shard activation model means for their own BTC exposure strategy.
Users interested in understanding how Everlight Shards work — and what the activation process looks like — can explore the platform directly here.
Disclaimer: The above article is sponsored content; it’s written by a third party. CryptoPotato doesn’t endorse or assume responsibility for the content, advertising, products, quality, accuracy, or other materials on this page. Nothing in it should be construed as financial advice. Readers are strongly advised to verify the information independently and carefully before engaging with any company or project mentioned and to do their own research. Investing in cryptocurrencies carries a risk of capital loss, and readers are also advised to consult a professional before making any decisions that may or may not be based on the above-sponsored content.
Readers are also advised to read CryptoPotato’s full disclaimer.
The post What If Bitcoin Everlight Shards Unlock Your BTC Earnings Today? appeared first on CryptoPotato.
[PRESS RELEASE – George Town, British Virgin Islands, March 17th, 2026]
Aster, a privacy-focused trading ecosystem backed by YZi Labs, today announced the official launch of Aster Chain Mainnet. This purpose-built Layer 1 blockchain is designed to dismantle the “transparency trap” of modern DeFi, offering institutional-grade privacy and CEX-level performance to professional and retail traders worldwide.
Ending the Era of Onchain Position Hunting
Transparency is a defining characteristic of decentralized finance, supported by public ledgers, verifiable transactions, and open protocols. However, transparency between protocols and users differs from transparency among market participants. When trading activity, including order placement, position size, and liquidation levels, is fully visible on-chain, such information may be observed and used by other participants in the market.
Position hunting – where traders identify a large position, see its liquidation price, and coordinate to trigger a forced liquidation – has cost traders millions of dollars on fully transparent platforms. Infamously, in March 2025, a trader opened a $375 million BTC 40x short on a fully transparent platform. Traders quickly began openly coordinating on Twitter to pool funds and hunt the position.
Aster’s default privacy removes that attack surface entirely.
The Aster Thesis: Privacy is a Fundamental Right
Unlike existing solutions that treat privacy as an opt-in feature or a third-party wrapper, Aster Chain embeds encryption directly into the execution layer. On Aster, privacy is the default, not a privilege.
The Aster privacy stack utilizes a ZK-verifiable encrypted architecture:
- ZK-Verifiable Encryption + Stealth Address Mechanism: Every order is ZK-verifiable encrypted before it reaches the chain; with Account Privacy enabled, orders are routed through unique stealth addresses, ensuring no link between users’ wallets and their trading activity, and preventing any third party from tracing, correlating, or reconstructing trades.
- Selective Disclosure: While asset transfers remain traceable for compliance, the execution layer shields strategic intent. Users who want their activity visible can choose to make it public. With Account Privacy enabled, users can generate a Viewer Pass to share with selected parties, allowing only those with access to the pass to view their private orders.
- Zero Performance Trade-off: Aster Chain achieves peak throughput of 100,000+ TPS and a median block time of 50ms, all without gas – performance that matches the speed traders expect from a centralized exchange.
“Transparency between a protocol and its users is a fundamental feature, but transparency between a trader and their competitors is a critical vulnerability,” said Leonard, CEO at Aster. “Aster Chain is the only architecture that treats privacy as a fundamental requirement for a fair market, neutralizing predatory attacks at the base layer.”
CEX Speed Meets DEX Principles
Aster Chain delivers the sub-second finality and high-leverage experience of a CEX while upholding the core tenets of decentralization: self-custody, verifiability, and permissionless access. Trading privacy removes the last reason to stay on a centralized exchange. The network is supported by a native bridge to BNB Chain and proprietary oracles to ensure high-fidelity price data.
Fuelling the Next Wave of Innovation
The mainnet launch marks the start of a phased expansion. Beyond the flagship Aster trading UI, the ecosystem is inviting builders to create specialized vaults and collaborative DeFi products through Aster Code.
To coincide with the launch, Aster will initiate a Staking Program within a week to reward early supporters and liquidity providers.
About Aster
Aster is a privacy-first onchain trading platform backed by YZi Labs, with unique features like Hidden Orders to protect user trading activity. It offers perpetual contracts across crypto, stocks and commodities, as well as crypto spot trading, and is powered by Aster Chain, a Layer 1 blockchain built to power the future of decentralized finance.
Users can learn more about Aster on the official website or follow Aster on X.
The post Aster Chain Launch: Defining a New Era for Onchain Privacy and Transparency appeared first on CryptoPotato.
The team behind the controversial crypto project Pi Network unveiled several important updates lately, while the community celebrated its symbolic Pi Day.
PI’s price had its glory moments, briefly climbing to a five-month peak, but then experienced a massive correction.
The Latest Developments
March has been quite eventful for Pi Network. At the start of the month, the Core Team announced that the protocol v19.9 migration was successfully completed, while version 20.2 was scheduled for release around March 12. The official confirmation about the migration arrived with the Pi Day celebratory announcement.
Another major development was Kraken’s decision to allow trading services with Pi Network’s native cryptocurrency. This happened just a day before Pi Day – the community’s special date, celebrated because it matches the mathematical constant π (3.14), and which is logically held annually on March 14.
This year, the team marked the occasion by rolling out several ecosystem upgrades designed to boost utility, attract more developers, and strengthen the network’s overall infrastructure. Some of the improvements include new Mainnet capabilities for Pi App Studio, advancements that enable future smart contract functionality, KYC validator rewards, and more.
Most recently, Pi Network’s team disclosed that second migrations have started and “will continue with a gradual rollout, opening the door for Pioneers to bring additional PI to Mainnet and further participate in the ecosystem.” The post on X received mixed reactions: some users praised the move, whereas others questioned why the team had launched a second migration when the first one hadn’t been properly completed.
PI Remains Trending
The numerous developments surrounding Pi Network led to significant volatility in PI. The protocol updates, the listing on Kraken, and the anticipation of Pi Day boosted the price to a five-month peak of almost $0.30. At one point, the asset’s market capitalization neared $3 billion, making PI the 36th-largest cryptocurrency.
However, over the past few days, the price headed south just as rapidly in what appeared to be a classic “sell-the-news” moment. As of this writing, PI trades at around $0.18 (per CoinGecko’s data), representing a 9% daily decline and a 19% collapse over the week.
Despite the downtrend, the asset remains one of the most-searched digital assets. It is the fifth-most trending cryptocurrency on CoinGecko today, surpassing well-known names such as Bittensor (TAO), Ethereum (ETH), and Bitcoin (BTC).

What Lies Ahead?
In the following days, the daily token unlocks will exceed 15 million on a couple of occasions. Nonetheless, the end of March and the beginning of April are expected to be much calmer on that front, which could stabilize the price and slow down the recent pullback.

Moreover, PI’s Relative Strength Index (RSI) has fallen to 10, signaling oversold conditions that can sometimes precede a resurgence. The technical analysis tool ranges from 0 to 100, and conversely, anything above 70 is considered bearish territory and indicates that a short-term correction could be on the way.

The post Pi Network (PI) News Today: March 17 appeared first on CryptoPotato.
[PRESS RELEASE – New York, United States, March 17th, 2026]
GSR, crypto’s capital markets partner, today announced the $57 million acquisition of Autonomous and Architech. The transaction significantly expands the firm’s ability to support tokenized organizations from formation through scale. Autonomous will continue to operate under its existing brand within the GSR group, providing launch operations, operational support, and financial infrastructure for tokenized organizations, while Architech will form the foundation of GSR Digital Asset Advisory, working alongside GSR’s institutional trading, liquidity, and asset management capabilities.
Launching a tokenized network today often requires engaging multiple structuring advisors, token economists, market makers, and listing consultants, typically operating under fragmented mandates and misaligned incentives. GSR’s integrated model replaces that patchwork with a coordinated approach, aligning foundation structuring, governance design, token economics, fundraising and exchange strategy, and long-term capital planning. Clients can also access GSR’s institutional trading, derivatives, and asset management capabilities through its existing, regulated entities.
“The crypto industry has matured, but its capital markets infrastructure remains fragmented,” said Xin Song, CEO of GSR. “Entrepreneurs should not have to allocate significant portions of their token supply to disconnected service providers. By aligning advisory expertise alongside GSR’s institutional trading and asset management capabilities, we provide coordinated support from pre-launch through scale.”
Beyond launch, the platform addresses a structural challenge in crypto: foundations frequently begin life managing substantial digital asset treasuries without the financial infrastructure required to oversee them. GSR is able to provide strategic treasury and capital markets guidance, including:
- Cash and Liquidity Planning – optimizing working capital and banking relationships.
- Cash Flow Forecasting – runway modeling and capital planning.
- Risk Management – structured approaches to manage token volatility and exposures, with execution available through GSR’s trading and derivatives businesses.
- Capital Allocation Strategy – disciplined diversification and portfolio construction, supported by GSR’s asset management and trading capabilities.
Today, many crypto treasuries function primarily as passive holdings of their own tokens. Introducing structured diversification and income strategies can transform those balance sheets into sustainable funding engines without diluting long-term token alignment. Professionalizing treasury management not only strengthens individual networks but supports the long-term stability of the broader ecosystem.
“Crypto foundations are effectively managing large, complex balance sheets from day one,” said James Hutchings, Managing Director, Autonomous. “Integrating with GSR allows us to pair deep advisory expertise with institutional trading infrastructure.”
“Successful tokenization doesn’t end at launch,” added Matt Solomon, CEO, Architech. “It requires coordination across design, liquidity, and long-term financial management. This platform unifies those elements within a first-of-its-kind, integrated offering.”
With this acquisition, GSR advances its strategy to become crypto’s one-stop capital markets partner, delivering institutional standards, aligned incentives, and full-lifecycle support for the next generation of on-chain businesses.
About GSR
GSR is crypto’s capital markets partner, delivering market-making services, institutional-grade OTC trading, and venture backing to founders and institutions. With more than a decade of experience, we provide strategic guidance, market intelligence, and access to a global network to help teams scale. Users can visit www.gsr.io for more information, including the General Terms Business, relevant disclosures, and GSR’s trading terms.
About Autonomous
Autonomous is an end-to-end launch, finance, and operations partner for digital asset projects. With comprehensive white-glove services including fractional CFO/COO services, finance management, treasury operations, payment processing, partner coordination (i.e., exchanges, custodians, market makers, OTC desks), multi-sig and treasury architecture, token minting, liquidity planning, lock/vest administration, grants management, governance support, and banking setup. Autonomous support projects through their full lifecycle, spanning pre-launch preparation, TGE, and go-to-market execution, and post-launch steady-state operations.
About Architech
Architech is the premier advisory firm specializing in fungible token launches and bespoke liquidity strategies. Since its inception in October 2024, Architech has supported token launches totaling over $10 billion in peak fully diluted value. Its core services span mechanism design, market maker facilitation, centralized exchange coordination, GTM strategy, and fundraising.
The post GSR Acquires Autonomous and Architech to Launch Integrated Capital Markets and Treasury Platform for Crypto appeared first on CryptoPotato.