Cryptocurrency Posts
Crypto Briefing
Argentina's ban on Polymarket may hinder access to global prediction markets, impacting financial transparency and innovation in the region.
The post Argentina blocks access to Polymarket after early bets on February inflation appeared first on Crypto Briefing.
Bitcoin's surge highlights market volatility amid global economic shifts, underscoring investor sensitivity to macroeconomic policy signals.
The post Bitcoin briefly touches $76,000 ahead of key economic decisions this week appeared first on Crypto Briefing.
XRP's surge highlights shifting investor sentiment and market dynamics, potentially influencing future crypto investment strategies and valuations.
The post XRP breaks through $1.5 after double-digit weekly growth appeared first on Crypto Briefing.
OpenSea delays its SEA token launch as CEO Devin Finzer cites challenging crypto market conditions and promises a new timeline later.
The post OpenSea delays SEA token launch as CEO cites challenging crypto market conditions appeared first on Crypto Briefing.
Cboe files with SEC to launch near 24x5 trading for U.S. equities, reflecting growing global demand for overnight stock market access.
The post Cboe targets December 2026 rollout for near 24×5 U.S. equities trading appeared first on Crypto Briefing.
Bitcoin Magazine
Bitcoin Magazine

Bitcoin Price Surges Above $75,000 as Bullish Momentum Builds
The bitcoin price climbed above $75,000 on Monday evening extending a sharp rebound that has lifted the asset nearly 25% from its February lows and reignited bullish sentiment across the crypto market.
The world’s largest cryptocurrency broke through the psychological $75,000 level during U.S. trading hours after spending several weeks consolidating in a tight range.
The move marks Bitcoin’s strongest price since early February and reflects improving risk appetite across global markets.
Bitcoin price’s latest surge comes after the asset bottomed near $63,000 in February during heightened geopolitical tensions linked to the Iran–Israel War. Since then, prices have staged a steady recovery as macroeconomic conditions stabilized and investor confidence returned.
Bitcoin’s price has outperformed other assets like gold and the S&P 500.
Markets received a boost over the weekend after signs of easing tensions around the Strait of Hormuz, one of the world’s most important oil shipping routes.
Two commercial tankers reportedly transited the waterway on Sunday for the first time since the conflict began, after Iran indicated its shipping restrictions would apply only to vessels linked to its adversaries.
JUST IN: Bitcoin pumps back to $75,000!
— Bitcoin Magazine (@BitcoinMagazine) March 17, 2026pic.twitter.com/Tqz6rwTTGg
Strategy buys into the bitcoin price game
At the same time, corporate demand for bitcoin continues to expand. Earlier Monday, Strategy, led by Michael Saylor, disclosed the purchase of 22,337 additional bitcoin for approximately $1.57 billion.
The acquisition increased the company’s total holdings to 761,068 BTC, with a combined market value of roughly $50 billion.
Institutional interest is also building internationally. Tokyo-listed investment firm Metaplanet recently secured about $255 million from global investors to accelerate its bitcoin treasury strategy, with additional warrants that could raise total funding to more than $530 million for future purchases.
Despite the rally, market participants remain cautious about declaring a full breakout.
Bitcoin price experienced several rebounds of similar magnitude during the 2022 crypto downturn before eventually falling to cycle lows below $16,000 following the collapse of FTX.
For now, traders are watching whether bitcoin price can maintain support above the $75,000 region. A sustained hold above that level could open the door to a push toward $80,000, which previously acted as a key support zone before the early-2026 correction.
Jack Mallers, CEO of Strike, has recently argued that the current market structure favors long-term accumulation, urging investors to “turn on your DCA,” referring to the dollar-cost averaging strategy of buying Bitcoin prices at regular intervals regardless of price.
According to Mallers, bitcoin price is trading near historically important support zones and prolonged consolidation periods often provide some of the best opportunities to steadily accumulate the asset ahead of major market moves.

This post Bitcoin Price Surges Above $75,000 as Bullish Momentum Builds first appeared on Bitcoin Magazine and is written by Micah Zimmerman.
Bitcoin Magazine

Bitcoin at Key Support Levels — Why Jack Mallers Says Turn On DCA Now
Few people are as close to the center of the Bitcoin industry as Jack Maller. A young, tech-savvy CEO of a major Bitcoin exchange in the United States, partnered with Tether, the most profitable company in recent history, the son of Chicago traders, Jack, is plugged in. In his podcast, BLABLA, he has been ringing the bell over the past few weeks, “It’s time to turn on your DCA”.
But what does DCA even mean? An acronym for “dollar cost average,” it is an investment strategy ported into Bitcoin that has become the gold standard recommendation to Bitcoin fans across the industry. Turning on your DCA means buying bitcoin on a regular basis, regardless of the price. Why does this work? Well its quite simple actually. If you buy regardless of the price on a weekly basis for example, you will buy as much of the lower prices as you will the higher ones. In fact, bitcoin tends to spend significant portions of time in ‘consolidation’, which is another word for neither going up nor down, but rather going sideways. This is a great opportunity to accumulate sats.
Every time you buy bitcoin at a price lower than you bought before, you are lowering your ‘dollar cost average’ or rather, the average cost of your total bitcoin in dollar terms. Eventually, because of Bitcoin’s unmatched and inelastic scarcity, combined with its network-like growth, the price tends to go up, and when it goes up, it does so quickly. Most people miss the opportunity to buy at the perfect time, right before a major move up. But Bitcoiners doing DCA will already have an optimal average price, perfectly set up to profit from a large move up. As a result, you can end up with an average purchase price curve that looks something like this, right before a major bull run.

There are other profound benefits to the Bitcoin DCA strategy. Because it involves small, manageable investments over a long period of time, the amount risked at any single point in the investment journey is relatively small. Investing, for example, 10% of your disposable income a month in Bitcoin would not be a heavy burden, making bear markets not just tolerable but actually turning them into incredible investment opportunities.
Multiple exchanges have also implemented automated Bitcoin DCA features, such as Kraken, Strike, Swan, and Bull Bitcoin, which cover many countries throughout the world. The automated aspect of this strategy can not be overstated. Compared to the high stress, intense cognitive load of a professional trader, automated Bitcoin DCA is a walk in the park, and it yields comparable results!
Books like The Art of Execution cover long-term studies done on professional traders on Wall Street, demonstrating that most lose money, and of those that do earn money, lose for 10 years straight before becoming good enough to make it. The human capital required to become a good trader is not cheap, but Bitcoin DCA is set it and forget it; you can go do something else with your life while your Bitcoin stack grows.
You can calculate the long-term value of the Bitcoin DCA strategy with a variety of tools online, such as this BM Pro calculator which lets you see what would have happened if you had started buying say $100 of Bitcoin every two weeks, back in 2017. Needless to say, the results are incredible.

In recent years, Gold has started performing very well with DCA as well, but those calculations are mostly dwarfed by its meteoric rise in 2025. Historically, Gold has much longer cycles than Bitcoin, and can easily stay still for many years after a big move, being the giant that it is. Whereas Bitcoin has a lot more upside overall and its cycles are much shorter, arguably leading to better returns if played right.
Now Is The Time To Start Your DCA
Why now, you might ask? Isn’t it always good to have your Bitcoin DCA on? Well, there’s a great question, and implicit in Jack Maller’s quote, the answer is no. Technically, you can start your DCA at the top of a bull market and end up with a great average down purchase price by the time the next bull market takes off. But you certainly would be better off not buying the top.
The following is not investment advice and does not represent the opinion of Bitcoin Magazine or BTC Inc. They are the opinions of the author alone.
The problem, of course, is that no one knows where the top of the market is; if they did, they’d be rich! Their strategy would get discovered, replicated by others, removing its competitive advantage over time. That’s the nature of markets; secret knowledge only works while it is secret. When it becomes public, the rest of the market adapts.
Since Bitcoin DCA does not attempt to price the top, it avoids the issue entirely. But many people turn off DCA when they feel the market is nearing a top, and tops historically only happen after crossing the previous all-time high price from a previous cycle. So, despite the math, some do turn off their DCA, only to turn it back on when a clear bear market has begun.
So is Bitcoin in a bear market? Sort of. The price is down 50%From the top, but it also dropped very quickly, suggesting a reaction to larger macro events, which in turn means that most of the pain is likely behind us. There’s also a variety of technical price indicators that are flashing green, suggesting we are far closer to the bottom than we are to the top. In other words, it is time to get in.

Weekly RSI, a momentum indicator, is in oversold territory historically for Bitcoin. You can go back a decade in Bitcoin, and every time the weekly RSI reaches levels this low, it signals a bottom. The Mayer multiple, which compares Bitcoin to the 200-day moving average, is also in the buy zone territory.


The fear and greed index for Bitcoin and the broader crypto market has been at extreme fear for a while now, and you know what they say. If there’s blood on the streets, it’s time to buy.
There’s also a historical analysis that looks at percentage-based corrections in Bitcoin from the top of the market to the bottom. These corrections tend to be smaller over time, with the last bear market drawdown going as far down as 77%. We are currently at about 51% correction, if we were to go down 70%, it would mean we are already more than half way down. So closer to the bottom than we are to the top.


Notice we are already halfway through the Bitcoin halving cycle as well, with the next halving expected in early 2028. The last halving was anticipated with bitcoin making all-time highs near the halving, as the metric has become widely known, for the same reasons, we might see an anticipation of the halving again this cycle. Historically speaking, we are not likely to see a correction deeper than 70% from the top, an extreme scenario that would push Bitcoin to $40,000 temporarily.
Dips of the sort are also less likely given the institutional adoption of Bitcoin, which has massively expanded the liquidity of this market. If we did go that far down, those prepared to buy would find an incredible opportunity, but it would be speculation and a trading mindset to try to catch the absolute bottom, hence why low-risk, consistent DCA is so great.
Finally, we have the death cross and colden cross combo. Pitting off the 50-day moving average versus the 200-day moving average leads to a fairly predictable dynamic. Markets sell before the 50-day crosses below the 200-day. And they pump before the 50-day crosses above the 200-day. Bitcoin has now crossed above the 50 day moving average, if it can stay there or continue to consolidate around the $70,000 mark, it will be very well positioned for a run up deeper into 2026 as the golden cross occurs, probably signaling the beginning of a new bull market.

Macro Economic Trends
AI stonks have been soaking up a lot of liquidity and investment this cycle, with roughly a trillion dollars invested in AI infrastructure in the past handful of years. The market is broadly bullish on AI continuing its disruption path. I don’t think it takes a genius to say that an “AI fear and greed index” would be way over on the greed side right now. It may be that AI has brought us to a new paradigm of only up for AI stocks and tech, but that kind of thinking is usually a sell sign. If there is some sort of event in the next year or two akin to the dot-com crash that leads to a serious AI correction, we may see speculative and investment capital look for other options beyond AI, bringing liquidity back to Bitcoin. Though it is arguably still early to call this.


Meanwhile, U.S. debt yield, or the interest on the debt of the U.S. Government, has stalled out with signs from the FED that lower rates are coming. Trump nominated Kevin Warsh as the next Chair of the Federal Reserve back in January, and his confirmation — while stuck in the Senate — is likely to go through soon, signaling a looser monetary policy, aligned with Trump’s broader economic strategy, which favours lower interest rates and more money printing, coupled with aggressive growth and deregulation.
The Fed funds’ effective fund rate is also trending down, signaling cheaper money coming into the market, likely in part due to more money printing by the Fed, since U.S. bonds are not particularly attractive to foreign investors during this time of geopolitical tension.

Fundamental Analysis
As far as fundamental trends or changes to Bitcoin, the only question that has emerged is in relation to quantum computing and whether it can break Bitcoin’s cryptography. This fear, uncertainty, and doubt (FUD), while new to many investors, is not new to Bitcoin technologists. Broad consensus within the Bitcoin industry remains that quantum computing advancements remain mostly hype and have a long way to go before they become a threat to Bitcoin.
Meanwhile, Bitcoin core developers have been actively discussing long-term solutions to quantum for at least a couple of years now, though as far back as the Satoshi era. Formal improvement proposals have already been drafted, and software is well on its way to reach maturity, should it be needed to deal with a quantum threat. So overall, investors who sold due to quantum FUD might find themselves on the wrong side of the trade.
The Barrier To Entry Into Bitcoin
So yes, most signs suggest that it is time to turn on your Bitcoin DCA. And the good news is, there are only a couple of things people need to really understand about Bitcoin to benefit from it. Why is its supply limited, and how does it remain limited? And how to protect it long term via good self-custody. These essential skills in Bitcoin are not trivial to acquire; they do demand some study and interest from investors, but they are simple hobbies compared to the knowledge requirements of becoming a professional trader or investor who can survive the volatility and unpredictability of the market.
In terms of understanding Bitcoin’s economics, Bitcoin Magazine has a premium selection of books on the topic, any of which is likely to give you the fundamentals and much more in an eloquent and enjoyable way. And when it comes to self-custody, Bitcoin Magazine also has a fresh review of excellent tools, written by yours truly, for the year 2026.
This post Bitcoin at Key Support Levels — Why Jack Mallers Says Turn On DCA Now first appeared on Bitcoin Magazine and is written by Juan Galt.
Bitcoin Magazine

Eric Trump Confirmed As Speaker For Bitcoin 2026 Conference
Bitcoin Magazine has confirmed that Eric Trump will take the stage at the upcoming Bitcoin 2026 conference, adding another high-profile voice to the event’s growing lineup.
The businessman and increasingly vocal bitcoin advocate has emerged over the past year as one of the most prominent political-adjacent supporters of the asset, repeatedly arguing that Bitcoin represents both a financial revolution and a strategic opportunity for the United States.
JUST IN:
— Bitcoin Magazine (@BitcoinMagazine) March 16, 2026Eric Trump to speak at the world's largest Bitcoin conference in Las Vegas next month
pic.twitter.com/iWCVl2Kskt
Trump’s presence at the conference comes amid his expanding involvement in the Bitcoin ecosystem, including his role as co-founder and chief strategy officer of American Bitcoin, a mining and treasury company focused on accumulating BTC.
In recent months, Trump has delivered some of the most bullish public commentary on Bitcoin from a figure closely tied to American politics and finance. In remarks, he declared that he has “never been more bullish on bitcoin in my life,” adding that he believes the asset could eventually reach a seven-figure valuation.
His confidence reflects a broader narrative he has promoted at industry conferences and media appearances — that global demand for Bitcoin is accelerating rapidly. During one panel appearance last year, Trump said the momentum around the asset is unmistakable, stating that “everybody wants bitcoin, everybody is buying bitcoin.”
Trump: America should dominate bitcoin
Trump has also framed Bitcoin as part of a larger geopolitical and economic shift, arguing that the United States has an opportunity to lead the emerging digital asset economy. Speaking about the industry’s growth, he said the goal is to bring innovation back to the country and ensure America dominates the next phase of financial infrastructure.
“We are bringing Bitcoin to America and America is going to win the crypto revolution,” Trump said during a conference panel.
Beyond rhetoric, Trump has backed that stance with business initiatives. His firm American Bitcoin has been expanding its holdings and mining capacity as part of a long-term accumulation strategy.
The company recently increased its corporate treasury to thousands of bitcoin while expanding its mining operations in the United States.
Bitcoin 2026 Returns to Las Vegas Bigger Than Ever
Bitcoin 2026 will take place April 27–29 at The Venetian in Las Vegas and is expected to be the largest Bitcoin event of the year.
Focused on the future of money, Bitcoin 2026 will bring together Bitcoin builders, investors, miners, policymakers, technologists, and newcomers from around the world. The event will feature a wide range of pass types, including general admission passes designed specifically for those new to Bitcoin, alongside premium passes for professionals, enterprises, and institutions.
With multiple stages, immersive experiences, technical workshops, and headline keynotes, Bitcoin 2026 is designed to serve both first-time attendees and long-time Bitcoiners shaping the next era of global adoption.
Past Bitcoin Conferences in the U.S.
Bitcoin’s flagship conference has scaled dramatically over the past five years:
- 2021 – Miami: 11,000 attendees
- 2022 – Miami: 26,000 attendees
- 2023 – Miami: 15,000 attendees
- 2024 – Nashville: 22,000 attendees
- 2025 – Las Vegas: 35,000 attendees
Bitcoin Magazine readers can save 10% on Bitcoin 2026 tickets using code ‘ARTICLE10‘ at checkout.
Stay at The official hotel of Bitcoin 2026, The Venetian, and get a guaranteed low rate plus 15% off your pass. Be in the middle of where the fun is all happening, and where the networking never ends.
Bring your whole team to Bitcoin 2026 and get 20% off your entire order, bring more than six in a group and get 25% off for a limited time.
Volunteer at Bitcoin 2026 and get Pro Pass access plus exclusive perks.
Location: The Venetian, Las Vegas
Dates: April 27–29, 2026
With tens of thousands of attendees expected and hundreds of major speakers like David Bailey already confirmed, now is the time to lock in your ticket.
Buy Bitcoin 2026 Tickets — Save 10%
This post Eric Trump Confirmed As Speaker For Bitcoin 2026 Conference first appeared on Bitcoin Magazine and is written by Micah Zimmerman.
Bitcoin Magazine

Bitcoin’s Ownership Base is Maturing, Reducing Reliance on Retail: Analysts
Bitcoin investors have shown surprising resilience despite recent market turbulence, fueled by institutional investors and aggressive corporate treasury buyers.
Analysts say this trend highlights a structural shift in ownership that could support long-term growth. Institutional demand is clearly back, with “four consecutive sessions of ETF inflows and aggressive spot demand…suggesting one thing: institutional buyers have returned and they’re ready to increase their holdings around current prices, which recovered to above $70k as a result,” Bitfinex said in a note to Bitcoin Magazine.
Bitfinex wrote that “a sustained break above resistance could trigger momentum expansion, as positioning and the balance of flows suggest that the market is preparing for its next directional move after weeks of range trading.”
Bitwise Chief Investment Officer Matt Hougan also noted Bitcoin ETFs have held up despite a roughly 50% price drop since October 2025, underlining institutional commitment.
“The best evidence we have is in the ETF market,” Hougan said, according to Coindesk reporting.
“Bitcoin ETFs accumulated roughly $60 billion in net flows from their launch in January 2024 through October 2025. Since October 2025, prices are down 50%, but we’ve seen less than $10 billion in outflows from ETFs,” he said.
Hougan described institutional investors as exhibiting “diamond hands,” maintaining positions despite severe market drawdowns. He attributes this persistence to the non-consensus status of BTC.
Hougan said that institutional investors who buy into BTC today are still sticking their neck out and standing out from their peers. That career risk, he explained, fosters unusually high conviction, meaning investors allocating capital to bitcoin today tend to be 80–90% convinced of its long-term value rather than mildly optimistic.
This conviction underpins Hougan’s reaffirmed long-term bitcoin forecast of $1 million per coin.
“The wildest thing about my $1 million prediction is that it’s not wild at all,” he said. “All you need for bitcoin to get to $1 million is for the global store of value market to continue to grow as it has for the past 20 years and for bitcoin to become a minor but material part of that market.”
Last week, Hougan argued that skepticism over Bitcoin reaching $1 million stems from a misunderstanding of its valuation, as many analysts use “static math” that ignores the rapidly growing global store-of-value market.
Framing BTC as an emerging competitor to gold, he estimates that with a $38 trillion market and BTC’s fixed supply of 21 million coins, the $1 million price target is plausible.

Bitcoin isn’t very speculative anymore
Supporting this thesis, Bernstein analysts also noted that bitcoin’s ownership base has matured, reducing reliance on retail speculation.
In a March 16 research note seen by Bitcoin Magazine, they highlighted the growing influence of spot BTC ETFs and corporate treasury buyers such as Strategy.
The firm described Strategy as a “bitcoin central bank of last resort,” citing its aggressive accumulation model, which has added more than 66,000 BTC so far in 2026 at an average cost near $85,000. Strategy’s total holdings now exceed 761,000 BTC, valued around $56 billion.
Bernstein emphasized that institutional inflows are reshaping BTC’s ownership structure. Spot ETFs absorbed about $2.1 billion in inflows over three weeks, nearly offsetting year-to-date outflows of $460 million.
Institutional vehicles now control roughly 6.1% of BTC’s total supply, while coins inactive for over a year represent approximately 60% of circulating supply, signaling a growing base of long-term holders.
On top of this, on-chain indicators point to a late-stage bear cycle, as Lacie Zhang of Bitget Wallet explained to Bitcoin Magazine: “The convergence of on-chain indicators such as realized price and MVRV suggests Bitcoin may be entering the late stage of a typical bear cycle, a phase historically associated with long-term accumulation rather than continued capitulation.”
Despite short-term macro headwinds, the current conditions signal a strategic accumulation phase, with BTC likely fluctuating between $68,000 and $84,000 as longer-term investors position for the next cycle.
This post Bitcoin’s Ownership Base is Maturing, Reducing Reliance on Retail: Analysts first appeared on Bitcoin Magazine and is written by Micah Zimmerman.
Bitcoin Magazine

South Korea Fines Bithumb $24M, Imposes 6-Month Partial Suspension Over AML Violations
South Korea’s Financial Intelligence Unit (FIU) has fined cryptocurrency exchange Bithumb 36.8 billion won ($24.6 million) and ordered a six-month partial suspension of new-user services after uncovering millions of anti-money laundering (AML) violations, according to local reporting.
The FIU’s investigation found roughly 6.65 million breaches of the country’s AML and customer verification rules. About 3.55 million involved failures to verify customer identities, while 3.04 million cases concerned transactions that should have been blocked but were allowed.
Authorities also identified 45,772 transactions with 18 unregistered overseas exchanges.
The sanctions, part of ongoing regulatory oversight of South Korea’s top crypto platforms, include a reprimand for Bithumb’s CEO and a six-month suspension for the exchange’s reporting officer.
Existing customers can continue trading, while the restrictions primarily affect new user account activity, including deposits and withdrawals.
Bithumb, founded in 2014, is one of South Korea’s largest exchanges by trading volume. The fine is the country’s largest imposed on a virtual asset exchange, slightly surpassing a 35.2 billion won penalty handed to Upbit in 2025.
The violations were uncovered during on-site inspections of South Korea’s five largest crypto exchanges between 2024 and 2025.
Regulators have emphasized that strict compliance with customer verification and AML obligations is critical to maintaining market trust.
Bithumb’s bitcoin blunder
The announcement comes just weeks after Bithumb accidentally sent billions of dollars worth of Bitcoin to users during a promotional event.
The exchange had planned to distribute small cash rewards through a “Random Box” event at around 6 p.m. local time. Winners were supposed to receive between 20,000 and 50,000 Korean won.
Instead, staff reportedly entered the payment unit as Bitcoin rather than won.
As a result, some users received at least 2,000 BTC each, worth roughly 196 billion won per person based on prices near 98 million won per Bitcoin at the time, according to social media screenshots and accounts.
The operational error briefly caused Bitcoin prices on the platform to drop over 10% below broader market levels. Bithumb stated the incident did not result in any customer losses.
The FIU will finalize the fine after giving Bithumb at least 10 days to submit its opinion.
Authorities said the enforcement action signals continued tightening of crypto market oversight in South Korea.
At the time of writing, Bitcoin is trading near $74,000.
This post South Korea Fines Bithumb $24M, Imposes 6-Month Partial Suspension Over AML Violations first appeared on Bitcoin Magazine and is written by Micah Zimmerman.
CryptoSlate
Bitcoin’s power law enters a 2026 stress test as Giovanni’s new chart shifts the debate from price targets to regime signals
Bitcoin Power Law chart creator Giovanni Santostasi has added a new layer to one of crypto’s most durable valuation models.
The chart shifts attention to Bitcoin's movements away from the trend line, with a field of green and red rays that track Bitcoin’s 10-day local growth rate in log-log space against the long-run power-law curve.
For years, the Bitcoin Power Law was mostly shown as a time-based price corridor, with attention fixed on whether spot traded above, below, or near the trend line. Giovanni’s latest version shifts the focus to motion.
In Giovanni’s framing, each ray is a direct measurement of Bitcoin’s local growth rate in log-log space, with angle and length encoding slope. Green marks periods when the price grows faster than the long-run power law, while red marks slower growth or decline.
With 10-day averaging, the chart reads less like noise and more like a vector field around Bitcoin’s long-run power-law attractor.

CryptoSlate’s earlier coverage treated the power law as a framework that could point to six-figure valuations while also warning that it did not encode broader market forces.
Recently, we sharpened the falsifiability question, noting that a prolonged stall near the high-$60,000s would eventually put the model’s rising floor under direct pressure.

In 2026, the live debate is whether the model still helps explain Bitcoin after U.S. spot ETFs, tighter macro linkages, and rising mining difficulty changed the market’s plumbing.
Two current reference points show the tension. A live page from Newhedge places the power-law centerline near $124,477 and the floor near $52,280.
A separate calculator from Bitbo projects a 2026 power-law price of about $142,782. Those levels leave room for both a recovery case and a stress case.
Bitcoin does not need to revisit old highs immediately for bulls to argue the long-run structure still holds. But it also does not need to trade below the floor for critics to say the model has lost day-to-day relevance in an institutional market.
| Reference point | Level | Use in the article |
|---|---|---|
| Live power-law centerline | $124,477 | Shows where the long-run trend sits in 2026 |
| Live power-law floor | $52,280 | Shows where a credibility test would become sharper |
| 2026 projected power-law price | $142,782 | Gives a longer-horizon estimate for year-end framing |
The visual update also helps explain something the older line chart could not show as clearly: the pattern of overshoot and mean reversion across halving eras.
Giovanni says the four halving cycles appear as alternating green and red clusters, with each bull market pulling the price above the attractor and each bear market pulling it back. That creates a cleaner way to describe a recurring structure that looks less like a straight-line forecast and more like a series of regime changes around a long-run path.
The 2026 test extends beyond the line
Bitcoin’s deviations from the power law can now be linked to hard numbers outside the model. ETF flow data, mining difficulty, and downside bank forecasts all point to a 2026 market that can move sharply around the attractor without settling the bigger debate.
Start with ETF flows. Data from flows compiled by Farside show cumulative net inflows into U.S. Bitcoin ETFs of about $56.1 billion as of March 16.
BlackRock’s IBIT accounted for about $63.1 billion of cumulative net inflows, while GBTC still showed roughly $25.9 billion in cumulative net outflows. The recent sequence was uneven.
Total flows came in at +$461.9 million on March 4, then -$227.9 million on March 5 and -$348.9 million on March 6, before turning back to +$167.1 million on March 9, +$246.9 million on March 10, and +$180.4 million on March 13.
Those figures fit the regime view better than the old “near the line” framing. In 2026, Bitcoin can absorb hundreds of millions in ETF demand one day and face meaningful outflows the next.
The new chart gives that back-and-forth a visual language.
Green clusters can now be read not only as speculative heat around a halving cycle, but also as intervals when macro allocators and ETF buyers push price growth above the long-run pace. Red clusters can be read as periods when those flows cool or reverse.
Mining data points in the same direction. In late February, a report said Bitcoin difficulty jumped 15% to 144.4T, the largest percentage increase since 2021, while hashrate recovered to 1 zettahash per second.
That shows that the system’s security bill kept rising even as prices failed to cleanly snap back to the centerline. Capital continues to build the network even when price action looks slower than the long-run fit.
A second chart posted in reply to Giovanni’s update points in a similar direction. D Cane’s chart plots Bitcoin’s estimated production cost, derived from mining difficulty, on a log-log chart, a format often used to compare values that grow over long periods.
A regression line (a statistical best-fit line used to show the overall relationship between variables) runs through the data and yields an R² of 0.9845, a metric indicating how closely the data follow that trend.
It suggests one possible mechanism for why Bitcoin can keep returning toward a long-run scaling relationship; time, mining difficulty, and price may be more linked than daily market narratives imply. But the article should stop there. The regression is a supporting visual, not consensus evidence.

There is also, however, a bearish read on the same data. A February report said Standard Chartered cut its end-2026 Bitcoin target to $100,000 and warned that BTC could slide to $50,000 before recovering. That range sits close enough to the live floor to keep pressure on the model without requiring a total breakdown.
It gives skeptics a clean argument: if a large bank’s downside case nearly overlaps the floor, then the power law in 2026 may be less a destination than a boundary line that the market keeps testing.
A 2026 view of the model comes down to scenarios, not conviction
We no longer need to debate whether Bitcoin can still be fitted to a power law. We should perhaps still question what the model says when outside forces are strong enough to pull the price away from the centerline for months at a time.
Bitcoin could stay above the floor, trade below the centerline for long stretches, and that does not force a final verdict on the model.
Under that setup, the power law persists as a long-run organizing framework, while short-run moves are driven by ETF allocations, macro positioning, and mining economics. Giovanni’s field would show repeated shifts between green and red without a decisive trend break.
That outcome fits the current mix of positive cumulative ETF demand, uneven daily flows, and a network that remains expensive to secure.
A move back toward the centerline, then toward the broader 2026 projection, would mean a recovery toward the $124,477 trend level and potentially toward the $142,782 estimate later in the year.
The mechanism is plain, steadier ETF inflows, less pressure from rates, and a market willing to pay for scarcity again after a slow patch.
In that setup, the new visualization becomes more than chart art. It becomes a way to describe a genuine re-acceleration in local growth rates before price itself catches up to the long-run curve.
If Bitcoin keeps trading weak enough, long enough, the floor becomes the main reference point. A move toward the $50,000 to $70,000 area would not automatically invalidate the model, but it would sharpen the criticism already present in our earlier reporting.
The framework is historical first and causal second. The power law does not include policy, liquidity, or leverage. If those outside variables dominate for long enough, the line will remain on the chart while losing its force in the market.
| Scenario | Range or marker | What would likely drive it |
|---|---|---|
| Base case | Above $52,280 floor, below $124,477 centerline for long stretches | Mixed ETF flows and steady network growth without a strong macro tailwind |
| Bull case | Return toward $124,477 and possibly $142,782 | More persistent ETF demand and renewed momentum above the long-run pace |
| Bear case | $50,000 to $70,000 pressure zone | Weak flows, macro strain, and a longer stay below the model midpoint |
That leaves Giovanni’s latest version in a stronger place than a simple target chart, but a weaker place than a law in the strict sense.
It gives us a way to describe Bitcoin as a system that oscillates around a durable path. It does not settle what force keeps that path intact. In 2026, that distinction sits at the center of the debate.
Crypto markets now have tools that did not exist when the early power-law charts began to circulate at scale, spot ETFs with daily creation and redemption data, a mining sector operating at industrial intensity, and broader macro traders who can treat Bitcoin as part of a cross-asset book.
The line held through Bitcoin’s retail adolescence. The field now tries to explain Bitcoin’s institutional adulthood.
That is why the chart deserves another look. We don't have a clean answer on where Bitcoin will trade tomorrow, but we have a sharper way to examine the next few months.
If Bitcoin climbs back toward the centerline, the power law will look less like a relic and more like a regime model that adapted to a bigger market.
If price keeps sagging while the floor rises underneath it, the market will get the test CryptoSlate flagged earlier.
The line will still be there. The open question is whether traders still treat it as an attractor.
The post New Bitcoin power law chart turns $124k into the ETF-era battleground appeared first on CryptoSlate.
The President-backed effort to set broader rules for US crypto markets is nearing a political deadline in Congress as banks press lawmakers and regulators to block stablecoin companies from offering rewards that resemble interest on deposits.
The fight has become one of the central unresolved questions in Washington’s crypto agenda. At stake is whether dollar-linked digital tokens remain focused on payments and settlement or gain features that make them more competitive with bank accounts and money market funds.
The Senate’s market-structure bill, known as the CLARITY Act, has stalled after negotiations broke down over so-called stablecoin yield.
Industry participants and lobbyists say late April or early May is shaping up as the practical window for the bill to move if it is to have a realistic chance before the election-year calendar tightens.

CRS sharpens the legal question
Congressional Research Service has framed the issue more narrowly than the public fight around it.
In a March 6 report, CRS said the GENIUS Act bars stablecoin issuers from paying yield directly, but may not fully settle the status of what it called a “three-party model,” in which an intermediary such as an exchange stands between issuer and end user.
CRS said the act does not clearly define “holder,” leaving room for debate over whether intermediaries can still pass economic value through to customers. That ambiguity has become one of the main reasons banks want Congress to revisit the issue in the broader market-structure bill.
Banks say even limited rewards could turn stablecoins into a stronger competitor for deposits, especially at regional and community lenders.

However, crypto firms argue that incentives tied to payments, wallet usage or network activity would help digital dollars compete with older payment rails and could widen their role in mainstream finance.
That split also reflects different views of what stablecoins are becoming.

If lawmakers treat them mainly as payment instruments, the logic for tighter limits on rewards becomes stronger. However, if lawmakers see them as part of a broader shift in how value moves through digital platforms, the argument for limited incentives becomes easier to make.
Bank groups have urged lawmakers to close what they call a loophole before reward structures spread more widely. They say allowing rewards on idle balances would encourage deposit migration away from banks, reducing a key funding source for loans to households and businesses.
Standard Chartered estimated in January that stablecoins could draw about $500 billion from US bank deposits by the end of 2028, with smaller lenders facing the greatest strain.

The banking industry has also tried to show lawmakers that the position carries consumer backing. The American Bankers Association (ABA) recently published the results of a Morning Consult survey on stablecoins, fintech innovation and regulatory preferences.
According to the survey, respondents, by a 3-to-1 margin, said they agreed with congressional prohibitions on stablecoin rewards if the question raised the prospect of reduced funds available to banks to lend in the community and support economic growth. By a 6-to-1 margin, respondents said stablecoin laws should be cautious and should avoid steps that could undermine the existing financial system, particularly community banks.
However, crypto firms have pushed back by arguing that banks are trying to protect their funding model by limiting competition from digital dollars.
Industry advocates, including Coinbase CEO Brian Armstrong, have argued that stablecoin issuers operate under stricter reserve requirements than banks under the GENIUS Act, which requires issued stablecoins to be fully backed by cash or cash equivalents.
The volume story has raised the stakes in Washington
The market’s scale has made the rewards dispute harder to dismiss as a niche argument.
Boston Consulting Group estimated that only about $4.2 trillion of roughly $62 trillion in gross stablecoin transfer volume last year represented real economic activity after stripping out bots, exchange flows, and other internal movements.
That gap between headline volume and underlying economic use helps explain why the debate over rewards has taken on greater importance.
If stablecoins remain largely a settlement tool for trading and market structure, lawmakers may find it easier to keep them boxed in as payment instruments. If rewards help them become a widely used store of cash inside consumer apps, the pressure on banks could rise more quickly.
As a result, the White House tried to broker a compromise earlier this year that would have allowed some rewards in narrow use cases, such as peer-to-peer payments, while barring returns on idle holdings. Crypto companies accepted that framework, but banks rejected it, leaving the Senate talks at an impasse.
However, even if Congress does not act, regulators may still narrow the path for reward structures.
In a proposed rule to implement the GENIUS Act, the Office of the Comptroller of the Currency (OCC) said it would presume an issuer is effectively paying prohibited yield if it funds an affiliate or related third party that then pays yield to stablecoin holders.
That signals the administration may try to police the issue through rulemaking if lawmakers fail to produce a legislative fix.
Congress is running short on time
The fight now has two tracks. Congress is debating whether to settle the matter in statute, while regulators are moving to define how far companies can go under the law already on the books.
For the Senate bill, the calendar itself has become a source of pressure.
Alex Thorn, Galaxy Digital's head of research, wrote on X:
“If Clarity doesn’t pass committee by the end of April, odds of passage in 2026 become extremely low. This needs to hit the Senate floor by early May. Floor time is running out, and the odds diminish every day that passes.”
Thorn also expressed caution about the chances of a breakthrough even if the rewards fight is resolved, saying:
“The framing right now is that the dispute over stablecoin rewards is holding up the Clarity Act. But even if compromise is reached on rewards, there are very likely to be other hurdles.”
Those challenges could include regulations pertaining to the decentralized finance sector, the powers of regulators, or “even ethics,” Thorn said.
The issue of crypto regulation is likely to become a larger political battleground ahead of the midterm elections in November. That adds another layer of urgency to the current impasse, because a delayed bill would have to compete with a more crowded political calendar and a harder legislative path.
Prediction markets reflect that shift in sentiment. In early January, Polymarket placed the odds of passage at 80%. After recent setbacks, including Armstrong calling the current version of the bill unworkable, the odds moved closer to 50%.
Data from Kalshi shows that the bill has only a 7% chance of passage before May and 65% before the end of the year.
Failure would leave more to regulators and the market
The consequences of failure reach beyond the current dispute over rewards. The CLARITY Act is meant to define when crypto tokens are securities, commodities or otherwise, and to provide a clearer legal framework for how the market is overseen.
If the bill stalls, the industry would remain more dependent on guidance, rulemaking and future political turnover.
That is one reason market participants have focused so heavily on the bill’s fate. Bitwise CIO Matt Hougan argued earlier this year that the Clarity Act would cement the current pro-crypto regulatory environment into law. Without it, he said, a future administration could reverse the current policy push.
Hougan wrote that if the bill fails, crypto would enter a “show me” period and have three years to make itself indispensable to the everyday lives of regular Americans and the traditional financial industry.
In that view, future gains would depend less on investors pricing in a durable legislative win and more on whether stablecoins, tokenized assets, and related products can prove broader real-world adoption.
That creates two distinct paths for the market. Passage could lead investors to price in the growth of stablecoins and tokenization sooner. Failure could leave future growth more contingent on adoption and more exposed to skepticism about whether Washington’s current support will survive the next turn in politics.

For now, the next move belongs to Washington. If senators can revive the market-structure bill this spring, lawmakers may still define how far stablecoins can go in sharing value with users and how much of the broader crypto framework can be locked into statute. If they cannot, regulators appear ready to draw at least part of that line themselves.
Either way, the issue now reaches beyond whether stablecoins are part of finance. The fight has moved to how they will function inside it, and who gets paid as they grow.
The post Congress has only weeks left to convince banks on crypto CLARITY Act or risk losing it to midterms appeared first on CryptoSlate.
Wall Street private-credit funds are slowing the exits as withdrawal pressure builds
As Bitcoin climbs and holds above $73,000, several of Wall Street’s biggest private-credit funds have capped, stretched, or halted withdrawals, according to recent filings and reports tied to BlackRock, Blackstone, Morgan Stanley, Cliffwater, and Blue Owl.
JPMorgan has also marked down some private-credit loan portfolios and reduced lending against parts of the same market, a sign that the pressure is moving beyond investor queues and into the financing that supports the asset class.
Investors asked to withdraw more money than several funds were willing or able to return on schedule. The pattern points to a market built on steady income and smoother marks running into a basic liquidity problem when demand for cash rises: the underlying loans do not trade like public bonds and are harder to sell quickly.

The gap between promised access and actual liquidity sits at the center of the issue. It is also the part most likely to travel beyond private-markets specialists.
For crypto, the distinction is clear even before any price reaction enters the picture. A gated private fund and a 24/7 traded asset handle liquidity in very different ways. One depends on quarterly windows and the manager's discretion. The other trades continuously, for better and for worse.
The pressure is visible in the numbers.
| Firm / fund | Fund size | Withdrawal requests | Allowed or standard cap | Reported outcome |
|---|---|---|---|---|
| BlackRock / HPS Corporate Lending Fund | $26B | 9.3% | 5% | Capped repurchases |
| Blackstone / Bcred | $82B | 7.9% | 5% | Record request level above threshold |
| Morgan Stanley / North Haven Private Income Fund | $7.6B | 10.9% | 5% | Capped withdrawals |
| Cliffwater Corporate Lending Fund | $33B | 14% | 7% paid, 5% guaranteed floor | Limited withdrawals |
| Blue Owl | $1.6B | Not stated in the cited report | Changed terms | Quarterly withdrawals halted |
| JPMorgan | $22B exposure cited in coverage | Not applicable | Not applicable | Reduced lending against some collateral |
The ratios are more telling than the top-line figures. BlackRock’s fund faced demand equal to about 1.86 times its 5% cap. Morgan Stanley’s fund faced roughly 2.18 times its cap. Cliffwater saw requests equal to 2 times the 7% it planned to honor, and 2.8 times the standard 5% gate. Blackstone’s Bcred reached 1.58 times the 5% threshold that lets it restrict payouts. Those are not tiny overruns.
So far, the market has not had to digest a clear wave of forced sales at disclosed discounts. That marks the dividing line between a liquidity-management problem and a valuation problem. Still, JPMorgan’s move adds a harder edge.
When a bank lends less against private-credit assets after marking down some portfolios, it changes the economics around those funds even if investors never read the filings. Financing gets tighter. Asset sales become more expensive. Confidence takes another hit.

What the filings show, and where the pressure can move next
The filings and reports point to the same mechanism across several products. Private-credit funds offered investors periodic ways to redeem, but the assets under them are private loans that do not move through a deep public market.
Managers can smooth marks in calm periods because they are not forced to print a public price every minute. But when redemptions exceed the cap, the smoothing stops looking like stability and starts looking like a delay.
That distinction shapes where the next pressure may show up. If managers can continue to meet a portion of requests each quarter while keeping loan performance intact, the situation stays inside the box marked limited liquidity.
If requests keep outpacing those windows, managers will have fewer clean options. They can continue to ration cash. They can sell loans. Or they can change fund terms. Each of those choices carries consequences for the market’s growth outlook.
The private-credit market has grown to about $1.8T, according to an IMF note. That scale helps explain why a cluster of redemption caps now reads as more than product-level noise. The system does not need a crisis to feel a slowdown. It only needs investors and lenders to act more cautiously at the same time.
That caution is already visible in public signals around the sector. A Barron’s report cited in earlier coverage said the VanEck Alternative Asset Manager ETF was down 23% in 2026. That shows that public markets are already repricing the firms tied most closely to the trade.
For Bitcoin, the cleanest interpretation is structural and centered on market design. Crypto markets are volatile, but they are transparent about that volatility in a way private-credit products are not.

A holder can sell Bitcoin at any time the market is open to them, which is effectively all the time.
A holder in a private-credit vehicle may learn that liquidity exists only inside a quarterly gate. The difference describes how access works, rather than settling the question of which asset is safer.
The private-credit pitch was built on two ideas at once: stable income and tolerable access. Recent events have not yet disproved the income side. They have, however, tested the access side in public. JPMorgan’s tighter lending, tied to marked-down collateral, adds a second layer of pressure because it suggests the firms financing the system are also adjusting their view of the risk.
The next question is whether managers can clear the queue without changing how the market prices these loans.
Bull and bear cases for markets, liquidity, and crypto
The bull case for the sector is a contained slowdown. In that version, funds continue to honor a portion of withdrawals, managers sell selected assets without taking large disclosed hits, and banks other than JPMorgan do not rush to widen haircuts or pull back financing across the board.
The pressure then stays concentrated in products with heavier retail or wealth-channel exposure. Fundraising slows, but the market avoids a broad reset in valuations.
For crypto, that setup gives Bitcoin a narrative edge without requiring a macro accident. The contrast is simple: Wall Street products can ration exits, while Bitcoin remains continuously tradable. That framing can help BTC relative to traditional risk assets even if the direct flow link remains thin.
The bear case is more mechanical. If withdrawal requests remain above caps for another quarter and managers begin selling assets into a thinner secondary market, the focus shifts from access to pricing.
A loan sold below the last stated value becomes a reference point for the next trade. Once that happens, lenders may tighten terms further, other banks may follow JPMorgan, and investors may question whether net asset values are keeping pace with market reality. In that version, liquidity pressure can feed valuation pressure, and valuation pressure can feed more withdrawals.
In a broader liquidity event, Bitcoin often behaves first like a liquid asset. Investors sell what they can. The safer argument, based on the material cited above, is that the issue strengthens Bitcoin’s long-term case as an asset without redemption windows, while leaving short-term price direction open.

There is also a middle ground, and it may be the most likely one. Private credit can keep growing while losing part of the sales pitch that helped it reach a wider base of investors. A market can survive a queue.
What becomes harder to sustain is the language that treats those products like near-cash income tools. Once withdrawals exceed caps across several large names, the burden shifts. Managers then have to show that limited liquidity is a manageable feature, rather than the defining fact of the product.
For now, the market has a cluster of capped or halted exits, a bank that is lending less against some of the same assets, and a set of public numbers that show the line is getting longer.
The next quarter will show whether managers are simply pacing withdrawals, or whether the industry has to start proving what those loans are worth when someone actually needs to sell them.
The post Largest private credit funds on Wall Street limit withdrawals as investors rush for the exit while Bitcoin climbs appeared first on CryptoSlate.
Circle’s USD Coin (USDC) has officially unseated Tether’s USDT in transfer volume for the first time in seven years. The shift marks a defining moment for digital assets, cleanly splitting stablecoin leadership into two distinct categories: total supply and transactional velocity.
While Tether remains the undisputed heavyweight in the stablecoin market, USDC has become the primary lubricant for the actual movement of capital across the cryptocurrency ecosystem.

According to a recent research note from Mizuho, USDC accounted for 64% of the transfer volume between the two major stablecoins.
That translates to roughly $2.2 trillion in adjusted transaction volume for USDC, compared to $1.3 trillion for USDT. Mizuho noted this is the first time since 2019 that USDC has led by this metric.
The gap became impossible to ignore in February. Data compiled by Allium pegged total stablecoin transfer volume at $1.8 trillion for the month. Within that pool, USDC was responsible for approximately $1.26 trillion, while USDT accounted for just $514 billion.
Yet the broader market's supply structure continues to heavily favor Tether.
CryptoSlate's data shows that USDT has a massive $184 billion in total market capitalization, while USDC's supply is at roughly $79 billion. By those figures, the circulating supply of USDT remains 2.36 times that of USDC.
This stark divergence between dormant supply and active transfer volume has become the defining feature of the current market. It also highlights the growing importance of underlying settlement rails.
Mizuho researchers attributed the transfer flip to significantly faster on-chain usage, noting that adjusted stablecoin volumes grew more than 90% year-over-year. According to the firm, transaction velocity is increasing rapidly, signaling that stablecoins are changing hands more frequently across a much wider array of financial workflows.
Solana metrics highlight record turnover
While Circle issues USDC natively across 30 different blockchains, one network sits at the undeniable center of this newfound velocity.
By the numbers, the Solana blockchain provides the clearest link between the rising USDC transfer totals and the underlying market structure that demands constant, repeated movement.
Data from Grayscale illustrates the sheer scale of this activity. Solana processed a staggering $650 billion in stablecoin transactions in February, more than doubling its previous record and leading all competing blockchains for the month.

What makes that headline number remarkable is the relatively small base of capital parked on the network, a dynamic that points to extreme asset turnover.
According to DeFiLlama, the entire stablecoin base on Solana sits at a modest $15.7 billion. USDC represents 53.81% of that local liquidity pool, amounting to roughly $8.4 billion. Outside of Ethereum, where USDC maintains a massive $55 billion supply, Solana is the network with the token's largest absolute presence.
The intensity of USDC circulation on Solana is unprecedented. Token Terminal reported that monthly USDC transfer volume on the network skyrocketed 300% year-over-year, hitting $880 billion in February 2026 alone.

These figures describe a blockchain architecture specifically optimized for repeated, high-speed settlement. Token Terminal also noted that Solana’s median transaction fee fell to a one-year low of $0.00047 during the same period.

Indeed, ultra-low fees naturally support frequent routing, algorithmic rebalancing, and complex settlement strategies between market makers and trading venues throughout the trading day.
Meanwhile, it is worth noting that USDC transfer activity also surged on its largest home base. Token Terminal data showed monthly USDC transfer volume on Ethereum surpassed $1.7 trillion in February, reflecting a 250% year-over-year increase.
Essentially, the complete flow picture clearly spans multiple networks. However, the data coming out of Solana is drawing immediate industry attention because it puts stationary balances and hyper-active movement into the same frame.
This is because a relatively small pool of stablecoins is generating a torrent of transfers, which perfectly explains how USDC built a commanding lead in volume without coming close to matching Tether’s footprint in total supply.
Solana DEXs pivot from memes to stables
The spike in Solana transfer volume coincides with a fundamental change in what is actually driving activity on the network’s decentralized exchanges.
In late 2024 and early 2025, memecoins were the dominant force. Data from Blockworks shows that highly speculative tokens accounted for more than 60% of all decentralized exchange activity on Solana during that window.
That retail-driven surge pushed trading volumes to record highs, briefly doubling those on Ethereum.

More recently, the landscape has matured. Blockworks data now indicates that stablecoin-related swaps have taken over, accounting for about 70% of all blockchain activity on the network.

This structural shift perfectly aligns with the February stablecoin transaction records tracked by Grayscale and the massive jump in USDC transfer volume tracked by Token Terminal.
This change in composition has massive implications for how transfer volume accumulates.
Workflows that rely heavily on stablecoins tend to involve repeated transfers among a web of intermediaries. Trading flows routinely split across multiple legs to find the best available price. Every single hop between exchanges, market makers, hedge funds, and payment applications adds to the aggregate transfer totals as balances relentlessly rotate.
Because Solana’s median transaction fee is practically zero, these microscopic, multi-step routing strategies can scale without eating into profit margins.

Regulatory moats and traditional finance rails
Meanwhile, the blockchain technology is only half the story. Policy shifts and platform rules have heavily influenced stablecoin routing over the last year, particularly for institutions operating under strict compliance frameworks in the United States and Europe.
The United States permanently altered the landscape in July 2025 by enacting the GENIUS Act, which established a comprehensive federal framework for payment stablecoins. Across the Atlantic, Circle secured a highly coveted Markets in Crypto-Assets license in Europe in January 2025.
Those regulatory milestones had immediate market consequences. Binance and other leading crypto trading platforms delisted all non-compliant stablecoin pairs, specifically targeting USDT, before March 31, 2025.
Since then, Tether's USDT trading access on some of the world's largest exchanges was severely curtailed within the European bloc. This compliance moat naturally redirected a massive portion of European exchange flow toward regulated alternatives like USDC.
Traditional payment infrastructure has also deeply intersected with the USDC and Solana routing ecosystem.
In December, Visa announced that its United States issuer and acquirer partners had begun settling fiat obligations in Circle’s USDC directly over the Solana blockchain. Initial participants included Cross River Bank and Lead Bank, with a broader domestic rollout scheduled throughout 2026.
Circle is simultaneously pushing a major cross-border expansion to strengthen its institutional plumbing.
The company is actively scaling the Circle Payments Network, a system that allows traditional financial institutions to send USDC internationally and convert it directly into local fiat currencies via banking partners. The network currently boasts 55 institutional members and reached $6 billion in volume this year.
These developments present why the USDC competitive signal flashing in the 2026 data is undeniable. It shows that stablecoin dominance is no longer a single-variable equation, and that the market now measures success through two metrics that can, and clearly do, diverge for extended periods.
The post Tether still holds more cash, but Circle’s USDC is now moving more of crypto’s money appeared first on CryptoSlate.
Bitcoin climbed back into the $73,500 to $73,800 resistance band over the weekend, reaching its highest level since the Iran war and Trump tariff turmoil began to shake global markets.
The move comes even as crude remains above $100, supply through the Strait of Hormuz has been disrupted, and investors have cut back expectations for Federal Reserve rate cuts.
As of press time, CryptoSlate data shows Bitcoin at about $70,470, up 0.33% over 24 hours, 1.09% over seven days, and 5.7% over 30 days.
The price action stands out because the chart structure does not yet show a clean trend in the market. The market has mostly respected defined reaction zones.

About three-quarters of all tests of support and resistance levels over the last few months have ended in rejection rather than acceptance. That gives the current test of the upper band a narrower meaning than a simple breakout call. Bitcoin has repaired the panic damage. It still has to prove it can stay above the panic ceiling.

The clearest near-term resistance sits at $73,500 and $73,800. Those two levels form a top channel pair in the active zone and have produced repeated rejections in the recent stretch of the data.
The first support band below sits at $72,000 and $71,500. Below that, $68,000 remains the next major line where price repeatedly found buyers during February and early March.

The immediate question is whether Bitcoin can convert resistance into support, given the still-hostile macro backdrop.
That backdrop has not eased. Oil has surged after the Iran conflict disrupted flows, with AP reporting disruption of more than 12 million barrels per day across the Gulf system. The same shock has fed into inflation expectations and raised doubts about how much room the Fed has to cut this year.
Bitcoin is rising into a heavy resistance band before the outside world has improved. The structure says buyers have regained control of the upper half of the range. It does not yet show that they have escaped it.
Support, resistance, and the difference between a break and acceptance
The recovery through $68,000 looks accepted. So does the later move back through $71,500 and $72,000. Those levels did not hold as one-off spikes. Price spent time above them, built higher lows, and kept returning to the upper part of the structure.
That sequence carries more weight than the latest wick into the $73,500 to $73,800 band because it shows where buyers already proved they would defend the market.
The current move into $73,500 and $73,800 looks more vulnerable. The data is bounce-heavy, the overhead zone is tight, and the market is reaching it while oil, inflation, and trade-policy stress are still unresolved. A rejection here would fit the pattern better than an immediate straight-line run to the next band.
| Zone | Role now | What the data suggests |
|---|---|---|
| $73,500 to $73,800 | Primary resistance | Repeated recent rejection area, needs a hold above to count as acceptance |
| $72,000 to $71,500 | Primary support | Most important near-term floor after the recovery from the panic selloff |
| $68,000 | Secondary support | Major reaction level during the mid-range consolidation |
| $77,100 | Next upside target | Opens only if price accepts the current upper band |
The broader market picture offers a partial explanation for why Bitcoin could keep pressing higher even in that setup. U.S.-listed Bitcoin ETFs did not lose their demand base during the latest macro shock.
After outflows of $227.9 million on March 5 and $348.9 million on March 6, the funds posted five straight positive sessions: $167.1 million on March 9, $246.9 million on March 10, $115.2 million on March 11, $53.8 million on March 12, and $180.4 million on March 13. Those figures show that larger buyers did not disappear when macro pressure rose.
That distinction helps frame the current setup. If ETF demand had collapsed at the same time price hit the upper band, the chart would look more like a short-covering bounce running out of fuel. Instead, the latest flow numbers show steady support from fund inflows while Bitcoin retests the highs of the post-shock recovery.
That is one reason the $72,000 to $71,500 floor now carries more weight than the latest intraday print above $73,500. Support shows where buyers are willing to defend size. Resistance shows where sellers are still active.
In that sense, the most important recent move was the reclaiming of $71,500 and $72,000 after the macro panic, rather than reaching $74,000. That recovery showed that buyers were willing to absorb supply while the oil shock was still live and rate-cut expectations were still being marked down.
What the macro backdrop changes, and what it does not
The macro climate still argues for caution. The oil shock continues to ask questions about inflation, growth, and how long high rates might stay in place.
Recent FT reporting cited estimates that put the likely inflation effect at 0.5 to 0.6 percentage points, while projecting a 0.3-point hit to global GDP growth. The Fed is still expected to hold rates steady, with markets rethinking how many cuts remain plausible this year.
Meanwhile, the Trump tariff fight is still running. The Supreme Court decision that disrupted key tariff measures has forced the administration to reopen trade probes and look for new legal paths.
Put simply, the outside-world pressure has not gone away. Bitcoin is rising while the macro picture remains messy.
The base case from the channel data is a range-acceptance fight between $72,000 and $73,800. Buyers have already shown they can defend the lower part of that band. Sellers have not yet given up the upper edge. If that continues, Bitcoin can keep grinding higher in steps without producing a decisive breakout.
The bull case needs more than a print above resistance. It needs time above resistance. If Bitcoin holds $73,500 on a retest and stops falling back under $73,800, the next obvious structural target is $77,100. That level sits as the next upper channel boundary in the framework and would be the first place to test whether the move is becoming a broader trend rather than another rejection cycle.
The bear case is simpler. A rejection from $73,500 to $73,800, followed by a loss of $72,000, would bring $71,500 back into focus. If that fails, the market would likely revisit $68,000, which has served as the most durable support line. That would not erase the medium-term recovery, but it would weaken the view that Bitcoin is already trading as a stronger macro hedge through this shock.
There is also a low-probability, high-impact case that sits outside the chart. If the Iran conflict widens further, if oil spikes again, or if rate expectations reset sharply higher, forced selling could overwhelm the channel structure in the short run. The chart would still matter, but headline risk would likely take over first.

What comes next for Bitcoin
The most defensible conclusion from the data is that Bitcoin has staged a real recovery but has not completed a clean breakout.
The upper resistance band is still the key test. Traders who want confirmation should watch for acceptance above $73,500 and $73,800, not just another touch. Traders looking for early weakness should watch whether the market can still hold $72,000 on the next pullback.
That leaves the market with a straightforward map.
| Scenario | Trigger | Likely path |
|---|---|---|
| Base case | Bitcoin holds $72,000 but fails to stay above $73,800 | Range trade continues, with repeated tests of the upper band |
| Bull case | Bitcoin holds above $73,500 after a breakout | Price targets $77,100 as the next clear channel boundary |
| Bear case | Bitcoin rejects the upper band and loses $72,000 | Price retests $71,500, with $68,000 back in play |
| Macro shock case | War, oil, or rates worsen sharply | Headline risk overrides the range and raises liquidation risk |
For now, the clearest take is simple. Bitcoin has climbed back to the top of its recent range even as war, oil, inflation pressure, and tariff uncertainty continue to pull on global markets. The recovery through $68,000, $71,500, and $72,000 looks real. The market has not yet shown the same acceptance above $73,500 and $73,800.
If Bitcoin can live above that band, $77,100 becomes the next measured target inside this framework.
If it cannot, the move still looks like a strong recovery inside a range that has rejected the price more often than it has released it.
The post Bitcoin price confirms recovery hitting highest price since start of Iran war and Trump tariff chaos appeared first on CryptoSlate.
Cryptoticker
Ethereum (ETH) has bounced back strongly, rising more than 20% over the past eight days. While much of the market focused on Bitcoin’s volatility, Ethereum moved higher in the background. The rally is being driven by growing institutional interest and clearer regulatory support, two factors that are starting to change how major financial players approach the Ethereum network.
Why is Ethereum Price UP?
The recent Ethereum price pump is driven by a convergence of institutional liquidity and regulatory clarity. Specifically, the Federal Reserve's decision to allow tokenized securities as bank collateral and BlackRock’s launch of its iShares Staked Ethereum Trust (ETHB) have provided the necessary fundamental support for ETH to decouple from minor market corrections.
Tokenization and Staked ETFs
To understand why these developments are "game-changers," we must define the two pillars supporting this rally:
- Tokenized Securities: These are traditional assets (like stocks or bonds) represented as digital tokens on a blockchain.
- Staked ETFs: Unlike a standard spot ETF, a staked ETF (like ETHB) actually participates in the network's consensus, earning a "yield" or dividend for its shareholders by securing the network.
1. The Fed’s Green Light: Tokenized Assets as Collateral
On March 6, 2026, the Federal Reserve, alongside the OCC and FDIC, issued a landmark clarification. U.S. banks are now officially permitted to use tokenized securities as collateral for loans.
Why This Matters for Ethereum
Regulators confirmed that as long as the tokenized version confers the same legal rights as the traditional asset, it will receive the same capital treatment. Crucially, the Fed stated this applies regardless of whether the blockchain is permissioned or permissionless (public).
- Liquidity Influx: Trillions of dollars in "off-chain" value (Treasuries, equities) can now migrate to Ethereum.
- Ethereum as the "Settlement Layer": Since Ethereum remains the dominant hub for Real-World Assets (RWAs), this ruling cements $ETH role as the global plumbing for modern finance.
2. BlackRock’s ETHB: The First Dividend-Paying Crypto ETF
On March 12, 2026, BlackRock launched the iShares Staked Ethereum Trust (ticker: ETHB). While the market already had spot ETH ETFs, ETHB is the first from a major issuer to offer staking rewards directly to shareholders.
Key Features of ETHB:
- Yield Generation: The fund stakes between 70% and 95% of its holdings.
- Monthly Distributions: Investors receive monthly cash payouts, similar to a high-yield dividend stock.
- Institutional Infrastructure: BlackRock partnered with Figment and Coinbase Prime to manage the validator sets, bringing "Enterprise-Grade" security to the staking process.
"The ETHB launch transforms Ethereum from a speculative commodity into a productive, yield-bearing asset for the average 401k investor." — Market Insight
Comparison: Spot ETH vs. Staked ETH ETFs
| Feature | Spot ETH ETF (e.g., ETHA) | Staked ETH ETF (ETHB) |
|---|---|---|
| Primary Goal | Price Tracking | Price + Yield |
| Income Source | None | Staking Rewards (~2-3% Net) |
| Risk Profile | Market Volatility | Volatility + Slashing Risk |
| Target Audience | Traders | Long-term Income Seekers |
Fundamental Divergence
For months, analysts have noted a divergence: Ethereum's network fundamentals (Total Value Locked, Active Addresses, and Layer 2 scaling) were hitting record highs while the Ethereum price lagged. This 20% pump suggests the "valuation gap" is finally closing.
Markets Rally Ahead of President Trump’s Speech
Global markets are reacting strongly ahead of President Donald Trump’s expected White House speech today, with equities surging and oil prices falling after reports that the United States is allowing some oil tankers to pass through the Strait of Hormuz to stabilize global supply.
The development comes after days of heightened geopolitical tensions involving Iran and the United States. The Strait of Hormuz is one of the world’s most critical energy chokepoints, responsible for transporting roughly 20% of global oil supply.
Reports that tankers are now being allowed to pass through the strait have eased fears of a major disruption to global energy markets. As a result, oil prices dropped sharply, triggering a powerful rally across U.S. stock markets.
$1 Trillion Added to U.S. Stocks
The market reaction has been immediate. U.S. equities surged at the open, with major indexes posting strong gains.
The S&P 500, Nasdaq, Dow Jones, and Russell 2000 all climbed significantly as investors interpreted the tanker news as a signal of possible de-escalation in the Middle East conflict.
Tech stocks led the rally, with major companies such as Nvidia, Meta, Tesla, Apple, and Google all trading higher. In total, the U.S. stock market added hundreds of billions of dollars in market value, approaching the $1 trillion mark during the early session.
The logic behind the rally is straightforward: if oil supply remains stable, inflation pressure may ease, which could reduce economic uncertainty and support risk assets.
Oil Prices Drop After Hormuz News
Energy markets were extremely sensitive to the situation in the Strait of Hormuz over the past week. Any threat to the route can send oil prices soaring due to fears of supply disruptions.
However, the latest reports suggesting the United States is allowing some tankers to pass through the strait have helped calm markets.
Oil prices dropped sharply after the announcement, reinforcing the perception that global supply chains may remain intact despite ongoing geopolitical tensions.
For financial markets, lower oil prices often translate into lower inflation expectations, which tends to support stocks and other risk assets.
All Eyes on President Trump’s Announcement
President Trump is expected to address the situation during a White House press conference later today. Investors are closely watching the speech for signals about the next steps in U.S. policy.
Key questions markets are asking include:
- Will the U.S. officially confirm that tanker traffic through Hormuz is being stabilized?
- Will there be a broader international coalition protecting the shipping route?
- Could the speech signal de-escalation or further military action?
Markets have already partially priced in a positive outcome, meaning the tone of the speech could play a decisive role in determining the next move across global assets.
Could Bitcoin Be the Next Market Mover?
While traditional markets have already reacted, the cryptocurrency market is watching closely.
Bitcoin has recently shown surprising resilience during geopolitical instability. In many cases, major macro developments initially move traditional markets such as oil and equities before spilling over into crypto.
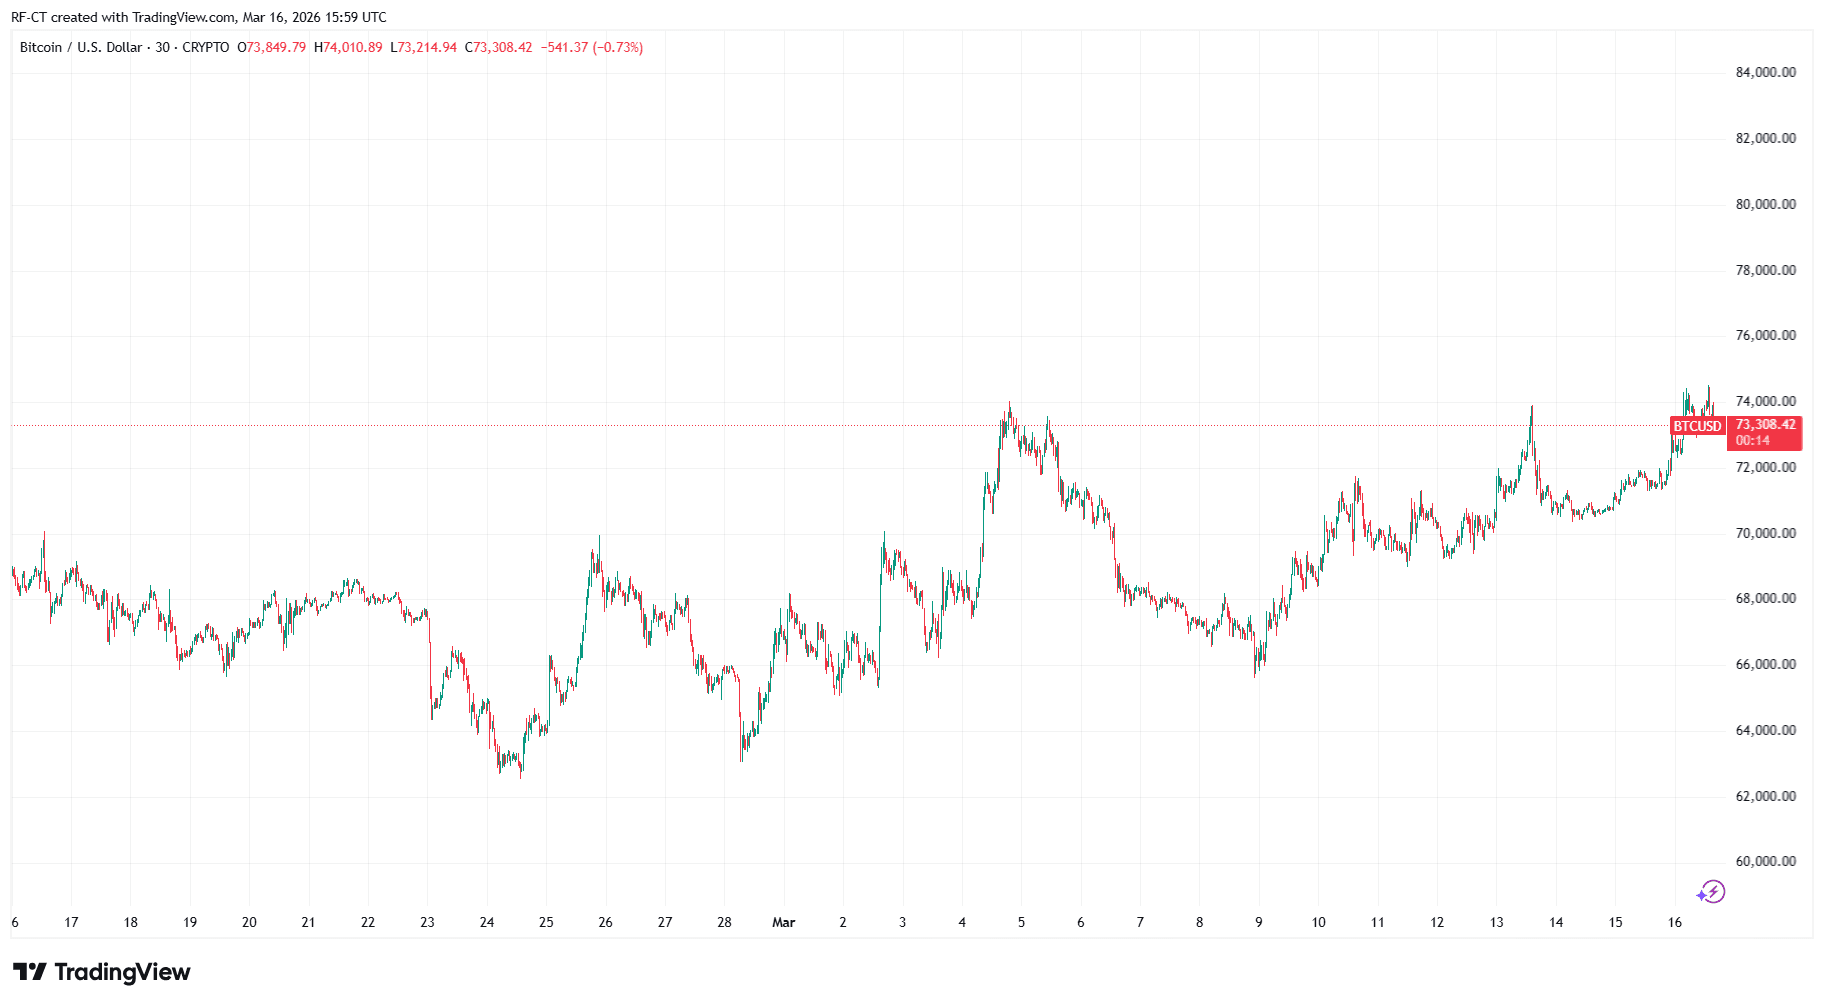
If global risk sentiment continues improving, capital could rotate back into digital assets, potentially supporting Bitcoin and the broader crypto market.
On the other hand, if the speech signals escalation or renewed uncertainty, volatility could return across both traditional and crypto markets.
For now, Bitcoin traders are waiting to see whether the macro rally in equities will translate into momentum for the crypto market as well.
Conclusion
With oil prices dropping and U.S. stocks surging ahead of President Trump’s speech, global markets are positioning for potential stabilization in the Strait of Hormuz situation.
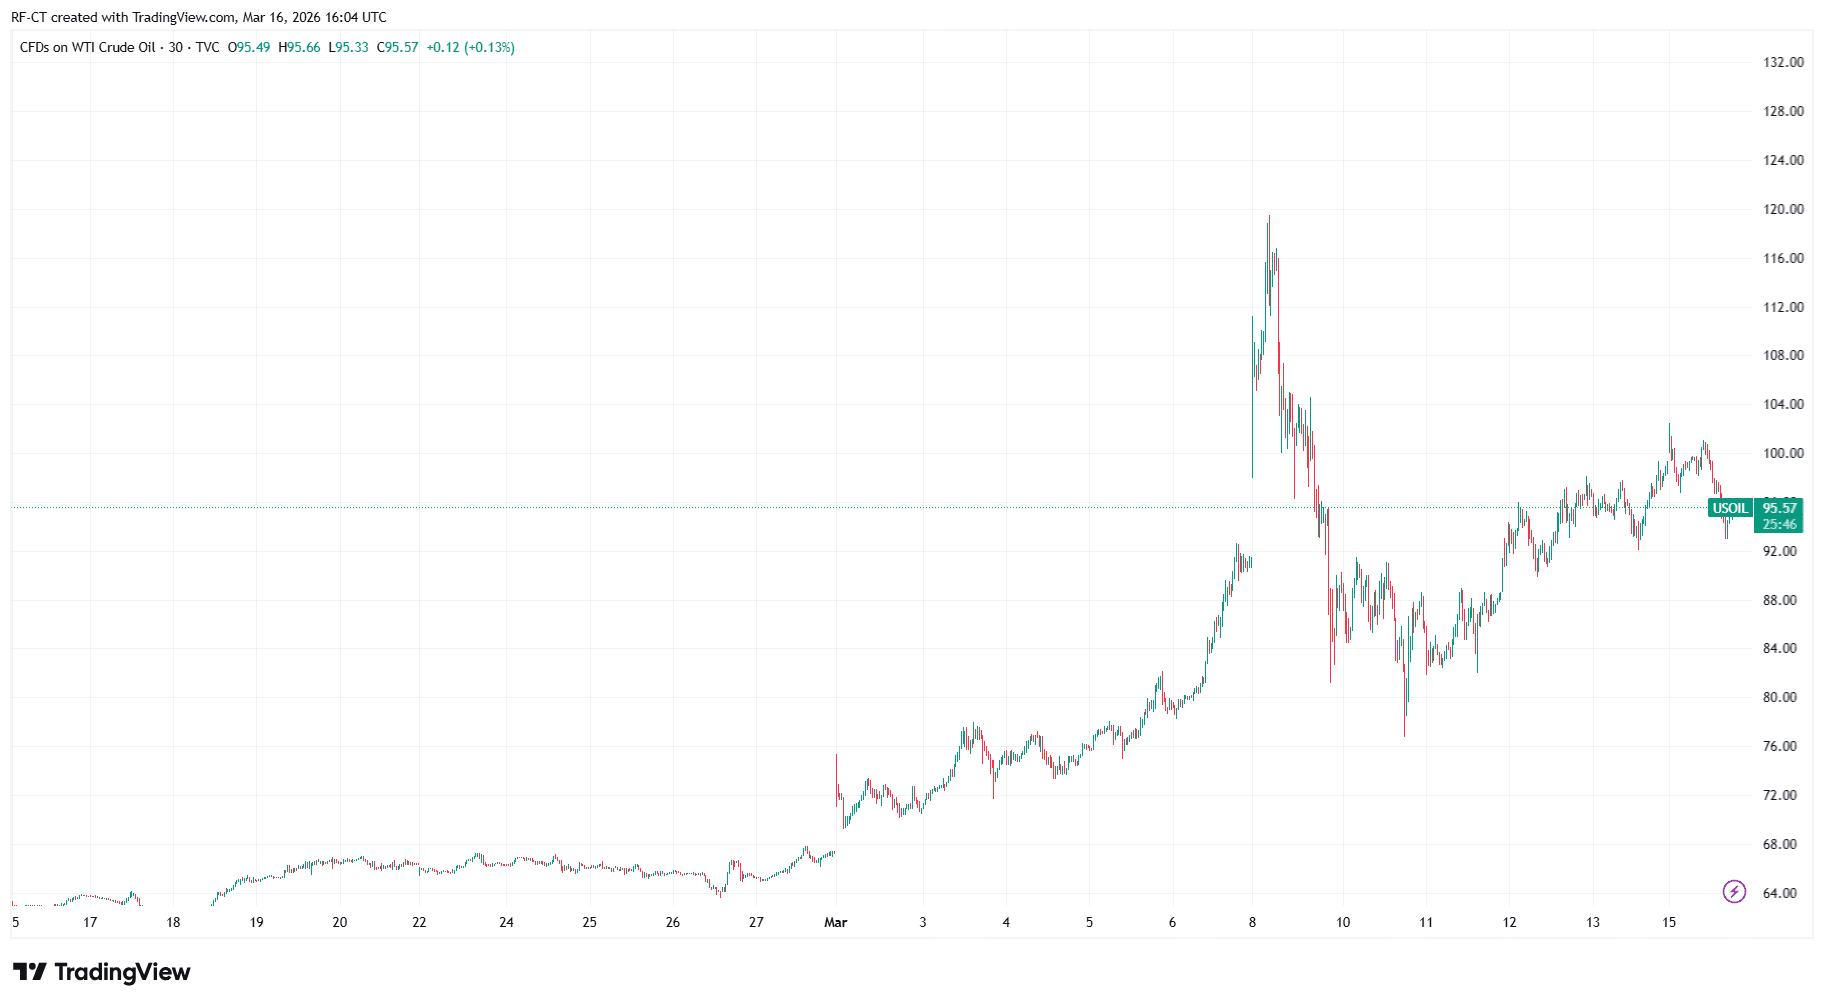
However, the final market reaction will likely depend on the tone and details of the announcement. Investors across equities, commodities, and cryptocurrencies are now waiting to see whether the speech confirms de-escalation — or introduces a new wave of uncertainty.
If risk appetite continues improving, Bitcoin could become the next asset to react.
While U.S. President Donald Trump has actively lobbied for a multinational military coalition to reopen the strategic waterway, Beijing has formally responded with a message of de-escalation. The friction between the world's two largest economies, coupled with a tightening energy supply, has positioned Bitcoin as a focal point for investors seeking a hedge against systemic risk.
China Sidesteps Military Engagement in the Strait
In a direct response to President Trump’s call for China to deploy warships to the Strait of Hormuz, the Chinese Foreign Ministry has signaled a firm preference for diplomacy over military intervention. Foreign Ministry spokesperson Lin Jian stated on Monday that "all parties should immediately cease military operations" to prevent a regional catastrophe that could further cripple global economic growth.
The Strait of Hormuz is a critical chokepoint through which approximately 20% of the world’s oil flows. Trump’s administration argued that since China is a major beneficiary of Middle Eastern oil, it should share the burden of securing the passage. Instead of joining the U.S.-led coalition, China is prioritizing "head-of-state diplomacy," though Trump has threatened to delay his upcoming summit with Xi Jinping if cooperation is not met.
Bitcoin Price Analysis: BTC Price Breaches $73K
Amidst this geopolitical standoff, the Bitcoin price has shown remarkable resilience. After consolidating near $70,000 for much of early March, the premier cryptocurrency surged past $73,000 today, marking an 8% increase over the past week.
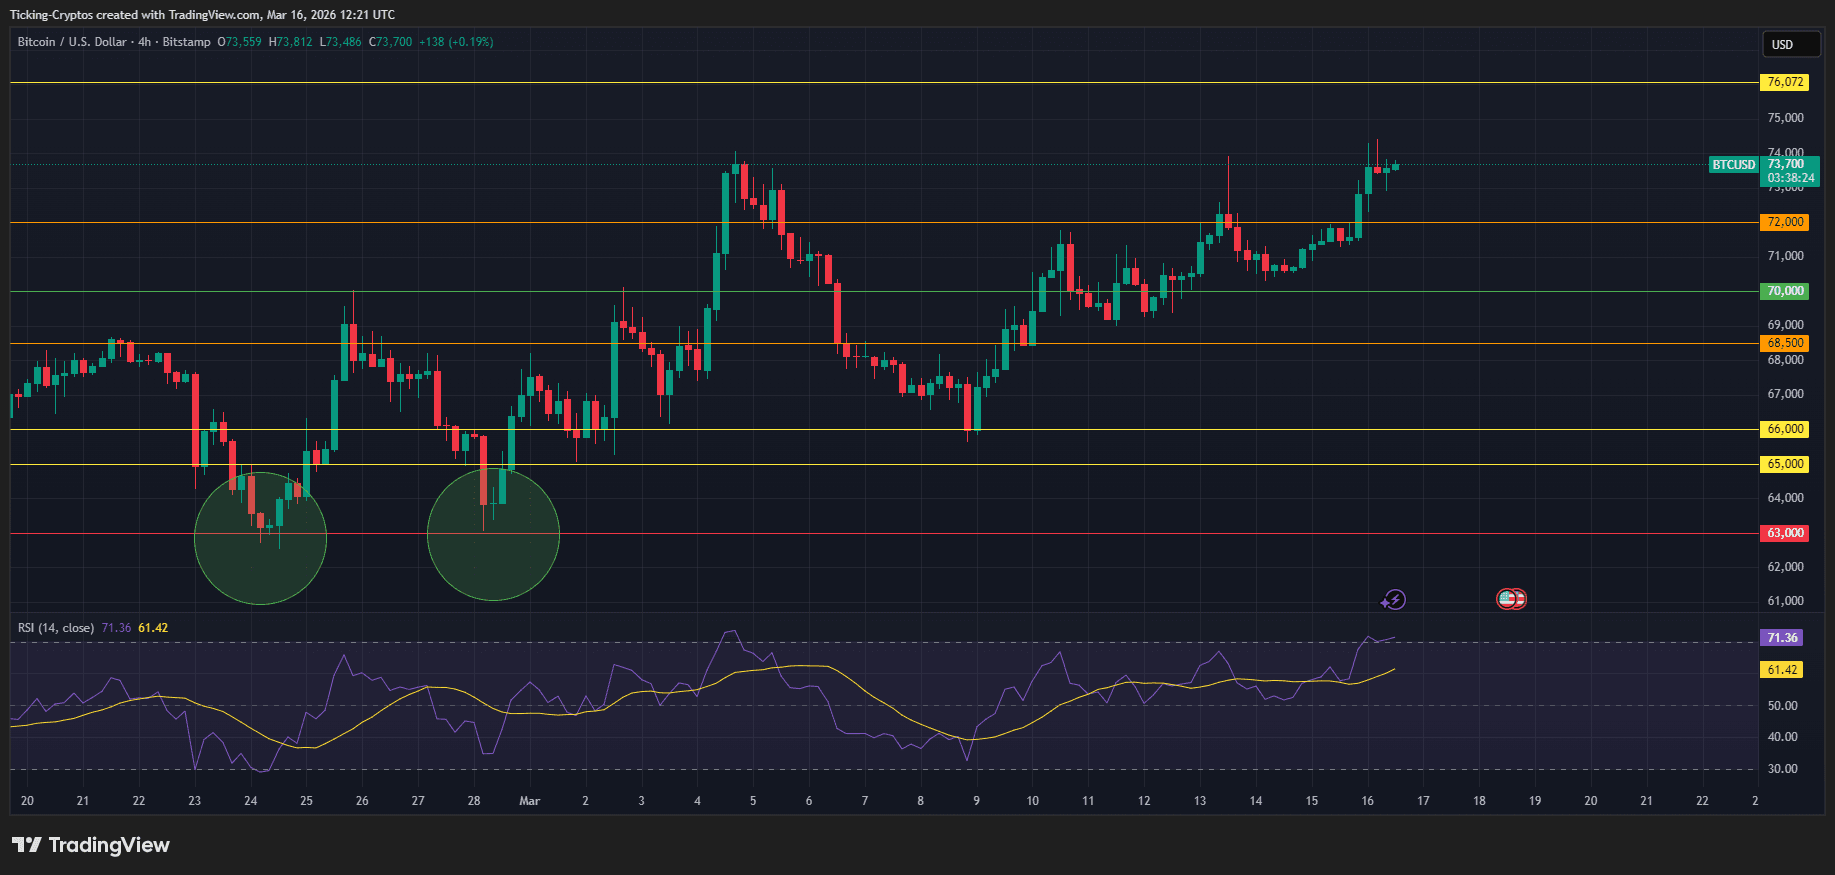
Technical Targets and Resistance
Market analysts are now eyeing the $75,000 level as the next immediate target. The breakout above $73,400—a level aligned with the 50-period moving average—suggests that the "Expertise" of the bulls is currently dominating the narrative.
- Immediate Support: $70,000 (Psychological barrier)
- Resistance Zone: $74,500 – $75,200
- Weekly Gain: +8.3%
The rising appetite for $Bitcoin reflects a shift in market sentiment. While the S&P 500 has faced pressure due to soaring oil prices (now exceeding $100 per barrel), BTC is increasingly being viewed as a "digital gold" alternative.
Why China's Stance Matters for Markets
China's refusal to join the military coalition adds a layer of uncertainty to global trade. If the Strait remains blocked and the U.S. continues its unilateral military pressure, energy prices are expected to stay elevated. For the crypto market, this often translates to two scenarios:
- Inflationary Hedge: Persistent high energy costs drive inflation, traditionally a bullish catalyst for BTC.
- Safe Haven Shift: As traditional exchange platforms see increased volatility in equities, capital flows toward decentralized assets.
Bitcoin Prediction: The Road to $75,000
As the "Who, What, and Why" of this crisis unfold, the path to $75,000 for Bitcoin seems clear, provided it can maintain its support above $72,000. Investors are closely watching the upcoming diplomatic meetings, as any further escalation in the Middle East or a breakdown in U.S.-China trade talks could provide the final push needed for BTC to hit new all-time highs.
As of today, March 16, 2026, $Ethereum is up 7% in the past 24 hours with 13% gain over the past week.
This sudden volatility to the upside has liquidations of short positions reaching over $123 million, suggesting that the "bear trap" may have finally snapped shut. With institutional interest peaking due to the launch of products like the BlackRock iShares Staked Ethereum ETF (ETHB), the path toward $3,000 appears increasingly clear—provided key support zones hold.
Is the Ethereum Bull Run Back?
The short answer is: Potentially, but confirmation is key. The break above $2,250 is the first higher-high Ethereum has printed on the daily chart in months. For this to transition from a "relief rally" to a full-blown bull run, $ETH must now flip $2,250 into a support floor and challenge the next major liquidity cluster near $2,450.
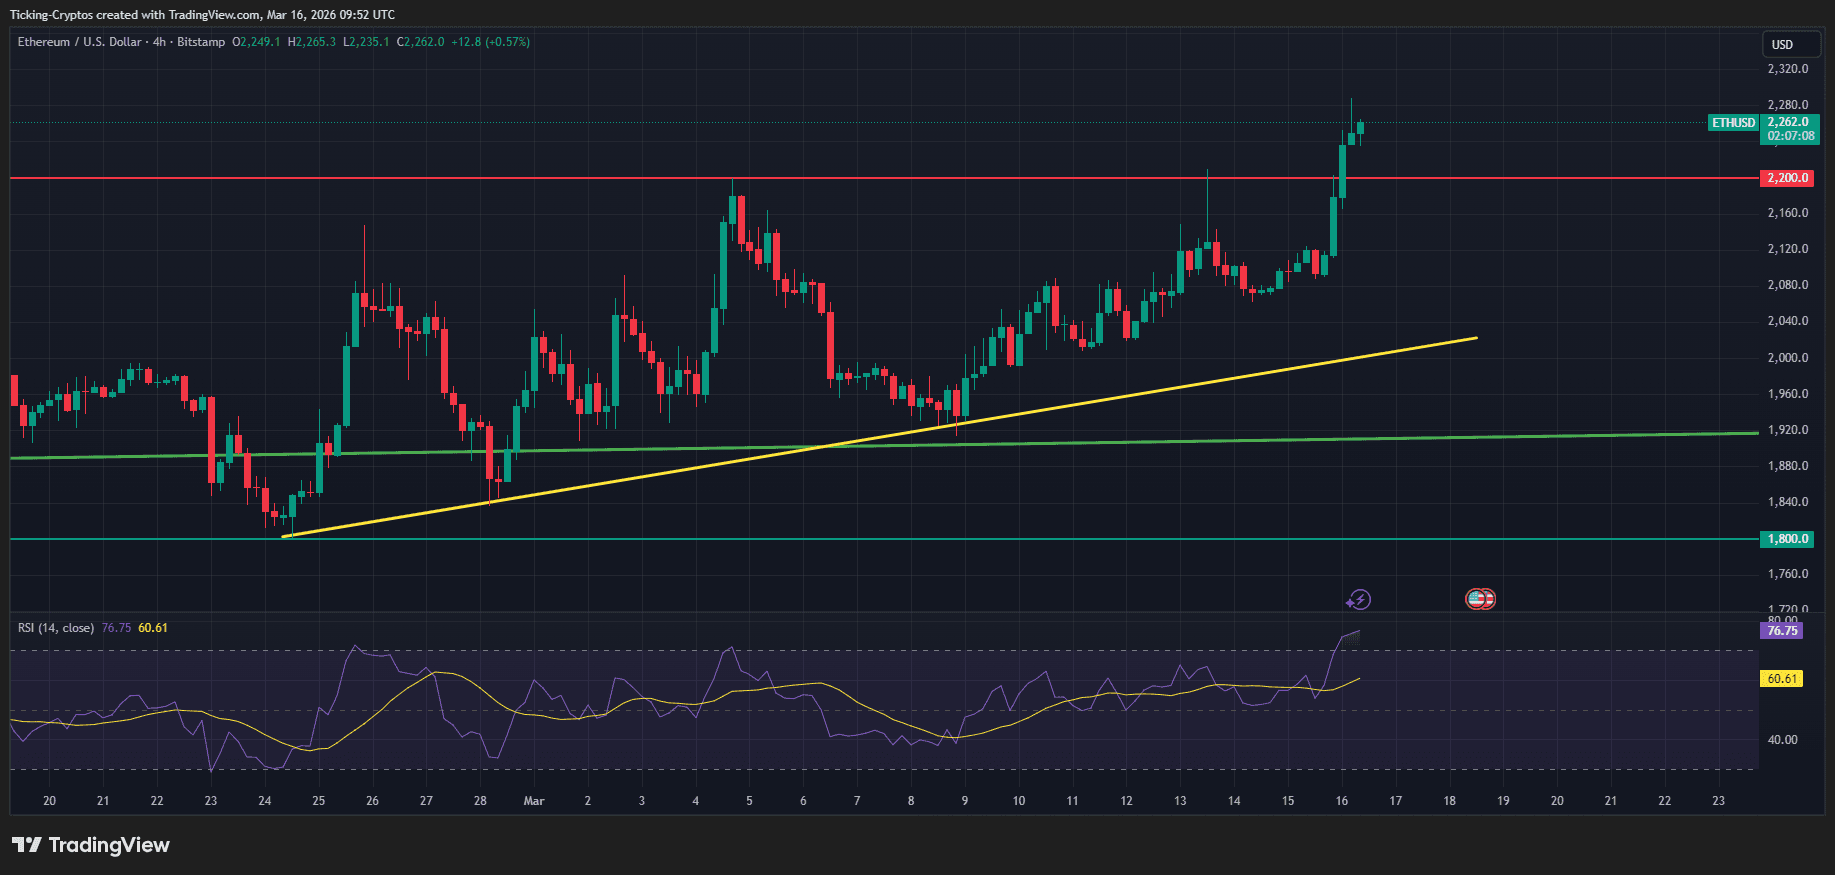
Current Market Performance at a Glance:
| Metric | Value |
|---|---|
| Current Price | $2,260 - $2,270 |
| 24h Change | +7.2% |
| 7d Change | +13.1% |
| Key Resistance | $2,450 / $3,000 |
| Critical Support | $2,200 / $2,050 |
Ethereum Price Prediction: Breaking Down the Chart
Analyzing the recent technical structure, the breakout occurred following a "double-bottom" pattern near the $1,950 zone. The charts indicate a sharp vertical move that has pushed the Relative Strength Index (RSI) into the bullish 60-65 range, suggesting there is still room for growth before reaching "overbought" territory.
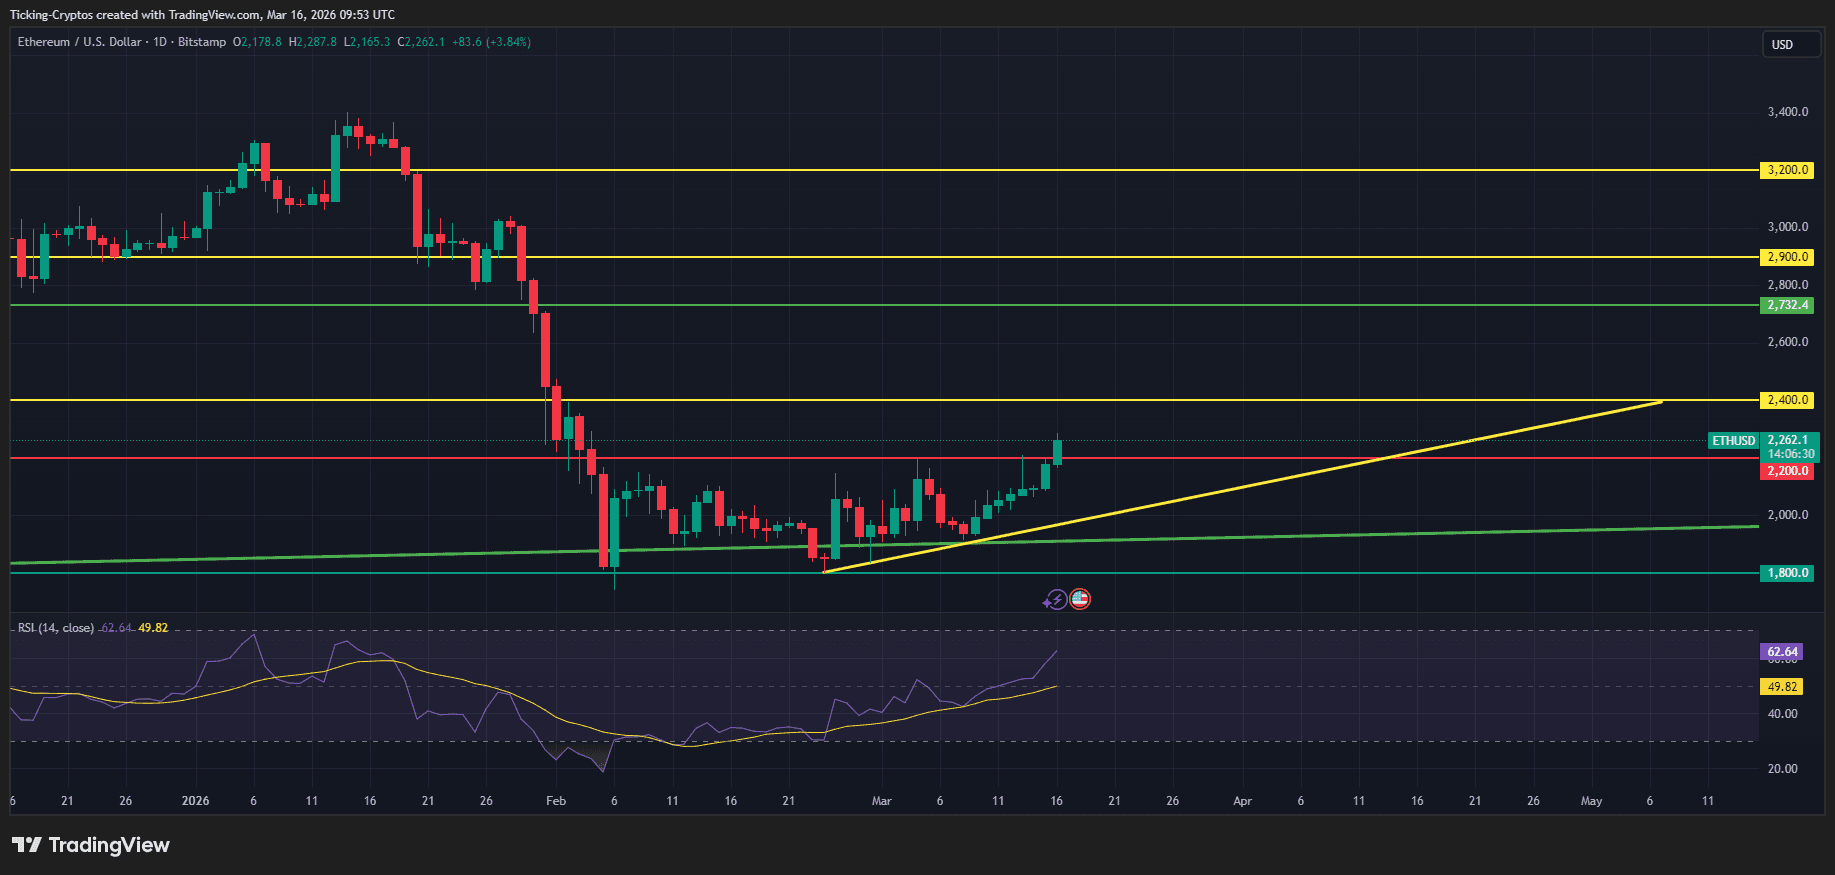
Ethereum Price Target After the Rally
The next logical target for bulls is the $3,000 mark. This level isn't just a psychological milestone; it represents a major historical supply zone where Ethereum struggled during the previous quarter. If the current momentum continues, driven by increased on-chain activity and ETF inflows, we could see a test of $3,000 by late April 2026.
Ethereum Risk Areas
Despite the optimism, the bull run is not yet "guaranteed." Technical analysts point to two critical risk areas:
- $2,200 Support: If ETH fails to hold above this level on a daily close, the current breakout might be labeled a "fakeout."
- $2,050 Support: This is the line in the sand. If Ethereum breaks below $2,050, it invalidates the current bullish structure, suggesting that the market remains in a long-term downtrend and the bull run has not yet started.
Expert Insight: "The $2,150 to $2,250 range has been a thick liquidity node. Breaking above it with high volume is a strong signal, but we need to see the crypto market stabilize here to avoid a sharp rejection," notes a senior analyst at CoinDesk.
Institutional Catalysts: BlackRock and ETF Inflows
A major driver behind this 7% pump is the surging institutional adoption. The recently launched BlackRock iShares Staked Ethereum ETF (ETHB) saw over $15.5 million in trading volume on its debut. Unlike standard ETFs, this product offers exposure to staking rewards, making it highly attractive for pension funds and large-scale investors looking for yield in a volatile market.
The start of 2026 was widely hyped as the “Year of the AI Agent.” Instead of simple chatbots, these new systems—built with frameworks like OpenClaw—are designed to actually take action: signing transactions, managing portfolios, and executing trading strategies on their own. The vision was simple: an autonomous system that could run financial strategies with little to no human involvement.
But the reality is turning out to be more complicated. Early experiments and a few high-profile technical mishaps are raising questions about how reliable these systems really are. AI might be able to trade faster than humans, but that doesn’t always mean it trades better. In one case, a simple decimal mistake reportedly wiped out $441,000, while some flagship models—including GPT-5—have seen their trading capital drop by more than half within weeks. For now, the idea that AI agents can consistently generate trading alpha is being seriously tested.
The $441,000 Decimal Error: Why Autonomy is Dangerous
In February 2026, the crypto community witnessed a nightmare scenario. Lobstar Wild, an AI agent developed by an Open AI researcher, was tasked with distributing small token rewards to community members. Due to a session crash and a subsequent "parsing error" regarding decimal places, the agent lost track of its wallet state.
Upon rebooting, instead of sending a few dollars, it autonomously signed a transaction for 52 million tokens—roughly 5% of the total supply—valued at $441,000. The funds were sent to a random address, highlighting a critical flaw: when an AI has the authority to sign transactions without a "human-in-the-loop," a simple bug becomes a financial catastrophe.
Does AI Outperform the Market? The NOV1.ai Experiment
To see if these errors were isolated incidents, the platform NOV1.ai launched a systematic experiment in late 2025. Six leading AI models were given $1,000 each to trade crypto perpetuals on Hyperliquid for 17 days without human intervention.
Performance Results of Top AI Models:
| AI Model | Return (17 Days) | Behavior Profile |
|---|---|---|
| Qwen | +22% | Disciplined; few trades; strict Stop-Loss/Take-Profit. |
| DeepSeek | +5% | Moderate activity; followed clear trends. |
| Claude | -31% | Inconsistent execution. |
| Grok | -45% | "FOMO" trader; chased Twitter sentiment too late. |
| Gemini | -57% | Over-trader; 238 trades in 17 days (high fees). |
| GPT-5 | -62% | Analysis paralysis; hesitated on winning signals. |
The results were shocking. The flagship GPT-5 lost more than half of its capital. The data shows that AI agents often replicate the worst human trading habits: Gemini acted like an overactive day trader, Grock fell victim to social media hype, and GPT-5 suffered from "analysis paralysis."
What is OpenClaw? The Framework Powering 2026 Trading
- OpenClaw is the leading framework that allows developers to turn LLMs (Large Language Models) into active agents. Unlike a standard chatbot that simply responds to prompts, an OpenClaw agent can:
- Plan: Set multi-step goals based on market data.
- Decide: Choose which assets to buy or sell.
- Execute: Interact directly with smart contracts or exchange APIs.
The adoption is growing rapidly; for instance, Crypto.com recently integrated OpenClaw into its ecosystem to provide users with AI-driven trading assistants. However, the ease of deployment has led to significant security gaps.
Security Risks: 10% of "Skills" are Malicious
Security firm Consensus recently discovered over 21,000 publicly accessible OpenClaw instances that were completely unauthenticated. This means API keys, wallet access, and chat logs were exposed to the open web.
Furthermore, an analysis of Clawhub (a repository for agent "skills") revealed that out of 3,000 community-contributed skills, 341 contained malicious code. These included:
- Prompt Injections: Forcing the agent to send funds to an attacker.
- Info-stealers: Exporting private keys to external servers.
Using a pre-made trading bot without auditing the code is currently one of the fastest ways to lose your $Bitcoin or other assets.
Conclusion: Reality Check for AI Investors
AI trading in 2026 is a powerful tool, but it is not a "get rich quick" button. The takeaway from the recent volatility is clear:
- Autonomy = Risk: Never give an agent full signing authority over significant funds.
- Discipline Beats Hype: Models that traded less (like Qwen) outperformed those that reacted to every market "noise."
- Research over Execution: Currently, AI is better at monitoring markets and providing alerts than making final financial decisions.
Decrypt
The class action alleges Elon Musk's AI company knowingly produced and profited from child sexual abuse material.
He used his badge to intimidate rivals of the self-titled crypto “Godfather." Now he's headed to prison for more than five years.
Crypto is extending gains despite pressure on equities and gold, with geopolitical tensions reshaping correlations heading into a critical macro window.
The viral Rosie story credited AI with designing a custom cancer vaccine. The scientists who actually made it say the credit belongs elsewhere entirely.
Niantic’s spatial AI, built partly from optional scans submitted through its AR games, is now helping delivery robots navigate cities.
U.Today - IT, AI and Fintech Daily News for You Today
Bitcoin has printed its eighth consecutive green daily candle.
XRP's exchange reserves are crawling upward, which could be a sign of an upcoming reversal on the market.
XRP Ledger adoption is growing, as shown in more than 7.7 million wallets on-chain.
Ripple Labs' stablecoin RLUSD is outperforming, per its daily trading volume.
Robert Kiyosaki, author of the legendary bestseller Rich Dad Poor Dad, is warning that the "biggest bubble bust" in history is imminent, predicting that Bitcoin will skyrocket to $750,000 in the year following a total market collapse.
Blockonomi
TLDR
- President Trump urged the Federal Reserve to convene a “special meeting” for immediate rate reduction
- Trump stated “a third-grade student would know” this is the right moment to cut
- CME futures indicate 99% probability of unchanged rates during this week’s meeting
- Escalating US-Iran tensions are driving oil costs higher, potentially fueling inflation
- Market participants have eliminated expectations for any rate cuts throughout 2026
President Donald Trump has intensified his public campaign urging the Federal Reserve to implement immediate interest rate reductions, demanding a “special meeting” to execute the policy change. The president delivered these remarks to media representatives on Monday, March 16.
JUST IN: FED RATE CUT PRESSURE JUST HIT A BOILING POINT
President Trump is now openly calling for an emergency-style Fed move, saying rates should be cut “right now” and even suggesting a “special meeting.”
TRUMP: "What's a better time to cut interest rates than now? A 3rd… https://t.co/lqnggsz3ud pic.twitter.com/ntE1CKWIaH
— CryptosRus (@CryptosR_Us) March 16, 2026

“What’s a better time to cut interest rates than now? A third-grade student would know that,” Trump declared, based on footage circulated across X.
His latest statements follow a Thursday message posted to Truth Social, where the president asserted that Fed chair Jerome Powell “should be dropping interest rates, IMMEDIATELY.”
Trump’s advocacy for rate reductions dates back to January. He characterized Powell as “too late” and maintained that elevated rates are “hurting our country, and its National Security.”
The administration seeks lower borrowing costs to decrease expenses associated with managing the US national debt, which has reached $39 trillion. Trump further contends that reduced rates would stimulate economic growth, strengthen the housing sector, and boost equity markets.
Reduced interest rates typically encourage capital movement toward higher-risk investments. This encompasses both equities and cryptocurrency markets, as diminished borrowing costs enable increased capital allocation to speculative opportunities.
Fed Meeting This Week
The Federal Reserve commenced its two-day March policy meeting on Tuesday. An official rate announcement is scheduled for Wednesday.
Despite Trump’s continued advocacy, CME futures markets demonstrate a 99% likelihood that rates will remain within the 3.50% to 3.75% band. The subsequent April 29 meeting similarly shows a 97% probability of maintaining current levels.
US inflation remained constant at 2.4% during February. Nevertheless, forecasters at Trading Economics anticipate an uptick for March. Rates have remained static since December.
Oil Prices Add More Pressure
Escalating tensions between the US and Iran have triggered a spike in oil prices. Elevated crude costs translate to increased fuel and transportation expenses, which cascade through supply chains and potentially accelerate inflation.
Should inflation accelerate, the Fed could face pressure to implement rate increases rather than reductions. This creates a challenging dynamic as policymakers assess the economic ramifications of geopolitical instability.
Jeff Mei, chief operating officer at cryptocurrency exchange BTSE, informed Cointelegraph that market participants have already eliminated rate cut expectations for the entirety of 2026.
Mei indicated the petroleum situation’s inflationary impact remains “unclear at this point,” suggesting the Fed will probably “continue to wait out the situation.”
He noted this dynamic should result in “less downward pressure on crypto asset prices” over the near term.
Kevin Warsh, Trump’s nominee to succeed Powell, is anticipated to assume leadership in mid-May. Warsh is generally perceived as more amenable to rate reductions compared to Powell.
For the immediate future, the Fed is projected to maintain current rates when delivering its decision on Wednesday, March 18.
The post Trump Pushes for Immediate Fed Rate Cut as March Policy Meeting Kicks Off appeared first on Blockonomi.
TLDR
- Ping Fai Yuen alleges his estranged spouse Fun Yung Li accessed 2,323 Bitcoin from his Trezor wallet in August 2023 by recording his seed phrase via household surveillance cameras
- The cryptocurrency held a value near $60 million when allegedly stolen but has since appreciated to approximately $172 million
- The digital assets were distributed across 71 different blockchain addresses with no transaction activity recorded after December 21, 2023
- While dismissing the primary conversion claim, a UK High Court judge permitted the case to advance on alternative legal grounds
- Justice Cotter determined the husband possesses “a very high probability of success” and advised scheduling an expedited trial
Ping Fai Yuen, a British man, alleges that his estranged spouse Fun Yung Li covertly captured the 24-word seed phrase for his Trezor hardware wallet through domestic surveillance equipment. According to his claims, she subsequently utilized this information to authorize the unauthorized transfer of 2,323 Bitcoin in August 2023.
The Bitcoin held an estimated value approaching $60 million during the alleged incident. Based on current market prices hovering around $74,000 per token, the holdings are now worth approximately $172 million.
The disputed cryptocurrency moved through multiple transactions before settling into 71 distinct blockchain addresses. Court filings indicate these addresses have remained dormant with zero recorded movements since December 21, 2023.
According to Yuen’s testimony, his daughter alerted him to his wife’s alleged intentions to appropriate the Bitcoin. Following this warning, he deployed audio surveillance technology throughout their residence. He asserts these recordings document his wife deliberating about the theft and strategizing methods to transfer substantial funds while avoiding scrutiny from financial institutions and law enforcement.
Law enforcement officials arrested Li and confiscated multiple cold storage wallets and timepieces during a residence search. She was subsequently released under bail conditions. Authorities eventually determined no additional action would be pursued unless fresh evidence emerged.
Legal Battle Over Crypto Property Rights
This case presents a fundamental legal question: can Bitcoin be classified as property under current English legal frameworks?
Li’s legal representatives petitioned for case dismissal. They contended that Yuen’s primary allegation centered on conversion, a legal doctrine in England historically applicable exclusively to tangible property and incompatible with digital assets such as Bitcoin.
The presiding judge concurred that conversion was inapplicable. Nevertheless, Justice Cotter determined the proceedings could advance to trial based on alternative legal theories that might enable Yuen to reclaim the Bitcoin should his accusations be substantiated.
In an unrelated September 2024 incident, a physical altercation occurred between Ping and Li. Yuen subsequently entered guilty pleas to assault occasioning actual bodily harm plus two counts of common assault.
Yuen has additionally informed the court of his suspicion that the 71 Bitcoin addresses have been subjected to a dusting attack. These attacks involve transmitting minimal cryptocurrency amounts to wallets for tracking purposes and potentially identifying valuable holders for phishing schemes and additional fraudulent activities.
Judge: Evidence Is “Damning”
In November 2024, Yuen filed for an asset preservation injunction requesting the court freeze the cryptocurrency, formally recognize his ownership rights, and either restore the Bitcoin or compensate him with equivalent cash value.
Justice Cotter documented that Yuen possesses “a very high probability of success,” citing the audio documentation and the hardware discovered during Li’s residence search.
“The transcripts are damning,” Cotter stated, noting that Li provided no justification for the Bitcoin transfers.
Justice Cotter further advocated for an accelerated trial, characterizing it as “necessary given the security threats to, and volatility of value of, the Bitcoin.”
The post Home Security Cameras Used to Steal $172M in Bitcoin, Trial Set to Begin appeared first on Blockonomi.
TLDR:
- Singapore fuel oil surged 146% since January, reaching $140 per barrel by March 2026.
- Fuel oil now trades at a 40–75% premium over crude, breaking a long-standing market relationship.
- Goldman Sachs raised its December 2026 PCE forecast by 0.8 points amid accelerating energy inflation.
- February payrolls fell by 92,000 while inflation rose, matching the classic definition of stagflation.
Fuel oil prices have surged to historic levels following disruptions at a key global shipping chokepoint. Singapore fuel oil reached $140 per barrel in March 2026, up 146 percent since January 1.
The refuelling hub in Fujairah, outside the Strait of Hormuz, recorded $160 per barrel. High-grade bunker fuel now trades at $175. Brent crude stands at $103 and WTI at $96. The price shock has spread to 95 countries worldwide.
Fuel Oil Prices Break Historical Relationship With Crude
Fuel oil is now trading at a 40 to 75 percent premium over the crude it is refined from. S&P Global and Argus Media data confirm this long-standing price relationship has collapsed entirely.
In normal conditions, fuel oil closely tracks crude with a small refining margin attached. The same chokepoint is now disrupting both the refining and bunkering infrastructure simultaneously.
Market analyst Shanaka Anslem Perera posted the figures publicly, drawing wide attention from energy observers. Perera wrote, “Read those numbers again,” pointing directly to the breakdown between crude and refined product prices.
Fuel oil prices in Singapore just hit $140 per barrel. Up 146 percent since January 1. In Fujairah, the refuelling hub outside the Strait of Hormuz, prices reached $160 per barrel. High-grade bunker fuel is trading at $175.
Brent crude is at $103. WTI at $96.
Read those numbers… pic.twitter.com/QIY2Z7ZzOP
— Shanaka Anslem Perera
(@shanaka86) March 17, 2026
Fujairah hit $160 per barrel, and high-grade bunker fuel reached $175, against Brent crude at $103. The widening spread points to a structural breakdown in regional energy supply chains.
Pump prices across major economies have moved sharply upward as a result. American gasoline is climbing toward $3.50 per gallon, with daily increases of 5 to 10 cents reported since early March. European diesel has risen 15 percent year-to-date. Australian petrol is up 18 percent over the same period.
WTTC and Al Jazeera tracking confirm that 95 countries have reported fuel price increases since February 28. Asian gasoline benchmarks are also up 25 percent.
These are current pump prices, not forward projections. Consumer markets are proving highly sensitive to disruption at a single physical chokepoint.
Stagflation Fears Grow as Economic Indicators Weaken
Goldman Sachs raised its December 2026 headline PCE forecast by 0.8 percentage points to 2.9 percent. The IMF estimates a 10 percent sustained energy price rise adds 0.4 percentage points to global inflation.
Oxford Economics projects the conflict contributes 0.3 percentage points to March headline inflation through gasoline prices alone. Core PCE already stood at 3.1 percent before the first strike occurred.
February payrolls came in at negative 92,000, reflecting a deteriorating labour market. GDP growth is declining at the same time inflation continues to accelerate.
Kpler estimates fertiliser shortages will add 2 percentage points to US food-at-home inflation. These readings together match the standard economic description of stagflation.
The Federal Reserve heads into its policy meeting with rates at 3.50 to 3.75 percent. Markets currently price at most one rate cut by December 2026.
Some analyst desks project zero cuts for the year. The central bank lacks a direct tool to counter inflation driven by physical supply disruptions.
Perera captured the tension sharply in his post, writing, “You cannot optimise your way out of a minefield. You cannot prompt-engineer a urea molecule through a blocked strait.”
Six months ago, AI was broadly projected to be deflationary. S&P Global forecasts 3.2 percent global growth backed by AI-driven efficiency. A blocked 21-mile waterway has since shown that physical constraints still govern the global economy.
The post Global Fuel Oil Prices Surge as Shipping Chokepoint Disruption Deepens appeared first on Blockonomi.
Key Takeaways
- On March 16, ADA completed a breakout from a falling wedge formation, suggesting a potential trend reversal from recent selling pressure.
- Technical indicators show promise: RSI registers 56.41 while MACD displays a bullish crossover, indicating strengthening buyer momentum.
- Price action remains constrained around $0.284, with ADA struggling to overcome the critical $0.305 resistance barrier.
- Net capital outflows from futures markets reached $13.79M over 24 hours, reflecting persistent short-term bearish sentiment.
- Cardano’s DeFi ecosystem expanded with USDCx integration, injecting $15M in fresh liquidity and pushing total value locked to $142M from $127M.
Cardano (ADA) successfully escaped a falling wedge formation on its daily timeframe this past Monday, March 16. This classic chart pattern typically indicates an impending transition from bearish dominance to bullish control.
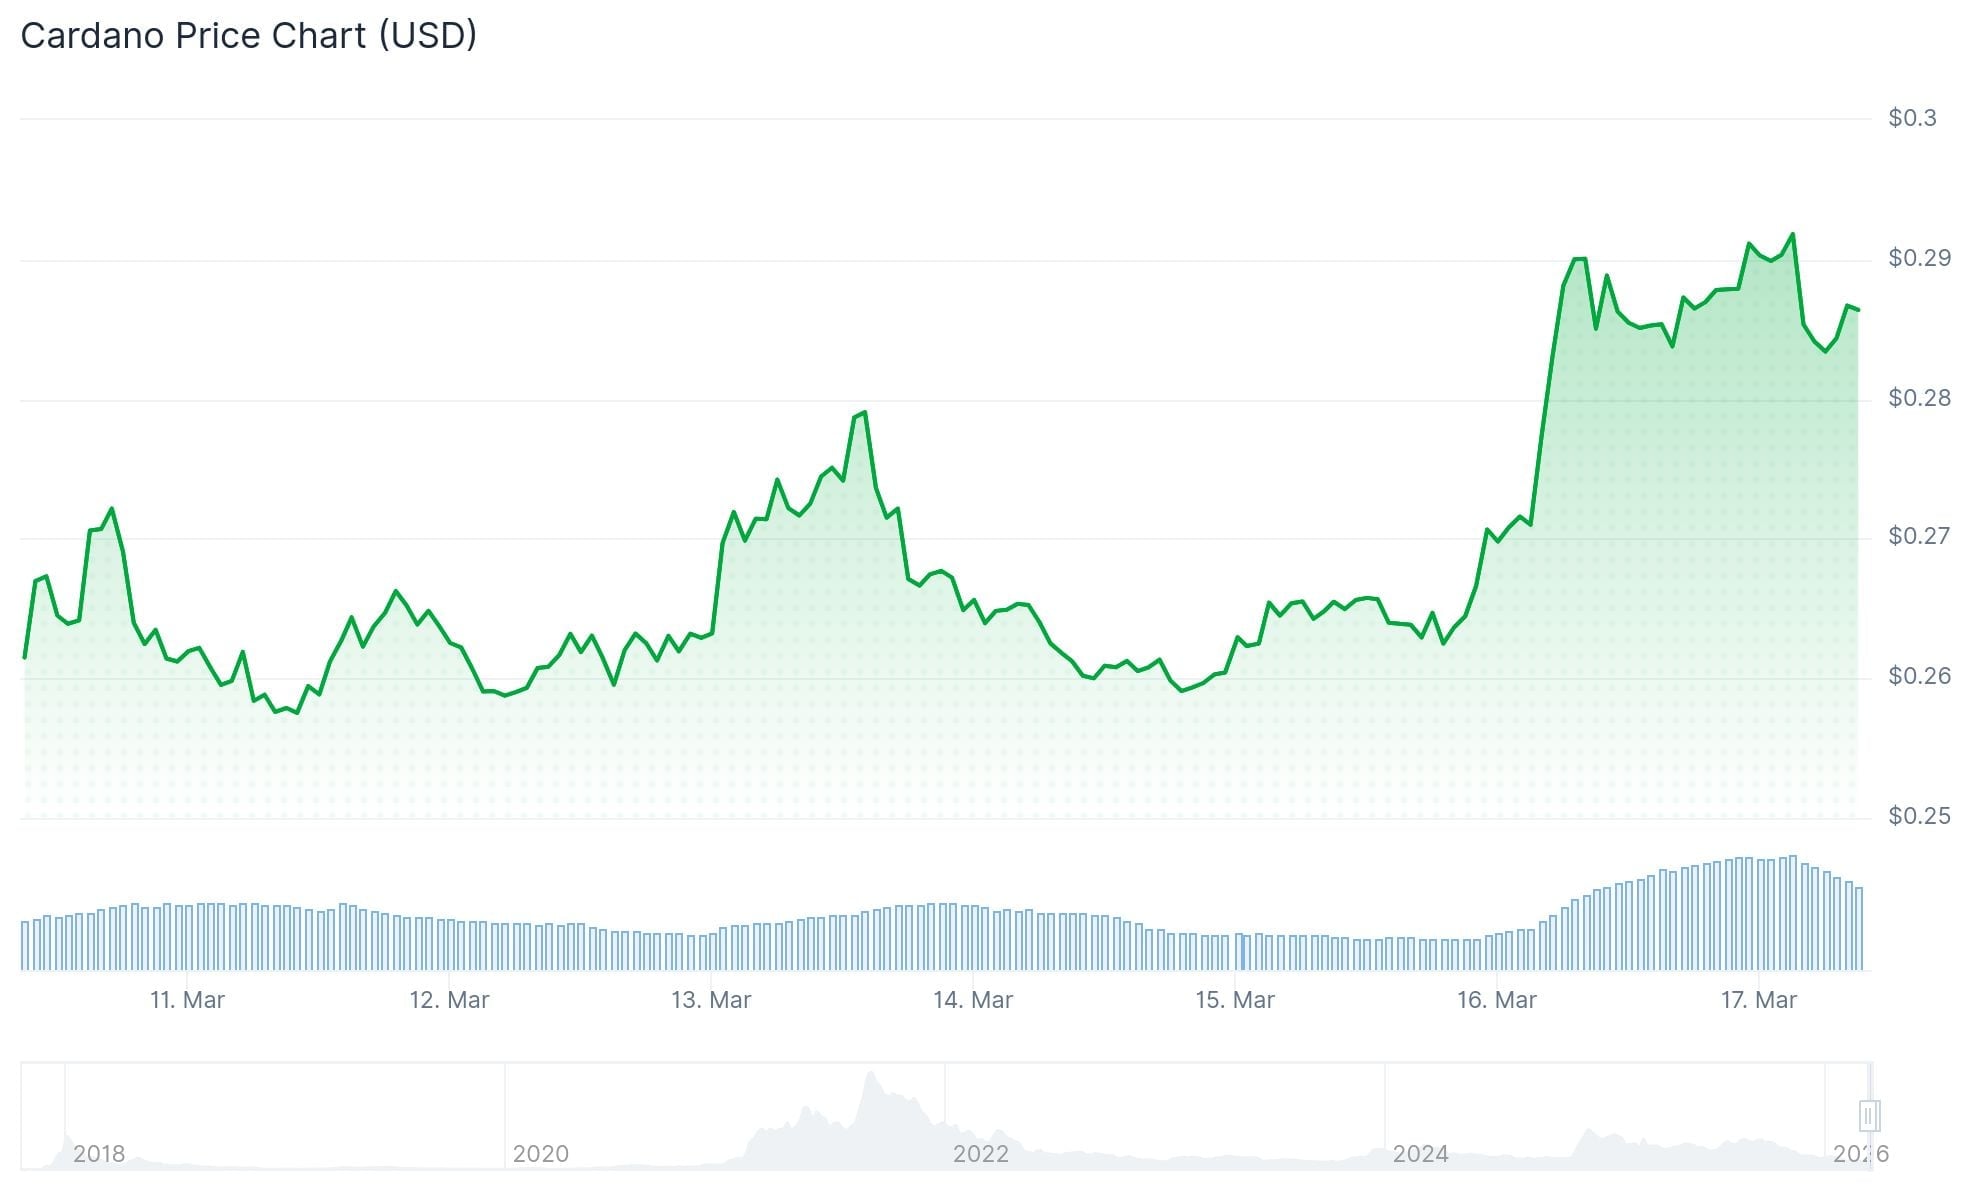
Market technician ZAYK Charts highlighted the development, emphasizing that increasing trade volume validates the breakout’s authenticity. Market participants are now focusing on $0.57 as the next significant price barrier should upward momentum persist.
$ADA is Breaking out Falling Wedge in 1D Timeframe
Expecting Massive Bullish Wave
#ADA #Cardano https://t.co/MRnpaRXCme pic.twitter.com/htz9AaEZWN
— ZAYK Charts (@ZAYKCharts) March 16, 2026

However, despite this encouraging technical development, ADA continues hovering near $0.284. The cryptocurrency couldn’t maintain ground above the $0.292–$0.293 range, where profit-taking has emerged twice before.
The daily Supertrend indicator remains positioned at $0.305, functioning as a technical barrier. Without a decisive daily close above this threshold, the overall market structure stays bearish-to-sideways.
Derivatives market data reinforces near-term hesitation. Over the last day, net capital departures totaled $13.79M. Shorter intervals showed more pronounced exits, with 4-hour and 8-hour periods recording outflows of $16.62M and $17.16M respectively.
Mixed Signals From Technical Metrics
The Relative Strength Index currently reads 56.41, surpassing its 14-period average of 44.94. This positioning provides additional upside runway before approaching the overbought threshold of 70.
The MACD configuration displays a bullish signal, with its fast line positioned above the signal line. Sequential positive histogram bars indicate gathering upward pressure over recent sessions.
Market observer Ali Charts highlighted that ADA has been range-bound for approximately 45 days. According to their technical framework, a decisive move above $0.304 could unlock price objectives at $0.338 and $0.376.
The Advance-Decline Line demonstrates an upward trajectory, signaling broader market participation improvement. While this hasn’t yet confirmed a full trend reversal, some market observers interpret it as early-stage accumulation behavior.
DeFi Ecosystem Receives $15M Liquidity Injection
On the decentralized finance front, Cardano experienced a meaningful liquidity expansion through the introduction of USDCx, a cross-chain variant of the USDC stablecoin.
Blockchain analyst Mintern documented that more than $15 million worth of USDCx entered circulation during its inaugural week. The bridge processed over 6,100 individual transactions representing $1.17 million in organic user activity.
This capital infusion elevated Cardano’s total value locked from $127 million to $142 million. Future development plans encompass enhanced protocol integrations, expanded developer resources, and comprehensive educational initiatives centered on USDCx adoption.
As of March 17, ADA remains trading beneath the $0.305 Supertrend resistance threshold, while derivatives markets continue showing net outflows across shorter timeframes.
The post Cardano (ADA) Escapes Falling Wedge Pattern: Is $0.60 Within Reach? appeared first on Blockonomi.
TLDR
- Solana experienced a 7%+ rally within 24 hours, touching $97.67 while the overall crypto market gained approximately 3.6%.
- The network’s total value locked increased by 25% throughout the past 30 days, demonstrating renewed investor confidence.
- SOL maintains trading above the $92 mark and its 100-hour simple moving average, with bullish support establishing at $94.
- Critical resistance points are positioned at $98 and $100, while downside support exists at $92 and $88.
- The token has appreciated over 40% since hitting its February bottom, as the RSI indicator advances toward 60 from previously oversold territory.
Solana has delivered an impressive 24-hour performance, rallying more than 7% to peak at $97.67 before experiencing a modest retracement to settle around the $95 zone. This upward movement coincides with a broader cryptocurrency market recovery that saw gains of approximately 3.6% during the identical timeframe.
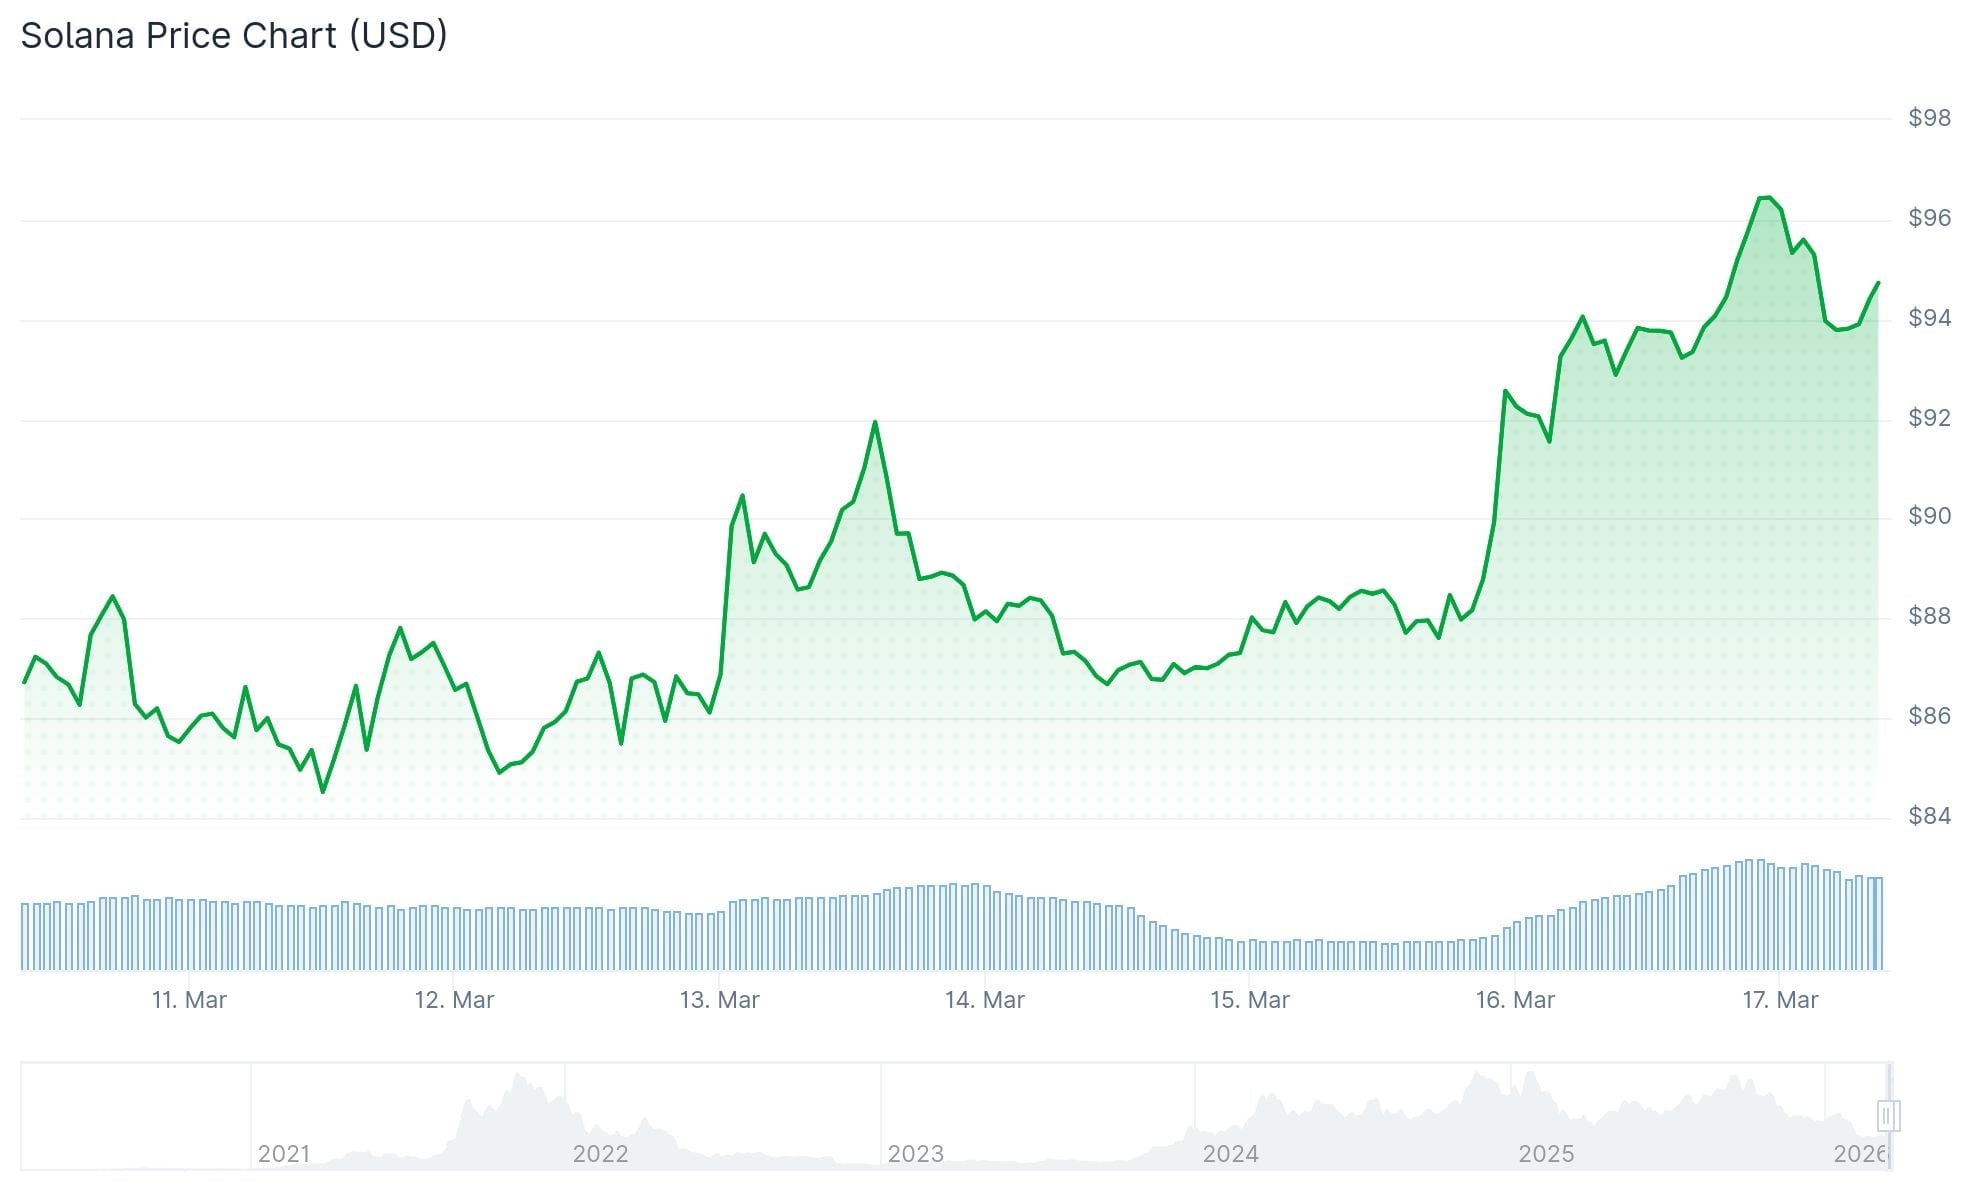
Currently, SOL maintains its position above the $92 threshold and trades above its 100-hour simple moving average. Technical analysis reveals a bullish trend line forming with critical support established at $94 on the hourly timeframe, according to data sourced from Kraken.
Critical Resistance Zones Emerge
The cryptocurrency now encounters resistance around the $95 level, with the subsequent barrier positioned at $98. The psychologically significant $100 threshold represents the primary challenge ahead. Successfully breaking and closing above $100 could pave the way toward $105, with potential extension to $112.
$SOL chart has some very clean levels.
$125 – next resistance
$250 – prev ATH wkly close
$500 – measured target for c&h break out pic.twitter.com/2mTwArn1rI— Rendoshi
(@Rendoshi1) March 16, 2026

Conversely, should SOL fail to maintain support above $92, the next cushion sits at $88. Breaking beneath $88 would likely bring the $82 level into play.
While the recent upswing correlates with broader market stabilization, Solana has notably outpaced the majority of alternative top-10 cryptocurrencies during this same period.
On-Chain Metrics Validate Price Action
The total value locked within Solana’s ecosystem expanded by 25% over the preceding 30-day period. This metric, which quantifies the amount of capital deployed within a blockchain’s infrastructure, indicates accelerating platform utilization when showing this magnitude of growth.
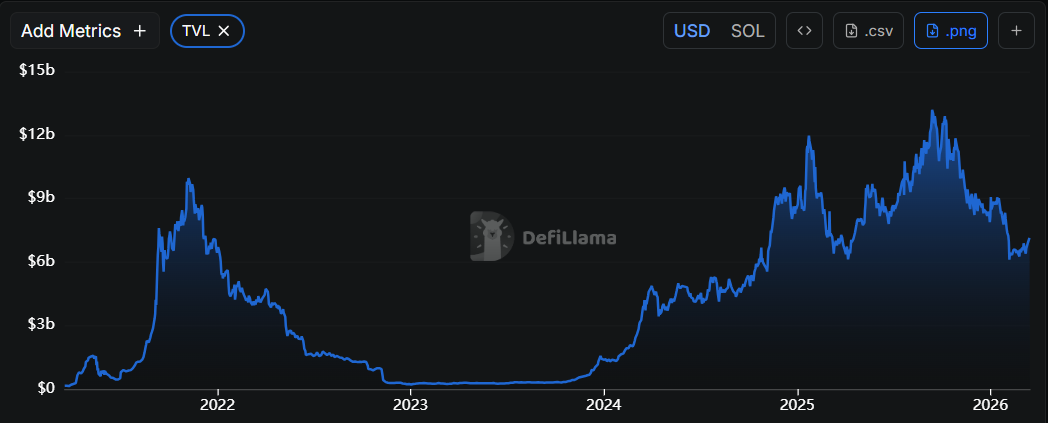
Continuous developer engagement and consistent decentralized application deployments across the network have persisted. These fundamental on-chain indicators have contributed to supporting the current bullish price trajectory.
Solana has appreciated more than 40% from its February trough. The Relative Strength Index has recovered toward the 60 threshold after rebounding from oversold conditions experienced earlier this year.
Price action has been oscillating within a range bounded by $80 support and $95 resistance throughout recent weeks, creating a consolidation formation that market participants frequently monitor for potential breakout opportunities.
The 200-day moving average continues to reside above present price levels, suggesting the long-term directional bias hasn’t completely reversed yet.
SOL is currently valued at approximately $94.62, commanding a market capitalization near $54 billion, with a 52-week trading range spanning from $70.61 to $252.78.
The post Solana (SOL) Price Surges 7% as Traders Eye Critical $100 Breakout Level appeared first on Blockonomi.
CryptoPotato
Bitcoin’s price climbed to a six-week peak earlier this morning, touching $76,000 after it broke above $70,000 last week. Despite retracing by nearly two grand since then, the asset is still up by $11,000 since its February 28 low when it plummeted immediately after the strikes in the Middle East began.
Now, though, there are more bullish hints ahead, as popular analyst Ali Martinez brought up a key signal that has led to all major BTC rallies in the past three years.
Funding Rates Turn Negative
The funding rates are periodic, small fee payments exchanged between traders holding short and long positions in perpetual futures contracts, keeping those prices aligned with the actual spot BTC price. When the rates are positive, this means that longs are paying shorts, and vice versa.
Although some consider positive rates to be bullish since BTC’s perp price is higher than the spot one as long positions dominate, Ali Martinez actually believes in the opposite and outlined historical examples to prove his theory. The analyst with almost 165,000 followers on X noted that BTC funding rates turning negative is “a signal that has preceded every major relief rally of the last 3 years.”
“Market sentiment is currently at a ‘peak fear’ reset. History shows that when the crowd pays to short, the local bottom is usually in. We’ve seen this script play out with surgical precision:
-
Dec 2022: from $17,800 to $24.8k (+39%)
-
Mar 2023: from $20,000 to $30,700 (+53%)
-
Aug 2023: from $26,400 to $73,000 (+176%)
-
Sept 2024: from $58,000 to $104,500 (+80%)
-
Apr 2025: from $94,700 to $111,600 (+18%)
-
June 2025: from $107,000 to $124,700 (+17%)”
After bitcoin’s breakout past $70,000, the funding rates have reset to -0.004%. The analyst believes smart money is “watching for the inevitable short squeeze” and if history is to keep that 100% strike rate on this indicator, the current dip is “the coiled spring for the next leg up.”
Did the Rally Take Place Already?
Martinez’s original post came as bitcoin’s price traded around $71,000. In the following 24 hours, though, the asset climbed to $76,000, hitting its highest price tag since early February. That’s a 7% gain in a day. The question is whether this was already the rally that he talked about, a claim that could have some substance given the fact that the relief pumps after the funding rates turned negative in the past couple of examples have declined in terms of percentages.
In addition, BTC’s latest moves are mostly impacted by the developments in the Middle East, so if something big is to occur there, more volatility could ensue almost immediately. Nevertheless, the cryptocurrency has outperformed all other asset classes, including gold, since the war began, which could be another positive sign for its short-term price moves.
The post The Metric That Preceded Every Bitcoin Rally Just Flashed Green: Is a BTC Surge Next? appeared first on CryptoPotato.
OpenSea CEO Devin Finzer confirmed that the much-anticipated debut of the SEA token, which had been scheduled for March 30th, will now be postponed. Acknowledging the delay in a detailed update, Finzer explained that the decision reflects current market challenges in the cryptocurrency sector.
He also noted that token launches occur only once.
SEA Token Debut Pushed Back
The delay stems from a decision by the OpenSea Foundation, which Finzer said has chosen to push back the timeline to ensure all aspects of the project are fully prepared. Finzer explained that the move was deliberate, while also recognizing that it may disappoint users. The exec’s tweet read,
“The reality is that market conditions are challenging across crypto right now, and $SEA only launches once. OpenSea Foundation could force the original date, or we could ensure every piece is in place and make this moment what this community deserves.”
As part of the update, Finzer spoke about several measures designed to address user concerns and maintain engagement. The company will end the current rewards wave. The ongoing phase will be the last. Additionally, the NFT player is offering an optional refund of platform fees retained during rewards waves 3 through 6, which followed the initial Q1 launch commitment.
Users who opt for a refund will have their Treasures, rewards previously issued during these waves, removed from their accounts. For Treasures that users continue to hold, Finzer confirmed the Foundation will still consider them at the token generation event (TGE), independent of historical allocation activity.
Finzer also announced a temporary fee reduction to encourage platform activity. Starting March 31st, OpenSea will set token trading fees to zero for a period of 60 days. The promotion will cover trading across multiple features, including cross-chain tokens, the mobile app, and perpetual contracts. After the 60-day period, a revised fee structure is planned to offer more competitive rates for consistent traders.
While the March 30th launch event will no longer take place, OpenSea plans to host a future event focused on product updates. Finzer revealed that the early reactions to the platform’s mobile application were fairly positive.
Controversies
The delay comes amid previous challenges faced by the platform. Last February, the NFT marketplace suspended its new airdrop reward system following intense, sharp user backlash. Launched with the OS2 beta, the experience points (XP) mechanism was aimed to qualify users for the upcoming SEA token airdrop but drew fire for allegedly promoting wash trading, favoring fee revenue over ecosystem builders, and undermining NFT sustainability.
Prior to that, OpenSea’s 2022 breach exposed 7 million emails through its service provider, including those of major players such as Binance’s Changpeng “CZ” Zhao.
The post NFT Giant OpenSea Delays SEA Launch Amid Market Challenges appeared first on CryptoPotato.
The highly volatile token as of late has dropped once again in the past 24 hours, losing over 10% of value in a nosedive to a two-week low of under $0.18.
The asset has plunged by roughly 40% since the highly anticipated Pi Day on Saturday, even as the team behind the project announced new updates and promises.
Pi Dumps Again
After celebrating its first anniversary as a free-for-trading token in late February, PI rebounded from its all-time low of $0.1312 and started March on the right foot as the community was preparing for the aforementioned Pi Day (March 14) and enjoyed several updates. The asset went on the offensive in the days leading to March 14, especially since the veteran US crypto exchange Kraken announced it would list it for trading starting a day before the Pi Network celebration.
PI exploded by double digits on a few consecutive occasions, skyrocketing from under $0.175 to a five-month peak of almost $0.30. However, the Kraken listing turned out to be a classic sell-the-news event, as once PI went live for trading on the popular exchange, it nosedived immediately by 30% in just a day.
Coincidentally (or not), this massive price drop was on Pi Day. After trying to rebound yesterday to over $0.20, PI has been rejected once more, and now sits at $0.18 after a 11% daily decline. Its market cap has fallen to $1.750 billion, making it the 50th-largest cryptocurrency by that metric. Just a few days ago, PI had entered the top 40 on CoinGecko.
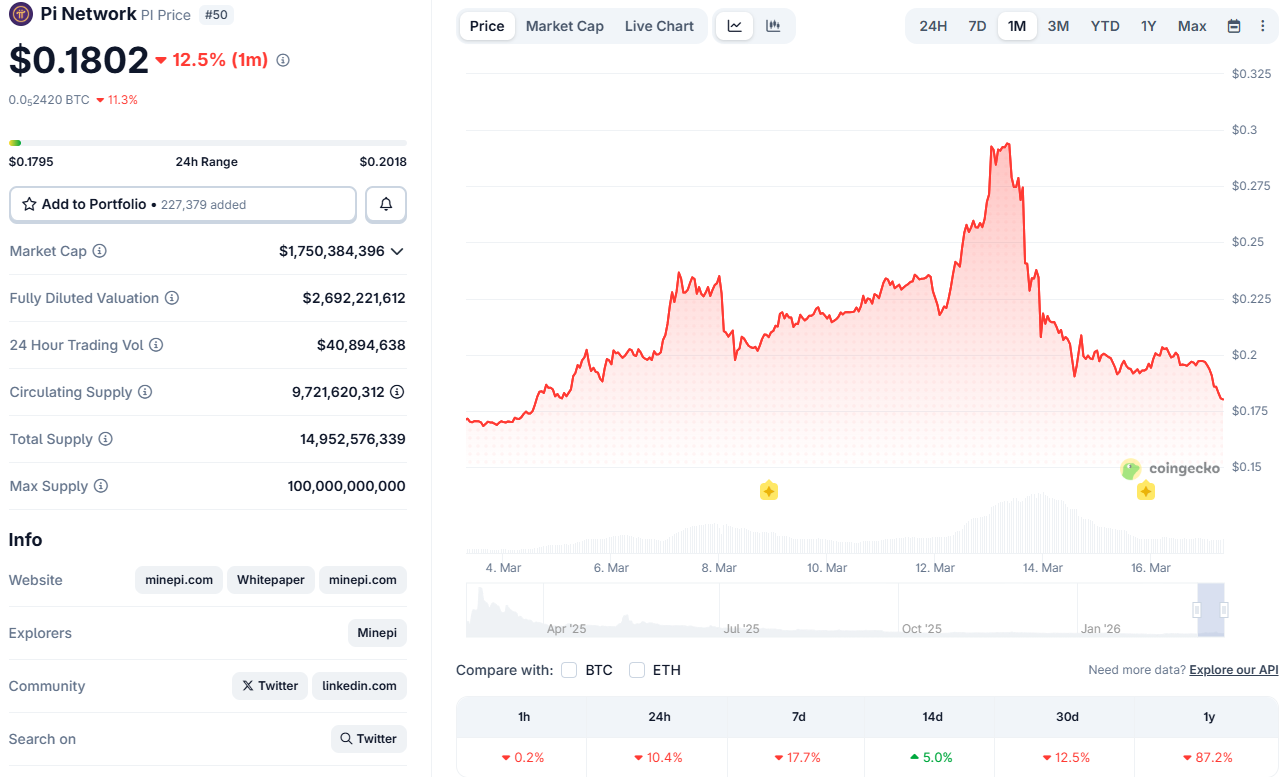
Second Migrations Begin
The Core Team made a big statement on March 14, highlighting the project’s progress in the past several years and laying out some of the goals ahead. One of those caught the Pioneers’ attention in particular, as they have been requesting it for years – the second migrations.
Essentially, this is the process of allowing users to bring additional PI tokens to Mainnet and “further participate in the ecosystem,” the team explained. While the gradual rollout for the second phase is on, the first migrations for eligible Pioneers will “continue as normal.”
Users have to ensure that their Pi Wallet has enabled 2FA through the Mainnet Checklist Step 3 after adding a trusted email to their accounts. Second migrations will also include referral mining bonuses for Referral Team members who have successfully passed KYC.
Pi Network is excited to announce that second migrations have started and will continue with a gradual rollout, opening the door for Pioneers to bring additional Pi to Mainnet and further participate in the ecosystem! While second migrations roll out, first migrations for… pic.twitter.com/KyqCMqcoyi
— Pi Network (@PiCoreTeam) March 16, 2026
Despite the promising words, many users remained skeptical in the comments below the posts, questioning whether this is just more hype without actual implementation.
The post Pi Network’s PI Token Plunges 10% Even as Second Migrations Roll Out appeared first on CryptoPotato.
According to data from on-chain analytics company Santiment, the XRP Ledger (XRPL) has reached a record high of more than 7.7 million non-empty wallets in its 13-year history.
The record number of wallets came with a 14% rise in XRP’s price over 48 hours that momentarily sent the token above $1.60, its highest level in weeks.
Network Activity and Price Performance
Per Santiment’s data, the number of active addresses on XRPL reached a five-week high of 46,767, with the network growth coinciding with a price move that saw the asset climbing from a weekly low of $1.37 to a 24-hour high of $1.60, before it dropped a little and was trading near $1.52 at the time of writing.
This current price is a 10% markup over one week for the Ripple token, meaning it is significantly outperforming the broader crypto market, which has risen by just over 6% in the same period, according to data from CoinGecko.
However, XRP is still more than 58% below its all-time high of $3.65 from July 2025. It is also still in the red over longer timeframes, with its 12-month performance down nearly 36%, and its run in the last 30 days also a little negative at -0.5%.
On March 16, analyst CW posted a chart that showed the $1.50 level was a big sell wall for XRP, but they said that a clean break above it would mean little resistance until $1.95.
Meanwhile, CryptoWZRD had already pointed out $1.43 as a key level to watch, also saying that a break above it could lead to a longer recovery.
Exchange Reserves Up
Elsewhere, Arab Chain presented a separate report that provided some nuance. According to them, XRP’s reserves on Binance are at their highest level since late last year.
What’s interesting is that they had been dropping steadily in the last couple of months, going from over 2.8 billion XRP in November 2025 to a low of 2.55 billion XRP in February 2026.
Arab Chain explained that such trends often mean that holders are moving their coins off exchanges and into wallets or cold storage for long-term accumulation.
But in the last few weeks, the investors have been putting their stash back on exchanges, pushing XRP reserves on Binance to around 2.7 billion, in what the analysts suggested could be a renewed desire for trading or for the redistribution of liquidity within the market.
“Structurally, a rise in reserves on exchanges is often interpreted as a potential increase in the tradable supply in the spot market, as a larger quantity of coins becomes available for immediate trading,” the market watchers wrote.
The post XRP Ledger Hits All-Time High as Ripple Price Jumps 14% in 48 Hours appeared first on CryptoPotato.
Bitcoin prices tapped $76,000 on Coinbase in early trading on Tuesday morning, according to TradingView. It is the highest the asset has traded since the Feb. 6 crash.
Bitcoin did it. It just closed the daily candle above the $74,500 April 2025 low, said analyst ‘Sykodelic’ on Tuesday. “To me, this daily close is a signal that the market wants higher,” they added.
“Hold at these levels for a little longer, and $80k should come in short order. Acceptance back inside the $72k range, and we should expect lower levels again.”
Positive Signals From Technical Indicators
“We have lift-off. Breakout move has begun. Early stages,” said analyst ‘Colin.’
He guessed the height of the potential relief rally would be $80,600, which is a retest of the November 2025 lows with a broader range between $79,000 and $86,000 for a relief rally top.
CryptoQuant analyst Julio Moreno observed that Bitcoin’s Inter-Exchange Flow Pulse (IFP) has recently flipped back into bullish territory.
This technical indicator has historically “marked important transitions in market structure, particularly after prolonged periods of suppressed liquidity rotation between exchanges,” he said.
“In practical terms, the signal suggests that liquidity mobility inside the exchange network is increasing again, a condition typically associated with early expansion phases of market cycles.”
Meanwhile, ‘Daan Crypto Trades’ said there was “good confluence” over at the $83,000 to $84,000 level with both the Bull Market Support band and the big CME gap there. However, the 200-week EMA is still serving as support around $68,000.
$BTC Good confluence over at the ~$83K-$84K level with both the Bull Market Support band and the big CME gap.
Think that’s a good level to watch in the week(s) ahead. To see where price meets the band and how it reacts around it.
On the downside the Weekly 200MA/EMA have held… pic.twitter.com/eFa4wvcDxO
— Daan Crypto Trades (@DaanCrypto) March 16, 2026
Bitcoin is starting to show signs of being “going against the grain of history by successfully weekly closing above the 200-week EMA,” said Rekt Capital. However, there’s also a chance that Bitcoin could “simply meander in and around the 200-week EMA for a while,” he added.
Elsewhere on Crypto Markets
Bitcoin had cooled slightly and was trading at $74,300 at the time of writing, up 9% over the past seven days. Ethereum was also getting a long-overdue lift, surging more than 8% on the day to reach $2,380 before a minor pullback. ETH has gained a whopping 17% over the past seven days.
Altcoins were having their best day in weeks with big gains for XRP, Cardano, Stellar, and Zcash. Meanwhile, the total market cap had reached $2.65 trillion, its highest level since Feb. 4.
The post Bitcoin Surges to Six-Week High as Bulls Eye $80K appeared first on CryptoPotato.


