Cryptocurrency Posts
Crypto Briefing
Warsh's hawkish stance may stabilize inflation but risks economic fragility, impacting markets and crypto amid political and productivity pressures.
The post Kevin Warsh set to lead Federal Reserve as US inflation climbs toward three-year high appeared first on Crypto Briefing.
Nvidia's potential 40% stock rise underscores the transformative impact of AI infrastructure growth on tech investment strategies.
The post Wells Fargo sees Nvidia stock rising over 40% driven by AI appeared first on Crypto Briefing.
eBay's rejection highlights the challenges GameStop faces in its transformation efforts, emphasizing the need for sustainable growth strategies.
The post eBay rejects GameStop’s $56B acquisition bid as unappealing appeared first on Crypto Briefing.
Anthropic's decision highlights the intensifying tech rivalry, potentially impacting global AI collaboration and cybersecurity dynamics.
The post Anthropic rejects Chinese think tank’s request for AI model access appeared first on Crypto Briefing.
The deteriorating US-Iran relations could destabilize global oil markets and heighten geopolitical tensions, impacting international diplomacy.
The post Trump says US-Iran ceasefire is on life support after rejecting peace proposal appeared first on Crypto Briefing.
Bitcoin Magazine
Bitcoin Magazine
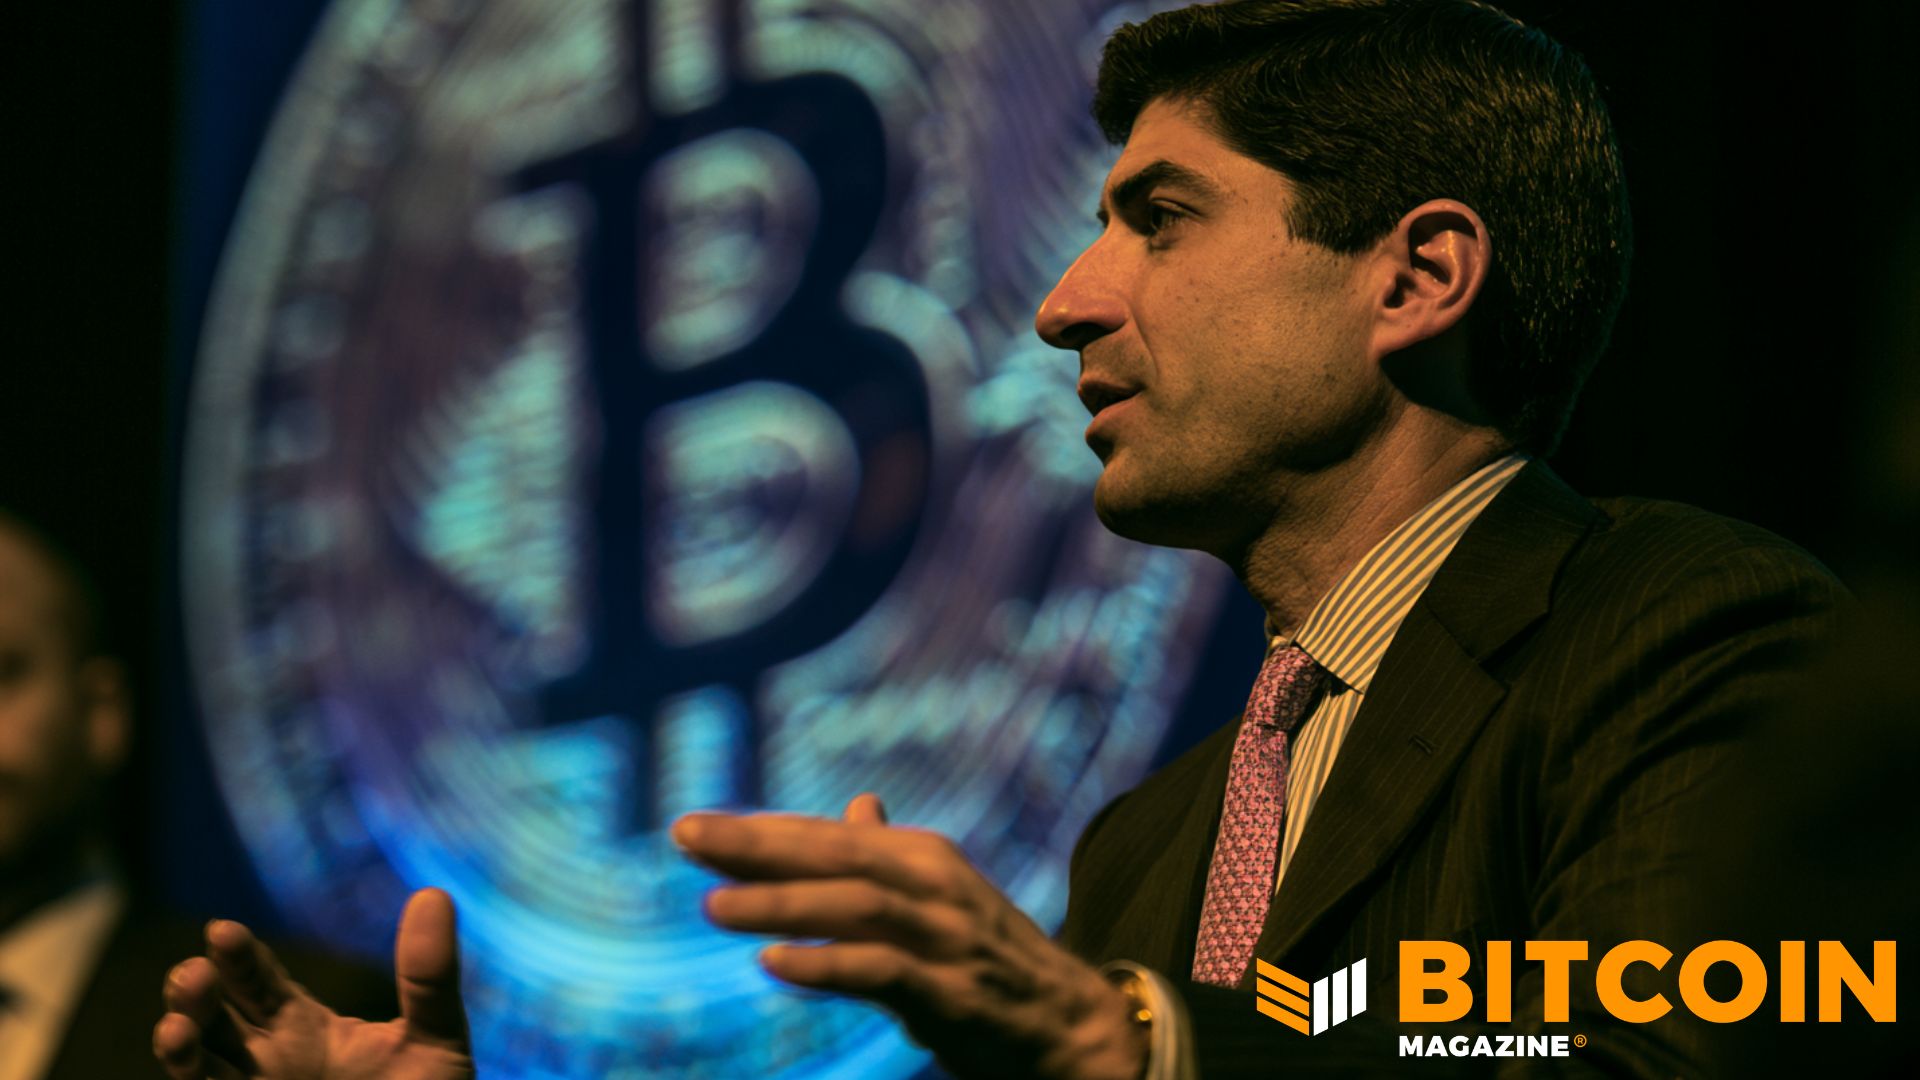
Senate Confirms Bitcoin Friendly Kevin Warsh As Fed Chair Ahead of Clarity Act Vote
The Senate on Wednesday confirmed Kevin Warsh as the next chair of the Federal Reserve in the most divisive confirmation vote in the central bank’s modern history, handing President Donald Trump a landmark win just as fresh inflation data clouds the path to the interest rate cuts he has loudly demanded.
The chamber voted 54–45 to confirm Warsh, 56, making him the 11th Fed chair of the modern banking era and the wealthiest person ever to hold the position. The vote was nearly entirely along party lines, with only Pennsylvania Democratic Senator John Fetterman crossing over in support.
BREAKING:
— Bitcoin Magazine (@BitcoinMagazine) May 13, 2026Pro-Bitcoin Kevin Warsh officially confirmed as Federal Reserve Chair in Senate vote. pic.twitter.com/LfVVSbAsGA
Warsh takes over from Jerome Powell, whose four-year term as chair expires Friday — though Powell is not departing the Fed entirely, as he retains his seat as a board governor through 2028.
Warsh is no stranger to the Fed’s marble corridors. He previously served on the Board of Governors from 2006 to 2011, becoming the youngest member in the institution’s history at age 35.
His return comes at a far more turbulent moment: the Fed is grappling with persistent inflation above its 2% target, economic fallout from the war in Iran, and a looming Supreme Court fight over the fate of Governor Lisa Cook.
Trump has made no secret of his expectations. The president repeatedly clashed with Powell over what he viewed as overly restrictive monetary policy, and Warsh was selected from a field of nearly a dozen candidates — including current governors Christopher Waller and Michelle Bowman — with rate relief firmly in mind.
Yet this week’s data has complicated the picture, with pipeline price pressures accelerating at their highest pace in more than three years, causing markets to scale back rate-cut bets and even price in a chance of an increase later this year. Warsh’s first FOMC meeting as chair is scheduled for June 16–17.
Warsh: Bitcoin doesn’t trouble me
For the Bitcoin community, Warsh’s confirmation carries singular weight. He is the first incoming Fed chair to have held direct exposure to digital assets, including an equity stake in Flashnet, a Bitcoin payments startup, as well as ties to crypto index manager Bitwise and stablecoin project Basis.
He has publicly described Bitcoin as “an important asset” and “a very good policeman for policy,” arguing its price reflects real-world confidence in the Fed’s inflation management. “Bitcoin doesn’t trouble me,” Warsh said at a Hoover Institution event last year, framing it as a signal of monetary credibility rather than a threat to the dollar.
Lawmakers are set to vote tomorrow on the Clarity Act, a closely watched piece of legislation that could reshape regulatory oversight for bitcoin and digital assets in the United States.
Rep. French Hill (R-AR) praised the confirmation, saying Warsh’s “commitment to disciplined monetary policy will help restore confidence in our economy”.
Critics, including Sen. Elizabeth Warren, spent his April 21 confirmation hearing warning that political pressure from the White House could compromise the Fed’s independence — a concern Warsh flatly rejected, vowing to keep monetary policy “strictly independent”.
Powell, for his part, said he plans to “keep a low profile as a governor.”
This post Senate Confirms Bitcoin Friendly Kevin Warsh As Fed Chair Ahead of Clarity Act Vote first appeared on Bitcoin Magazine and is written by Micah Zimmerman.
Bitcoin Magazine
Coinbase CEO Says Crypto Bill Could Rewire American Finance — Senate Votes Thursday
A long-stalled crypto market structure bill is moving through Congress with new momentum — and Coinbase’s top executive says it could reshape the American financial system.
Coinbase CEO Brian Armstrong declared his company’s support for the Digital Asset Market Clarity Act on Wednesday, calling the legislation a “true compromise” that balances the demands of the crypto industry against the interests of the traditional banking sector and signaling the bill is in the best shape he has seen since negotiations began.
The statements, via Fox News, came as the Senate Banking Committee prepared to hold its markup of the CLARITY Act on May 14, the first formal committee vote on the legislation in the Senate after months of procedural delays and two cancelled markups.
Committee Chairman Tim Scott has set a target of June or July 2026 for a full Senate floor vote, while the White House has marked July 4 as its goal for a presidential signature.
JUST IN: Coinbase CEO Brian Armstrong tells Fox Business there was a compromise on the Bitcoin & crypto market structure bill, clearing the way for it to pass the Senate
— Bitcoin Magazine (@BitcoinMagazine) May 13, 2026
"It's in the best place we've seen so far…We're ready to support a markup later this week."pic.twitter.com/U88UfywifU

A legislative marathon is taking place
The CLARITY Act — formally H.R. 3633, the Digital Asset Market Clarity Act of 2025 — cleared the House of Representatives on July 17, 2025, in a 294–134 bipartisan vote, with all 216 House Republicans in support and 78 Democrats crossing the aisle.
Since then, the bill sat in the Senate Banking Committee through two cancelled markups, extended stablecoin negotiations, and an intensifying lobbying war between crypto firms and Wall Street banks.
At its core, the legislation draws a regulatory line between the Securities and Exchange Commission and the Commodity Futures Trading Commission.
Under the bill, the CFTC would hold exclusive jurisdiction over spot and cash markets for digital commodities while the SEC retains authority over investment contract assets and primary market fundraising. Stablecoins are carved out as a separate category under shared oversight.
The Senate version of the bill expanded beyond the House text, growing to nine titles that cover decentralized finance protections, illicit finance provisions, bankruptcy safeguards for crypto customers, and the Blockchain Regulatory Certainty Act, which creates safe harbors for software developers who publish code without controlling customer funds.
The stablecoin standoff
The bill’s most contested provision centered on stablecoin yield. Banks warned that permitting crypto platforms to pay rewards on stablecoin balances would trigger deposit flight from traditional bank accounts and threaten lending operations. Crypto firms, led by Coinbase, argued that restrictions would hand banks a competitive advantage and strip Americans of new financial tools.
The standoff produced a compromise brokered by Senators Thom Tillis (R-NC) and Angela Alsobrooks (D-MD). Under the final language in Section 404 of the bill, stablecoin issuers and affiliated digital asset service providers cannot pay yield on balances if that yield is the functional or economic equivalent of bank interest.
Activity-based rewards — cashback on payments, transaction-based incentives, and rewards tied to commerce — remain permitted. A stablecoin holder who takes no action generates no return.
Armstrong confirmed his support after the compromise text became public, with Coinbase’s Chief Policy Officer Faryar Shirzad declaring the industry “secured what is important.”
Speaking on Fox, Armstrong credited Senators Tillis, Alsobrooks, and their staffs for bringing both sides to the table. “I’ve got to give a lot of credit to Senators Brooks and Tillis and their staff who worked tirelessly on this,” he said.
Armstrong described a financial sector moving fast toward digital asset integration.
“I go around and I speak with lots of different bank CEOs, and many of them are just leaning into this as an opportunity to grow their business,” he said. “They’re integrating stablecoins as fast as they can.”
More than 100 crypto firms and industry groups, including the Crypto Council for Innovation and the Blockchain Association, wrote to the Senate Banking Committee in April urging the panel to advance the bill, warning that continued delays risk pushing innovation and capital outside the United States.
Treasury Secretary Scott Bessent reinforced that call, telling a Senate panel the legislation is essential to protecting the dollar’s status as the world’s reserve currency.
The Thursday markup is not the finish line. If the Banking Committee approves the bill, it must merge with a version passed by the Senate Agriculture Committee in a party-line 12–11 vote in January 2026.
A full Senate floor vote requires 60 votes, making Democratic support a practical requirement and leaving an ongoing fight over ethics provisions — specifically language addressing President Trump and his family’s crypto holdings — as the bill’s biggest remaining fault line.
This post Coinbase CEO Says Crypto Bill Could Rewire American Finance — Senate Votes Thursday first appeared on Bitcoin Magazine and is written by Micah Zimmerman.
Bitcoin Magazine
Bitcoin Suisse Secures Bermuda Regulatory Approvals for International Digital Asset Expansion
Bitcoin Suisse (International) Ltd., an affiliate of the Switzerland-based Bitcoin Suisse Group, has obtained dual regulatory approvals from the Bermuda Monetary Authority, according to a note shared with Bitcoin Magazine.
The Bermuda Monetary Authority (BMA) granted the entity a Class F license under Bermuda’s Digital Asset Business Act (DABA) and a Class B registration under the Investment Business Act 2003.
The approvals, granted on a pre-operational basis, authorize Bitcoin Suisse to provide regulated digital asset management and investment advisory services to professional and institutional clients. The entity is domiciled in Hamilton, Bermuda, and is a subsidiary of BTCS Holding Ltd., the group’s parent holding company.
The DABA license covers the provision of regulated digital asset business services, while the IBA registration permits investment advisory and discretionary portfolio management.
Clients may fund mandates in Bitcoin, stablecoins, or fiat currency, the company said. The entity operates on a non-custodial basis, relying on regulated custodial providers and partner banks for institutional-grade security.
Andrej Majcen, Co-Founder and Group CEO of Bitcoin Suisse, framed the approvals as a turning point for the firm’s global ambitions.
“Institutional investors recognize digital assets as a permanent part of their portfolios. What they need is a partner who combines deep crypto-native expertise with the governance and regulatory standards they expect from traditional financial services,” Majcen said. “The BMA approvals mark an important step in Bitcoin Suisse’s transition towards a global wealth management platform.”
Multi-region bitcoin expansion strategy
Investment decisions will draw on Bitcoin Suisse’s proprietary Crypto Analysis Framework and its Global Crypto Taxonomy — a classification system covering approximately 600 digital assets across six sectors, developed over more than a decade of research. An experienced CIO Office and dedicated research function will underpin all client mandates.
Bermuda has positioned itself as a global hub for digital asset regulation since introducing the Digital Asset Business Act in 2018, one of the first comprehensive frameworks of its kind in the world. The jurisdiction’s regulatory architecture has attracted crypto-native firms seeking institutional credibility and offshore reach.
The Bermuda approvals build on Bitcoin Suisse’s existing international presence. The group holds an In-Principle Approval from the Financial Services Regulatory Authority of the Abu Dhabi Global Market, establishing a regulated footprint in the Middle East. Together, the two jurisdictions form the foundation of a multi-region expansion strategy targeting ultra-high-net-worth individuals, family offices, external asset managers, and corporate counterparties.
This post Bitcoin Suisse Secures Bermuda Regulatory Approvals for International Digital Asset Expansion first appeared on Bitcoin Magazine and is written by Micah Zimmerman.
Bitcoin Magazine
The 2036 Issue: Letter From The Editor
None of us can see the future. We don’t know what 2036 will bring.
We all like to tell ourselves that we can, or do, and maybe we do actually see small pieces of it coming before we catch up to them, but none of us see the whole picture. That’s, at the end of the day, part of what it is to be human.
Nevertheless we can’t seem to help ourselves from at least trying.
Going into the second half of the 2020s we are coming out of a time period that marked wild and tumultuous disruption, with the world changing in both big and small ways that none of us could have imagined in our wildest dreams at the start of 2020. As we enter the second half of the decade, events around the world are starting to push us in a direction that seems like it will be even more disruptive and unpredictable than the first half of the decade.

In this issue, we are going to do what we can’t help ourselves doing, we’re going to try to predict the shape of the next decade. I say shape, and not just the future itself, because that is the best that human beings can actually do.
These pages are filled with pieces written by some of the most influential and intelligent people that engage in this space trying to look ahead and provide something of value to you, the reader. Some have given deep analysis of how larger geopolitical trends will unfold, others have written more lighthearted musings on what different aspects of our lives will be like day-to-day, and some have written what I can only call warnings or reminders of what to keep in mind while navigating the coming ten years.
Every few generations, the world seems to go through some tumultuous upheaval. A radical shift that upends the order and institutions that maintained the previous shape of the world. I think we are entering that next period now, and we’ve probably been standing in its doorway since 2020.
Chaos and change are not solely reasons to give in to fear, or anxiety, they are also reasons to have hope and optimism. When things fall apart, it doesn’t just mean the end of what was there before, it means there is space to build something new. It signals the beginning of something new in the exact same moment that it signals the end of something old.
The next ten years are going to be the biggest opportunity yet for Bitcoin. We can either spend them optimistically building, putting our energy into bringing into reality the positive impact we see that Bitcoin can have on the world, or we can squander them doing the opposite.
Ultimately, the shape the future has when it finally arrives at our doorstep will be the shape that all of our individual actions and choices mold it into.
Make them count.

Don’t miss your chance to own The 2036 Issue — featuring articles written by many influential figures in the space pondering the challenges of the next decade!
This piece is the Letter from the Editor featured in the latest Print edition of Bitcoin Magazine, The 2036 Issue. We’re sharing it here as an early look at the ideas explored throughout the full issue.
This post The 2036 Issue: Letter From The Editor first appeared on Bitcoin Magazine and is written by Shinobi.
Bitcoin Magazine
Senate Crypto Bill Faces Over 100 Amendments Ahead of Thursday Markup
Senate Banking Committee members have filed more than 100 proposed amendments to the Digital Asset Market Clarity Act, according to Politico reporting. The panel is set to convene on Thursday for a long-awaited markup vote that crypto and industry leaders say could reshape digital asset regulation in the United States.
The committee scheduled its executive session for 10:30 a.m. on May 14 at Room 538 of the Dirksen Senate Office Building in Washington, D.C., where lawmakers will debate the amendments and vote on whether to send the bill to the full Senate floor.
The flood of filings follows the release of an updated 309-page draft of the bill earlier this week, expanded from the 278-page version proposed in January.
Senator Elizabeth Warren leads the opposition push, submitting more than 40 amendments alone, with the bulk of proposed changes coming from Democratic members of the Banking Committee.
The wave of filings mirrors the January markup session, which drew 137 amendments before that session was cancelled, signaling that resistance to the bill remains strong even as its supporters push for a final vote.
At the center of the dispute is how the bill handles stablecoin yield products — crypto that offer returns to holders. Banking groups argue such crypto products threaten traditional deposit bases; crypto firms counter that reward programs support liquidity and customer activity without functioning as bank deposits.
The American Bankers Association has sent more than 8,000 letters to Senate offices since last Friday, targeting the stablecoin yield compromise brokered by Senators Thom Tillis and Angela Alsobrooks. That compromise, reached after months of negotiations, prohibits stablecoin issuers from paying interest or yield to users who hold tokens passively, while preserving exceptions for rewards tied to genuine platform transactions and payment activity.
Senators Jack Reed and Tina Smith filed amendments to tighten those standards further, targeting products that deliver returns in ways that resemble traditional interest-bearing deposit accounts.
The banking lobby maintains the existing compromise language still leaves room for stablecoin platforms to replicate high-yield savings products without meeting bank-level regulatory requirements.
Senate ethics provisions and developer protections
Senator Chris Van Hollen introduced a proposal that would prohibit senior government officials and their families from owning or promoting crypto-related businesses — a demand Democrats say is non-negotiable given President Trump’s close ties to the crypto industry.
Republican sponsors have resisted the provision, with some warning that ethics riders could fracture the coalition needed for the bill to advance.
A recent draft of the bill already included language shielding noncustodial developers from being classified as money transmitting businesses, with that protection extended retroactively to cover past conduct.
The broader stakes for the crypto industry
The CLARITY Act, formally H.R. 3633, passed the House on July 17, 2025, by a 294–134 bipartisan vote before stalling in the Senate through two cancelled markup sessions and protracted stablecoin negotiations.
At its core, the bill would draw a clear jurisdictional line between the Securities and Exchange Commission and the Commodity Futures Trading Commission, ending years of enforcement-based policymaking that left crypto firms operating under legal ambiguity.
Prediction markets have priced the odds of the bill becoming law in 2026 roughly at 60%, the highest level in months, with the White House setting a July 4 target for a presidential signature.
Committee Chairman Tim Scott had originally targeted a Senate floor vote for September 2025, then pushed that deadline to end-of-year, and most recently said he hoped to reach a full Senate vote by June or July 2026.
Thursday’s markup is the first formal committee vote on the bill in the Senate, and its outcome will determine whether that timeline is still within reach.
This post Senate Crypto Bill Faces Over 100 Amendments Ahead of Thursday Markup first appeared on Bitcoin Magazine and is written by Micah Zimmerman.
CryptoSlate
Bitcoin is hovering just below $80,000 as President Donald Trump arrives in Beijing for a high-stakes meeting with Chinese leader Xi Jinping, turning the visit into a live test of whether the crypto market’s latest risk rally has enough support to survive a difficult macro week.
The trip comes as traders are already contending with hotter inflation data, rising Treasury yields, and a Bitcoin rally that has leaned heavily on derivatives positioning rather than deep spot demand.
That combination has left the market unusually sensitive to headlines from Beijing, where any shift in trade, technology, or supply-chain policy could quickly feed through global risk assets.
For Bitcoin, the China visit is less about direct digital-asset policy than the broader market signal it sends.
A constructive meeting could ease fears of another round of escalation between the world’s two largest economies and help extend the risk-on bid that pushed BTC back toward $80,000.
Conversely, a breakdown could have the opposite effect, forcing traders to reassess a rally already showing signs of strain.
China visit becomes Bitcoin’s risk-sentiment test
Trump’s arrival in Beijing marks the first visit by a US president to China since 2017 and places trade, technology, and strategic competition at the center of global markets for the week.
The US president's delegation reflects the economic stakes. Trump is joined by senior officials, including Secretary of State Marco Rubio and Treasury Secretary Scott Bessent, as well as business leaders from technology and finance.
NVIDIA CEO Jensen Huang, Tesla CEO Elon Musk, and Apple CEO Tim Cook are among the executives whose presence reflects how deeply US-China relations now run through chips, artificial intelligence, electric vehicles, and global manufacturing.
Those issues matter directly for equity markets and indirectly for crypto. Bitcoin has traded less like an isolated monetary hedge during recent macro shocks and more like a high-beta expression of global liquidity, risk appetite, and investor confidence.
When traders expect looser financial conditions or reduced geopolitical pressure, Bitcoin tends to benefit. When trade tensions rise and yields climb, crypto often loses its speculative cushion.
That makes the tone of the Trump-Xi meeting crucial. Any signal that Washington and Beijing are willing to soften trade barriers, reopen channels on technology restrictions, or negotiate around rare-earth exports could support a broader risk rally.
At the same time, commitments tied to agricultural purchases, energy flows, or aircraft orders would also give markets a reason to price in reduced trade friction.
However, the reverse would be more difficult for Bitcoin. A dispute over Taiwan, export controls, rare-earth minerals, or military positioning could push investors back toward cash, Treasuries, and the dollar.
In that scenario, Bitcoin’s claim as digital gold would again be tested against its recent behavior as a leveraged risk asset.
Inflation leaves little room for disappointment
The Beijing summit is carrying more weight because the US macro backdrop has already narrowed Bitcoin’s margin for error.
This is because the April inflation data showed that price pressures remain too firm for markets to price in a more accommodative Federal Reserve path with confidence.
The Consumer Price Index rose 3.8% from a year earlier, while core inflation, which strips out food and energy, stood at 2.8%. Energy prices rose 17.9% annually, keeping headline inflation well above the Fed’s 2% target.
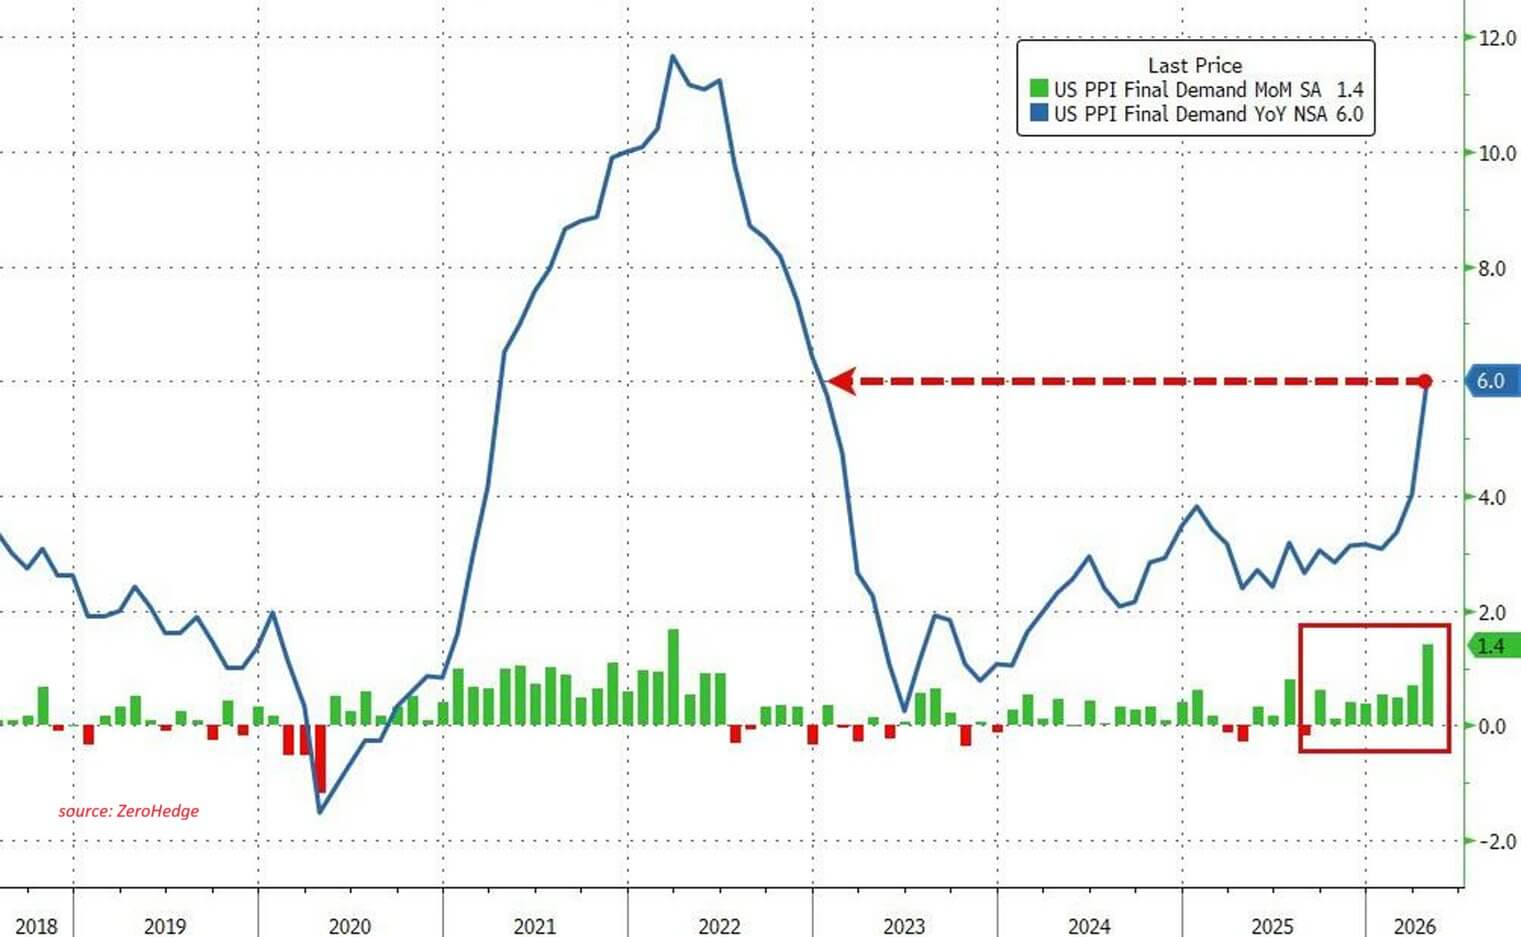
Producer prices added to the pressure. The Producer Price Index rose 6% from a year earlier in April, while the 1.4% monthly increase marked the largest gain since March 2022.
The data reinforced concerns that companies are still facing cost pressures that could eventually be passed on to consumers.
The market response was immediate. US Treasury yields pushed higher, with the 10-year yield moving back toward 4.4%, while traders scaled back expectations for near-term Fed relief.
That repricing creates a more restrictive environment for speculative assets because higher yields increase the appeal of safer income-producing instruments.
Bitcoin has historically struggled when real yields rise. Unlike Treasuries, it does not offer a coupon.
Due to this, its appeal depends on expectations for price appreciation, monetary debasement hedges, and liquidity expansion.
So, when yields rise and inflation remains sticky, investors become less willing to pay for risk without stronger evidence of sustained demand.
That is why the China summit now sits at the center of the week’s Bitcoin setup. The market is not entering the meeting with inflation pressure elevated, yields rising, and traders already cutting exposure after the CPI print.
Leverage makes the $80,000 rally easier to break
Meanwhile, Bitcoin’s current market positioning around $80,000 also has the potential to amplify both gains and losses.
Analysts at Wintermute noted that BTC’s recent push above $80,000 was driven heavily by derivatives activity. Open interest climbed from $48 billion to $58 billion in a month, suggesting that perpetual futures played a major role in the advance.
That does not mean the rally is artificial, but it does make it more fragile. When open interest rises quickly, price gains can reflect traders adding leverage rather than long-term investors accumulating spot Bitcoin.
In that environment, a positive headline can accelerate upside as shorts are forced to cover. A negative headline can trigger the opposite reaction, with leveraged longs rushing to exit.
Wintermute’s warning that “covering isn’t conviction” captures the central weakness in the current move. Short covering can push prices higher, but durable bull markets usually require sustained spot buying.
So far, spot volumes have not kept pace with the surge in leverage, leaving the market exposed if the squeeze loses momentum.
Technical signals point to a similar risk. Bitcoin’s Relative Strength Index has moved toward overbought territory, suggesting that the rally may be stretched in the short term.
Low exchange reserves add another layer of complexity. Constrained supply can help prices rise when demand is steady, but it can also worsen slippage when traders rush to reduce exposure.
In a thin market, a sharp shift in sentiment can produce larger price swings than fundamentals alone would suggest.
That leaves Bitcoin highly exposed to the tone of the Trump-Xi meeting. A constructive outcome could keep leverage working in the bulls’ favor. However, a diplomatic stalemate or escalation could turn the same leverage into the mechanism for a rapid pullback.
The post Trump’s CEO-filled China visit can decide whether Bitcoin’s $80,000 risk rally survives this week appeared first on CryptoSlate.
Is a global 2008-style economic crash nigh? And do current conditions resemble the early stages of a broader global financial crisis driven by debt costs, inflation pressure, and constrained policy responses?
Those questions have become harder to dismiss because the pressure points are stacking in the wrong order: high sovereign yields, high public debt, an energy shock, sticky inflation, and stretched asset valuations.
The world has echoes of 2008, but the policy setting is different. Banks are better capitalized than they were before the global financial crisis, and the Federal Reserve's latest financial-stability work still points to areas of resilience in household and bank balance sheets.
Any 2020 analogy also breaks down: governments and central banks could then flood the system with support while inflation was muted.
The setup is different because the rescue tradeoff is more expensive. Global public debt stood at just under 94% of GDP in 2025 and is projected to reach 100% by 2029 in the IMF's April Fiscal Monitor.
The World Bank is warning that the Middle East war can push energy, food, fertilizer, and inflation higher. The Financial Stability Board has flagged sovereign bond markets, asset valuations, and private credit as areas that need close monitoring.
The result is a credible, reasonable worst case, with inevitability still outside the evidence.

Sovereign yields return to global financial crisis warning levels
[Editor's Note: Intraday volatility was extremely high today, May 13. Snapshot used for this article was taken around 14.00 UTC]
The bond market is where the question starts. Intraday government-bond data today, May 13, showed U.S. Treasurys at roughly 3.99%, 4.46%, and 5.03% across the 2-year, 10-year, and 30-year tenors.
U.K. gilts were around 4.53%, 5.10%, and 5.78%. German Bunds were near 2.71%, 3.11%, and 3.63%. Japanese government bonds sat at around 1.40%, 2.59%, and 3.82%.
The historical comparison is critical here. Nasdaq previously marked U.S. 2-year yields at the highest since 2007, when they reached 4%.
U.K. 2-year gilts are at the highest levels since June 2008, while U.K. 10-year yields are near 18-year highs, and 30-year gilts are near levels associated with 1998.
Germany's 10-year Bund is close to its highest level since May 2011, during the eurozone debt crisis. Japan's 10-year yield has reached levels last seen in 1997, with the 2-year yield at levels last seen in 1995.
China is the exception. Its 10-year government bond yield was around 1.74% on May 13, with the 2-year near 1.27% and the 30-year near 2.24%, according to Trading Economics.
That curve points to a different growth and price backdrop, splitting the story into high-yield stress in developed markets and low-yield growth pressure in China.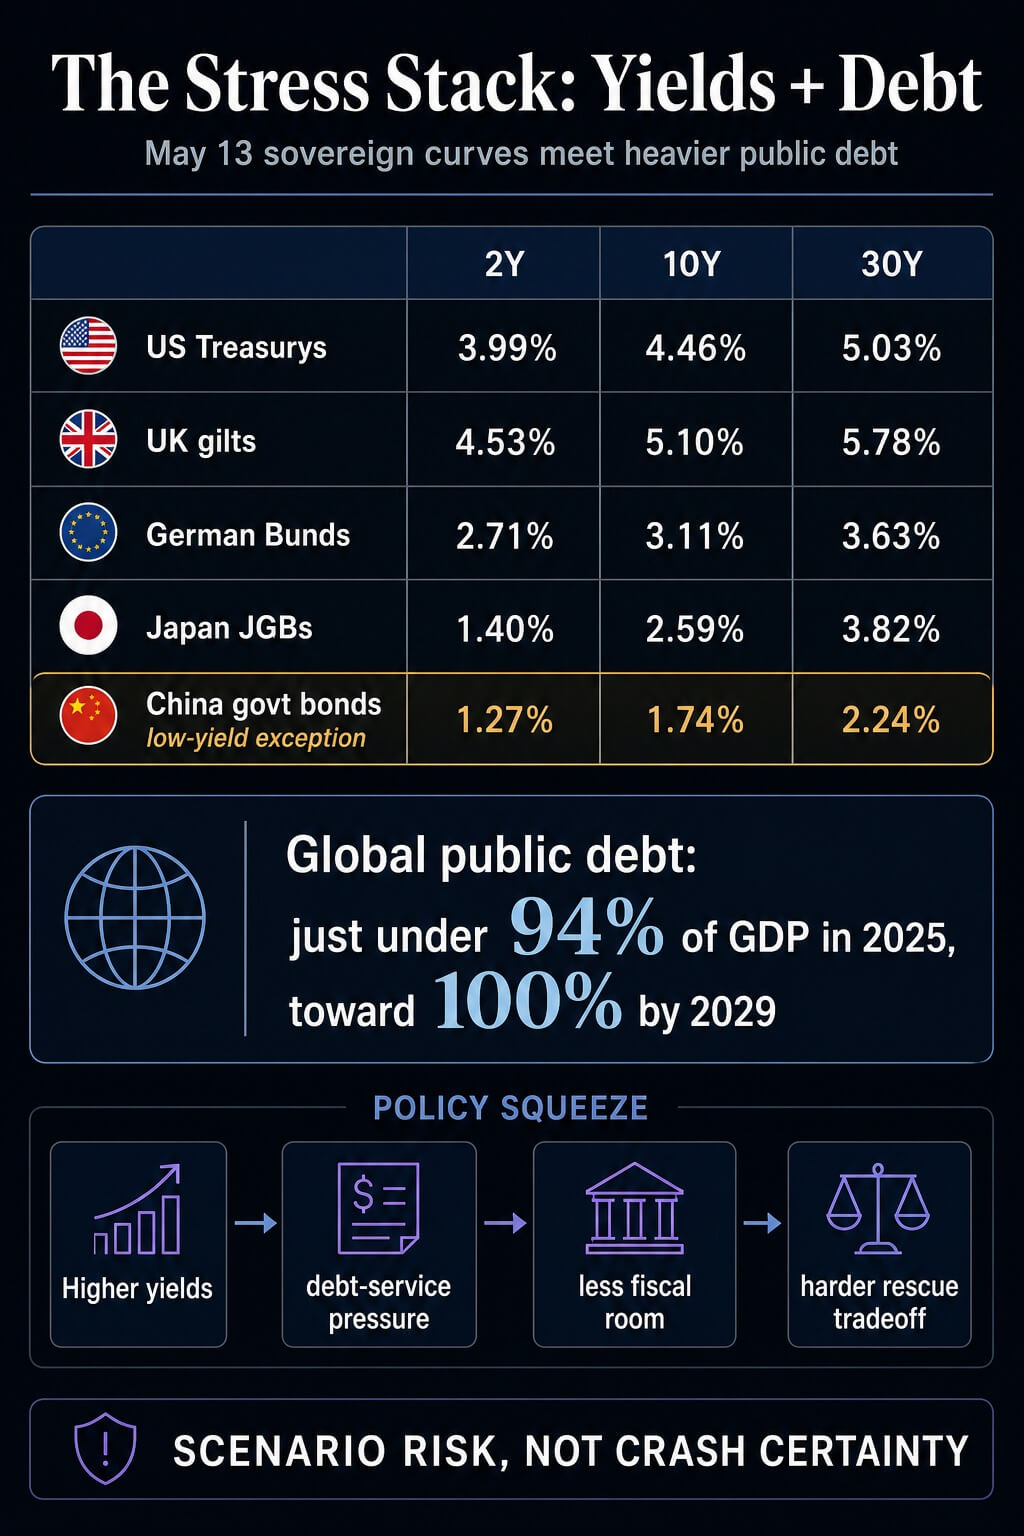
The developed-market side still carries the bigger fiscal problem. The OECD's 2026 debt work shows heavy sovereign borrowing and refinancing needs across its member economies.
Higher yields roll into auctions, coupon costs, and political choices over time. The longer the long end stays elevated, the more the market forces governments to choose between higher interest bills, reduced spending flexibility, and larger deficits.
In 2008, aggressive monetary rescue and balance-sheet support helped stabilize the financial system. In 2020, fiscal and monetary expansion bridged a sudden collapse in activity.
In 2026, the debt stock is bigger, long-end yields are higher, inflation risk is visible, and an energy shock is already inside the data.
Hormuz turns oil risk into policy risk
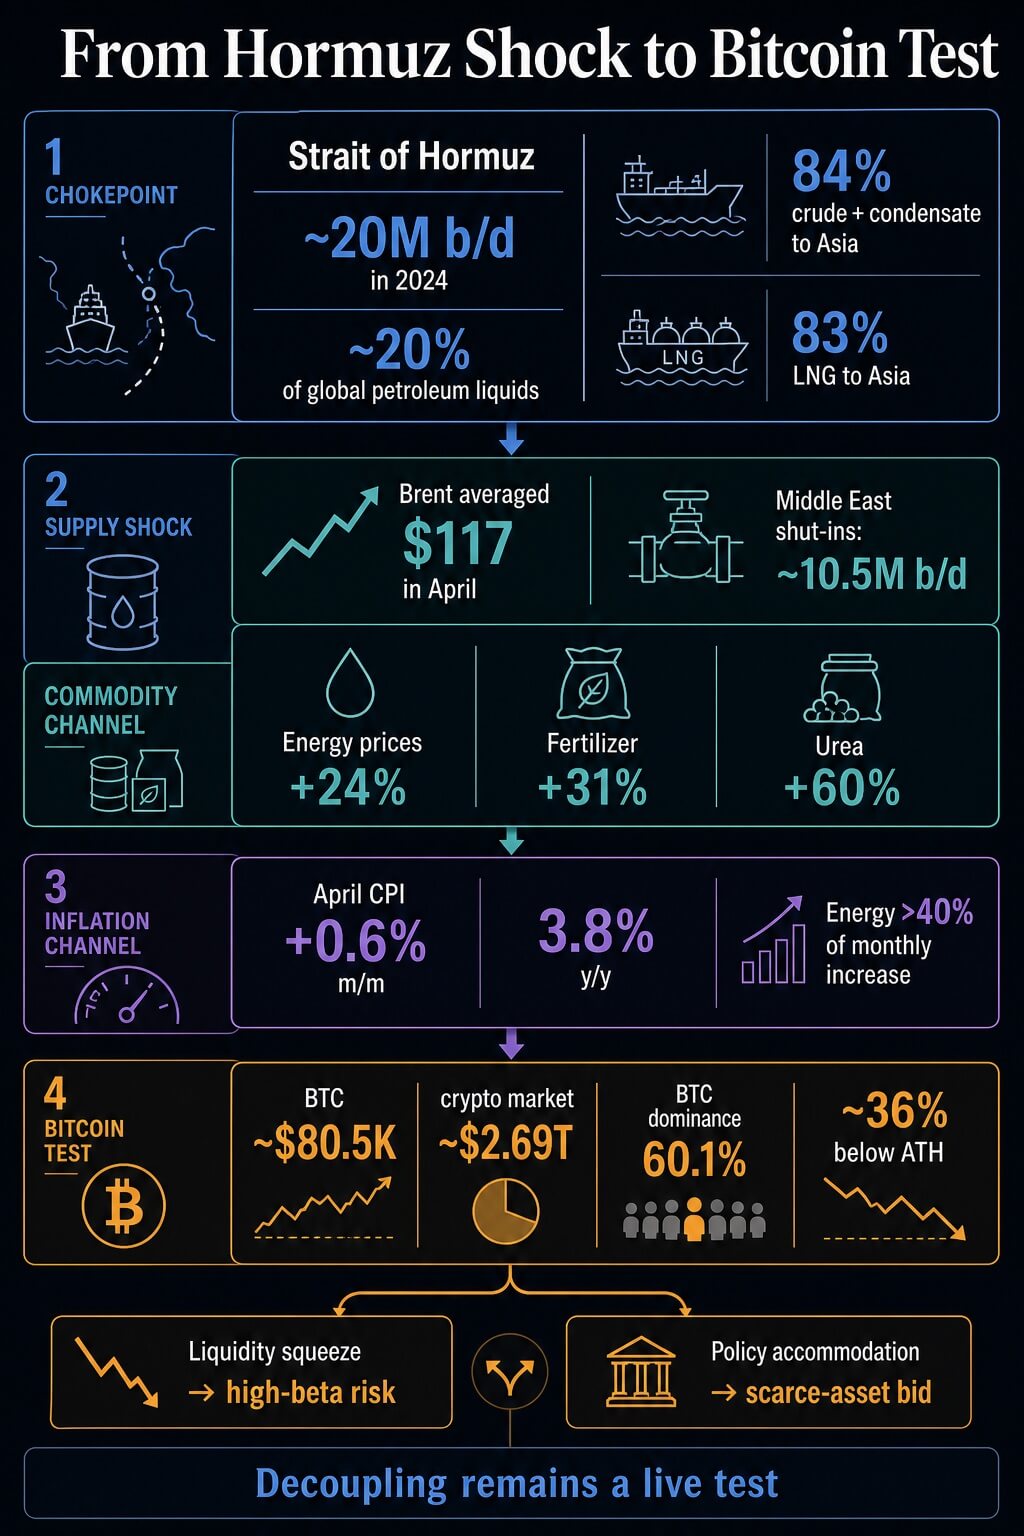
The Strait of Hormuz is the main pressure point because it turns a regional conflict into a global cost shock. The U.S. Energy Information Administration estimates that roughly 20 million barrels per day moved through the strait in 2024, equal to about 20% of global petroleum liquids consumption.
The agency also estimated that 84% of crude oil and condensate and 83% of LNG moving through Hormuz went to Asian markets that year.
The current shock has moved into official price and supply forecasts. In its May 2026 Short-Term Energy Outlook, the EIA described Hormuz as effectively closed to shipping traffic, said Brent averaged $117 per barrel in April, and assessed Middle East production shut-ins around 10.5 million barrels per day that month.
The agency assumes flows begin to resume from late May or early June, but that assumption is itself one of the live risk variables.
The World Bank's April Commodity Markets Outlook puts the macro channel in plain terms. Energy prices are projected to surge 24% this year, Brent is forecast at $86 per barrel in the baseline, and a severe-disruption scenario could push Brent as high as $115.
Fertilizer prices are projected to rise 31%, driven by a 60% jump in urea. The same report warns that higher commodity prices will lift inflation and weaken growth, especially in developing economies that already have limited fiscal buffers.
The U.S. data already show part of that pass-through. The Bureau of Labor Statistics said April CPI rose 0.6% on a seasonally adjusted monthly basis and 3.8% over the year before seasonal adjustment.
Energy accounted for more than 40% of the monthly increase.
That is the mechanism that makes the crash question credible. A shorter shock can still keep inflation expectations firm enough to slow rate cuts while debt-service costs continue to climb.
If growth weakens at the same time, the policy choice becomes ugly: defend inflation credibility or defend financial stability.

| Trigger | Transmission path | Release valve |
|---|---|---|
| Higher sovereign yields | Debt-service costs rise as governments refinance | Debt maturities stagger the impact over time |
| Hormuz disruption | Oil, LNG, fertilizer and shipping costs feed inflation | Rerouting, demand adjustment and resumed flows can soften the first shock |
| Sticky inflation | Central banks have less room to cut into market stress | Weak growth can still force accommodation later |
| High valuations and leverage | Risk assets have less margin for bad news | Bank and household balance sheets still show resilience |
| Bitcoin decoupling test | BTC either trades as scarce collateral or high-beta risk | Recent divergence is early and still needs confirmation |
Why markets have less policy support than before the global financial crisis
The equity-market tension is that risk assets can look calm even while the bond market is repricing the policy backdrop. The Fed's May Financial Stability Report said forward equity price-to-earnings ratios remained in the upper range of their historical distribution.
Corporate bond spreads were still low by longer-run standards. Hedge fund leverage remained near all-time highs and was concentrated among the largest funds.
That mix is a cushion problem. The same Fed report said market contacts most frequently cited geopolitical risks, an oil shock, private credit, and persistent inflation as salient risks to financial stability.
The FSB made a similar point in April, saying the Middle East conflict had already created a substantial global economic shock, with market reactions visible in energy prices and government bond yields.
That is the collision investors have to watch across policy meetings, auctions, and liquidity conditions. Markets can absorb high rates when growth is strong, inflation is falling, and fiscal financing looks manageable.
They can absorb oil shocks when central banks can look through the price spike. They can absorb high public debt when borrowing costs are pinned down. The current setup weakens each cushion at once.
A crash becomes a reasonable worst case if the sequence tightens: Hormuz keeps energy and fertilizer prices high; inflation remains sticky; central banks delay support; long-end yields stay elevated; debt-service pressure grows; risk assets that had priced a soft landing reprice toward weaker growth and tighter liquidity.
A calmer path is also possible. If oil flows normalize, inflation eases, real yields soften, and central banks can pivot toward growth support, the stress stack breaks before it becomes systemic. That framing is conditional fragility.
That distinction is critical for market timing. Sovereign stress tends to build through auctions, refinancing calendars, credit spreads, equity multiples, and central-bank decisions. It rarely announces itself through one clean trigger.
That gives markets time to adapt, but it also means pressure can keep accumulating after the first oil-price spike fades. A soft-landing trade can survive one shock; the harder test is whether it survives several at once, with each channel limiting the policy answer to the next.
Bitcoin becomes the macro test during global financial crisis fears
Bitcoin sits at the end of this chain because it is now part of the macro read.
Bitcoin traded around $80,500 on May 13, before hot PPI pushed it below $80,000, while the broader crypto market stood at around $2.69 trillion, and BTC dominance held at around 60.1%.
That leaves it still large enough to be a macro asset, while its volatility keeps it outside clean-shelter status.
Recent CryptoSlate coverage has noted windows when Bitcoin moved differently from U.S. equities amid oil, yield, and dollar pressure on stocks. Another CryptoSlate analysis framed the Hormuz shock as a fork for Bitcoin: either a liquidity squeeze that drags BTC back into high-beta collateral behavior, or a policy-accommodation path that revives the scarce-asset trade.
That is the sober way to treat Bitcoin here. Bitcoin's record as a stable inflation hedge remains unproven. Its separation from risk appetite remains incomplete.
Glassnode's latest market pulse supports caution: improving structure still needs confirmation amid macro pressure from rates, oil, and liquidity.
A single bad equity session tells little. The test is whether Bitcoin can hold up if stocks sell off, yields stay high, the dollar firms, and central banks hesitate to ease because inflation is still being fed by energy and food costs.
If BTC holds that environment, the monetary-disorder narrative gets stronger. If it fails, the market will have treated it as another risk asset with better branding.
That leaves the crash question with a practical answer. A 2008 replay remains an outside possibility, and the claim of inevitability is too strong.
However, the current setup is more fragile because the public debt load is heavier, the inflation shock is real, and the policy response is more constrained.
One price chart will tell only part of the story; the policy choice will carry the bigger signal. If central banks prioritize inflation control while oil and debt-service costs keep rising, financial markets will face greater stress without a rescue.
If they shift toward financial stability, Bitcoin faces its clearest test as a hedge against policy accommodation and currency-credibility risk.
Either way, the question has moved from alarmism to risk management. What pulls it back from the brink is that several release valves still exist:
- The shock is conditional. If Hormuz flows resume and oil normalizes, the inflation impulse weakens.
- Debt stress rolls through time. Refinancing calendars stagger the hit rather than forcing one immediate rupture.
- Balance sheets are stronger than 2008. The piece cites resilience in banks and households, which limits direct GFC-style contagion.
- Central banks still have optionality. They are constrained by inflation, but weak growth or market stress can still force accommodation later.
- Markets have warning indicators. Auctions, long-end yields, credit spreads, liquidity, equity multiples, and BTC’s behavior give a sequence to monitor.
The post Global financial crisis fears grow as bond yields hit 1998 levels and Bitcoin drops below $80,000 appeared first on CryptoSlate.
XRP is rising into a market split between traditional finance infrastructure and crypto-native skepticism.
According to CryptoSlate's data, the token recently traded above $1.46 as spot-market indicators improved, exchange-traded funds drew their strongest daily inflows in more than four months, and Ripple expanded the credit capacity behind its institutional prime brokerage business.
However, this came at a time when derivatives traders continue to lean against the move, with Binance futures data showing persistent selling pressure even as leverage rebuilds across major exchanges.
That tension has turned XRP into a test case for whether institutional access, ledger utility, and market infrastructure can overpower a futures market still positioned for weakness.
Spot demand meets futures resistance
The divide between spot demand and derivatives positioning has become the clearest feature of XRP’s market structure.
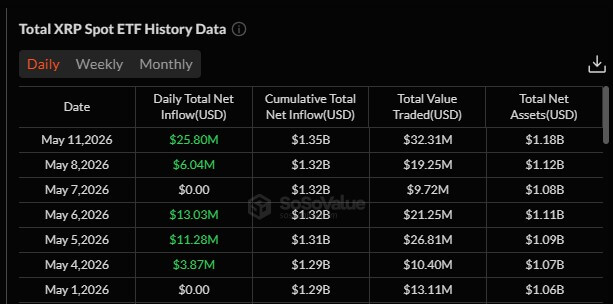
US spot XRP ETFs recorded $25.8 million in net inflows on May 11, their largest daily intake since early January, SoSoValue data show.
This extends the four funds' positive performance this month, attracting more than $60 million in inflows. XRP-focused funds have registered total inflows of over $1.35 billion since their launch last year.
Those inflows give XRP a regulated channel at a time when exchange-based positioning remains conflicted. ETFs allow investors to gain exposure through brokerage accounts and adviser platforms without managing direct custody or trading on crypto exchanges.
That opens the asset to a wider pool of allocators than the offshore derivatives venues that have historically shaped much of XRP’s short-term price action.
However, the mood in the derivatives market is different.
CryptoQuant data show that the Binance perpetual cumulative volume delta has fallen to about -$434 million, even as XRP has pushed higher. Open interest on Binance has climbed from about 207 million XRP on April 30 to nearly 232 million, showing leverage is returning after the latest reset.
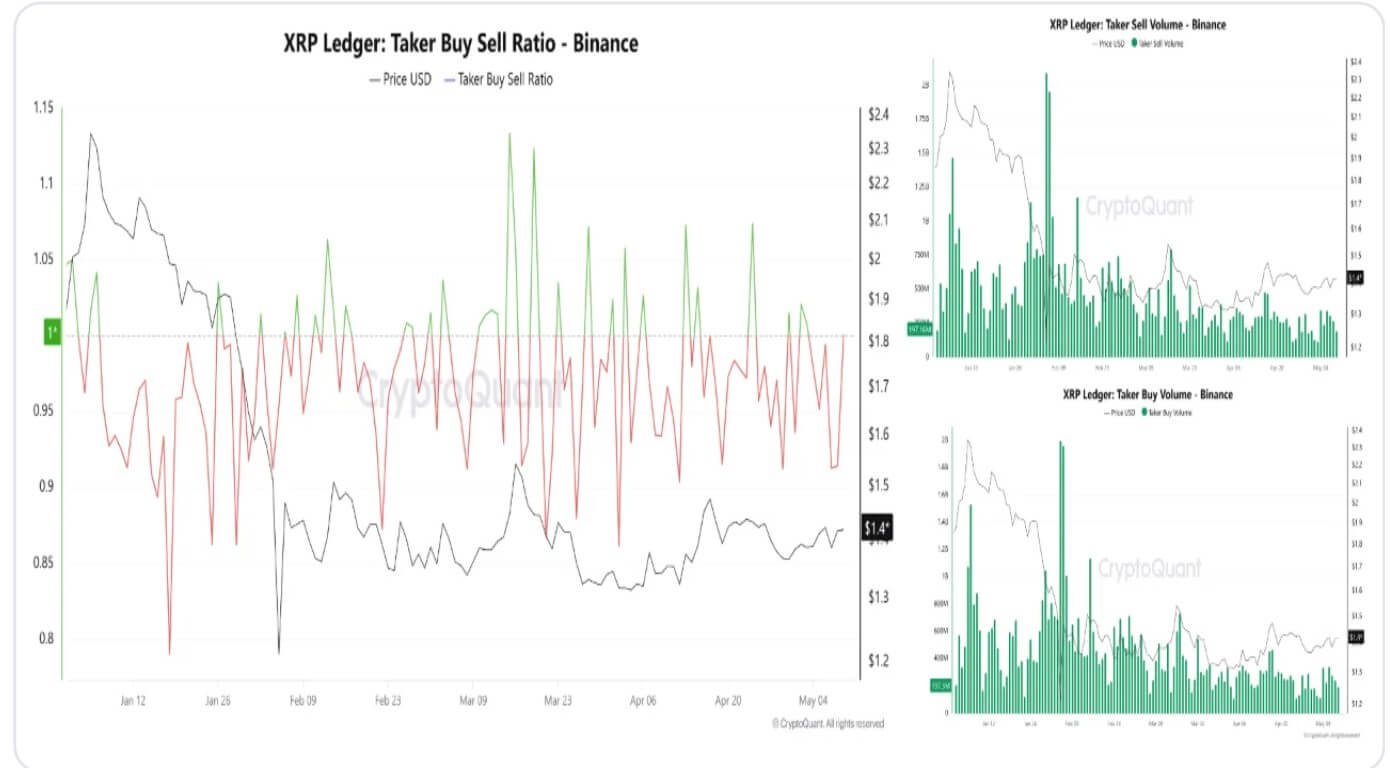
The increase is not limited to Binance. On May 11, open interest rose by about $18 million on Binance, $10.4 million on OKX, and $8.5 million on Bybit, adding almost $36.9 million across the three exchanges.
Ordinarily, rising open interest can confirm a stronger trend when spot demand is also expanding.
However, XRP’s setup is more complicated. Spot estimated cumulative volume delta across centralized exchanges has slipped to about $575 million, even as the token trades higher.
That suggests the rally is not yet being driven by broad, clean spot accumulation.
Notably, XRP funding rates point to the same tension. XRP funding on Binance has carried a bearish bias for nearly three months, CryptoQuant data show, even as the token has gained roughly 27% over the same period.
This negative funding means shorts are paying longs to keep bearish exposure open.
Ripple adds Wall Street credit to the ecosystem
This bearish futures positioning is running headlong into a massive institutional buildout around Ripple.
On May 11, Ripple announced that it had secured a $200 million asset-backed debt facility from funds managed by Neuberger Specialty Finance, the dedicated asset-based investment team within Neuberger.
The firm said the facility would support Ripple Prime's continued growth amid increasing demand for “institutional-grade prime services and margin financing solutions.” The facility is backed by Ripple Prime’s institutional loan portfolio and structured for flexible drawdowns.
Noel Kimmel, president of Ripple Prime, said:
“Dependable access to financing and balance sheet strength are critical to institutional participants in today’s dynamic markets. This facility enables us to grow alongside our clients by delivering increased margin capacity, greater responsiveness, and improved capital efficiency.”
Ripple acquired Hidden Road last year and later rebranded it as Ripple Prime. The Brad Garlinghouse-led company revealed that the brokerage platform's revenue has tripled, driven by “sustained growth in client activity and demand for its prime services.”
Against this backdrop, this new credit facility fundamentally strengthens the market structure surrounding the Ripple ecosystem. Institutions require robust financing, custody, settlement certainty, and reliable counterparties before deploying capital at scale.
By embedding XRP and RLUSD within this broader institutional stack, Ripple is positioning itself directly against heavyweight service providers.
XRPL upgrades lead to increased activity on the ledger
Ripple’s corporate expansion is unfolding alongside a technical buildout of the XRP Ledger (XRPL) that is beginning to show up in network activity.
Over the past several months, the blockchain network developers have added features to meet the needs of regulated financial institutions.
The upgrades are designed to give banks, asset managers, and payment firms the controls they need to use public blockchain infrastructure without sacrificing compliance, privacy, settlement certainty, or auditability.
The new tools include Multi-Purpose Tokens (MPT), which allow issuers to embed compliance features into tokenized assets. Other upgrades, including Permissioned Domains and Permissioned DEX, are designed to create more controlled trading environments.
Additionally, the network recently implemented the Token Escrow feature, which extends escrow functionality beyond XRP to issued currencies, laying the foundation for on-chain delivery-versus-payment settlement.
Meanwhile, the ledger’s development roadmap also includes native lending markets and privacy-focused Smart Escrows.
Together, those changes point to a network being adapted for institutions that want the speed and transparency of shared blockchain rails, but still require permissioning, risk controls, and confidentiality.
Unsurprisingly, that institutional thesis is beginning to find support in ledger activity and institutional adoption.
Last week, Ripple piloted the cross-border redemption of a tokenized US Treasury fund alongside JPMorgan, Mastercard, and Ondo Finance on the XRPL.
Evernorth, an XRP-focused treasury firm, argued that these institutional activities, alongside rising retail adoption, contributed to XRP transaction activity increasing 65% over the past 12 months to 71 million.
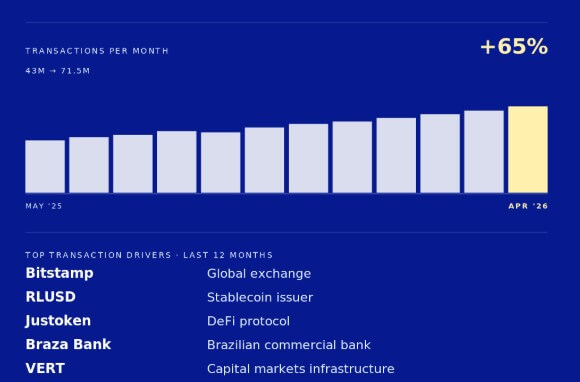
According to the firm, these activities were driven by Bitstamp, Ripple’s RLUSD stablecoin, Justoken, Braza Bank, and VERT.
It stated:
“Speculative volume on a blockchain comes in bursts. Real utility looks different. Steady. Programmatic. Tied to real businesses moving real money.”
What's next for the XRP price?
Considering the above, XRP’s near-term trajectory ultimately hinges on whether spot demand can translate this institutional progress into sustained buying pressure.
If ETF inflows persist, the spot cumulative volume delta improves, and the taker buy-sell ratio remains above parity, the heavily bearish derivatives positioning could backfire, triggering a wave of forced buying.
In that scenario, negative funding and climbing open interest would act as rocket fuel for an XRP rally toward the $1.50 to $1.60 range.
Conversely, if spot demand falters, that same leverage leaves XRP highly vulnerable to a sharp reversal.
A market propped up by rising open interest without underlying spot support can unwind violently, particularly when traders are deeply divided near a contested price range.
This dynamic makes the current market setup less about a single upcoming catalyst and more about a fundamental regime change.
Ultimately, XRP is transitioning from an asset dominated by offshore exchange speculation to one defined by ETFs, institutional credit, ledger utility, and tokenized-asset infrastructure.
The post Wall Street is buying XRP while Binance traders keep betting against it appeared first on CryptoSlate.
Prediction markets have been growing fast, from crypto price bets to election forecasting and sports outcomes. But there's a persistent problem most platforms don't address: users are essentially guessing.
They pick a side based on gut feeling, social media noise, or whatever narrative feels convincing in the moment. Poly Truth is attempting to solve that. Rather than just giving people a place to bet on outcomes, it positions itself as an intelligence layer sitting on top of prediction markets, one that tells you which side the data actually supports. You can explore the project directly on the $PTRUE Coin official website.
The project is currently in presale with its native $PTRUE token, and it's worth understanding what the system actually does before looking at the token economics.
What Is Poly Truth?
Poly Truth is a prediction market intelligence tool. That distinction matters: it's not a trading bot, not a prediction platform itself, and not an automated system that places positions on your behalf. The core idea is to give users data-backed probability analysis on active prediction events, whether those events involve sports results, political races, crypto price movements, or any other outcome-based market.
Think of it like having a research analyst who, instead of giving you a tip, walks you through the reasoning: here's what the data shows, here's the probability each outcome occurs, and here's why. Users still make their own decisions; Poly Truth just gives them more to work with.
How the Poly Truth System Works
The project explains its process through a three-part framework it calls its “characters.” It's a useful framing for understanding how data moves through the system.
The Runners are automated bots that continuously scrape data across the internet (news, odds movements, historical patterns, social sentiment), focused on whatever prediction events are currently active. They're the data collection layer, running in the background without user involvement.
The Starlet is the AI analyst component. Once the Runners pull in raw data, The Starlet cross-references sources, identifies patterns, and produces probability scores. This is where the intelligence layer actually sits: it's not simply aggregating data but interpreting it to determine which outcome has stronger statistical backing.
The Presenter is what users see. It delivers the final output: which events have meaningful data behind them, what the probability breakdown looks like, and the reasoning that led to those numbers.
The flow is clean: collect → analyze → present. Whether the AI analysis proves consistently accurate in live conditions is something that will only be tested over time, but the architecture is logically sound for what it's trying to do.
What Markets Does Poly Truth Cover?
The system is designed to work across several categories of prediction events:
- Sports: match outcomes, player performance, tournament results
- Politics: elections, policy decisions, geopolitical events
- Crypto: price movement predictions, project milestone outcomes
- General events: any outcome-based market with sufficient data to analyze
The breadth of coverage is worth noting. Most prediction market tools that incorporate AI tend to focus narrowly on one vertical. Poly Truth's multi-market approach means The Runners need to scrape and contextualize very different data types depending on the event category, which is a more complex engineering challenge but also a wider potential use case if executed well.
The $PTRUE Token: Key Details
PTRUE is the native token of the Poly Truth ecosystem, currently available in presale. Here's a breakdown of the core numbers:
| Detail | Figures |
|---|---|
| Total Supply | 11.5 billion tokens |
| Presale Price | $0.001190 |
| Blockchain | Ethereum |
| Staking APY | 4,452% |
| Payment Options | ETH, BNB, SOL, USDT, USDC, Card, SEPA |
Token Distribution:
- Presale: 40%
- Liquidity: 17%
- Development: 13%
- Team: 10%
- Staking: 10%
- Marketing: 8%
- Community/Airdrops: 2%
The 40% presale allocation is substantial, which means a significant portion of the total supply is being distributed early. The staking APY of 1,346% is an eye-catching figure — high staking yields are common in early-stage crypto projects as a mechanism to reduce circulating supply and reward early participants, but they are also inherently unsustainable at that rate long-term. Anyone considering staking should factor in how yield rates typically compress as a project matures and token supply dynamics shift.
The payment flexibility is genuinely broad for a presale; accepting ETH, BNB, SOL, stablecoins, card, and SEPA means the project is trying to reduce friction for buyers coming from different ecosystems. Full presale details are available on the PolyTruth platform.
How to Buy $PTRUE in the Presale
The process is straightforward:
- Visit the official Poly Truth website and connect a compatible wallet (MetaMask or similar)
- Select your preferred payment method — ETH, BNB, SOL, USDT, USDC, card, or SEPA
- Enter the amount you want to purchase
- Confirm the transaction
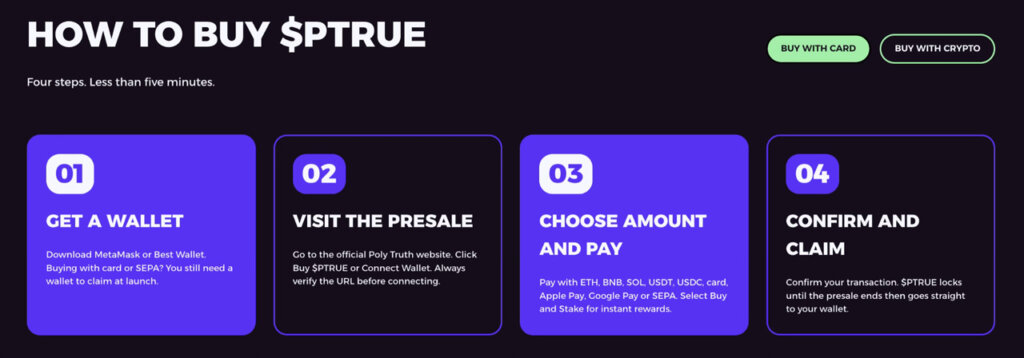
Since the contract is deployed on Ethereum, buyers using ETH will want to account for gas fees. Those paying with BNB or SOL will likely have lower transaction costs, though the mechanics of cross-chain purchases should be reviewed on the site before committing.
Who Is Poly Truth Actually For?
The most natural audience is people already active in prediction markets who want a research edge. If you're regularly using platforms like Polymarket or similar and making judgment calls based on partial information, a tool that systematically aggregates and scores probability data could be genuinely useful.
It's less directly relevant to passive crypto investors who aren't engaging with prediction markets at all. The token itself offers staking, but the utility case is tied to using the intelligence tool rather than simply holding.
The project sits in an interesting space; prediction markets have seen real growth in visibility and volume over the past few years, and AI-powered analysis layered on top of that trend is a logical product direction. Whether Poly Truth's implementation delivers on that concept is the question any prospective user or token buyer should be asking.
Final Thoughts
Poly Truth is a focused concept, not one trying to be everything, but one specifically targeting the information gap in prediction market participation. The three-part system (Runners, Starlet, Presenter) gives it a clear product identity, and the multi-market coverage broadens its potential reach beyond any single niche.
As with any presale-stage project, the gap between concept and working product is where real evaluation happens. The architecture makes sense on paper; live performance across diverse event categories will be the real test. Anyone wanting to dig into the details, review the smart contract, or participate in the presale can learn more on the Poly Truth coin website.
Disclaimer: This is a sponsored post. CryptoSlate does not endorse any of the projects mentioned in this article. Investors are encouraged to perform necessary due diligence.
The post How to Buy Poly Truth ($PTRUE): The AI Prediction Market Tool Explained appeared first on CryptoSlate.
The Senate Banking Committee’s crypto market structure bill is heading into CLARITY Act markup with more than 100 proposed amendments.
This is turning a long-delayed vote on the CLARITY Act into a test of whether a fragile stablecoin compromise can survive pressure from banks, Democrats, and crypto industry groups.
The final number of amendments has not been formally confirmed. However, the current markup amendment proposal puts it in the same range as the January effort, when 137 amendments were submitted before a planned committee vote was scrapped.
The size of the amendment pile underscores how unsettled the bill remains even after months of negotiations.
Banks force stablecoin rewards vote
The most consequential fight is over stablecoin rewards, the issue that helped stall earlier negotiations and now threatens to reopen the divide between crypto companies and the banking industry.
The Senate compromise would prohibit rewards on idle stablecoin holdings when those rewards resemble interest on bank deposits. It would still allow incentives tied to other stablecoin activity, such as payments or transactions.
That distinction was designed to keep stablecoins from becoming deposit substitutes while allowing firms to reward usage rather than passive balances.
Banks say the language does not go far enough. Their concern is that crypto exchanges and other intermediaries could structure rewards around stablecoin activity in ways that still pull deposits away from insured banks.
Banking groups have pushed senators to close what they view as a loophole and to prevent stablecoin issuers or affiliates from offering yield-like incentives that compete with bank accounts.
Sens. Jack Reed and Tina Smith reportedly filed an amendment to tighten that standard.
Their proposal would target rewards that are “substantially similar” to deposit interest, a formulation that could give regulators more room to block incentive programs that banks see as functionally equivalent to yield.
That amendment could become one of the clearest votes of the markup. Supporting it would move the bill closer to the banking industry’s position. Opposing it would preserve the Tillis-led compromise and signal that committee members are unwilling to use the market structure bill to further restrict stablecoin incentives.
The lobbying campaign around the provision has already intensified. Stand With Crypto, the Coinbase-backed advocacy group, said banking lobbyists sent 8,000 letters seeking to stop stablecoin rewards.
The group said its own advocates made 8,000 calls and sent 300,000 emails in recent months, and that supporters have contacted lawmakers almost 1.5 million times in favor of CLARITY.
On the other hand, traditional finance leaders are actively maintaining the pressure to ensure the amendment's success.
Lorrie Trogden, president and CEO of the Arkansas Bankers Association, recently issued a public call to action. On X, she urged banking industry members to make their voices heard ahead of the Thursday markup.
These efforts reflect an unusually visible outside campaign for a committee markup. They also show how a technical debate over reward language has become a proxy fight over whether banks or crypto platforms will control the next layer of dollar-based payments.
Warren pushes ethics and Fed access limits
Meanwhile, the stablecoin fight is not the only pressure point Democrats are bringing into the markup.
Crypto skeptic Sen. Elizabeth Warren has reportedly filed more than 40 amendments, the largest individual batch among committee members.
Her proposals target several parts of the bill, but one of the most significant would prevent the Federal Reserve from granting master accounts to crypto companies.
A Fed master account gives an eligible institution direct access to the central bank’s payment rails.
Crypto firms have long sought clearer paths into the banking system, while regulators and banks have warned that granting direct access to novel financial firms could create new supervisory and stability risks.
Warren’s amendment would put that fight directly into the CLARITY Act debate. If adopted, it would limit crypto companies' ability to use the market structure bill as a path to deeper integration with the Fed’s core payment infrastructure.
Notably, banking associations such as the Independent Community Bankers of America (ICBA) previously criticized the Federal Reserve Bank of Kansas City’s approval of a master account for the crypto exchange Kraken.
According to the group:
“Granting nonbank entities and crypto institutions access to the master accounts poses risks to the banking system.”
Meanwhile, Warren is also pressing the ethics argument that has become central to Democratic resistance.
The lawmaker has said that new crypto legislation should not move through the Banking Committee without stronger guardrails to address conflicts of interest involving President Donald Trump and his family’s crypto ventures.
That line of attack gives Democrats a broader political frame than just investor protection. It links the bill to concerns that public officials could benefit from policies that expand the digital asset market, especially if the legislation leaves gaps around affiliated projects, stablecoin activity or token holdings connected to political figures.
The ethics push complicates the Republican case for speed. Supporters argue the bill is needed to end regulatory uncertainty.
Warren and other skeptics argue that speed without additional safeguards could entrench conflicts before Congress has built a durable oversight framework.
DeFi and legal tender amendments widen the fight
Other Democratic amendments would expand the debate beyond stablecoins and ethics into the structure of decentralized finance and the legal status of crypto assets.
Sen. Mark Warner filed an amendment that would overhaul the bill’s decentralized finance provisions.
The latest CLARITY Act text attempts to define when a protocol is sufficiently decentralized and when an operator, platform, or intermediary should face bank-like compliance obligations.
That section is among the most technically sensitive parts of the bill because it determines whether some DeFi systems can operate outside traditional intermediary rules or must comply with reporting, monitoring, and anti-money laundering requirements.
Warner’s amendment signals that some Democrats remain uncomfortable with the bill’s treatment of DeFi.
Their concern is that broad exemptions for decentralized protocols could allow firms to avoid oversight by claiming that no central entity controls the system.
Crypto developers counter that rules built for custodial intermediaries cannot be applied cleanly to open-source protocols without forcing some projects offshore or shutting them down.
Reed also filed a separate amendment that would prohibit cryptocurrencies from being used as legal tender, including for tax payments.
That proposal would push against efforts by some crypto-friendly lawmakers to give Bitcoin or other digital assets a more formal role in public payments.
Together, the DeFi and legal tender amendments show that the impending markup will not be limited to one banking dispute.
Senators will also be asked to decide how much autonomy decentralized systems should have, how far crypto assets should be allowed to enter public finance, and whether the bill gives regulators sufficient authority to police risks across the market.
Crypto industry urges senators to hold the line
Despite all of these pressures, crypto industry groups are urging the committee to move the CLARITY Act forward without amendments that would weaken the compromise.
On X, the Blockchain Association and Crypto Council for Innovation have called the markup a defining moment for US leadership in financial technology.
Their argument is that the bill would replace fragmented enforcement-driven oversight with a statutory framework that lets companies build in the US under clearer rules.
Stand With Crypto has taken a more direct political approach, framing the bank-backed push against stablecoin rewards as an attempt to protect incumbents from competition.
The group’s campaign is aimed at showing senators that crypto supporters are organized enough to match the pressure coming from banks and trade associations.
For pro-crypto lawmakers, the challenge is holding together a coalition broad enough to get the bill out of committee while preserving language that can survive the Senate floor.
Republicans control the committee, but the broader bill will still need Democratic support to clear the broader Senate floor. That makes the markup both a policy negotiation and an early vote-counting exercise.
The post CLARITY Act faces 100+ amendments as bankers send 8,000 demand letters against stablecoin rewards appeared first on CryptoSlate.
Cryptoticker
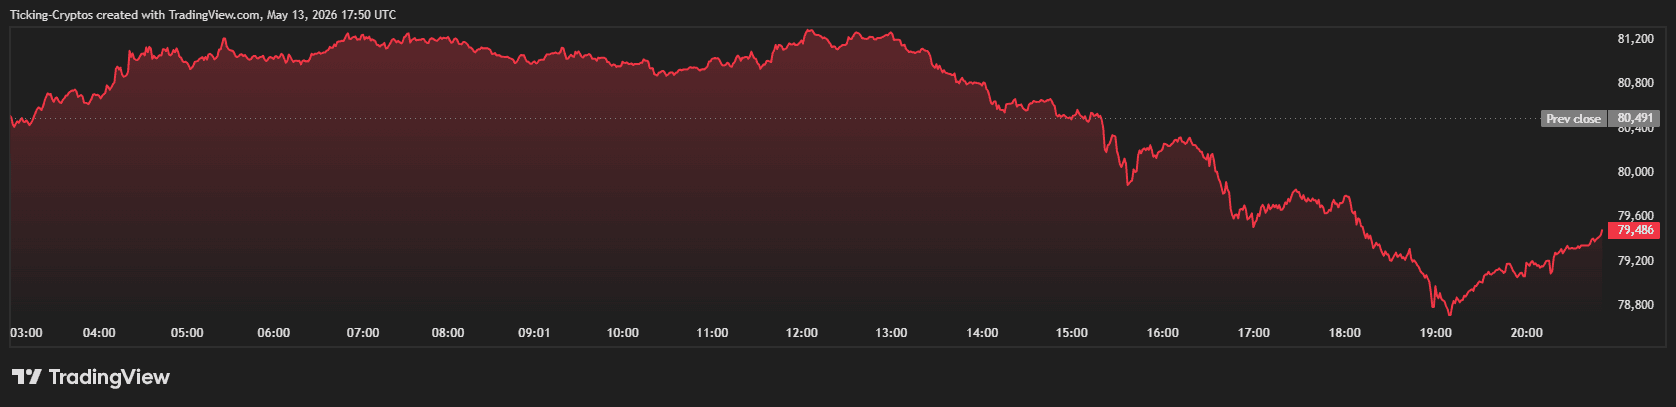
The digital asset market has been hit by a wave of intense volatility, leaving traders and long-term holders in a state of shock. After a period of bullish consolidation where Bitcoin ($BTC) appeared to be building a base for a six-figure run, the tide has turned. Today, the leading cryptocurrency plummeted below the psychological $80,000 mark, dragging the rest of the market, including Ethereum ($ETH), down with it.
Bitcoin Price Crash Today
Bitcoin is currently trading at approximately $79,100, having officially lost the $80,000 support level that bulls defended for weeks. This 5% intraday drop has triggered over $300 million in liquidations, primarily affecting over-leveraged long positions. The sudden move has shifted market sentiment from "Greed" to "Fear" almost instantly.
Why did Bitcoin Price Crash?
The primary catalyst for today's market crash is the release of the U.S. Producer Price Index (PPI) for April 2026. The data, published this morning by the Bureau of Labor Statistics, revealed that wholesale inflation is surging at its fastest pace in years.
The PPI Shock by the Numbers
- Headline PPI: Increased by 1.4% month-over-month, vastly exceeding the 0.5% forecast.
- Year-over-Year PPI: Hit 6.0%, the highest level in 3.5 years (since late 2022).
- Core PPI (ex-food & energy): Jumped 1.0% MoM, signaling that inflation is broad-based and not just tied to volatile sectors.
A significant driver of this spike was a 15.6% surge in gasoline prices and a 7.8% rise in energy goods, largely due to the escalating geopolitical tensions in the Middle East affecting global supply chains.
Why High PPI Destroys the Crypto Narrative
Bitcoin is often touted as an "inflation hedge," but in practice, it behaves as a high-beta liquidity asset. When the US PPI comes in this high, it forces the Federal Reserve to maintain a hawkish stance.
The market is now pricing in a "higher-for-longer" interest rate environment. Higher rates make the US Dollar stronger and Treasury yields more attractive, which naturally sucks liquidity out of risk assets like Bitcoin and Ethereum.
Technical Analysis: Is $75k the Next Stop?
From a technical perspective, the Bitcoin kurs has broken below its 50-day Exponential Moving Average (EMA). This is a major bearish signal for swing traders.
- Crucial Resistance: For any hope of a recovery, BTC must reclaim $80,500 on the daily candle.
- Support Levels: The next major "liquidity pocket" is located at $75,000. If the selling pressure continues, analysts expect a rapid descent to this level as stop-losses are triggered.
- Ethereum Impact: ETH cours has also broken its support at $2,275, currently eyeing the $2,100 zone.
To manage the current volatility, many investors are moving their funds to safety. You can compare the most secure storage options in our hardware wallets comparison or look for exchanges with higher liquidity on our exchange comparison page.
As of May 13, 2026, PEPE remains a central figure in the meme coin landscape. While many expected the "frog" to fade into obscurity, it has maintained a significant market presence. However, the 2026 market is vastly different from the speculative frenzy of years past. With $Bitcoin dominance rising to over 58.5%, the question for retail investors is simple: Is PEPE a hidden gem or a falling knife?
Is PEPE Worth Buying?
Currently trading at $0.00000418, PEPE is in a "make or break" consolidation phase.
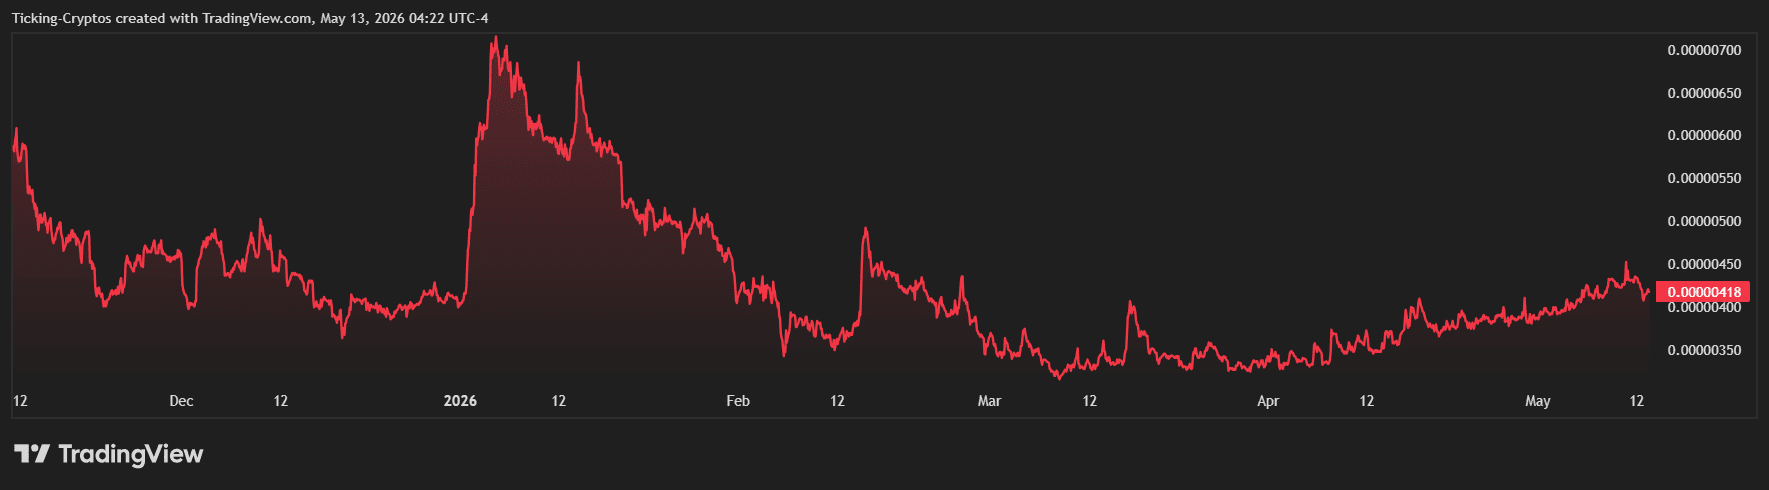
- The Bull Case: If PEPE breaks the current descending resistance, it could target $0.00000580 in the short term.
- The Bear Case: Analysts warn that if support at $0.00000304 fails, PEPE could see a further 23% drop by mid-May.
For those seeking high-risk, high-reward plays, PEPE is still "worth it" as a speculative tool, but it is no longer the "easy money" it was during its inception.
PEPE as a High-Beta Asset
In 2026, professional traders treat PEPE as a High-Beta asset. This means PEPE tends to move in the same direction as Bitcoin but with much greater intensity. When the market is "Risk-On," PEPE outperforms; when the market consolidates—as it is doing now in May 2026—PEPE often bleeds value faster than major coins.
Performance Comparison: PEPE vs. The Giants
To determine if PEPE is worth buying, we must look at how it stacks up against the "Serious" assets in May 2026.
| Asset | Price (May 13, 2026) | Market Outlook | Risk Level |
|---|---|---|---|
| Bitcoin (BTC) | $81,016 | Consolidating (Dominance up) | Low |
| Ethereum (ETH) | $2,301 | Bearish Momentum | Medium |
| XRP | $1.46 | Neutral / Regulatory Stability | Medium |
| PEPE | $0.00000418 | Neutral / Speculative | High |
PEPE vs. Bitcoin (BTC)
Bitcoin is currently the preferred choice for institutional capital, with funds flowing back into BTC as altcoins struggle. PEPE is only a superior buy if you anticipate a massive retail surge that lowers Bitcoin's dominance.
PEPE vs. XRP
XRP has found a floor at $1.40, backed by its utility in cross-border payments. PEPE lacks this fundamental "floor," making it more susceptible to total retracements if community interest dips.
PEPE Price Analysis: Key Levels for PEPE Coin
The weekly chart shows a tightening wedge. The RSI is at 45.02, which is firmly in "no man's land."
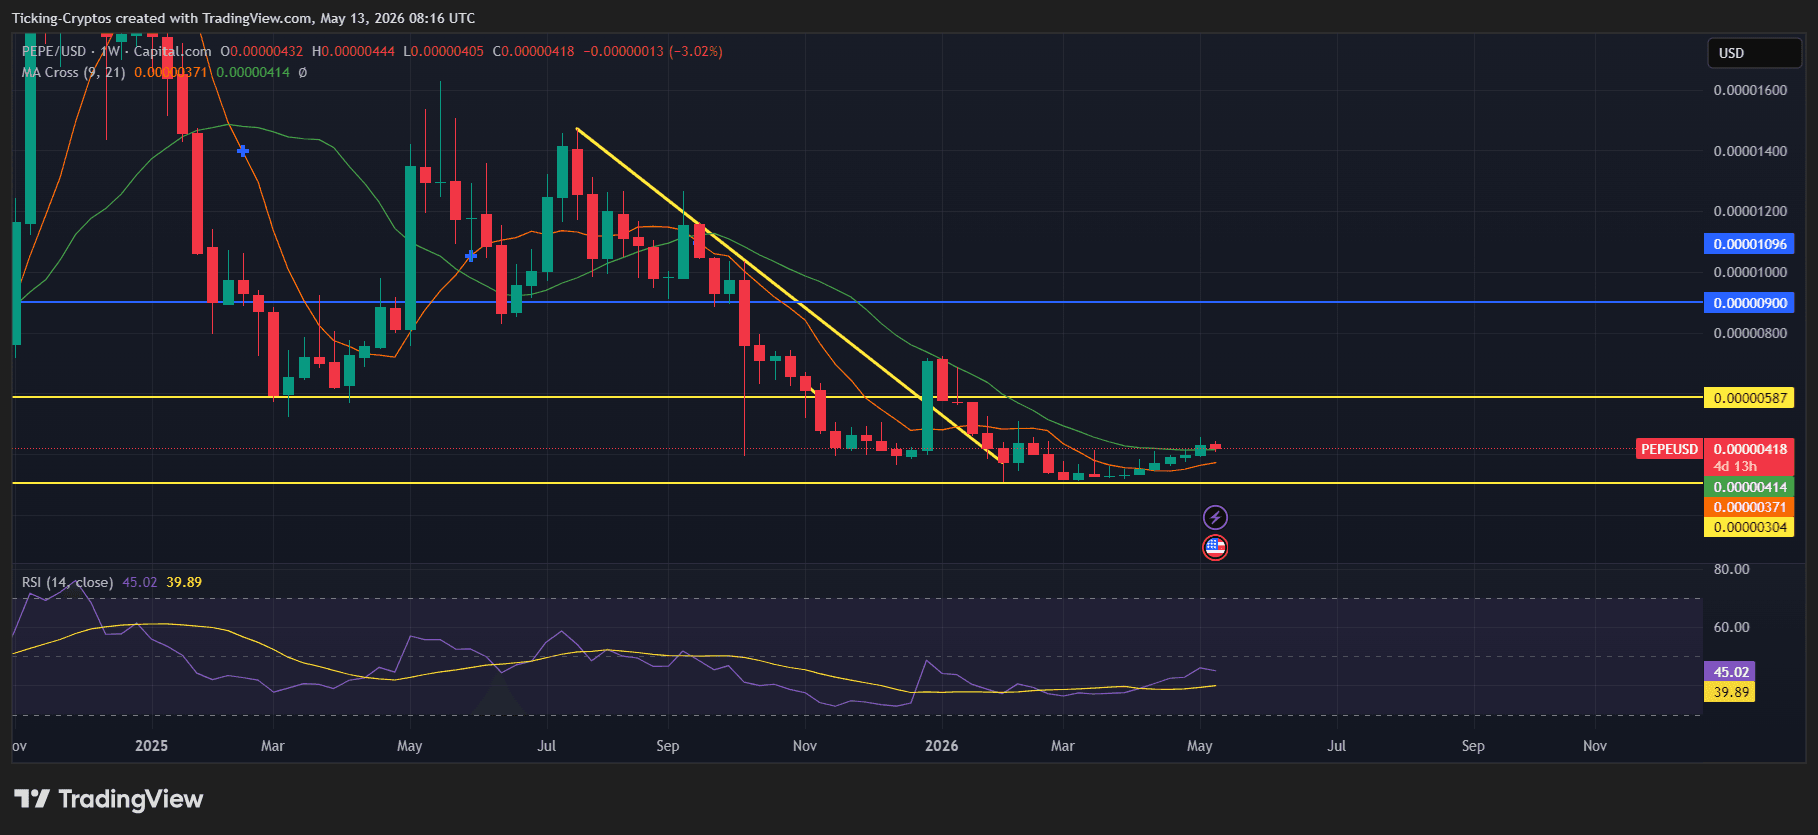
Key Support and Resistance
- Resistance ($0.00000479 - $0.00000592): PEPE has failed to break this level four times in 2026. A daily close above this is the primary "Buy" signal for trend followers.
- Support ($0.00000304): This is the ultimate "safety net." According to recent crypto news, a breach here would likely invalidate the 2026 bull thesis.
2026 Market Catalysts
- Other Frogs Threat: New competitors are siphoning liquidity from the original PEPE community, posing a significant threat to PEPE's "meme-king" status.
- Institutional Moves: While JPMorgan is launching tokenized funds on Ethereum, meme coins like PEPE rely entirely on social media virality and potential "Spot Meme ETF" rumors.
IS PEPE Coin Worth Buying in 2026?
PEPE is worth buying in 2026 only if you are using "play money." It remains a powerful tool for catching volatility, but it is underperforming compared to the stability of Bitcoin.
JPMorgan Chase intensified its foray into the decentralized finance (DeFi) ecosystem by filing for a new tokenized money-market fund on the Ethereum blockchain. This move, identified through recent SEC filings, underscores a major shift in how "Global Systemically Important Banks" (GSIBs) view public blockchain infrastructure not just as an experiment, but as a primary settlement layer for institutional liquidity.
JPMorgan’s Ethereum Strategy
The bank’s latest vehicle, the JPMorgan OnChain Liquidity-Token Money Market Fund (JLTXX), follows the successful late-2025 launch of its first public-chain fund, MONY (My OnChain Net Yield Fund). Unlike early permissioned experiments, these funds leverage the public Ethereum network, allowing for greater interoperability with the broader digital asset ecosystem.
Tokenized Money Market Funds
A tokenized money-market fund is a traditional financial product—typically investing in short-term U.S. Treasury bills and repurchase agreements—where ownership is represented by digital tokens (often ERC-20 on Ethereum).
- Yield on-chain: Investors earn dividends that accrue daily and are distributed as additional tokens.
- 24/7 Liquidity: Unlike traditional banking hours, these tokens can be transferred or redeemed near-instantaneously.
- Programmability: The fund’s "shares" can be integrated into smart contracts to serve as collateral.
Bridging Traditional Finance and Stablecoins
The timing of this launch is strategic. With the implementation of the GENIUS Act (the 2025 U.S. stablecoin legislation), stablecoin issuers are now required to hold high-quality liquid assets as reserves. JPMorgan is positioning JLTXX specifically to satisfy these legal requirements, effectively turning Ethereum into a bridge between the $240 billion stablecoin market and U.S. Treasury yields.
Institutional Competition: JPMorgan vs. BlackRock
JPMorgan is moving into a space currently dominated by BlackRock’s BUIDL fund, which recently surpassed $2.5 billion in Assets Under Management (AUM). While BlackRock has a head start, JPMorgan’s deep integration with corporate treasury desks through its Morgan Money platform gives it a unique distribution advantage.
| Feature | JPMorgan JLTXX | BlackRock BUIDL |
|---|---|---|
| Blockchain | Ethereum | Multi-chain (ETH, Arbitrum, etc.) |
| Platform | Kinexys Digital Assets | Securitize |
| Target Audience | Institutions / Stablecoin Issuers | Accredited Institutional Investors |
| Primary Assets | U.S. Treasuries / Repo | U.S. Treasuries / Cash |
Services and Utility on Ethereum
The launch of JLTXX on Ethereum entails several key services that were previously manual or siloed within internal bank ledgers:
- Atomic Settlement: Subscriptions and redemptions can happen in real-time using stablecoins or tokenized deposits, eliminating the T+1 or T+2 settlement lag.
- Collateral Mobility: Through JPMorgan’s Tokenized Collateral Network (TCN), these fund tokens can be used as collateral for derivatives or repo trades without moving the underlying assets.
- Transparent Registry: While identity is verified off-chain to meet KYC/AML standards, the record of ownership exists on a transparent, immutable ledger, reducing audit friction.
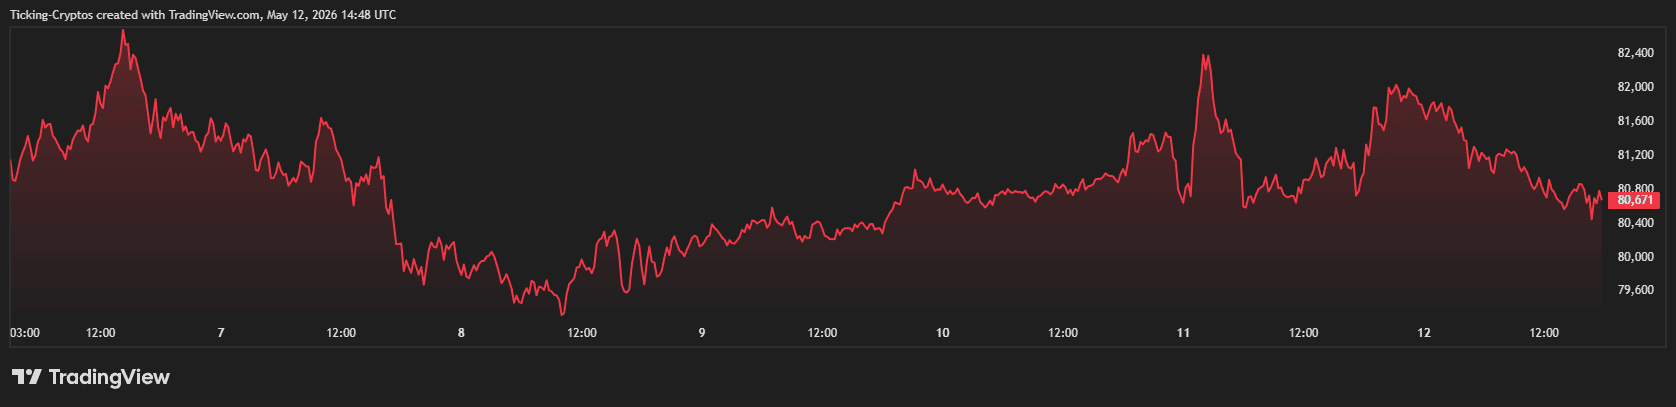
Bitcoin (BTC) continues to oscillate above the critical $80,000 psychological barrier, supported by a historic six-week streak of ETF inflows. Meanwhile, XRP has emerged as a top performer, outshining both Bitcoin and Ethereum (ETH) in recent trading sessions.
Market Snapshot: Bitcoin and XRP Performance
Investors are currently witnessing a Divergence in momentum across the board. While Bitcoin faces slight selling pressure near its local highs, Ripple's XRP has captured the market's attention with a significant breakout.
1. Bitcoin (BTC) Price Stability
As of May 12, 2026, Bitcoin is trading at approximately $80,750, down slightly by 0.20% over the last 24 hours. The asset has established a firm trading range between $80,400 and $82,100. This consolidation is widely viewed as healthy by analysts, especially following the massive surge in late April.
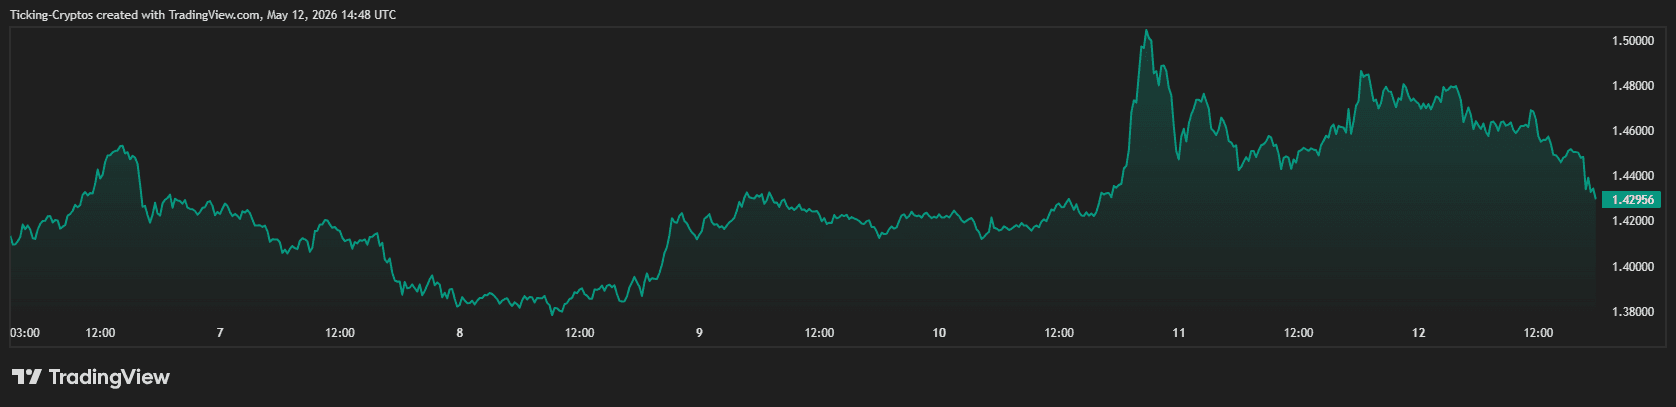
2. XRP Leads the Altcoin Charge
The most notable move comes from XRP, which successfully breached the $1.45 resistance level on high trading volume. Although sellers stepped in near the $1.50 mark, XRP's ability to outpace Ethereum and Bitcoin suggests a shifting appetite toward high-utility altcoins.
Institutional Era: The ETF Inflow Phenomenon
A major catalyst for the current price floor is the relentless demand from U.S. spot Bitcoin ETFs. According to recent, these funds have recorded their longest inflow streak since 2025.
- Six-Week Inflow Streak: ETFs have attracted over $3.4 billion since early April.
- AUM Records: Total Assets Under Management (AUM) for Bitcoin ETFs reached $109 billion this week, the highest level recorded in 2026.
- Supply Shock: ETFs are currently absorbing between 4,500 and 5,000 BTC daily, while only 450 BTC are mined per day—a 10:1 demand-to-supply ratio.
This "institutional era" of crypto investing is fundamentally different from previous retail-driven cycles. Wall Street wholesalers are now acting as a stabilizing force, preventing deep drawdowns even when market sentiment wavers.
What’s Next for Crypto in May 2026?
The current market structure suggests that while Bitcoin provides the foundation, the real "alpha" is currently found in selective altcoins like $XRP and $Solana. Investors are no longer buying the entire market; instead, they are rewarding projects with clear regulatory standing and technical strength. As we look toward the second half of May, the sustainability of the $80,000 level for Bitcoin will be the ultimate litmus test for the next leg toward $100,000.
The US Senate Banking Committee has officially released an expanded 309-page draft of the Digital Asset Market Clarity Act, commonly referred to as the Clarity Act. This updated version, which grew from a 278-page draft seen in January, marks a significant step forward in establishing a federal regulatory framework for digital assets. The bill arrives at a critical juncture as the industry seeks to move beyond "regulation by enforcement" and toward statutory certainty.
Jurisdictional Split: SEC vs. CFTC Authority
Investors and industry participants asking whether the new draft changes the core jurisdictional split can rest assured: the fundamental division of labor remains. The Securities and Exchange Commission (SEC) is slated to oversee most initial token sales, while the Commodity Futures Trading Commission (CFTC) will govern the spot markets and trading of tokens once they are deemed sufficiently decentralized or "mature."
What is the "Clarity" in the Act
The Clarity Act is designed to be the "ultimate rulebook" for the US digital asset market. It seeks to define three main categories:
- Digital Commodities: Under CFTC jurisdiction.
- Digital Asset Securities: Under SEC jurisdiction.
- Payment Stablecoins: Governed by a combination of the Federal Reserve and state regulators.
By creating these legal buckets, the bill aims to eliminate the gray areas that have led to years of litigation between the SEC and major exchanges.
Expanded Investor Protections and Antifraud Measures
A major addition to the 309-page text is the strengthening of investor-protection language. The draft explicitly grants the SEC enhanced authority to pursue insider trading and antifraud cases involving specific crypto offerings. This move is seen as a compromise to win over skeptical lawmakers who argue that the crypto market remains a "Wild West" for retail investors.
The Stablecoin Yield Crackdown: No More "Bank-Style" Interest
One of the most contentious sections of the bill focuses on stablecoins. The draft aims to prevent crypto platforms from operating like unregulated banks. Under the new rules:
- Passive Yield Prohibited: Platforms are barred from offering "bank-style" interest just for holding payment stablecoins (like USDC or USDT) in an account.
- Activity-Based Rewards Allowed: The bill leaves the door open for rewards tied to staking, liquidity provision, governance, or loyalty programs.
This distinction ensures that while simple "interest-bearing" accounts are restricted to licensed banks, the functional utility of DeFi and blockchain ecosystems remains intact.
Refined Focus on Tokenization and the "Build Now" Surprise
The section regarding tokenization has been narrowed. While earlier versions used broad "real-world assets" (RWA) terminology, the current draft focuses more precisely on tokenized securities. This adjustment provides clearer pathways for traditional financial institutions to bring equities and bonds on-chain.
In a move clearly designed to garner broader political support, the draft now incorporates the "Build Now Act." This housing-related legislation has no direct connection to cryptocurrency but is a strategic "rider" intended to attract votes from senators focused on urban development and affordable housing.
What’s Next for the Clarity Act?
The Senate Banking Committee is expected to move toward a formal markup session soon. For the latest updates on how these regulations might affect specific assets, you can monitor the $Bitcoin price and other major tokens on our live tickers.
Decrypt
A viral thread on X drew millions of views as a user claimed Claude AI helped recover a lost Bitcoin wallet.
Bitcoin's recent rally stalled at a critical level, putting the top crypto asset in a position that has previously led to major downturns.
Chainlink Runtime Environment enables Myriad to deploy a new range of prediction markets with immediate settlement.
Kevin Warsh, President Donald Trump's pick to lead the Federal Reserve, was confirmed as its new chair Wednesday to replace Jerome Powell.
The Senate Banking Committee will vote tomorrow on the new additions to the crypto bill, before deciding whether to refer it to the Senate floor.
U.Today - IT, AI and Fintech Daily News for You Today
Despite the existing risk demand, market saw a substantial drop in activity of traders and investors that triggered a substantial sell-off.
Ripple Chief Legal Officer Stuart Alderoty is sending a clear message to Washington ahead of the high-stakes CLARITY Act markup: cryptocurrency investors are "everyday Americans" who hold significant political power.
Kevin Warsh has been confirmed as the next Chair of the Federal Reserve in a 54–45 vote.
Galaxy Digital founder Mike Novogratz is sounding the alarm for his own party, urging Democrats to "seize the center of the ring" by immediately passing the CLARITY Act.
Dogecoin maintains positive futures activity while other top cryptocurrencies flip negative in their open interest.
Blockonomi
The Bonk price shows a token still waiting for a catalyst that has not arrived, with BONK trading at $0.0000071 and sitting 88% below its November 2024 peak. Tuttle Capital filed a 2x leveraged BONK ETF while Bonk Holdings on Nasdaq targets $115 million in reserves, but even those moves cannot close a gap that wide.
Pepeto has collected nearly $10 million in presale with an exchange already processing trades and a Binance listing approaching, and analysts project 100x to 300x from the current entry.
CoinDesk reported that Tuttle Capital filed a 2x leveraged BONK ETF, and Bonk Holdings on Nasdaq targets $115 million in reserves by year end. CoinMarketCap shows BONK at $0.0000071 with a $673 million market cap.
The institutional interest is real, but the Bonk price still sits 88% below its peak, and recovery from that depth moves in percentages that presale tokens can match in a single listing day.
BONK ETF Filing, Pepeto, and Where Meme Coin Returns Split
Pepeto
The BONK recovery struggle shows what happens when a meme coin runs on hype alone, and Pepeto answers that with a live exchange, a cross chain bridge linking Ethereum, BNB Chain, and Solana at zero cost, and a contract risk scanner that catches problems before capital goes in.
Nearly $10 million collected during fear proves the gap between a plan and a working result that wallets already trust with real money, and that trust keeps growing because each presale stage fills faster than the last while BONK needs years of steady buying just to close an 88% gap.
The team behind that momentum includes a former Binance expert and the person who built the original Pepe coin to $11 billion on the same 420 trillion token model and no utility behind it. SolidProof covers every contract, staking pays 173% APY before listing, and the Pepeto presale sits at $0.0000001868 right now. The zero fee exchange means every trade after listing feeds volume directly back into the token instead of leaking value to gas costs, and that is the kind of built in buying pressure that BONK never had and still does not have at $0.0000071.
The CoinMarketCap listing page went active in May, a signal that only appears when trading is near, and the sale ends without warning the second the allocation runs out, so the wallets entering now are building positions at a price that the rest of the market will never see again. One wallet put $8,000 into Shiba Inu in January 2021 and cashed out $9 million by August according to CNN, and with the level of demand flowing into Pepeto, analysts see the same kind of return setup forming for presale holders right now.
Bonk Price Prediction
BONK sits at $0.0000071 per CoinMarketCap, 88% below its $0.00005898 all time high. Changelly projects a 2026 ceiling near $0.0000154, while Coinpedia maps a high of $0.000033 if the Bonk price reclaims resistance.
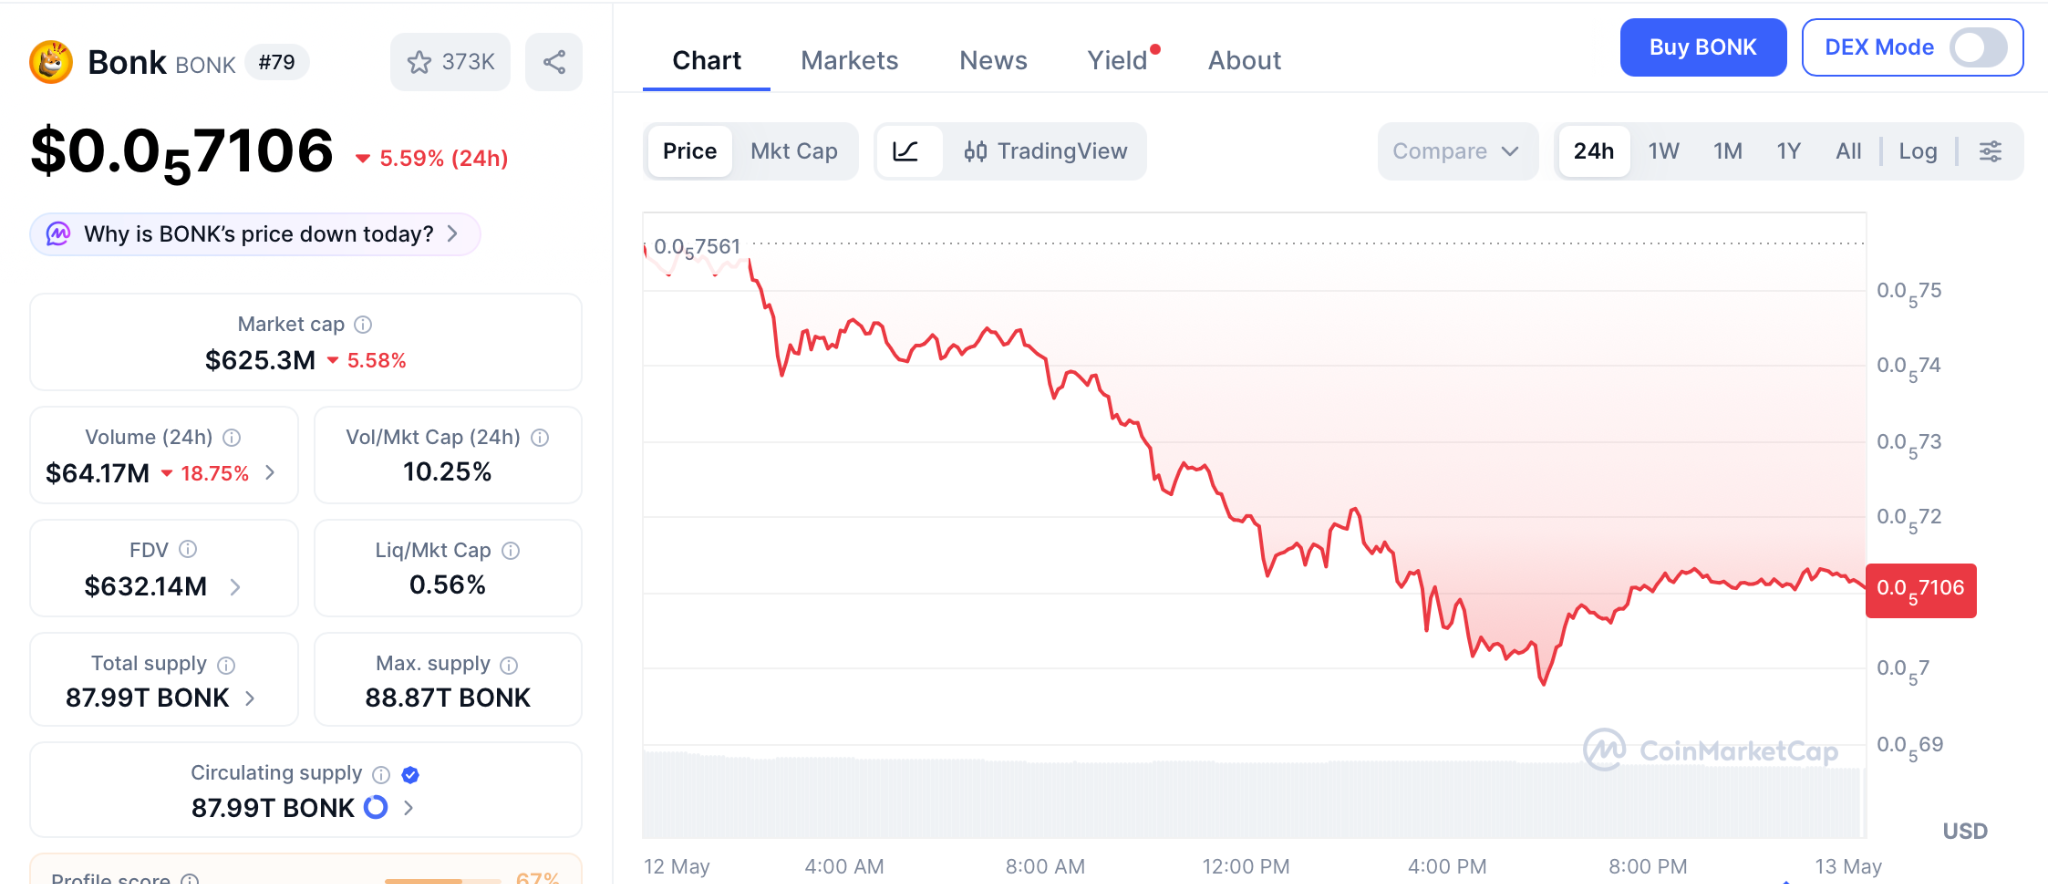
The best case gives roughly 4x on the year, solid for a meme coin but nowhere near what a presale to listing event delivers.
The Final Word
Pepeto was built with timing that fits this cycle perfectly, where meme coins fight to recover and the smartest capital finds the one that shipped what others still promise.
The cofounder proved this math works once before, taking Pepe coin to $11 billion with zero products and the same 420 trillion supply, and repeating that from the current presale price is over 150x with a working exchange and real trading tools behind it this time.
The Bonk price tells the story of a meme coin trapped in recovery mode, waiting for a second chance that keeps getting pushed further out, while Pepeto offers that chance right now at a price that vanishes forever the day the listing goes live.
Entering the presale is betting on a pattern that already delivered generational returns once, and the wallets inside right now are the ones that will look back on this entry the way early Pepe holders look back on theirs, knowing that the only real mistake was not buying more. The Pepeto official website is where that entry exists for a few more days, and the listing could come at any moment because the remaining allocation shrinks with every wallet that enters.
Click To Visit Pepeto Website To Enter The Presale

FAQs:
Why is the Bonk price struggling to recover from its 88% drop?
The Bonk price struggles because BONK depends on hype cycles without exchange tools. Recovery from 88% takes quarters that presale tokens skip through a listing event.
Can Pepeto deliver better returns than Bonk price recovery in 2026?
Pepeto can deliver better returns than Bonk price recovery because the presale price of $0.0000001868 gives 100x to 300x potential once the Binance listing opens. The best Bonk price forecast gives roughly 4x for 2026.
The post Bonk Price Sits 88% Below All Time High While Pepeto Presale Hits $10 Million With a Working Exchange and Binance Listing Ahead appeared first on Blockonomi.
The latest Dogecoin price prediction data shows DOGE forming a bullish pattern after whale wallets loaded a record $11.6 billion worth of tokens, and Bitcoin above $80,000 is pulling capital back into altcoins and meme tokens at a pace not seen since late 2025.
Pepeto is pulling fresh presale attention with nearly $10 million raised and a Binance listing expected ahead.
According to Santiment data, the 149 largest DOGE wallets now hold 108.52 billion tokens worth $11.6 billion, the highest on record. Analysts tracked 739 transactions above $100,000 in a single day.
DOGE trades at $0.11 after clearing every major moving average for the first time since October 2025.
Several Dogecoin price prediction models point to $0.118 resistance, and CoinMarketCap reports ETF inflows returned despite short term bearish signals.
Dogecoin Price Prediction and Pepeto Lead the Crypto Entries Worth Watching in 2026
Pepeto Builds a Working Exchange Before Listing Day While the Market Chases Price Targets
The crypto market rewards people who enter before the rest of the crowd catches on, and Pepeto is that entry right now at $0.0000001868 before the expected Binance listing changes that number for good.
The PepetoSwap exchange, cross chain bridge, and 173% staking system are already built and working, verified by a completed SolidProof audit, which is why the Pepe cofounder who took the original PEPE token to an $11 billion market cap with zero tools is now steering a project that has real tools behind it from day one.
Dogecoin turned early holders into millionaires with nothing but community energy, and Pepeto carries that same energy with an exchange already running underneath it.

Multiple Dogecoin price prediction analysts rank Pepeto alongside the top presale entries because it already delivers more utility than most listed meme coins, and with nearly $10 million raised the presale is almost full, which means the listing could trigger any day and every wallet that hesitated will be staring at an entry that vanished overnight.
Today the entry remains at the lowest number it will ever be, and the moment the listing goes live, this window shuts and the presale buyers are the ones sitting on the returns.
Dogecoin Price Prediction
The Dogecoin price prediction for the rest of 2026 carries real weight after this month’s breakout. DOGE is trading at $0.11 with a market cap of $17 billion according to CoinMarketCap and daily volume above $600 million. The token printed a cup and handle pattern on the daily chart, a classic sign that a run higher is forming.
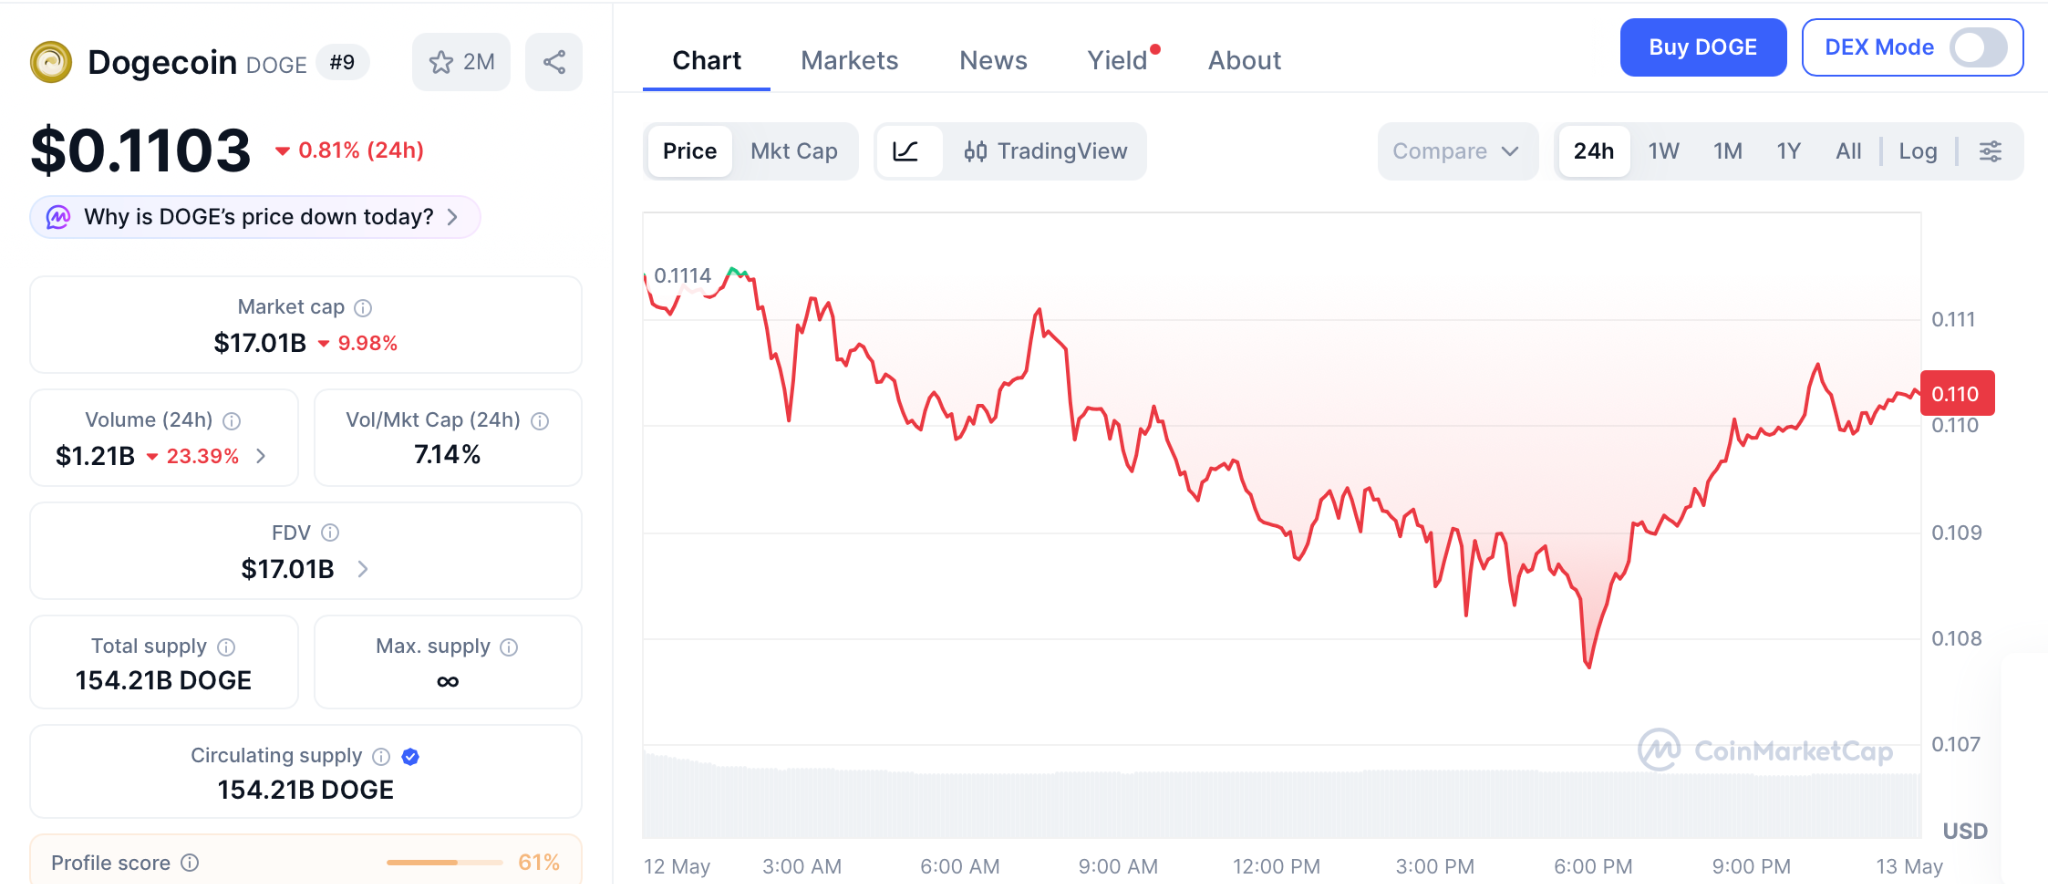
Resistance sits at $0.118 where the 0.618 Fibonacci level lines up with the top of a descending channel, and clearing that opens a path toward $0.155 by year end based on CoinCodex models.
Support holds at $0.087 where buyers stepped in three times since February. The Dogecoin price prediction outlook gets stronger if spot ETF inflows stay positive and X Money integration rumors turn real, because that could push DOGE back toward its 2025 high near $0.27.
Conclusion
The Dogecoin price prediction points to DOGE running toward $0.15 by late 2026, and that kind of move from a large cap delivers about 40% returns over months of waiting.
The original PEPE token reached an $11 billion market cap with zero products behind it, and Pepeto was built by the same cofounder with a working exchange, bridge, and 173% staking already running, which means the math from presale to listing points at returns that a 40% large cap move will never touch.
Nearly $10 million already flowed into this presale, and that number keeps climbing every day because the wallets doing the math understand what happens when a token moves from fractions of a cent to exchange price on listing day.
The presale is still open right now, but the listing could trigger any moment once the final tokens clear, and every day of hesitation is a day closer to watching from the outside while early holders collect the returns. This is the kind of decision that looks obvious in hindsight, and the wallets that act before the window closes are the ones who will not spend the rest of 2026 wishing they had moved when the entry was still there.
Click To Visit Pepeto Website To Enter The Presale

FAQ
What is the Dogecoin price prediction for the rest of 2026?
The Dogecoin price prediction targets $0.155 by year end if the cup and handle breaks $0.118 resistance. DOGE trades at $0.11 with whale wallets holding a record $11.6 billion.
Why are analysts watching the Pepeto presale alongside DOGE right now?
Pepeto raised nearly $10 million with a working exchange, 173% staking APY, and an expected Binance listing. The presale at $0.0000001868 is almost full.
The post Dogecoin Price Prediction Signals Breakout for 2026 as Whale Holdings Hit Record While Pepeto Nears $10M With Listing Days Away appeared first on Blockonomi.
The latest dogecoin price prediction data shows Dogecoin holding a bullish structure after whale wallets loaded a record $11.6 billion worth of tokens earlier this month, and the breakout above every major moving average still holds two weeks later.
Capital continues rotating into altcoins as Bitcoin stays above $80,000, and Pepeto is pulling fresh presale attention with nearly $10 million raised, the presale 97% filled, and a Binance listing expected ahead.
According to Santiment data, the 149 largest Dogecoin wallets now hold 108.52 billion tokens worth $11.6 billion, the highest on record. Dogecoin trades at $0.1103 today after clearing every major moving average in early May for the first time since October 2025, and the breakout structure is holding.
Several dogecoin price prediction models point to a test of $0.118 resistance next, and CoinMarketCap confirms whale accumulation hit a six month high again on May 12.
Dogecoin Price Prediction and Pepeto Lead the Crypto Entries Worth Watching in 2026
Pepeto Builds a Working Exchange Before Listing Day While the Market Chases Price Targets
The crypto market rewards people who enter before the rest of the crowd catches on, and that is exactly what is happening with Pepeto right now at $0.0000001868 before the expected Binance listing changes that number for good.
The PepetoSwap exchange already runs zero fee trading, the cross chain bridge already sends assets between networks at zero cost, and 173% staking APY is already compounding tokens for holders who arrived first, which means the platform that most presales promise to build after launch is the platform Pepeto built before asking anyone to buy in.
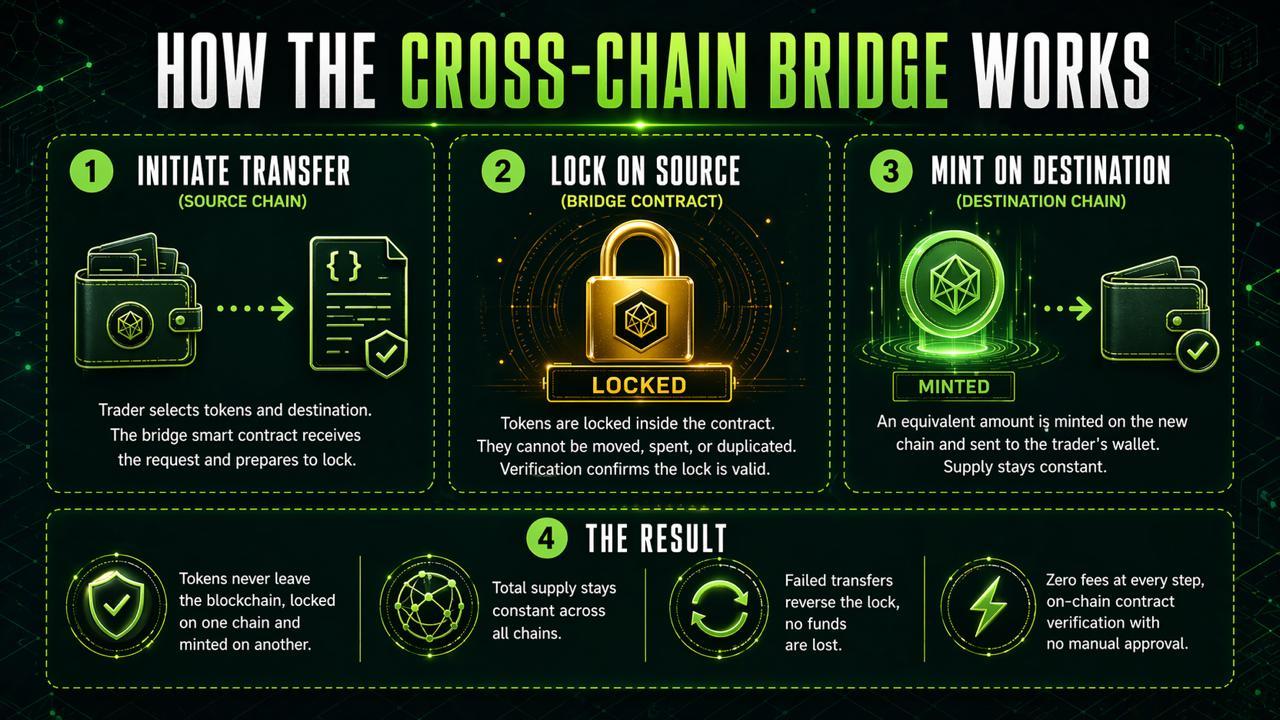
SolidProof audited every contract, and the Pepe cofounder who took the original PEPE token to an $11 billion market cap with zero tools is steering this one with a full suite of working tools behind it. The presale has pulled in nearly $10 million, stages are clearing in under 48 hours, and the smart contract is 97% filled.
When the last token sells the buy window closes automatically with no warning and no countdown, and the Binance listing follows within days. The exchange price takes over at listing, and the presale buyers are the ones sitting on the returns that the rest of the market will spend the cycle calculating.
Dogecoin Price Prediction
The dogecoin price prediction for the rest of 2026 carries real weight right now. Dogecoin trades at $0.1103 with a market cap of $17 billion according to CoinMarketCap, and the token is holding above its 50 day and 100 day exponential moving averages after printing a cup and handle pattern on the daily chart.
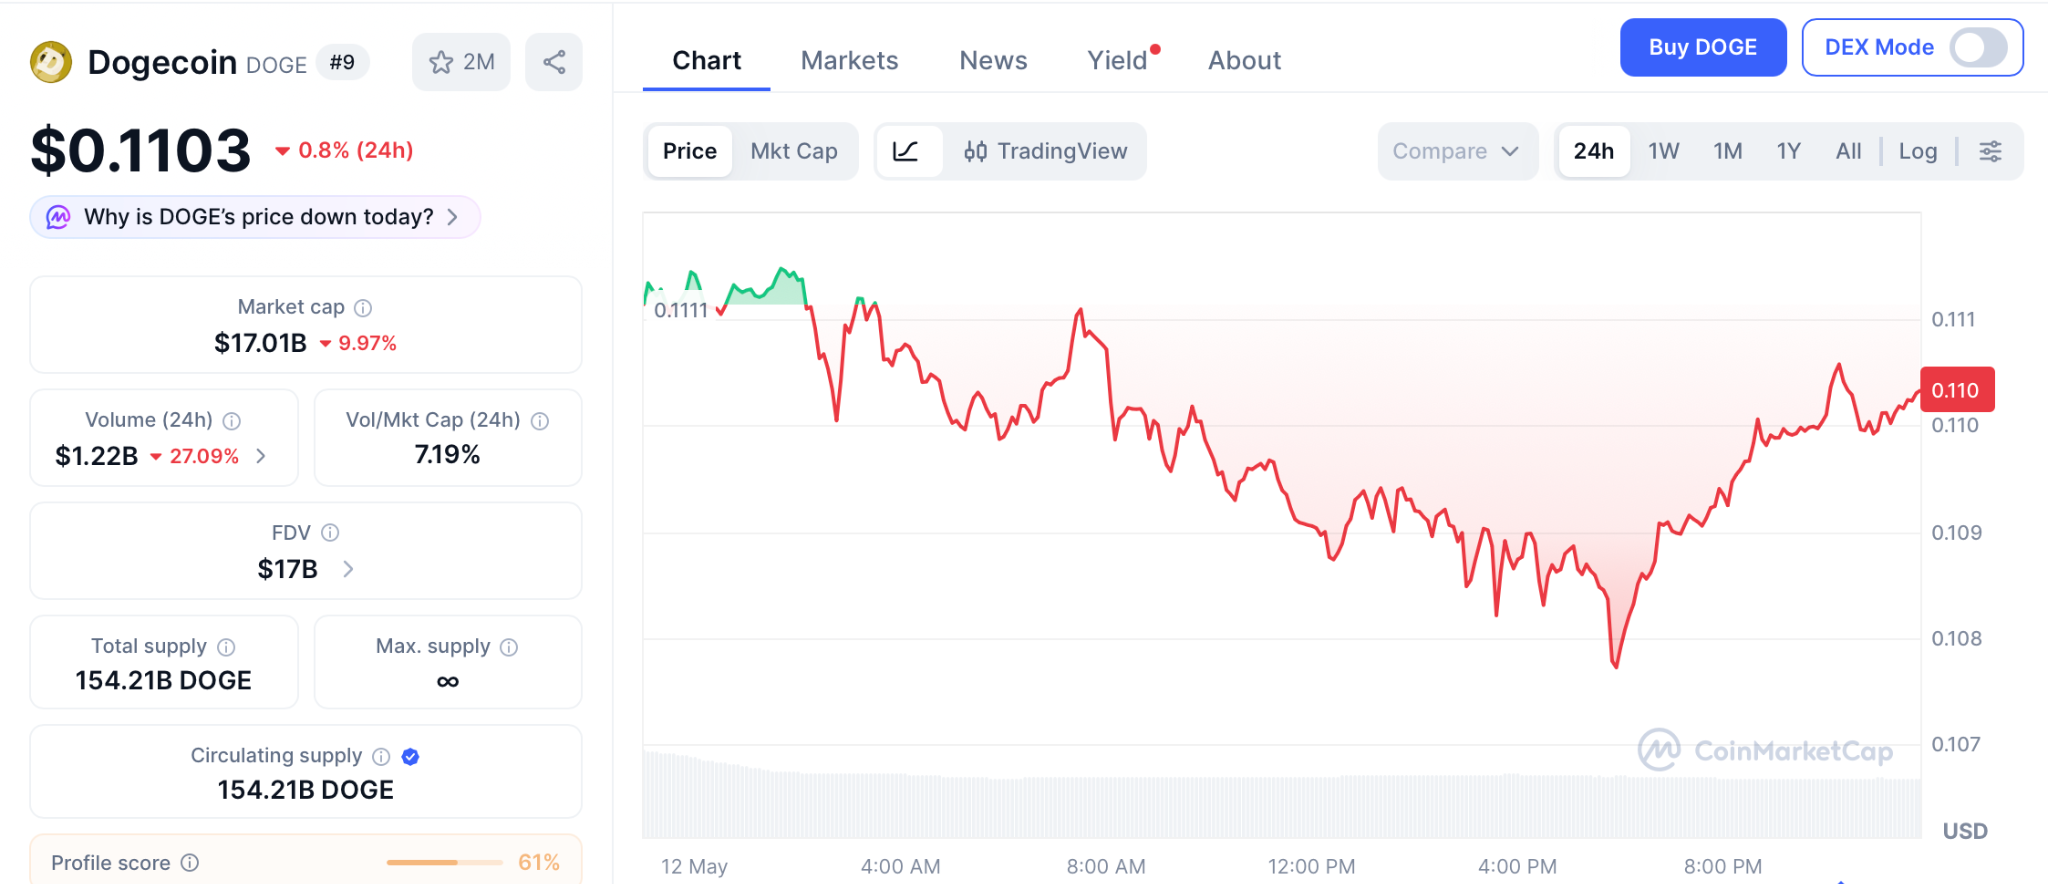
Resistance sits at $0.118 where the 0.618 Fibonacci level lines up with a long term descending channel, and clearing that opens a path toward $0.155 by year end based on CoinCodex models. Support holds at $0.087.
The outlook gets stronger if spot ETF inflows stay positive and the X Money integration or the June SpaceX IPO turn speculation into real announcements, because that could push Dogecoin back toward its 2025 high near $0.27.
Conclusion
The dogecoin price prediction points to Dogecoin running toward $0.15 by late 2026, and that kind of move from a large cap delivers about 40% returns over months of waiting. The original PEPE token reached an $11 billion market cap with zero products behind it, and Pepeto was built by the same cofounder with a working exchange, bridge, and 173% staking already in place, so the math from presale to listing points at returns that a 40% large cap move will never touch.
Nearly $10 million already flowed in, the smart contract is 97% filled, and when the last token sells the buy window closes automatically with no warning. That means the gap between today’s presale price and tomorrow’s listing price could disappear overnight, and every wallet that waited will spend the rest of the cycle calculating what they lost by hesitating over a decision that cost nothing but a few minutes.
The wallets that entered early on PEPE, Shiba Inu, and BNB all say the same thing: the hardest part was not finding the project, it was pressing the button before the crowd arrived. Pepeto is that moment right now, and the listing is days away.
Click To Visit Pepeto Website To Enter The Presale

FAQ
What is the latest dogecoin price prediction for 2026?
Dogecoin trades at $0.1103 with analysts targeting $0.155 by year end if the cup and handle breaks $0.118 resistance. Whale wallets hold a record $11.6 billion.
Why are analysts watching Pepeto alongside the dogecoin price prediction?
Pepeto raised nearly $10 million with a working exchange, 173% staking, and the Binance listing days away. The 97% filled presale closes automatically.
The post Dogecoin Price Prediction Signals Gains for 2026 as Whale Holdings Hit Record, but Pepeto’s Listing Could Create the Bigger Millionaires appeared first on Blockonomi.
TLDR
- Jupiter has partnered with Bitwise to launch an isolated USDe lending market on Solana.
- Bitwise will curate the dedicated USDe pool within Jupiter Lend for institutional participants.
- The USDe market will operate separately from Jupiter Lend’s main liquidity layer.
- The structure aims to manage risk and support institutional capital participation.
- Fluid protocol will provide collateral and lending infrastructure for the isolated pool.
Jupiter has partnered with Bitwise to launch an isolated USDe lending market on Solana. The firms announced the initiative on Wednesday and confirmed institutional access. The structure separates USDe liquidity and integrates Fluid for lending infrastructure support.
Bitwise and Jupiter Launch Isolated USDe Market on Solana
Jupiter confirmed that Bitwise will curate a dedicated USDe market on Jupiter Lend. The platform will isolate this market from its main liquidity layer to manage risk. The firms said the structure aims to support institutional capital with controlled exposure.
Bitwise will oversee market parameters while Jupiter provides the lending framework. The setup marks the first time an institutional asset manager curates a market on Jupiter Lend. The companies stated that this approach strengthens risk management and capital efficiency.
The isolated pool will function independently from other lending markets on the platform. As a result, liquidity risks from other assets will not affect the USDe market. The partners said this design aligns with institutional compliance standards.
Jonathan Man, Head of DeFi Strategies at Bitwise, addressed the launch. He said, “Jupiter and Fluid have built unique infrastructure for efficient lending markets.” He added that the design provides deep liquidity and risk-mitigating features.
USDe Gains Dedicated Lending Support Through Fluid Integration
The initiative integrates Fluid protocol to supply collateral and lending infrastructure. Fluid will support collateral management and borrowing operations within the isolated pool. The firms confirmed that this integration enhances operational efficiency.
The new market allows users to earn yield on USDe within Jupiter Lend. USDe functions as a synthetic asset that maintains a stable value target. Ethena Labs issues the token and oversees its underlying structure.
Guy Young, CEO of Ethena Labs, commented on the development. He said, “USDe is an institutional-grade savings product, built for scale.” He added that the combined infrastructure creates an efficient USDe market ready for DeFi adoption.
USDe launched in early 2024 and expanded rapidly across crypto markets. By mid-2025, it ranked as the third-largest stablecoin by market capitalization. The asset attracted institutional participation during its early growth phase.
However, USDe later declined in market rankings after volatility pressures. A crypto market crash on Oct. 10 exposed decoupling risks linked to the asset. Market data showed fluctuations in USDe’s price stability during that period.
Jupiter and Bitwise did not disclose specific yield rates for the market. They confirmed that the structure will operate under defined collateral parameters. The companies stated that the market is now live on Solana.
The post Jupiter and Bitwise Launch Isolated USDe Market on Solana appeared first on Blockonomi.
TLDR
- Consensys has delayed its planned U.S. initial public offering until at least the fall.
- The company had aimed to file a confidential draft S-1 with the SEC in late February.
- Weak crypto market conditions led the firm to pause its IPO timeline.
- Consensys engaged JPMorgan and Goldman Sachs to lead the potential offering.
- Bitcoin ETF outflows and falling token prices contributed to market pressure.
Consensys has postponed its planned U.S. initial public offering until at least fall due to weak market conditions. Sources familiar with the matter confirmed the delay and cited recent volatility in crypto markets. The Ethereum software firm had prepared to begin formal filing steps earlier this year.
Consensys Halts IPO Filing Plans
Consensys had targeted a confidential draft S-1 filing with the Securities and Exchange Commission by late February. However, worsening market trends led the company to pause those plans. Two people with direct knowledge confirmed the revised timeline.
The company engaged bankers from JPMorgan and Goldman Sachs last year to manage the offering process. It aimed to move forward while regulatory clarity improved for digital asset companies. Yet market performance shifted sharply at the start of 2026.
Crypto markets declined in February as traders reduced exposure to risk assets. Bitcoin ETFs recorded heavy outflows, and prices across tokens fell. As a result, leveraged liquidations spread across digital assets.
Macroeconomic concerns and tariff discussions also weighed on sentiment. Expectations for interest rate cuts slowed during the same period. Those factors combined to pressure equity and crypto valuations.
A Consensys spokeswoman declined to comment on specific IPO timing. She stated, “As a matter of policy, we don’t comment on market speculation.” The company has not announced a new filing date.
Market Conditions Pressure Crypto Listings
Several crypto firms outlined public listing plans earlier this year after clearer U.S. regulatory guidance. However, weaker market performance forced many companies to reassess their schedules. Large firms such as Kraken and Ledger paused their IPO plans.
BitGo, operating under ticker BTGO, completed the only crypto-native IPO in 2026. The company raised about $213 million in January. It priced shares at $18, which exceeded the marketed range.
Shares rose more than 20% during the company’s debut on the New York Stock Exchange. However, the rally faded in subsequent weeks. The stock now trades about 36% below its IPO price.
The price decline reflected ongoing volatility in digital asset equities. Crypto-linked stocks have tracked broader movements in token prices. Therefore, companies have adjusted capital raising strategies.
Consensys previously secured $450 million in a Series D funding round in early 2022. That round valued the firm at $7 billion. The company has not disclosed updated valuation figures since then.
Joe Lubin leads Consensys and oversees products including the MetaMask wallet. The firm continues to operate its Ethereum development services. For now, it has shifted its IPO consideration to the fall timeframe.
The post Consensys Postpones Public Offering on Market Weakness appeared first on Blockonomi.
CryptoPotato
Blockchain investigator ZachXBT has linked US-based alleged threat actor Dritan Kapllani Jr. to more than $19 million in crypto thefts carried out through social engineering attacks targeting cryptocurrency holders.
In a series of posts on X, ZachXBT alleged that Dritan frequently showcased luxury cars, designer watches, private jets, and nightlife activities across social media while interacting with other threat actors online.
Crypto Laundering Network Exposed
According to the investigator, Dritan was recently recorded during a Discord “band 4 band” (B4B) call on April 23, 2026, wherein he displayed an Exodus wallet allegedly holding $3.68 million in cryptocurrency in an attempt to prove he possessed more funds than another individual on the call.
ZachXBT identified the Ethereum wallet address shown during the exchange and connected it to a major Bitcoin theft that took place on March 14, 2026. The investigator claimed the address traced back to the theft of 185 BTC, worth around $13 million at the time, from a victim targeted through social engineering tactics.
According to the findings, Dritan’s wallet allegedly received approximately $5.3 million from the theft on March 15. ZachXBT stated that by the time the Discord call took place, six weeks later, nearly $1.6 million had already been spent or laundered. The allegations surfaced one day after US authorities unsealed a criminal complaint against Trenton Johnson for his alleged role in the 185 BTC theft.
ZachXBT claimed Dritan was identified in the complaint as “Co-Conspirator 1,” although he has not been formally charged. The investigator also noted that meme coin influencer “yelotree” was charged for allegedly helping launder stolen funds through a Miami-based rental car business and could face up to 30 years in prison if convicted.
Link to “Lick” Investigation
ZachXBT further connected Dritan to an earlier January 2026 investigation involving John Daghita, also known as “Lick,” who was accused of stealing $46 million from the US government. According to the prominent on-chain sleuth, one of Dritan’s previously used wallet addresses was exposed in a deleted Telegram post shared by Daghita. ZachXBT claimed the wallet was tied to at least five additional social engineering thefts in 2025 that stole more than $5.85 million.
The investigator said he delayed publicly sharing his findings until charges connected to the 185 BTC theft became public and added that Dritan had avoided prosecution partly because he was a minor until recently turning 18.
The post ZachXBT Links Teen Crypto Flaunter to $19M Theft Network appeared first on CryptoPotato.
The Senate Banking Committee’s CLARITY Act is heading into Thursday’s markup, buried under opposition.
According to reports, Senator Elizabeth Warren alone filed more than 40 amendments before Tuesday’s 5 p.m. ET deadline, and American Bankers Association members sent over 8,000 letters to Senate offices in less than a week demanding changes to the bill’s stablecoin yield rules.
Over 100 Amendments Filed
The total number of proposed amendments going into Thursday is still being confirmed, but according to a list obtained by Politico, there have been more than 100 proposed. To put things in perspective, a total of 137 revisions were proposed before the markup scheduled for January, which was canceled.
Warren’s batch alone covers a wide range of restrictions. One amendment that stood out would bar the Federal Reserve from issuing master accounts to crypto companies, which would effectively cut such firms off from the core infrastructure of the US banking system.
The lawmaker also attacked the updated bill on X, arguing that it lacked ethics provisions tied to President Donald Trump’s crypto businesses.
“No bill should move through the Banking Committee without real ethics guardrails,” she wrote.
That dispute has become harder for negotiators to avoid. Late last month, analyst Simon Dedic claimed that Trump’s meme coin and his crypto-related dinners were part of the reason the CLARITY Act was going nowhere, with Democrats demanding conflict-of-interest language before backing the legislation.
Another revision, filed by Senator Jack Reed of Rhode Island, would prohibit crypto from being used as legal tender, including for paying taxes. That proposal runs directly counter to a bill Representative Warren Davidson introduced last year that would have allowed Bitcoin to be used for precisely that purpose.
Senators Reed and Tina Smith of Minnesota also filed a joint amendment that would incorporate bank-requested changes to the stablecoin yield language.
According to journalist Brendan Pedersen, the proposal will force senators to choose between crypto and the banks on a single vote, making it an uncomfortable moment for Republicans who tend to side with both.
Bankers Blitz Senators With 8,000 Letters
Elsewhere, members of the American Bankers Association have reportedly sent more than 8,000 letters to Senate offices since last Friday, pushing lawmakers to change the bill’s stablecoin yield compromise.
However, Stand With Crypto, the crypto advocacy group, responded with its own numbers on Tuesday, saying its advocates had called Congress 8,000 times and sent 300,000 emails over recent months to protect stablecoin rewards, and have contacted lawmakers nearly 1.5 million times in support of the CLARITY Act overall.
Those on the side of digital assets are framing the banking industry’s lobbying campaign as an attempt to block competition from yield-bearing stablecoins.
Senator Bernie Moreno accused banks of trying to “kill stablecoins that would let everyday Americans earn real yields on their own money.” He also described the banking industry as a “cartel” protecting low-interest deposit models.
But not everyone inside Washington thinks this fight ends at Thursday’s committee vote. According to reporter Sander Lutz, banking policy leaders are already preparing for another push on the Senate floor if they lose the markup battle over yield restrictions.
Meanwhile, crypto journalist Eleanor Terrett reported that Senate Minority Leader Chuck Schumer privately encouraged Democrats to work toward supporting the bill.
The post CLARITY Act Faces Wave of Amendments Ahead of Markup appeared first on CryptoPotato.
The biggest meme coin by market capitalization has jumped by double digits over the past 30 days, increasing its dominance in its niche.
However, certain technical indicators suggest the bears may soon regain control.
The Incoming Correction?
As of press time, DOGE trades at around $0.114 (according to CoinGecko), representing an impressive 8% increase on a two-week basis and a 25% surge for the month. In fact, it has outperformed many leading cryptocurrencies, including Bitcoin (BTC) and Ethereum (ETH), over these time frames.
Nonetheless, the renowned analyst Ali Martinez tempered the excitement in the Dogecoin community after noting that the TD Sequential indicator had flashed a sell signal on the meme coin.
Another short-term warning sign is DOGE’s Relative Strength Index (RSI). The technical analysis tool is often used by traders to spot potential price reversal points and ranges from 0 to 100.
Readings above 70 indicate that the meme coin’s valuation has risen too much, too quickly, and could be due for correction. On the contrary, anything below 30 suggests that the token is oversold and on the verge of a resurgence. As of this writing, DOGE’s RSI stands at roughly 88.
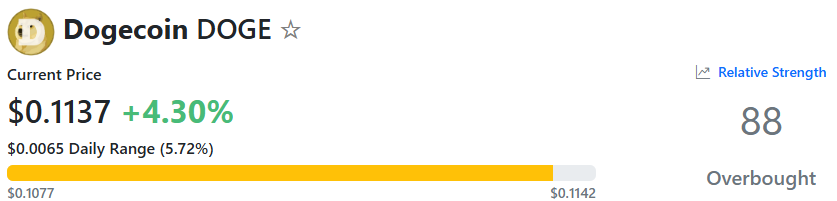
The Bullish Scenario
Despite the aforementioned indicators hinting at a price decline in the near future, multiple market observers remain optimistic that the meme coin has plenty of fuel left to post further gains.
X user Ryker claimed that DOGE’s chart “looks great,” predicting that it “will lead meme trend back together.” For their part, JAVON MARKS argued that the asset has started responding even more positively to a major bullish divergence that has been holding with the MACD.
They envisioned a whopping 500% breakout to the $0.6533 target, which could then open the door to an ascent to a new all-time high of approximately $1.25.
MikybullCrypto followed up with an even more optimistic outlook. They suggested the current levels are “the best area” to hop on the bandwagon before “the massive bullish tide,” forecasting an astronomical explosion to $12.
It is important to note that such a pump seems quite improbable (at least for now), as it would require DOGE’s market cap to exceed $1.8 trillion. In comparison, the current capitalization of BTC stands at around $1.61 trillion, while the total value of the entire crypto sector is less than $2.8 trillion.
The post Dogecoin (DOGE) Soars 25% in a Month, But Key Indicator Flashes a Sell Signal appeared first on CryptoPotato.
A closely watched chart pattern has flipped bullish, and at least one analyst says it mirrors the setup that preceded some of the biggest altcoin rallies on record.
According to trader Mark Chadwick, the pattern has historically occurred just before rallies of between 2,000% and 10,000%.
Altcoins Flash Their Strongest Setup in Years, Analysts Say
Chadwick posted on X on May 13 that the altcoin market is showing “one of the cleanest setups we’ve seen since 2020.” In his view, alts have spent months consolidating along a long-term ascending support line, absorbing selling pressure without breaking down, and now momentum is starting to flip.
“That’s historically how Alt Season starts,” he wrote.
He pointed to the 2020-2021 cycle as the clearest comparison, saying that when similar signals appeared then, they pushed many major alts up by “2,000-10,000% within months.”
He also cited the Russell 2000 hitting all-time highs as corroborating evidence that broader risk appetite is returning, arguing that capital rotation out of safer assets and into higher-beta plays is already starting.
That view is quite similar to that shared by another analyst, Michaël van de Poppe, who said earlier in the week that altcoins are currently trailing Bitcoin by one to three weeks and that if the pattern continues, they could start posting gains between 100% and 300%, depending on liquidity conditions and market momentum.
Some on-chain data also offered backing for Chadwick’s thesis, with crypto analyst Darkfost noting that altcoin performance among tokens listed on Binance has returned to levels not seen since September 2025.
Per his data, about 21% of Binance-listed altcoins have now reclaimed their 200-day moving averages. In February, only 2% of those assets held above that level. However, he was careful not to overstate the trend.
“It is far too early to start calling an altseason; the road ahead is still long and liquidity remains constrained,” he pointed out.
Liquidity and Regulation Remain Central Concerns for Traders
Despite the improving charts, some market watchers are still pointing to weak liquidity as a major obstacle for a bigger rally.
Darkfost himself noted that the crypto market has become heavily diluted, with at least 51 million altcoins now in circulation, with 46% of those tokens on Solana, while 36% are on Base and 10% are on BNB Smart Chain.
Macroeconomic concerns are also still weighing on sentiment. Darkfost cited the ongoing US-Iran conflict and inflation worries as factors that are still putting pressure on risk assets.
At the same time, traders are closely watching developments in Washington, with Chadwick, in an earlier post, suggesting that the Digital Asset Market Clarity Act of 2025 could encourage more institutional participation in crypto markets if it paves the way for clearer market structure rules.
The bill is scheduled for markup tomorrow, but has been hit with multiple amendments as well as more than 8,000 letters from members of the American Bankers Association opposing its stablecoin yield provisions.
The post 10,000% Gains? Why One Analyst Says the Strongest Altcoin Setup in Years Is Here appeared first on CryptoPotato.
Many leading cryptocurrencies have seen some volatility over the past 24 hours, yet their price swings don’t compare to the devastating crash that five lesser-known altcoins experienced.
The culprit behind that meltdown was Binance, which recently announced its latest delisting effort.
The Heavy Bleeding
The world’s largest crypto exchange revealed that it has conducted another review to ensure that all coins listed on the platform meet high standards and industry requirements. Based on its analysis, it decided to terminate all services involving Automata (ATA), Harvest Finance (FARM), Enzyme (MLN), Phoenix (PHB), and Syscoin (SYS).
The delisting will take place on May 27, with Binance explaining that deposits of these tokens will not be credited to users’ accounts after May 28. Moreover, withdrawals will remain available until July 27.
The news has caused a major decline for the involved coins. All of them have plunged by double digits immediately after the disclosure, with SYS taking the biggest blow as its valuation has tumbled by 34%.
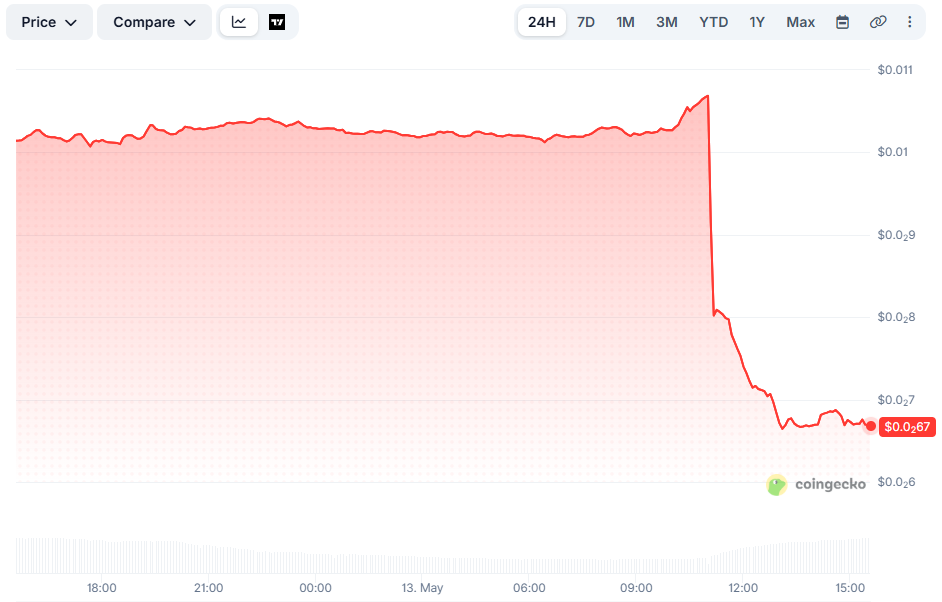
Such price reactions are hardly surprising, since losing backing from a crypto behemoth like Binance typically leads to reduced liquidity, lower market visibility, and reputational damage.
In April, Beefy.Finance (BIFI), FunToken (FUN), FIO Protocol (FIO), Orchid (OXT), Measurable Data Token (MDT), and Wanchain (WAN) posted similar losses after the exchange removed them from its platform. Shortly after, Dego Finance (DEGO), DENT (DENT), and TrueFi (TRU) met the same fate.
Other Recent Updates
Earlier this week, Binance listed the trading pairs MEGA/U, TON/U, and TON/USD1 to its margin program. The initiative was once again primarily centered on United Stables (U) – a stablecoin launched in late 2025 and pegged to the American dollar.
Over the past months, the exchange expanded the list of trading pairs on Binance Spot by adding XRP/U, SUI/U, ASTER/U, and PAXG/U. It also included AVNT/U, BIO/U, CHIP/U, KAT/U, CHIP/USD1, and XAUT/USD1 on Cross Margin.
Just recently, it announced that users can spend U tokens with their Binance Cards and earn 15% cashback. The offering comes with 0 conversion fees and 0 Foreign Exchange (FX) charges.
The company explained that the reward will be distributed in tokens designated by the company, at its sole discretion, before June 30. The cashback is non-transferable, non-exchangeable, and cannot be redeemed for cash or any other benefit, it added.
The post Brutal Price Collapse for 5 Altcoins After Binance Says Goodbye: Details appeared first on CryptoPotato.