Cryptocurrency Posts
Crypto Briefing
Rising PPI signals persistent inflation, potentially impacting monetary policy and market stability, influencing Bitcoin's volatility.
The post US PPI rises 0.7% in February, Bitcoin falls toward $72,000 appeared first on Crypto Briefing.
Whale Bitcoin transfers to exchanges may signal increased market volatility, impacting investor sentiment amid key economic policy decisions.
The post Whales move over 44,000 Bitcoin to exchanges ahead of Fed meeting appeared first on Crypto Briefing.
Moody's integration of credit insights into blockchain enhances transparency and efficiency, potentially transforming digital financial markets.
The post Moody’s brings trusted credit insights to blockchain networks with Token Integration Engine appeared first on Crypto Briefing.
A stablecoin yield compromise could reshape financial competition, impacting banks and boosting digital asset adoption if regulatory clarity is achieved.
The post Tim Scott expects stablecoin yield compromise proposal by week’s end appeared first on Crypto Briefing.
The rise of agentic commerce could redefine payment systems, challenging traditional networks and reshaping consumer-merchant dynamics.
The post Visa’s Jack Forestell calls the agentic web the biggest payments opportunity in two decades appeared first on Crypto Briefing.
Bitcoin Magazine
Bitcoin Magazine
STRC: The Global Bitcoin Dollar Cost Average
If you haven’t already, please read my last research note about takeaways from Strategy World 2026. I cover a wide range of things there, and today I want to narrow in on what I believe is the most important Bitcoin development in the last year: STRC.
STRC and Volatility
Strategy designed STRC as a variable-rate financial instrument intended to maintain a fixed market price of $100. If STRC’s trading range falls below $100, Strategy is committed to increasing the dividend payout, incentivizing bids back to the $100 target. Conversely, if STRC trades above $100, Strategy uses its At-The-Market (ATM) offering to sell more shares or reduce the dividend, allowing the price to adjust back to $100.
This financial engineering substitutes price volatility with yield volatility. Given the market’s preference for price stability, Strategy created an instrument with stable pricing but variable yield. As market confidence in Strategy’s ability to manage the peg via the dividend improves, one would expect the frequency of dividend adjustments to decrease. This creates a positive feedback loop: price stability and high trading volume facilitate Strategy’s ability to sell substantial quantities of STRC.
The result of a stable $100 price and an active at-the-market offering is a mechanism for global Dollar Cost Averaging (DCA) into Bitcoin that operates—at the margins—independently of Bitcoin’s spot price. This is a very big deal.
Explaining Dollar Cost Averaging
Dollar Cost Averaging (DCA) is a straightforward concept: averaging the dollar-denominated cost basis of an asset acquisition. It is usually implemented by committing a fixed dollar amount to purchase an asset at regular intervals, regardless of the price. This method acquires more units when prices are low and fewer when prices are high. This generally imparts a marginal downward bias on the long-term cost basis, provided the asset exhibits reasonable volatility.
Strategy’s Bitcoin Financing So Far
Prior to STRC’s $100 price stabilization, Strategy often acquired Bitcoin at local price peaks. This occurred because all its existing financing vehicles positively correlated with the BTC spot price. For example, MSTR common stock trades as a high-beta proxy for BTC. Thus, when BTC significantly rises, selling MSTR raises substantial financing. However, this dynamic meant that capital for BTC acquisition became available precisely when BTC’s price was at local highs.
Other preferred instruments largely exhibited similar behavior. When BTC was strong, credit spreads narrowed. When BTC was weak, preferred shares typically sold off. Although these are fixed income instruments that theoretically should have been less correlated, a practical correlation persisted nonetheless.
STRC changes this dynamic.
As long as sufficient volume is maintained at or above the $100 price point, Strategy can continuously raise capital by issuing STRC. The market’s reliance and fervent desire for price stability creates a financing instrument uncorrelated with the price of BTC.
Specifically, fundraising via STRC is correlated with STRC volume rather than with BTC price action. This is a significant breakthrough, facilitating a “global DCA” into BTC.
STRC as the Global Bitcoin Dollar Cost Average
A stable-price asset offering an 11.5% yield naturally attracts global interest. So let’s follow the trail. Investors acquire STRC. Strategy then uses these funds to purchase BTC. Although the investors’ capital was not explicitly designated for BTC, it is ultimately channeled into BTC acquisition.
Demand for an instrument like STRC arises—at its margins—independently of the price of BTC. Therefore, the resulting financing activity and subsequent BTC purchases remain unaffected by BTC price fluctuations. This is the core characteristic of a dollar cost averaging program.
Crucially, the funds for this DCA originate from the collective savings of entities seeking STRC’s attributes. This demographic likely includes much of the global population. The only remaining challenge is distribution. Currently, Strategy can sell STRC to anyone with a standard U.S. brokerage account. The development of Layer 3 “Digital Money” products (discussed in the prior research note) built on the STRC foundation has the potential to broaden distribution substantially. Other things like investor education, marketing, market maturity, and an instrument-level credit rating can also help. These expansions would increase the magnitude of the global DCA funnel.
What is remarkable is that Bitcoin alone could never have achieved this type of broad demand. Bitcoin is evidently deemed by most entities to be too volatile or complicated or uncertain. What was needed was a corporation that could bear the volatility risk of BTC and provide a stable return profile in the form of a credit instrument. This instrument would be widely attractive and receive regular investment from a broad scope of investors, allowing the corporation to create a Bitcoin DCA by proxy. This is the essence of what STRC enables.
Some Caveats
I used the term “at margins” repeatedly for a reason. While STRC maintains price stability, this stability is contingent upon BTC continuing to generate favorable returns. If BTC’s return falls below the STRC yield rate, Strategy’s common equity investors are basically covering this difference via a combination of dilution and multiples compression. There is a limit to the losses that can be absorbed by common equity before the company’s ability to sustain the STRC instrument is jeopardized. STRC functions as a global Bitcoin DCA only as long as the underlying asset (BTC) performs well. This is an important caveat.
Furthermore, stability is maintained primarily in market conditions absent of complete “panic” surrounding BTC. Events like February 5 2026, or mid-November 2025, which saw significant and violent BTC drawdowns, resulted in temporary STRC sell-offs. Historical evidence therefore confirms that STRC exhibits some downside correlation to BTC during periods of extreme market duress. These types of market regimes do challenge the viability of a “global Bitcoin DCA” concept. At the very least, it is possible that this DCA will be temporarily disrupted if enough sellers push the price below $100.
Conclusion
The realization of a global DCA through STRC is in its early stages. Last week, Strategy issued over $1.1 billion through the STRC ATM program—an unprecedented magnitude for preferred stock in capital markets history.
It is interesting to consider how long BTC can remain below its all-time highs if an increasing number of entities participate in the global Bitcoin DCA by adopting STRC.
Disclaimer: This content was written on behalf of Bitcoin For Corporations. This article is intended solely for informational purposes and should not be interpreted as an invitation or solicitation to acquire, purchase or subscribe for securities.
This post STRC: The Global Bitcoin Dollar Cost Average first appeared on Bitcoin Magazine and is written by Allard Peng.
Bitcoin Magazine

From $5 to $75,000: Bitcoin’s Saint Patrick’s Day Prices Shows You the Wild Ride of Bitcoin
Bitcoin’s rise from an obscure digital asset to a global financial instrument is again in focus this St. Patrick’s Day. On March 17, 2012, Bitcoin traded near $5. Thirteen years later, it has reached roughly $75,000.
This is a massive expansion driven by increasing demand and a fixed supply model.
Bitcoin’s early years were defined by sharp price swings and thin liquidity. In 2013, the asset surged from under $50 to more than $600 before retracing below $300 by 2015.
These cycles repeated over time, with each rally followed by a correction.
In 2017, Bitcoin crossed $1,000 and later accelerated higher before entering another downturn. By 2021, it had climbed past $50,000 as institutional participation began to take shape. Pullbacks in 2022 and 2023 tested conviction, but the broader trend remained intact.
In late 2025, BTC surged above $125,000 before pulling back to $60,000 earlier this year.
Each cycle introduced new participants and strengthened market infrastructure, contributing to a more resilient asset over time.
Historical Bitcoin prices on Saint Patrick's Day
— Bitcoin Magazine (@BitcoinMagazine) March 17, 2026
2012 $5.34
2013: $47
2014: $630
2015: $290
2016: $417
2017: $1,180
2018: $8,321
2019: $4,047
2020: $5,002
2021: $56,825
2022: $41,140
2023: $26,876
2024: $68,845
2025: $83,223
2026: $74,590
HODLpic.twitter.com/8LMFUGZkpX

Institutional access is growing despite Bitcoin’s fixed supply
One of the most significant developments in the current cycle is the expansion of institutional access. Spot Bitcoin exchange-traded funds in the United States have created a direct pathway for large pools of capital to enter the market.
These products have recorded sustained inflows, including single-day totals exceeding $500 million, reflecting strong demand from asset managers, pension funds and retail brokerage accounts. The result is a steady accumulation of BTC within regulated investment vehicles.
As more capital flows through these channels, available supply on exchanges has tightened, reinforcing upward pressure on price.
Bitcoin’s monetary policy continues to differentiate it from traditional assets. The protocol enforces a hard cap of 21 million coins, limiting total supply regardless of demand conditions.
This scarcity is reinforced through halving events, which reduce the rate of new issuance. The most recent halving in April 2024 cut block rewards from 6.25 BTC to 3.125 BTC, lowering the number of new coins entering circulation each day.
Historically, these supply shocks have preceded major upward moves, as reduced issuance meets sustained or increasing demand.
Corporate and traditional finance interest
Beyond financial markets, Bitcoin has gained traction among corporations and policymakers. Public companies have continued adding Bitcoin to their balance sheets, treating it as a reserve asset rather than a speculative position.
Most popular of all these is Strategy, the bitcoin treasury company led by executive chairman Michael Saylor. The company purchased another 22,337 bitcoin for about $1.57 billion last week, continuing one of the largest corporate accumulation strategies in the crypto market.
The acquisition brings the firm’s total holdings to 761,068 bitcoin. Strategy said its cumulative BTC holdings were acquired for roughly $57.61 billion at an average price of about $75,696 per coin.
The stash represents more than 3.4% of the fixed 21 million supply of BTC, reinforcing MSTR’s status as the largest corporate holder of the asset.
Bitcoin’s changing market structure
Bitcoin’s market structure is shifting as ownership consolidates among long-term holders, institutions and corporate buyers. This has reduced the influence of short-term speculation and improved overall stability, even as volatility persists.
Bitcoin has remained resilient through recent turbulence, supported by steady institutional demand and continued accumulation. Analysts point to a clear return of large buyers, with ETF inflows and spot demand helping push prices back above $70,000 after weeks of range-bound trading.
Data shows institutional conviction holding firm. Despite a sharp drawdown since late 2025, ETF outflows have remained limited compared to earlier inflows, signaling that investors are maintaining positions rather than exiting.
This growing base of committed capital reflects a broader shift. Institutional investors entering the market today tend to have high conviction, often allocating with a long-term view rather than reacting to short-term price moves.

Research also highlights the expanding role of ETFs and corporate treasury strategies in reshaping BTC ownership. Institutional vehicles now account for a meaningful share of supply, while a large portion of coins remains inactive, reinforcing the dominance of long-term holders.
At the same time, on-chain data suggests the market may be in a late-stage bear phase, historically tied to accumulation. Analysts say current conditions point to continued consolidation, with long-term investors positioning for the next cycle.
This post From $5 to $75,000: Bitcoin’s Saint Patrick’s Day Prices Shows You the Wild Ride of Bitcoin first appeared on Bitcoin Magazine and is written by Micah Zimmerman.
Bitcoin Magazine

Jack Mallers Confirmed As A Bitcoin 2026 Speaker
Jack Mallers has been officially confirmed as a speaker at Bitcoin 2026, returning to the stage where he made Bitcoin history to share his perspective on Bitcoin’s expanding role in payments, capital markets, and global finance. As Co-Founder and CEO of Twenty One Capital (NYSE: XXI) and Founder and CEO of Strike, Mallers now sits at the intersection of two consequential Bitcoin companies operating today, one reshaping how people spend and save Bitcoin, the other redefining what a publicly traded Bitcoin company can be.
Twenty One Capital launched on the New York Stock Exchange in December 2025, debuting with a treasury of 43,514 Bitcoin — the third-largest public corporate Bitcoin holding in the world, behind only Strategy and MARA Holdings. The company is majority-owned by Tether, the world’s largest stablecoin issuer, and Bitfinex, with significant minority ownership from SoftBank Group, and has committed to operating with public-market transparency, including publishing on-chain proof of holdings for real-time shareholder verification. Speaking on CNBC at launch, Mallers made the mission clear: the company plans to “buy as much Bitcoin as we possibly can” not as a passive treasury vehicle, but as a full Bitcoin-native operating business building capital markets advisory, lending models, and educational media on top of its BTC holdings.
Strike, the company Mallers founded in 2020, has become one of the most widely used Bitcoin financial platforms in the world. Built on Bitcoin’s Lightning Network, Strike allows users to make and receive payments, buy and sell bitcoin with no added fees, and convert their paychecks directly into Bitcoin all without requiring prior crypto experience. In March 2026, Strike received both a BitLicense and a money transmitter license from the New York State Department of Financial Services, allowing the company to operate in one of the most tightly regulated digital asset markets in the United States. “Strike is building the leading Bitcoin financial institution,” Mallers said in a statement. “With our BitLicense, we can now bring that mission to New York, the global center of finance.”
With Twenty One Capital now live on the NYSE and Strike completing its all-50-states U.S. expansion, Mallers arrives at Bitcoin 2026 carrying more institutional weight than ever, and the same conviction he’s held since day one: that Bitcoin is honest money, and that the infrastructure being built around it will determine what the next chapter of global finance looks like.
JACK MALLERS, FOUNDER & CEO OF STRIKE AND TWENTY ONE, TO SPEAK AT BITCOIN 2026
— The Bitcoin Conference (@TheBitcoinConf) March 3, 2026
"It's over man, Bitcoin is going to the moon."pic.twitter.com/wHorQFmcYa

Bitcoin 2026 Returns to Las Vegas Bigger Than Ever
Bitcoin 2026 will take place April 27–29 at The Venetian, Las Vegas, and is expected to be the biggest Bitcoin event of the year.
Focused on the future of money, Bitcoin 2026 will bring together Bitcoin builders, investors, miners, policymakers, technologists, and newcomers from around the world. The event will feature a wide range of pass types, including general admission passes designed specifically for those new to Bitcoin, alongside premium passes for professionals, enterprises, and institutions.
With multiple stages, immersive experiences, technical workshops, and headline keynotes, Bitcoin 2026 is designed to serve both first-time attendees and long-time Bitcoiners shaping the next era of global adoption.
Past Bitcoin Conferences in the U.S.
Bitcoin’s flagship conference has scaled dramatically over the past five years:
- 2021 – Miami: 11,000 attendees
- 2022 – Miami: 26,000 attendees
- 2023 – Miami: 15,000 attendees
- 2024 – Nashville: 22,000 attendees
- 2025 – Las Vegas: 35,000 attendees
 Get Your Bitcoin 2026 Pass
Bitcoin Magazine readers can save 10% on Bitcoin 2026 tickets using code ‘ARTICLE10‘ at checkout.
Stay at The official hotel of Bitcoin 2026, The Venetian, and get a guaranteed low rate plus 15% off your pass. Hotel Prices increase soon, be in the middle of where the fun is all happening, and where the networking never ends.
And don’t forget:
Volunteer at Bitcoin 2026 and get Pro Pass access plus exclusive perks.
All students ages 13+ can apply for a Student Pass and get free general admission access to Bitcoin 2026.
 Location: The Venetian, Las Vegas
 Dates: April 27–29, 2026
With tens of thousands of attendees expected and hundreds of major speakers like Jack Mallers already confirmed, now is the time to lock in your ticket.
Buy Bitcoin 2026 Tickets — Save 10%
Why Attend Bitcoin 2026?
Bitcoin 2026 is the definitive gathering for anyone serious about the future of money. With 500+ speakers, multiple world-class stages, and programming spanning Bitcoin fundamentals, open-source development, enterprise adoption, mining, energy, AI, policy, and culture, the conference brings every corner of the Bitcoin ecosystem together under one roof.
From headline keynotes on the Nakamoto Stage to deep technical sessions for builders, institutional strategy discussions for enterprises, and beginner-friendly Bitcoin 101 education, Bitcoin 2026 is designed for everyone—from first-time attendees to the leaders shaping Bitcoin’s global adoption.
Whether you’re looking to learn, build, invest, network, or influence, Bitcoin 2026 is where Bitcoin’s next chapter is written.
Bitcoin 2026 Pass Types: Something for Everyone
Bitcoin 2026 offers a range of pass options designed to meet the needs of newcomers, professionals, enterprises, and high-net-worth Bitcoiners alike.
Bitcoin 2026 General Admission Pass
Ideal for newcomers and those looking to experience the heart of the conference.
- Limited access on Days 2 & 3
- Entry to Main Stage
- Access to Genesis Stage
- Full access to the Expo Hall

Bitcoin 2026 Pro Pass
Designed for professionals, operators, and serious Bitcoin participants.
Includes all General Admission features, plus:
- Full 3-day access, including Pro Day
- Entry to the Pro Pass Reception
- Access to Enterprise Hall, Enterprise Stage, and Networking Lounge
- Conference App networking features
- Access to the Bitcoin For Corporations Symposium
- Entry to Compute Village and Energy Stage
- Complimentary lunch, coffee, tea, and snacks
- Dedicated registration and check-in
- Reserved seating at Main Stage
- Huge savings when you bundle your hotel and Pro Pass

 Bitcoin 2026 Whale Pass
The all-inclusive, premium Bitcoin 2026 experience.
Includes all Pro Pass features, plus:
- Reserved seating at Main Stage
- All-inclusive gourmet food and beverages
- Entry to Whale Night and Whale Reception
- Access to all official after-parties
- Networking app access to connect with other Whales
- Premium access to The Deep — an exclusive networking lounge with intimate speaker sessions
- Complimentary stay at The Venetian when you bundle your whale pass and hotel (use promo code ‘WHALEHOTEL’ here)
This is the most immersive way to experience Bitcoin 2026.

 Bitcoin 2026 After Hours Pass
Your ticket to the night.
Most deals are done with a drink in your hand. Get exclusive access to 3 official Bitcoin 2026 after-parties across Las Vegas — each with a 2-hour open bar — where the real conversations happen and the best connections are made.
- Access to 3 official Bitcoin 2026 after-parties
- 2-hour open bar at each event
- Evening events across Las Vegas, April 27–29
- Network with Bitcoiners, builders, and industry leaders after hours

More headline speaker announcements are coming soon.
Don’t miss Bitcoin 2026.
This post Jack Mallers Confirmed As A Bitcoin 2026 Speaker first appeared on Bitcoin Magazine and is written by Jenna Montgomery.
Bitcoin Magazine

Bitcoin Price Dances Near $75,000 as Market Questions ‘Decoupling’ Narrative
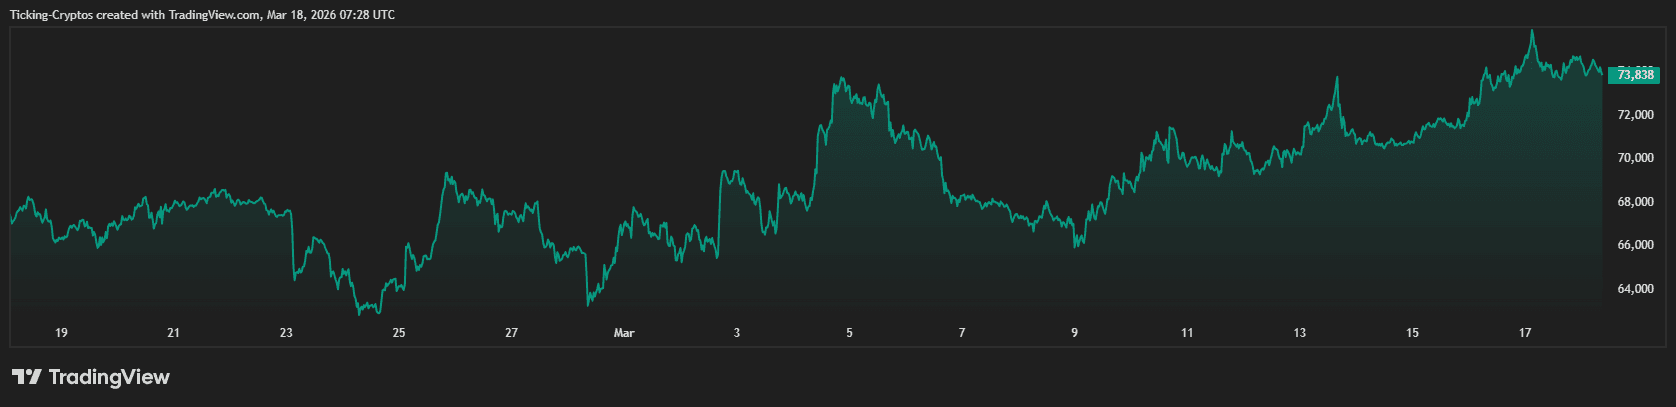
Bitcoin price traded near $75,000 on Tuesday, after extending an eight-day streak that has pushed the asset close to a key psychological level.
The move marks a sharp recovery from February lows near $60,000 and has renewed debate over whether the market has found a bottom.
The world’s largest cryptocurrency broke above $75,000 yesterday during U.S. trading hours after weeks of tight consolidation. The rebound has lifted prices close to early February levels and placed focus on whether bitcoin price can hold its ground.
Analysts at Bitfinex said the recent strength reflects relative outperformance but warned against calling it a structural shift.
“The recent strength above $75,000 does show relative outperformance, but calling it a true ‘decoupling’ is premature,” analysts wrote to Bitcoin Magazine. They pointed to stabilizing ETF flows, fresh demand from new structured products, reduced leverage, and tighter on-chain supply as key drivers.
Bitcoin has outperformed traditional risk assets in recent sessions. Still, analysts noted that it remains tied to broader liquidity conditions. A sustained break from macro correlation would require bitcoin price to continue rising despite tighter financial conditions such as higher yields and a stronger dollar.
For now, the $75,000 to $78,000 range is seen as a critical test. Holding that zone could signal strong spot demand and supply absorption. Failure to do so may suggest the rally is part of a broader positioning reset.
Bitcoin price speculation
Data from Nansen supports the view that the current move is driven by more than speculation. Exchange outflows have remained steady in recent weeks, indicating that investors are moving bitcoin into long-term storage rather than selling into strength.
ETF inflows have also stayed consistent, with roughly $763 million in weekly demand. Corporate buying has added to the trend. Strategy disclosed a $1.57 billion bitcoin purchase, one of the largest this year.
Nansen analyst Nicolai Søndergaard wrote to Bitcoin Magazine that this reflects balance sheet accumulation rather than short-term trading.
“These are balance sheet decisions rather than speculative buys,” he said, adding that derivatives activity has amplified the move. Rising futures open interest and short liquidations contributed to the break above $75,000.
Macro conditions remain a key variable. Geopolitical tensions tied to the Iran–Israel War and shifting expectations around interest rates continue to shape sentiment. Easing concerns around the Strait of Hormuz helped support risk appetite over the weekend.
Markets are now focused on the Federal Reserve’s March 18 decision. A neutral stance could support further upside, while a hawkish signal may trigger profit-taking.
Bitcoin price has staged similar recoveries in past cycles without confirming a lasting bottom. Traders are watching whether the asset can maintain support above $75,000. A sustained hold could open a path toward $80,000.
This post Bitcoin Price Dances Near $75,000 as Market Questions ‘Decoupling’ Narrative first appeared on Bitcoin Magazine and is written by Micah Zimmerman.
Bitcoin Magazine

Bitrefill Discloses Cyberattack, Points to North Korea’s Lazarus Group
Crypto e-commerce platform Bitrefill said it was the target of a cyberattack earlier this month that resulted in stolen funds and limited exposure of customer data, with indicators pointing to the North Korean-linked Lazarus Group as a likely perpetrator.
The breach, which began on March 1, originated from a compromised employee laptop, according to the company’s incident report.
Attackers were able to extract legacy credentials tied to production systems, allowing them to escalate access across Bitrefill’s infrastructure, including segments of its internal database and certain cryptocurrency hot wallets.
Bitrefill said the attackers drained an undisclosed amount of funds from its hot wallets while also exploiting its gift card inventory systems to place suspicious purchases with vendors. The company did not specify the total financial impact but stated it will absorb the losses using operational capital.
The intrusion was first detected through irregular purchasing patterns and anomalies in supplier activity.
In response, Bitrefill temporarily took its systems offline to contain the breach across its global operations. The company said services, including payments and account access, have since returned to normal levels.
As part of the attack, approximately 18,500 purchase records were accessed. The exposed data includes email addresses, cryptocurrency payment addresses and metadata such as IP addresses.
Around 1,000 of those records involved encrypted customer names, which are being treated as potentially exposed due to the possibility that attackers accessed encryption keys. Bitrefill said it has notified affected users directly.
Despite the breach, the company emphasized that it stores minimal personal data and does not require mandatory know-your-customer verification for most transactions. Any KYC-related information is handled by external providers and is not stored within Bitrefill’s systems. The firm added there is no evidence that its full database was exfiltrated or that customer data was the primary target.
“Based on our investigation and logs, we don’t have reason to think that customer data was the objective,” the company said, noting that the attackers appeared to conduct limited queries consistent with probing for valuable assets such as cryptocurrency holdings and gift card inventory.
North Korea’s Lazarus Group was involved
Bitrefill cited several indicators linking the attack to the Lazarus Group, including similarities in malware, reused infrastructure such as IP addresses and email accounts, and on-chain transaction patterns.
The group, often associated with North Korea, has been tied to some of the largest crypto thefts in recent years through its specialized subgroup, Bluenoroff.
Cybersecurity firms including zeroShadow, SEAL911 and RecoverisTeam assisted in the response and investigation, alongside on-chain analysts and law enforcement. The company said it is implementing additional security measures, including expanded monitoring systems and internal controls, to prevent similar incidents.
The attack highlights ongoing concerns around state-sponsored cyber threats in the digital asset sector.
According to blockchain analytics firm Chainalysis, groups linked to North Korea were responsible for more than $2 billion in crypto thefts in 2025, accounting for a significant share of total illicit activity in the space.
Bitrefill said operations have stabilized following the incident and expressed confidence in its recovery, noting that customer activity and sales volumes have returned to typical levels.
This post Bitrefill Discloses Cyberattack, Points to North Korea’s Lazarus Group first appeared on Bitcoin Magazine and is written by Micah Zimmerman.
CryptoSlate
Bitcoin has mostly traded around $74,000 on Wednesday as investors waited for the Federal Reserve's policy decision. However, as of press time, Bitcoin has just lost the $73,500 support, with a route to $72,000 now in sight.
The meeting is expected to leave the federal funds target range at 3.50% to 3.75% while updating projections for inflation, growth, and unemployment after the Middle East conflict pushed energy prices higher.
The policy rate itself has drawn less attention than the Fed's quarterly projections and Chair Jerome Powell's press conference. Andre Dragosch, Bitwise Europe's head of research, said:
“Markets price in no change by the Fed today. Focus will most likely be on forward guidance / SEP = `dot plot' and comments about geopolitical risks & energy today.”
Notably, President Donald Trump has pressed Powell to cut borrowing costs immediately, yet investors have moved in the other direction as oil surged and the inflation outlook worsened.
According to Reuters, futures markets now imply one quarter-point rate cut this year, in September, and another in late 2027, a path that is far tighter than the White House has advocated.
For crypto traders, that has turned Wednesday's meeting into a test of whether Bitcoin can extend a recovery that has carried it back into the mid-$70,000s, or whether a firmer Fed message will keep the market pinned below the next major options and psychological threshold near $80,000.
The setup has become more sensitive because the central bank is dealing with a fresh energy shock at the same time that labor indicators have weakened and a leadership transition is approaching in Washington.

Oil shock reshapes the rate outlook
The Fed entered this meeting with the economy already losing momentum before the conflict added another inflation channel.
US gasoline prices averaged $3.79 a gallon as of Tuesday, more than 25% above where they stood before the war began.
Due to this, economists such as KPMG's Diane Swonk expect policymakers to mark up their inflation and unemployment forecasts and reduce their growth outlook, reflecting a policy backdrop that has shifted from a relatively orderly easing debate to a broader dispute over how much inflation risk the Fed can absorb.
Recent US data support that tension. The Commerce Department reported core PCE inflation at 3.1% year over year in January, the highest reading since March 2024, while fourth-quarter GDP growth was revised down to 0.7%.
The labor picture also softened, with the nonfarm payrolls falling by 92,000 in February and the unemployment rate rising to 4.4%.
Those figures leave the Fed balancing a jobs market that has lost momentum against an inflation trend that remains above target before any full pass-through from higher energy costs.
That mix is central to Bitcoin's current macro narrative. Through much of the past two years, the flagship digital asset has often traded as a proxy for easier financial conditions, lower real yields, and expanding liquidity.
Wednesday's meeting carries a different set of inputs. A Fed that raises inflation forecasts, keeps the median path restrictive, and signals caution on cuts would reduce the case for a rapid expansion in risk appetite, even if digital assets have held firmer than some equity benchmarks during the latest geopolitical shock.

Powell's term adds a second clock for markets
A second timeline is also in play. Powell's current term as chair ends on May 15, 2026, though his term as a member of the Board of Governors runs until Jan. 31, 2028, according to the Federal Reserve.
That distinction has become important for investors trying to map policy beyond Wednesday's decision. A chair transition that once looked straightforward has become less certain as Trump's nominee, former Fed Governor Kevin Warsh, remains stuck in the Senate.
Warsh's nomination remains on hold while the legal fight around the Justice Department's investigation of Powell continues. So, if Warsh is not confirmed by the June 16-17 FOMC meeting, Powell would continue leading rate-setting meetings even after his chair term ends.
That possibility extends the window during which markets may still be trading Powell's policy framework, even as Trump continues to signal his preference for lower rates and a different leadership style at the Fed.
For Bitcoin, this adds a second layer of interpretation to the Fed meeting. Investors would be reading Wednesday's projections for clues about 2026, and they would also be weighing how much of the medium-term path could change once the leadership question is settled.
That does not guarantee a cleaner policy path for crypto or broader risk assets. A delayed transition, Senate friction, and continuing legal disputes around Powell all add uncertainty to the schedule that investors had expected to guide the second half of the year.
Bitcoin's rebound meets a policy test
Bitcoin has recovered from the sharp slide that took it under $60,000 earlier this quarter, yet the market is still trading far below the record levels seen late last year.
Citigroup cut its 12-month Bitcoin target to $112,000 from $143,000, citing stalled progress on US crypto legislation and a narrower window for regulatory catalysts that could support ETF demand and broader institutional adoption.
In the same note, Citi described $70,000 as an important level for BTC as the market awaits policy and legislative direction.
However, industry experts believe BTC could aim higher given the current corporate accumulation, which remains part of the support structure. Crypto market maker Wintermute said:
“The setup is more constructive than it has been in months. The Coinbase premium reset, ETF inflows, and institutional desk flows all point in the same direction. The mid-$60s appears to have attracted a real floor of institutional bids.”
For context, Bitcoin ETFs are currently on their strongest inflow streak since last October, with seven days of consecutive positive cash additions totaling $1.1 billion.
At the same time, Strategy (formerly MicroStrategy) continues to add to its BTC holdings aggressively. The firm has acquired more than 40,000 BTC this month, lifting its holdings to 761,068 Bitcoin.
These purchases show that the market's largest corporate buyers are still adding exposure at prices close to where Bitcoin trades now, even with rate uncertainty unresolved.
That steady demand has helped build a base of buyers beyond short-term macro traders and exchange-driven momentum accounts.

Considering this, the next technical and derivatives reference point sits near $80,000. CME Group said in a March 6 market note that the $80,000 call strike carried high open interest, making it a focal level for market participants.
That shows where traders have concentrated exposure as Bitcoin attempts to stabilize after a deep first-quarter drawdown. A move toward that level after the Fed decision would likely pull more attention from options desks and short-term hedgers, especially if Powell leaves the door open for easing later this year.
The post Fed decision tonight will likely decide whether Bitcoin gets past $80k or fall further appeared first on CryptoSlate.
Mastercard agreed to pay up to $1.8 billion for BVNK, a stablecoin infrastructure firm that connects blockchain payments with traditional banking rails.
The deal includes $300 million in contingent payments and closes what Mastercard told investors would have taken too long to build internally: the ability to move money seamlessly across fiat and on-chain systems for remittances, payouts, P2P transfers, and B2B payments.
The acquisition is part of a broader race with Visa to establish an early lead in stablecoin-based payment systems.
The card networks are absorbing the best parts of blockchain technology before it gets big enough to threaten them.
BVNK had held takeover talks with both Mastercard and Coinbase, with the process appearing further along with Coinbase before the exchange walked away.

That dual interest from a crypto-native giant and a legacy payments giant signals something broader than a single company's acquisition strategy.

Both sides now agree about the stack's importance
Coinbase wanted BVNK because stablecoin infrastructure is strategically valuable to crypto-native firms. Mastercard wanted BVNK because that same infrastructure is now strategically valuable to traditional payment giants.
The real signal is that both camps agree that the stablecoin middleware layer, such as orchestration, licensing, compliance, conversion, and payout rails, has become too important to leave in other hands.
That middleware includes the technical and regulatory scaffolding needed to connect stablecoins with existing financial systems.
BVNK holds licenses across multiple geographies, has recently highlighted MiCA licensing and stablecoin partnerships with Visa Direct, and has built the infrastructure to handle treasury flows, cross-border settlement, and enterprise payouts.
Mastercard's press release says digital currency payment volume reached at least $350 billion in 2025, while McKinsey, working with Artemis, estimates actual stablecoin payments at about $390 billion annualized.
Despite those numbers still being small relative to global payments volume, as McKinsey puts stablecoins at roughly 0.02% of total flows, they are large enough that payment firms now treat the category as strategic rather than experimental.
| Company | What it wanted | Why BVNK matters | Strategic implication |
|---|---|---|---|
| Mastercard | Faster entry into stablecoin payments | BVNK connects blockchain payments to fiat rails for remittances, payouts, P2P, and B2B flows | Incumbents are buying the rails instead of waiting to build them |
| Coinbase | Stablecoin infrastructure scale | BVNK’s middleware stack covers orchestration, licensing, compliance, conversion, and payouts | Crypto-native firms also view the stack as strategically essential |
| BVNK | Middleware layer | Licenses across jurisdictions, Visa Direct pilot tie-in, enterprise payouts and settlement infrastructure | The highest-value layer may be the connective tissue, not the token itself |
The bull case holds that stablecoins become a serious competitive payments and deposit product faster than expected.
Regulatory clarity broadens, enterprise issuance and settlement scale up, and Standard Chartered's January estimate of $500 billion in bank-deposit migration to stablecoins by 2028 becomes more plausible.
Mastercard's acquisition of BVNK fits that timeline: the company is paying for infrastructure that accelerates its entry into lower-cost, faster digital payment systems.
The bear case holds that the infrastructure land grab outpaces actual commerce.
Visa's crypto chief told Reuters that stablecoins still lack widespread merchant acceptance. Under this scenario, deals like BVNK look more defensive, and the main near-term revenue comes from enterprise settlement and back-end money movement.
Why Visa's moves reinforce the thesis
Visa is making similar moves. In January, Visa's stablecoin settlement volumes had reached an annualized run rate of $4.5 billion.

Visa and Stripe-owned Bridge then said in March that their stablecoin-linked cards were already live in 18 countries and planned to be in more than 100 by year-end.
Besides, Visa's settlement pilot allows some issuers and acquirers to settle with Visa using stablecoins. At the same time, BVNK separately said in January that it would power stablecoin payments for Visa Direct pilot programs.
That combination of Mastercard-BVNK, Visa's settlement expansion, and Bridge's card rollout paints a consistent picture: the card networks are building stablecoin capability as a complement to their existing rails.
Stripe's February conditional OCC approval to establish a national trust bank through Bridge adds another layer.
If the regulator grants a final approval, Bridge could offer digital asset custody, stablecoin issuance, and reserve management services under federal banking supervision.
Mastercard also launched a Crypto Partner Program last week with more than 85 crypto-native firms, payment providers, and financial institutions, framing the next phase of on-chain payments as collaboration with established rails.


The regulatory backdrop that made this possible
The timing reflects a mix of regulation, competitive urgency, and early commercial proof.
Mastercard cited increased regulatory clarity in multiple geographies. In the US, President Donald Trump signed the GENIUS Act in July 2025, creating a federal framework for stablecoins.
The argument has since shifted to how much stablecoins can compete with banks and card networks for deposits and payment flows.
Banks are fighting over how far stablecoins can compete for customer balances, with Standard Chartered estimating stablecoins could pull $500 billion in deposits from US banks by 2028.
With a federal framework in place and multiple jurisdictions developing stablecoin rules, the window of opportunity narrows.
Payment giants that move early can shape how stablecoins integrate with existing systems, influence compliance standards, and lock in partnerships with the best infrastructure providers.
For crypto investors, the takeaway is that stablecoins are increasingly where real commercial adoption is happening: remittances, payouts, treasury flows, card-linked spending, business payments, and cross-border settlement.
The pattern also suggests that the next winners in crypto may be less-visible infrastructure companies.
Stripe bought Bridge in 2024, Bridge won preliminary OCC approval for a national trust bank in February 2026, Visa partnered with Bridge on stablecoin-linked cards, and now Mastercard is buying BVNK.
The risk for crypto-native companies is that value accrues to the orchestration and distribution layers rather than to the token or protocol layer.
If Visa and Mastercard control merchant acceptance, enterprise treasury integration, and global payout networks, then stablecoins become a rail that runs through legacy systems.
That outcome favors stablecoin issuers and the broader payment layer, while challenging the theory that crypto would entirely disintermediate traditional finance.
The contest for control
The current disruption thesis holds that card networks are absorbing the most valuable parts of stablecoin infrastructure while the traffic is still building.
Visa is expanding its stablecoin cards and settlement services. Stripe owns Bridge and now has a conditional OCC path into the trust bank infrastructure. Mastercard just bought BVNK.
Stablecoins are becoming a new layer of money movement, and the battle for value capture is shifting toward who controls acceptance, compliance, treasury orchestration, and enterprise distribution.
| Layer | Example players | What they control | Why it matters |
|---|---|---|---|
| Merchant / enterprise distribution | Visa, Mastercard | Acceptance, relationships, payouts, settlement access | Controls scale and monetization |
| Middleware / orchestration | BVNK, Bridge | Compliance, conversion, treasury routing, cross-border rails | Connects stablecoins to real finance |
| Issuance layer | Stablecoin issuers | Token supply and reserves | Essential, but may capture less downstream value |
| Protocol / token layer | Public blockchain ecosystems | Base settlement rails | May provide utility without owning customer relationships |
The incumbents are adapting quickly by acquiring infrastructure, launching pilots, signing partnerships, and shaping regulatory frameworks, while stablecoin payment volume remains small enough to absorb.
That gives them a positional advantage: by the time stablecoins reach meaningful scale in real-world commerce, the card networks will already own the best middleware, have established the compliance standards, and control the merchant relationships that determine if stablecoins become a viable alternative to traditional payments or another input into existing systems.
Mastercard's acquisition of BVNK is a sign that stablecoins are graduating from crypto-market utility to mainstream payments infrastructure.
The post Crypto tried to cut out Visa and Mastercard — now they’re buying up blockchain companies appeared first on CryptoSlate.
Citigroup cuts Bitcoin and Ethereum targets as slower US policy timeline trims the upside case
Citigroup has cut its 12-month targets for Bitcoin and Ethereum, lowering its Bitcoin forecast to $112,000 from $143,000 and its Ethereum forecast to $3,175 from $4,304.
The March 17 revision marks a sharp step down from the bank’s December view and ties that reset to slower US legislative progress, a delay that Citi said is weighing on the policy support it had expected to help drive ETF demand and wider adoption.
The cuts are large enough to change the shape of the one-year crypto outlook without turning Citi bearish on the two assets.
Bitcoin’s new target is about 21.7% below Citi’s prior forecast, while Ethereum’s new target is about 26.2% below the earlier call. Both new targets still sit above current market prices.
Based on the latest CryptoSlate figures, Citi’s revised Bitcoin target still implies roughly 51.8% upside from spot, while its revised ether target implies about 36.8% upside.
Citi still expects Bitcoin and Ethereum to rise over the next year. But it has sharply lowered the ceiling it sees for both assets because the bank no longer expects the same pace of regulatory progress, institutional demand, and network follow-through that shaped its December forecasts.
For a market that has already bounced in recent weeks, the downgrade reads less like a call for immediate downside and more like a warning that the path higher may be slower and narrower than the earlier bull case assumed.
That warning lands as both assets have posted recent gains. Bitcoin trades around $74,000, up 4.5% over seven days, and 7.5% over 30 days. Ethereum sits near $2,300, up 12% over seven days, and 15% over 30 days.
The downgrade arrives as the market has recovered tactically, even as one of Wall Street’s largest banks has lowered its one-year expectations.

Citi’s new targets still point higher, but the one-year range has narrowed
Citi’s revision follows a much more upbeat set of targets published in December. At that point, the bank set a 12-month Bitcoin target of $143,000 and a 12-month ether target of $4,304, while also outlining a Bitcoin bull case of $189,000 and an Ethereum bull case of $5,132 in a December report.
The earlier view leaned on regulatory easing and increased adoption. The new view keeps the basic upside case alive, but resets it lower because that policy timeline has not moved as fast as Citi expected.
In practical terms, the bank is saying the market may still move up over the next year, but the fuel it expected to push prices much higher has not arrived on schedule. That is a narrower and more cautious claim than the one Citi made at the end of last year. It also shifts the focus away from pure price prediction and toward the mechanism behind the forecast.
Citi’s December case depended on regulation, ETF demand, and adoption, reinforcing one another. Its March revision suggests that the sequence now looks less certain and less immediate.
The numbers show that clearly.
| Asset | Prior 12-month target | New 12-month target | Target cut | Current price | Implied upside to new target | 7-day move | 30-day move |
|---|---|---|---|---|---|---|---|
| Bitcoin | $143,000 | $112,000 | 21.7% | $73,777.10 | 51.8% | 4.55% | 7.51% |
| Ethereum | $4,304 | $3,175 | 26.2% | $2,320.12 | 36.8% | 12.7% | 15.38% |
The table captures the contradiction at the center of Citi’s revision. Prices have improved over the last week and month, especially for Ethereum, but Citi has still lowered its one-year targets. That suggests the bank is questioning whether the forces needed to sustain a larger move are strong enough to restore the December outlook.
That is especially relevant for Ethereum. Ethereum has outperformed Bitcoin over both the seven-day and 30-day windows in the latest market snapshot. Even so, Citi cut Ethereum's target by a larger percentage than Bitcoin’s, pointing to a more cautious view of the medium-term case for ETH than short-term price action alone would suggest. In other words, recent strength has not been enough to offset Citi’s concerns around adoption, policy timing, and the broader demand backdrop.
For Bitcoin, the change is slightly different. Citi still sees more than 50% upside from current levels, which means the bank has not rejected the broader institutional case for BTC. But by cutting the target from $143,000 to $112,000, it has marked down how far that case can travel in the next year under current conditions.

That leaves Bitcoin with a still-positive but less expansive upside profile, one that depends more heavily on steady inflows and less on a rapid policy tailwind.

ETF flows and market performance show support is still there, but Citi is looking past the rebound
According to Farside, spot Bitcoin ETFs recorded $199 million in net inflows on March 16, bringing cumulative net inflows to $56.3 billion. Spot Ethereum ETFs posted $36 million in net inflows, with cumulative net inflows of $11.8 billion.
Those numbers show real demand is still present. But they also help explain why Citi’s revision is more nuanced than a simple bearish call. The issue is whether the current pace of flows, combined with a slower policy timeline, is strong enough to support the much higher targets Citi set in December. On that question, the bank’s answer now appears to be no.
That shift is easier to see when the December and March narratives are placed side by side. In December, Citi tied its targets to regulatory easing and wider adoption.
In March, it cut those same targets because US legislative progress had been slower than expected, according to the March 17 report. The underlying change is not that crypto prices have stopped moving. Citi is saying the policy and demand sequence it expected to amplify those moves has not come together fast enough.
That leaves markets in an unusual position. Bitcoin and Ethereum have both recovered in recent weeks. ETF money is still coming in. Yet a major bank has decided that the one-year payoff should be reduced anyway.
That gap between price performance and target revisions is the more useful signal. It says the market can rally in the short run without persuading every large forecaster that the longer-term setup has improved by the same degree.
It also explains why Citi’s downgrade does not read like a call on day-to-day trading. The bank is cutting a 12-month target, not predicting a near-term crash. That distinction matters. Targets are about the scale of the move over time, not whether prices can keep rising over the next few sessions or even the next few weeks.
By that standard, Citi’s message is straightforward: the market can still go up, but the room above spot is smaller than the bank thought a few months ago.

The next test is whether policy and flows can rebuild the case Citi cut back
The main variable behind Citi’s reset is Washington. In January, Senate Banking Committee Chair Tim Scott announced a digital-asset market structure markup for Jan. 15, then postponed it on Jan. 14 as negotiations continued, according to the committee’s statement and follow-up update. Senators are still working to unlock the stalled CLARITY Act through a compromise tied to stablecoin yield.
That timeline shapes Citi’s reset because it is the clearest reason the bank has given for lowering its targets. A slower policy track delays legislation and weakens confidence that a friendlier rule set will arrive soon enough to accelerate ETF demand, corporate participation, and other forms of institutional adoption within the next year.
The mechanism is concrete: if the policy step slips, the adoption step can slip with it, making price targets tied to that adoption harder to defend.
For Bitcoin, the next question is whether spot ETF inflows can keep building even without a cleaner legislative backdrop. If they can, Citi’s new target could still prove conservative. If inflows flatten or lose momentum, the bank’s cut may look early rather than late.
The same structure applies to Ethereum, but with a tighter margin for error. Ethereum's recent gains have been stronger, yet Citi’s target cut was deeper. That means ETH needs not only continued price support, but stronger evidence that usage and institutional demand can justify a higher one-year ceiling.
None of that requires a dramatic break in either direction. The data already in hand points to a narrower, more conditional setup. Citi still sees upside from current prices. ETF flows remain positive. Both Bitcoin and Ethereum have risen over the last month. But the one-year case now depends more heavily on whether policy negotiations start producing results and whether flows remain strong enough to replace the optimism Citi stripped from its December forecasts.
The next few months should show whether that caution was warranted. A legislative breakthrough, stronger ETF inflow streaks, or firmer adoption data could rebuild the case for higher targets.
More delays in Washington, softer flows, or weaker follow-through from recent market gains would support Citi’s decision to lower the bar.
For now, Citi’s revision leaves crypto with a live but reduced upside case, and with a clear test ahead, whether policy and demand can catch up to the prices that have already moved.
The post Citi slashes Bitcoin target by $31,000 despite rising prices as Washington delays stall crypto breakout appeared first on CryptoSlate.
Bitcoin is heading toward its first real recession-era test as a mature institutional asset after Moody’s recession model rose to 48.6%, a level that, in that historical series, has not previously been reached without a recession following within 12 months.
The historical ‘point of no return' signal arrives as US growth slows, the labor market weakens, oil trades above $100, and Bitcoin has started to post gains over the past week and month.
That combination sets up a clearer test than the brief COVID downturn: whether Bitcoin trades like a risk asset when the economy softens the slow way, or holds up as an alternative asset when confidence in traditional markets starts to fray.
The macro case behind that framing is no longer thin. US real GDP growth slowed to 0.7% annualized in the fourth quarter of 2025 after 4.4% in the third quarter, based on revised figures.
February payrolls fell by 92,000, and unemployment held at 4.4%, according to Labor Department data. Initial jobless claims stood at 213,000 for the week ending March 7, and weekly claims data fit a softer labor backdrop in a slowing economy.
At the same time, the current Sahm Rule reading sits at 0.27, still below the 0.50 recession trigger.
The New York Fed’s yield-curve model is also less alarmed, with a 12-month recession probability of 18.8%.
That split leaves a clear tension in the data. Moody’s does not capture the whole macro picture, yet the signal is strong enough to drive Bitcoin analysis. It now points to a recession risk zone that collides with a market Bitcoin has never seen before, deep ETF ownership, large fund flows, and the highest ever level of institutional participation.
CryptoSlate data currently shows Bitcoin at $73,777, up 0.05% over 24 hours, 4.55% over seven days, and 7.51% over 30 days, with a $1.48 trillion market cap, $55.59 billion in daily volume, and 58.5% market dominance.
| Indicator | Latest reading | What it shows |
|---|---|---|
| Moody’s recession probability | 48.6% | Recession risk has moved close to the model’s historical danger zone |
| Q4 2025 real GDP growth | 0.7% | Growth slowed sharply from Q3’s 4.4% |
| February payrolls | -92,000 | Hiring weakened instead of expanding |
| Unemployment rate | 4.4% | Labor conditions remain softer than late-2025 levels |
| Initial jobless claims | 213,000 | Layoffs are not yet flashing a full recession signal |
| Sahm Rule | 0.27 | Below the 0.50 threshold that has historically marked recession starts |
| NY Fed recession probability | 18.8% | Other major models remain less alarmed than Moody’s |
| Brent crude | $103.43 | Oil is adding inflation pressure to an already weaker economy |
Why this setup looks different from COVID
The easiest comparison for crypto markets is March 2020. It is also the least useful one for this analysis. The National Bureau of Economic Research dated the COVID recession from March 2020 to April 2020, making it the shortest US recession on record.
Markets moved through a shutdown shock, then through an unusually fast policy response, and then into a sharp rebound. Bitcoin crashed with everything else in the first leg, while the episode left open the larger question of how it behaves in a slower recession with weaker growth, weaker hiring, and a longer stretch of pressure on risk appetite.
The current setup is broader and less concentrated in a single event. Growth had already slowed before the latest Middle East shock. Payrolls had already turned down.
The outside-world pressure point is oil. Brent crude recently traded at $103.43, while a separate energy analysis shows the Strait of Hormuz handled 20.9 million barrels per day in the first half of 2025, around 20% of global petroleum liquids consumption. The chokepoint feeds directly into fuel, shipping, and consumer prices at a moment when the growth backdrop is already weaker.
The historical comparison that fits better is the Great Recession, with one obvious limitation: Bitcoin did not exist then.
The Great Recession ran from December 2007 to June 2009, with a 4.3% peak-to-trough GDP decline and unemployment rising from 5% to 9.5% by June 2009, according to Federal Reserve history.
There is no direct market record for how Bitcoin would trade from the start of a long, broad recession. It launched in 2009, after the downturn had already taken hold.
The next 12 months could therefore produce the first clean read on whether Bitcoin still trades mainly as a liquidity-sensitive asset or can keep attracting capital during a drawn-out slowdown.
That distinction carries more weight now because the ownership structure has changed. Bitcoin is no longer a niche retail market reacting only to internal crypto events. It now sits inside portfolios that also hold equities, bonds, commodities, and cash.
Fund flow data show the tension clearly. CoinShares reported $619 million of inflows in the week of March 9 and about $1.4 billion of inflows over three weeks since the Iran crisis began. Those figures point to institutional demand after months of outflows, even as recession risk and geopolitical stress rise.


What the next 12 months could do to Bitcoin
The next question is straightforward. If the economy slips into recession without a quick reset, Bitcoin has to show whether it behaves like a high-beta trade that gets sold when liquidity tightens, or a harder asset that can absorb flows when confidence in traditional markets weakens. Both outcomes still fit the available data.
The case for resilience starts with relative behavior. Bitcoin is up over the last seven and 30 days even as recession odds rise and oil markets stay tense. Weekly fund flow data have also turned positive again.
If that pattern holds while labor and growth data worsen, the market will have stronger grounds to argue that Bitcoin is reacting differently from earlier risk-off periods. That would be the strongest evidence yet that part of the market sees Bitcoin as a policy hedge, an inflation hedge, or simply an asset outside the banking and sovereign debt system.
The bear case is just as clear. A normal recession often becomes a liquidity story before it becomes an inflation or monetary story. If payroll weakness deepens, claims rise, and investors cut risk across portfolios, Bitcoin could still trade like a risk asset first. Any identity shift would then have to wait.
The oil shock sits at the center of that risk. Higher oil prices can delay easier policy by lifting inflation pressure even as growth fades. That combination is rough for speculative assets because it removes the clean “bad growth equals lower rates” path that can support markets in a plain slowdown.
| Bitcoin metric | Latest reading | Why it matters |
|---|---|---|
| Spot price | $73,777.10 | Bitcoin is holding well above prior cycle levels despite recession fears |
| 24-hour change | 0.05% | Short-term price action is flat rather than disorderly |
| 7-day change | 4.55% | Bitcoin has gained during a period of rising macro stress |
| 30-day change | 7.51% | Momentum has remained constructive over the last month |
| Market cap | $1.48 trillion | The asset is large enough to influence broader portfolio allocation |
| 24-hour volume | $55.59 billion | Liquidity remains deep enough for institutional trading |
| BTC dominance | 58.5% | Bitcoin continues to take a larger share of crypto market value |
| Distance from all-time high | 41.55% below | Bitcoin is recovering and still trading below full price-discovery territory |
Staying on the current trajectory would keep recession fears elevated without full confirmation from layoffs or claims. In that setup, Bitcoin could stay volatile while outperforming equities on a relative basis if fund flows remain positive.
A bull case would require that pattern to strengthen, weaker macro data, continued inflows, and rising Bitcoin dominance. A bear case would show up in broad de-risking, negative flow reversals, and Bitcoin selling off alongside equities.
However, a black swan event would pair a deeper oil shock with worsening growth, creating a stagflation-style squeeze that could hit Bitcoin first and then support an “outside money” allocation if markets lose confidence in a quick policy response.
What to watch next
The next checkpoints are clear.
- The labor market comes first. Another weak payroll report, a rise in unemployment, or a move higher in jobless claims would make the Moody’s signal harder to dismiss. The Sahm Rule is also worth watching because it is still below the line that has historically marked the start of recession. If it moves toward 0.50, the argument shifts from elevated odds to firmer confirmation.
- Oil is the second checkpoint. If Brent stays above $100 or moves higher, markets will have to deal with rising inflation pressure and weaker growth at the same time. That would likely tighten the test for Bitcoin.
- The third checkpoint is flows. If Bitcoin investment products continue to attract money while recession odds rise, the case for relative resilience strengthens. If those flows reverse quickly, markets are still treating Bitcoin as a liquidity trade rather than a macro shelter.
For now, the data support a stronger line than generic macro uncertainty and a narrower line than a full recession call. Moody’s says the odds are high enough to take seriously. GDP and payroll data support the slowdown narrative.
Other gauges still show less urgency. Bitcoin now sits at the center of a test it has never fully taken before, not whether it can survive a sharp shock, but whether it can trade through a slower recession as a mature, institutionally owned asset.
The next payroll print, the next claims update, the next oil move, and the next round of crypto fund flows should decide whether that test is beginning in earnest.
The post Moody’s recession odds hit ‘point of no return’ preparing Bitcoin to show its true market value in 2026 appeared first on CryptoSlate.
Bitcoin is back in focus after another sharp turn higher, with the asset trading at $73,772 on March 17 after hitting an intraday high of $75,937, according to market data. The move matters less as proof of a clean breakout than as evidence that buyers have rebuilt momentum after a punishing February washout.
On Feb. 6, Bitcoin rebounded from a 16-month low of about $60,018 after a broad selloff across risk assets, posting its biggest one-day gain since March 2023. That rebound did not end volatility, but it did mark the point where panic selling started to give way to a more selective bid.
Still below the highs
Even with that recovery, the market is still climbing out of a deep hole. Bitcoin hit a record high above $125,245 in October 2025, and today’s mid-$70,000 range still leaves it far below that peak. Recent trading underscores how quickly sentiment has shifted.
Reuters reported Bitcoin was near $71,021 on March 13 and around $74,298 early on March 17, while the current tape shows the market briefly probing nearly $76,000 before pulling back. That is a meaningful rebound, but not yet a full technical or psychological reset, especially for traders still anchored to last year’s highs.
Macro still controls the tone
Macro remains the dominant backdrop. Global stocks rallied on March 16 as oil prices eased, but Brent still settled above $100 a barrel and traders pushed expectations for a U.S. rate cut further out as they waited for this week’s Federal Reserve decision. Those conditions help explain why Bitcoin’s move higher has looked opportunistic rather than fully risk-on.
Citigroup captured that tension on March 17 when it cut its 12-month Bitcoin target to $112,000 from $143,000, arguing that stalled U.S. crypto market-structure legislation narrows the window for the regulatory catalysts that many expected to support ETF-driven demand and broader institutional adoption.
Citi also said Bitcoin is likely to range-trade around $70,000 as legislative headlines evolve, a reminder that the latest rally still sits on top of unresolved policy risk.
Where G Coin by Playnance fits in
That backdrop also matters for smaller token stories trying to break through Bitcoin’s gravitational pull. Playnance’s G Coin is being positioned as a utility-driven project rather than a simple trading chip. Playnance says G Coin powers its ecosystem and serves as the unified economic layer across products built on PlayBlock.
In its January 2026 white paper, Playnance OÜ describes G Coin as an ERC-20 compatible utility token on Ethereum and its EVM-compatible Playblock Layer 3, with a fixed maximum supply of 77 billion tokens.
The company says the token is designed for digital access, gameplay, reward unlocking, missions, and promotional participation across the Playnance ecosystem.
Utility narrative, speculative market
The same white paper makes clear that G Coin does not confer ownership, governance, dividend, or profit-sharing rights, which is an important distinction in a market that still blurs the line between utility and speculation.
For now, the setup remains simple: Bitcoin is trading well above its February low but still far below its October record, while utility-token stories such as G Coin are trying to gain traction in a macro-sensitive tape.
If BTC can keep holding the low-to-mid $70,000 area, those narratives may get more room to breathe. If the macro picture darkens again, attention is likely to snap back to Bitcoin first.
Disclaimer: This was a sponsored post brought to you by Playnance.
The post Bitcoin price action retests $75k as G Coin by Playnance enters the utility-token conversation appeared first on CryptoSlate.
Cryptoticker
The Bitcoin price is currently navigating a high-stakes consolidation phase, trading at approximately $74,272 during the March 18, 2026, session. After a period of bearish dominance that saw the asset retreat from its 2025 record highs, the market is now testing the resilience of the $74,000 resistance zone.
Bitcoin Price Analysis: Why is BTC Price UP?
Analyzing the BTC/USD 4-hour chart, we observe several key technical patterns that define the current trend.
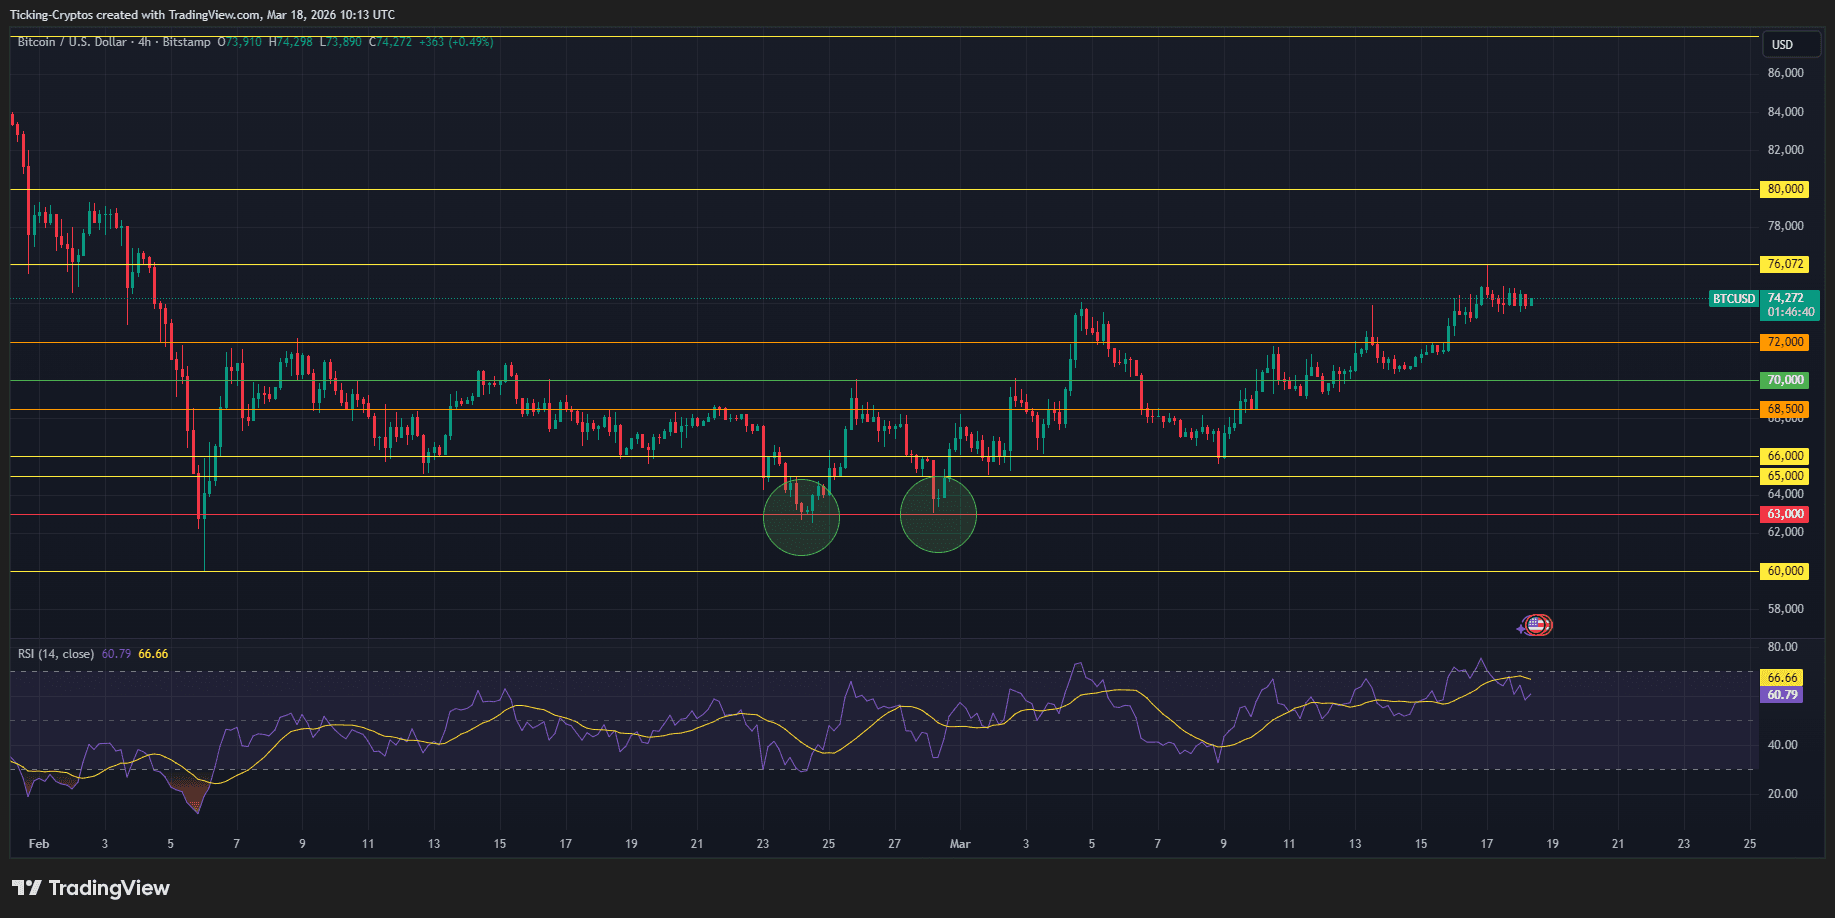
Double Bottom Recovery
The chart highlights two significant "troughs" (marked with green circles) near the $63,000 level. This Double Bottom formation served as a powerful reversal signal in late February and early March, allowing Bitcoin to climb back above the psychological $70,000 mark.
Key Resistance and Support Levels
The price action is currently sandwiched between tightly defined horizontal levels:
- Immediate Resistance: $74,500 – $76,000. A decisive break above this yellow-lined zone is required to target the next major hurdle at $80,000.
- Critical Support: $72,000. If the price fails to hold the $74,000 level, the green support line at $72,000 will be the first line of defense.
- Deep Support: $68,500 and $65,000. These remain the "must-hold" zones to prevent a return to the bear market lows seen earlier this year.
RSI and Momentum
The Relative Strength Index (RSI) is currently hovering around 60.79. While this indicates bullish momentum, the RSI has flattened significantly as the price approaches resistance. This suggests a "cooling off" period or a potential bearish divergence if the price makes a higher high while the RSI fails to follow suit.
Bitcoin News and Macro Catalysts
The broader crypto market is currently characterized by a "Fear" rating on the Sentiment Index (sitting at 26), despite Bitcoin's recent price recovery.
- The FOMC Factor: Traders are bracing for Federal Reserve Chair Jerome Powell’s comments. While interest rates are expected to remain steady, any hawkish rhetoric regarding inflation—driven by $100+ oil prices—could trigger a "sell the news" event for $BTC.
- Institutional Inflows: According to data from Bloomberg, spot Bitcoin ETFs saw a resurgence in March, with nearly $2.8 billion in net inflows, providing a structural floor for the recent rally.
- The Gold vs. Bitcoin Debate: As gold continues to trade near record levels above $5,000, Bitcoin's role as "Digital Gold" is being tested. Many analysts, including those at Fidelity Digital Assets, suggest that capital may rotate back into BTC if gold's parabolic move stalls.
Conclusion: What to Expect Next?
Bitcoin is showing "Experience" and "Expertise" in its ability to hold the $74,000 handle despite a heavy macro environment. However, the information density on the 4-hour chart suggests that the current range is exhausting.
If Bitcoin can flip $76,000 into support, a run toward $80,000 is the most likely scenario. Conversely, a rejection here, coupled with a hawkish Fed, could see a swift retest of the $68,500 support.
- Technical Note: Watch the 4-hour candle close. A close below $73,800 would signal a short-term breakdown, while a close above $75,100 validates the bullish breakout attempt.
The crypto market in early 2026 has been nothing short of a rollercoaster. After the euphoric highs of late 2025, where Bitcoin flirted with the $130,000 mark, a "diffuse cocktail of macro anxieties" has sent prices into a steep correction. As of late mid-March 2026, $Bitcoin has retraced nearly 50% from its All-Time High (ATH), trading in above $73,000.
Is it a Good Time to Buy Crypto?
Historical cycles suggest that corrections of 50% to 70% are healthy "purges" that wipe out over-leveraged traders. With Bitcoin currently sitting at a 50% discount, the risk-to-reward ratio for March 2026 has shifted heavily in favor of the bulls.
As geopolitical tensions and tariff uncertainties stabilize, capital is expected to rotate back into "risk-on" assets. Investors who missed the 2025 rally now have a second chance to enter the market. If you are looking to build a portfolio, diversifying across these five projects offers a balance of stability, utility, and explosive recovery potential.
1. Ethereum (ETH) – The Infrastructure King
Despite the rise of "Ethereum killers," Ethereum remains the undisputed home of Decentralized Finance (DeFi) and Real-World Asset (RWA) tokenization. In 2026, the successful rollout of the "Prague" upgrade has further slashed Layer-2 costs, making the network more scalable than ever.
- Why Buy Now? ETH has followed Bitcoin’s slide, dropping from its 2025 high of $4,950 to under $2,000.
- The Catalyst: Major financial institutions like BlackRock and JPMorgan are increasingly using Ethereum for tokenized deposit pilots. At current prices, you are buying the "settlement layer of the internet" at a 60% discount.
2. Solana (SOL) – The Speed Demon
Solana has proven its resilience after the network reliability concerns of previous years. With the Firedancer upgrade now fully integrated in 2026, Solana can process over 1 million transactions per second.
- Status: While it reached $260 in the last bull run, SOL is currently trading significantly lower, creating a "gap" that savvy traders are eager to fill.
- Use Case: It has become the primary chain for consumer AI-crypto applications and high-frequency trading.
3. Chainlink (LINK) – The Oracle Essential
You cannot have a functional DeFi ecosystem without accurate data, and Chainlink owns 90% of that market. In 2026, its Cross-Chain Interoperability Protocol (CCIP) has become the standard for banks moving data between private and public blockchains.
- The Play: LINK often lags behind the initial BTC pump but rallies hard once the ecosystem matures. It is one of the most undervalued "blue-chip" utility tokens heading into March.
4. Sui (SUI) – The Emerging Contender
Sui has emerged as the breakout Layer-1 of the 2025-2026 cycle. Utilizing the Move programming language, it offers a level of security and parallel processing that older chains struggle to match.
- Growth Potential: Sui's Total Value Locked (TVL) has remained stable even during the February crash, suggesting a loyal and committed developer base. As the market recovers, SUI is positioned to be a top performer.
5. Fetch.ai (FET/ASI) – The AI Narrative
2026 is the year of "AI Agents." Fetch.ai, as part of the Artificial Superintelligence Alliance, is at the forefront of this movement. Their autonomous agents are now being used in logistics and decentralized energy grids.
- Why March 2026? The "AI plus Crypto" narrative is the strongest secular trend in the market. With FET down along with the broader market, it offers a high-beta play for those betting on the continued AI revolution.
Conclusion: Strategy for March 2026
Investing during a 50% Bitcoin drawdown requires a long-term mindset. While volatility may persist in the short term, the fundamental value of these projects remains unchanged. Consider using a regulated exchange to dollar-cost average into these positions throughout the month.
Vietnam is shifting from one of the world's most active unregulated crypto markets to a strictly controlled domestic ecosystem. According to reports from Reuters, the government in Hanoi is preparing to launch a pilot scheme for locally licensed digital asset exchanges while simultaneously drafting rules to ban citizens from using overseas platforms.
The Race for the First Vietnam Crypto License
Five major domestic entities have passed an initial qualification round to operate the country’s first legal exchanges. This move marks a significant transition for a nation that ranked fourth globally on the Chainalysis Global Crypto Adoption Index.
The qualified applicants include:
- Techcombank (TCB)
- VPBank (VPB)
- LPBank (LPB)
- VIX Securities
- Sun Group
Why Hanoi is Curbing Foreign Trading
The Vietnamese government’s primary concern is uncontrolled capital outflows. While the country has high crypto interest, most transactions currently occur on offshore servers, making it difficult for authorities to monitor wealth movement or collect taxes.
By forcing users onto local platforms, Hanoi aims to:
- Regulate Capital: Ensure trades are settled via local banking rails.
- Tax Revenue: Implement a structured tax framework for digital assets.
- Consumer Protection: Bring high-risk trading under the oversight of the Ministry of Finance.
Market Impact and Local Adoption
Currently, Vietnamese traders move over $200 billion annually in crypto. The new regulations will likely push this liquidity into the hands of major local financial institutions. However, digital assets are still not recognized as legal tender or a formal means of payment in the country.
Summary of New Vietnam Crypto Regulations
| Feature | New Policy |
|---|---|
| Foreign Exchanges | Planned ban for Vietnamese nationals |
| Local Exchanges | Pilot program for licensed domestic firms |
| Key Players | Major private banks (VPBank, Techcombank) |
| Objective | Combat capital flight and increase oversight |
Ripple’s native token, $XRP, reclaimed the $1.50 price level. This move comes after weeks of tightening volatility, where the asset was compressed within a massive technical structure. As the broader crypto market shows signs of a renewed bullish cycle, XRP's recent price action suggests that the long-awaited move toward psychological resistance levels may be underway.
XRP Price Prediction: The Road to $2.00
The current technical setup confirms that XRP is targeting the $2.00 milestone. This projection is based on a "measured move" following the breach of a multi-week consolidation pattern. If XRP-USD can maintain its position above the $1.45 support zone, the next liquidity pocket sits between $1.85 and $2.10.
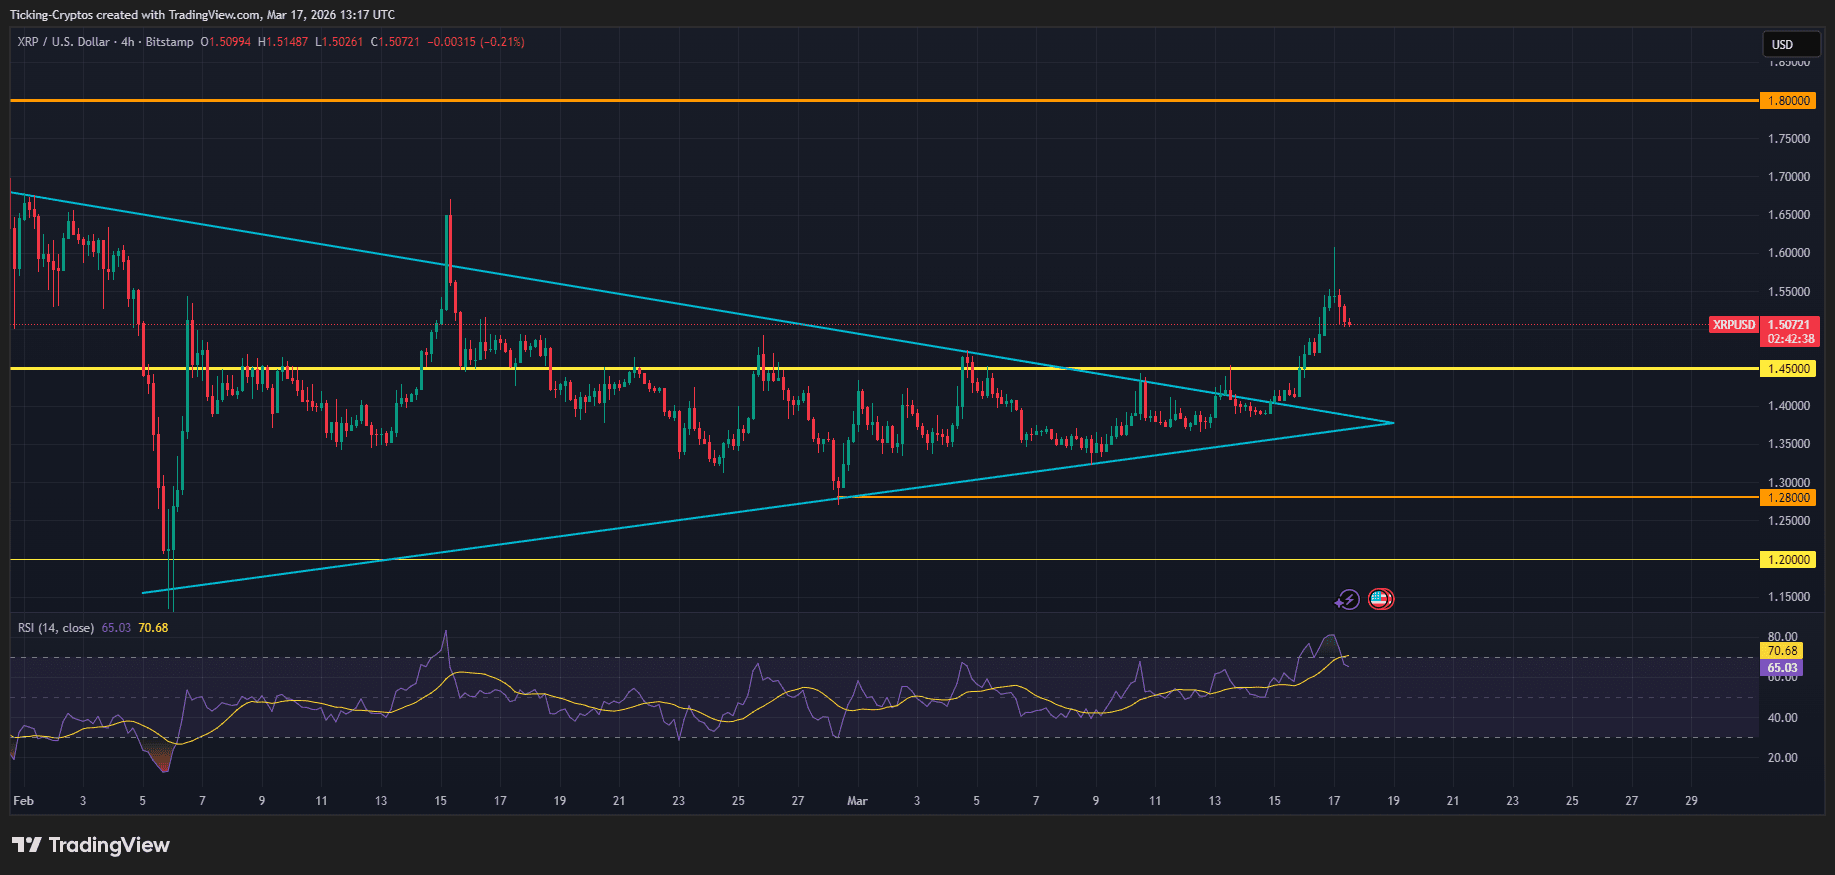
The Symmetrical Triangle
A symmetrical triangle is a chart pattern characterized by two converging trendlines connecting a series of sequential peaks and troughs. In XRP’s case, this pattern represented a period of "equilibrium" where buyers and sellers were in a deadlock. Typically, a breakout from this formation indicates that the prevailing trend—in this case, the bullish momentum from late 2025—is ready to resume with high volume.
The Breakout: How XRP Breached the Triangle
The most critical development in the recent XRP-USD price action is the upward breach from the triangle formation. Since February 2026, XRP has been making lower highs and higher lows, narrowing into an apex near the $1.38 mark.
On March 14, trading volume surged by over 300%, providing the necessary fuel for XRP to pierce the upper descending trendline. This "breach" was not merely a wick but was followed by a daily candle close above the resistance, effectively flipping it into a support floor. Technical analysts often view this specific type of exit from a triangle as a signal that the "accumulation phase" is over and the "markup phase" has begun.
Technical Indicators Supporting the $2 Target
Beyond the triangle breakout, several other indicators point toward a continued rally:
- Moving Averages: XRP is now trading comfortably above its 50-day and 200-day Exponential Moving Averages (EMAs).
- Relative Strength Index (RSI): The RSI is currently at 64, suggesting that while the asset is gaining strength, it is not yet "overbought" (which typically occurs above 70).
- Institutional Inflows: According to data from CoinShares, XRP-specific investment products have seen over $1.3 billion in cumulative inflows this year, providing the structural liquidity needed to sustain a move to $2.00.
Key Support and Resistance
| Level | Type | Significance |
|---|---|---|
| $1.38 - $1.42 | New Support | The previous triangle resistance now acts as a floor. |
| $1.56 | Current Pivot | XRP is consolidating here to build momentum for the next leg. |
| $1.80 | Minor Resistance | A historical supply zone from early 2026. |
| $2.00 | Major Target | The primary psychological and technical goal for the current rally. |
Ethereum (ETH) has bounced back strongly, rising more than 20% over the past eight days. While much of the market focused on Bitcoin’s volatility, Ethereum moved higher in the background. The rally is being driven by growing institutional interest and clearer regulatory support, two factors that are starting to change how major financial players approach the Ethereum network.
Why is Ethereum Price UP?
The recent Ethereum price pump is driven by a convergence of institutional liquidity and regulatory clarity. Specifically, the Federal Reserve's decision to allow tokenized securities as bank collateral and BlackRock’s launch of its iShares Staked Ethereum Trust (ETHB) have provided the necessary fundamental support for ETH to decouple from minor market corrections.
Tokenization and Staked ETFs
To understand why these developments are "game-changers," we must define the two pillars supporting this rally:
- Tokenized Securities: These are traditional assets (like stocks or bonds) represented as digital tokens on a blockchain.
- Staked ETFs: Unlike a standard spot ETF, a staked ETF (like ETHB) actually participates in the network's consensus, earning a "yield" or dividend for its shareholders by securing the network.
1. The Fed’s Green Light: Tokenized Assets as Collateral
On March 6, 2026, the Federal Reserve, alongside the OCC and FDIC, issued a landmark clarification. U.S. banks are now officially permitted to use tokenized securities as collateral for loans.
Why This Matters for Ethereum
Regulators confirmed that as long as the tokenized version confers the same legal rights as the traditional asset, it will receive the same capital treatment. Crucially, the Fed stated this applies regardless of whether the blockchain is permissioned or permissionless (public).
- Liquidity Influx: Trillions of dollars in "off-chain" value (Treasuries, equities) can now migrate to Ethereum.
- Ethereum as the "Settlement Layer": Since Ethereum remains the dominant hub for Real-World Assets (RWAs), this ruling cements $ETH role as the global plumbing for modern finance.
2. BlackRock’s ETHB: The First Dividend-Paying Crypto ETF
On March 12, 2026, BlackRock launched the iShares Staked Ethereum Trust (ticker: ETHB). While the market already had spot ETH ETFs, ETHB is the first from a major issuer to offer staking rewards directly to shareholders.
Key Features of ETHB:
- Yield Generation: The fund stakes between 70% and 95% of its holdings.
- Monthly Distributions: Investors receive monthly cash payouts, similar to a high-yield dividend stock.
- Institutional Infrastructure: BlackRock partnered with Figment and Coinbase Prime to manage the validator sets, bringing "Enterprise-Grade" security to the staking process.
"The ETHB launch transforms Ethereum from a speculative commodity into a productive, yield-bearing asset for the average 401k investor." — Market Insight
Comparison: Spot ETH vs. Staked ETH ETFs
| Feature | Spot ETH ETF (e.g., ETHA) | Staked ETH ETF (ETHB) |
|---|---|---|
| Primary Goal | Price Tracking | Price + Yield |
| Income Source | None | Staking Rewards (~2-3% Net) |
| Risk Profile | Market Volatility | Volatility + Slashing Risk |
| Target Audience | Traders | Long-term Income Seekers |
Fundamental Divergence
For months, analysts have noted a divergence: Ethereum's network fundamentals (Total Value Locked, Active Addresses, and Layer 2 scaling) were hitting record highs while the Ethereum price lagged. This 20% pump suggests the "valuation gap" is finally closing.
Decrypt
Experts warn that Bitcoin ETF inflows remain "episodic" without policy shifts, ahead of today's FOMC meeting.
After a decade of lawsuits, the SEC and CFTC finally wrote the rules for digital assets.
New benchmark study results show leading AI models still lag humans in visual math reasoning.
A cross-party committee has warned that cryptocurrency donations leave UK politics open to foreign interference.
Its license was suspended after regulators accused the Bitcoin ATM operator of overcharging kiosk users and failing to provide some refunds.
U.Today - IT, AI and Fintech Daily News for You Today
A report has revealed that the recent SEC update has driven the social sentiment of XRP, DOGE, and SHIB to a new high.
Capriole Investments founder Charles Edwards outlines the mathematical threshold for Bitcoin's next vertical move. Is $80,000 the ultimate line in the sand?
Stuart Alderoty validates the reclassifcation of XRP as a commodity.
Top crypto leaders react to the SEC's recent decision to offer crypto regulatory clarity once and for all.
Dogecoin's zero removal attempt is no longer relevant in terms of longer-term price performance.
Blockonomi
Key Takeaways
- Tim Cook made an appearance in Chengdu, China, coinciding with Apple’s 50th anniversary celebrations
- The tech giant reduced its App Store fee structure in mainland China to 25% from 30%, starting March 15
- State-controlled media in China has demanded Apple implement additional reforms to App Store policies
- The iPhone 17 lineup has experienced robust sales in China, strengthening Apple’s competitive position
- Analysts maintain a Moderate Buy rating on AAPL stock, with a consensus target price of $304.66
The Apple chief executive made an appearance in Chengdu this Wednesday, attending a company retail location to celebrate Apple’s milestone 50th anniversary. His trip came on the heels of the company’s announcement earlier in March regarding reduced App Store commissions for mainland China.
Apple Inc., AAPL
Beginning March 15, the new 25% commission structure became operational. The revised fee structure covers applications across both iOS and iPadOS platforms, with Apple confirming the adjustment resulted from ongoing dialogue with Chinese regulatory authorities.
This wasn’t merely a ceremonial appearance by Cook. China represents Apple’s third most significant revenue-generating market, and the iPhone maker has been actively working to strengthen its standing after experiencing setbacks in previous years.
The recently launched iPhone 17 series has provided a boost. The latest models have generated substantial consumer interest throughout China, a critical battleground in global smartphone competition, providing Apple with renewed energy before Cook’s strategic visit.
However, regulatory challenges persist. Following Apple’s commission reduction announcement, an editorial in the Chinese Communist Party’s primary publication demanded additional concessions — specifically urging reduced platform limitations and elimination of practices characterized as monopolistic behavior.
Regulatory Scrutiny Intensifies
Apple’s App Store debut in China occurred in 2010. The Chinese platform functions under different parameters compared to its American counterpart — the company has complied with Beijing’s requests to remove certain applications, including WhatsApp’s removal in 2024.
Chinese authorities continue investigating Apple’s approach to in-app purchase commissions and limitations placed on alternative payment providers and external linking capabilities.
This regulatory approach mirrors patterns elsewhere. Throughout Europe, Apple committed in 2024 to providing competitors with no-cost access to its mobile payment infrastructure for a decade, concluding an antitrust probe.
In China, the regulatory momentum continues accelerating. Government officials are pressing Apple for greater platform accessibility, suggesting the 25% commission rate may undergo additional modifications.
Tencent Partnership and Income Streams
Services constitute Apple’s second most substantial revenue category behind iPhone product sales. This context amplifies the significance of partnerships such as the arrangement Apple formalized with Tencent Holdings last November.
The Tencent agreement establishes a 15% commission on expenditures within WeChat’s mini applications and gaming ecosystem — a strategically important arrangement providing Apple access to one of China’s dominant digital platforms.
AAPL stock experienced minimal movement on Wednesday, showing modest gains during pre-market hours. The previous trading session similarly saw limited price action.
Apple’s spring product updates have generated limited investor enthusiasm. Market focus remains concentrated on China’s regulatory landscape and potential additional App Store policy modifications.
Wall Street analysts currently assign AAPL a Moderate Buy consensus rating, derived from 14 Buy recommendations, nine Hold ratings, and one Sell rating issued during the previous three months.
The consensus price target stands at $304.66, suggesting approximately 20% potential appreciation from present trading levels.
Apple’s App Store commission structure in mainland China has been adjusted to 25% from the previous 30% rate, implemented after regulatory consultations — though state-controlled media outlets continue advocating for additional concessions.
The post Apple (AAPL) Stock Rises as Tim Cook Tours China Amid App Store Fee Reduction to 25% appeared first on Blockonomi.
Key Highlights
- TransFi completes $19.2M funding round to scale stablecoin payment infrastructure in developing regions.
- Platform targeting $5B in processed transactions by 2026 using AI-enhanced B2B payment technology.
- Geographic focus includes Southeast Asia, Latin America, Africa, and Middle Eastern markets.
- Stablecoin solutions deliver quicker settlements and reduced transaction costs for business clients.
- Platform connects traditional finance with cryptocurrency for streamlined international payments.
TransFi has closed a $19.2 million funding round designed to enhance its stablecoin payment network throughout emerging economies. The capital raise comprises $14.2 million through Series A equity financing alongside a $5 million liquidity arrangement. Resources will be allocated toward growth initiatives spanning Southeast Asia, South Asia, Middle Eastern territories, Latin American countries, and African nations.
This financial injection positions TransFi to expand operational capacity while pursuing comprehensive regulatory approval across various jurisdictions. Strategic priorities include acquiring enterprise merchants and integrating additional corporate partners. The company is simultaneously advancing its AI-powered payment technology tailored for business-to-business applications.
TransFi’s existing network encompasses operations in over 70 nations, facilitating transactions in more than 40 traditional currencies alongside 100 digital assets. The platform delivers integrated capabilities spanning payment collection, disbursement, currency conversion, and transaction settlement. Management forecasts approximately $5 billion in total processed payment volume through fiscal year 2026.
Market Penetration and Compliance Initiatives
TransFi is concentrating efforts on regions where conventional banking infrastructure generates obstacles for international money transfers. The company intends to deploy funding toward obtaining regulatory permissions and enhancing compliance protocols. This methodology facilitates efficient operations within developing markets characterized by intricate financial regulations.
The technology delivers accelerated settlement timeframes for business users while minimizing expenses versus traditional correspondent banking channels. TransFi’s architecture supports high-transaction-volume processing across multiple currency denominations concurrently. The artificial intelligence-centered methodology enhances operational productivity and accelerates product innovation.
TransFi has outlined plans to broaden enterprise merchant partnerships throughout priority territories. Platform integration emphasizes incorporating stablecoin capabilities into current financial workflows. Growth strategies prioritize expanding commercial access to digital currency payment options.
Advancing Market Acceptance and Digital Currency Integration
TransFi utilizes stablecoins to enhance transaction velocity and dependability for international money movements. The system accommodates employee compensation distribution, supplier payments, and personal money transfers. Organizations operating in challenging markets gain advantages through expedited transaction completion and diminished operational inefficiencies.
Worldwide stablecoin circulation recently exceeded $315 billion, dominated by Tether and Circle’s offerings. Established financial institutions, including Mastercard and Standard Chartered, are investigating stablecoin integration for payment services. TransFi presents itself as a substitute for inefficient SWIFT-dependent infrastructure and correspondent banking frameworks.
The platform’s methodology unifies traditional currency with digital assets for fluid payment processing. TransFi anticipates sustained expansion in customer adoption and transaction activity. Its technological framework demonstrates that stablecoins deliver practical operational value beyond conceptual financial instruments.
The post TransFi Secures $19.2M Funding Round to Accelerate Stablecoin Payment Solutions in Emerging Economies appeared first on Blockonomi.
TLDR
- Brent crude reached $104.76 per barrel amid U.S.-Israel operations against Iran, disrupting Strait of Hormuz shipments
- Nearly one-fifth of global oil supplies pass through the Strait, where vessel traffic has virtually ceased
- JPMorgan forecasts European energy companies could achieve ~14% free cash flow yields with sustained $100 oil pricing
- Shell, TotalEnergies, Eni, and Galp represent JPMorgan’s preferred investment targets
- Federal Reserve policy decisions may shift as oil price shocks threaten to postpone anticipated rate reductions
Wall Street analysts are turning their focus toward European energy companies as oil prices surge beyond $100 per barrel, fueled by supply disruption concerns stemming from the U.S.-Israel military operations targeting Iran.
On Wednesday, Brent crude futures advanced 1.3% to reach $104.76 per barrel, recovering from earlier session declines. The uptick occurred despite news that Iraq and Kurdish officials reached an agreement to restart crude shipments via Turkey’s Ceyhan terminal, providing modest market stability.
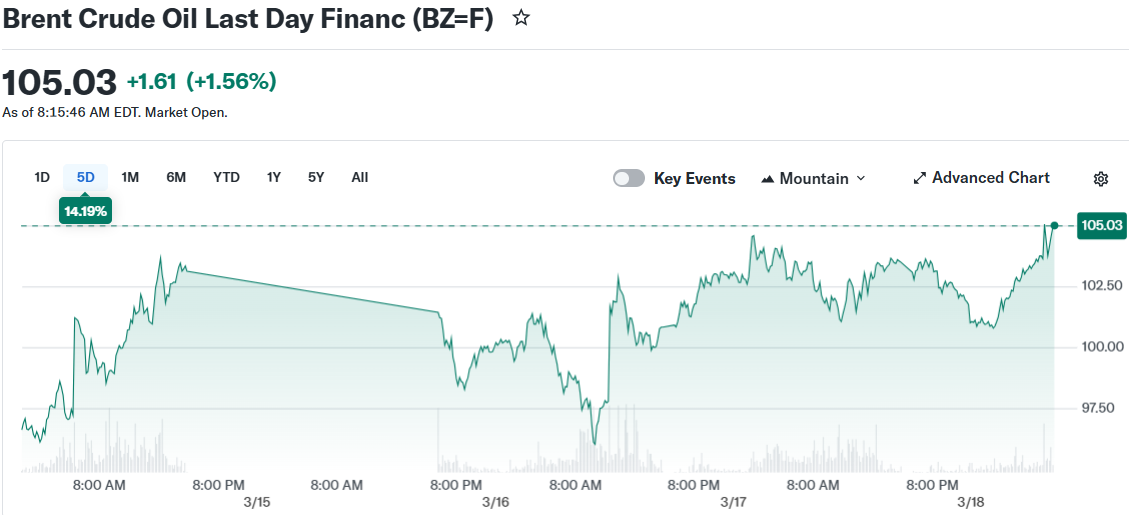
Meanwhile, West Texas Intermediate declined 0.6% to settle at $94.95 per barrel during the same trading period.
Entering its third week, the military conflict has effectively paralyzed maritime traffic through the Strait of Hormuz. American forces have conducted strikes against Iranian coastal installations housing cruise missile systems capable of threatening vessels navigating the critical waterway.
Approximately 20% of the world’s oil supply travels through the Strait of Hormuz, making any prolonged interruption significant for global energy markets.
JPMorgan equity analyst Matthew Lofting characterizes the financial implications for European energy producers as “clearly positive.” His analysis indicates that volume reductions resulting from Hormuz-related disruptions represent approximately $6 per barrel in lost cash generation—potentially reaching $10 for companies with maximum exposure.
This contrasts sharply with the roughly $30 price appreciation in crude markets since hostilities commenced, indicating that price benefits substantially exceed volume-related setbacks for most operators.
Free Cash Flow Yields Could Hit 14%
Lofting’s projections suggest free cash flow generation for European oil producers could climb from approximately 10% based on existing forward curves to around 14% assuming persistent $100 oil pricing. He characterizes current sector valuations as remaining “modestly cheap” relative to metrics observed during 2022’s energy market upheaval.
European energy sector equities have already appreciated more than 10% since the conflict’s inception.
JPMorgan identifies Shell, TotalEnergies, Eni, and Galp as preferred investment opportunities within the sector. The investment bank emphasizes robust price sensitivity, extended production horizons, and attractive valuation metrics as primary selection criteria.
Eni and Shell receive particular attention for their elevated oil price correlation. Galp’s price leverage appears underrepresented in immediate financial projections, according to the analysis.
TotalEnergies, Shell, and OMV maintain the most substantial Middle Eastern asset exposure. Conversely, Equinor, Repsol, and Galp possess minimal direct regional presence, potentially enhancing their responsiveness to immediate price movements.
JPMorgan anticipates exceptional trading results will contribute additional value, with models indicating approximately $4 billion in potential incremental gains for Shell specifically.
Lofting identifies potential windfall taxation as a downside risk, referencing 2022-2023 precedents. His framework incorporates an additional 5% levy on cash generation as a possible constraint.
Fed Meeting Adds Uncertainty
Investors maintained a cautious stance ahead of Wednesday’s Federal Reserve policy announcement. Market consensus anticipates the central bank will maintain its benchmark rate within the 3.5% to 3.75% range.
Fed Chair Jerome Powell, whose tenure concludes in May, is scheduled to address markets following the decision. Observers are particularly interested in commentary regarding how oil market disruptions might influence monetary policy trajectories.
Prior to the conflict, market expectations incorporated a rate reduction during 2025’s latter half. ING analysts suggest the Fed may now indicate postponement of such adjustments.
According to JPMorgan, below-average winter temperatures combined with recent market dynamics position energy trading operations for robust first-quarter performance.
The post JPMorgan Picks Shell, Eni, Galp, and TotalEnergies as Oil Prices Cross $100 Threshold appeared first on Blockonomi.
TLDR
- TD Cowen elevated TTE to Buy status and increased its price objective to $97 from the previous $80
- JP Morgan reaffirmed its Buy stance with a €75 price objective
- Piper Sandler increased its price objective to $92 from $74 while maintaining a Neutral stance
- TTE has initiated the shutdown of certain Middle East operations, representing approximately 15% of production but just 10% of upstream cash generation
- Free cash flow projections indicate approximately $18.5 billion by 2030, with a roughly 10% yield anticipated in 2026
Wall Street has turned increasingly optimistic on TotalEnergies this week, with multiple analyst firms issuing upgrades and higher price targets driven by strengthening confidence in the company’s cash generation trajectory.
TotalEnergies SE, TTE
TD Cowen led the charge with the most aggressive stance, elevating TTE from Hold to Buy and designating it as the firm’s preferred integrated oil company selection. The investment bank increased its price objective to $97 from the prior $80. Analyst Jason Gabelman highlighted industry-leading free cash flow expansion, production growth trajectory, and Return on Capital Employed performance as primary catalysts.
According to Gabelman, TotalEnergies has reached its FCF bottom sooner than market expectations. A gas-to-power transaction completed in late 2025 accelerated the timing of this trough from 2026 to 2025, simultaneously reducing future capital expenditure requirements.
The company’s free cash flow is projected to increase by approximately $11 billion from 2024 through 2030, approaching $18.5 billion. FCF yields are anticipated to reach approximately 10% in 2026, with additional growth potential extending toward 2030. The company’s dividend yield of roughly 5% ranks among the sector’s most attractive.
Production growth is forecasted at approximately 3% annually through 2030. Major developments in Suriname, Qatar LNG capacity expansion, and Namibia are anticipated to generate substantial cash flows spanning 2028 through 2034.
TD Cowen also highlighted TTE’s Integrated Power division, which has achieved approximately 10% returns recently and targets 12% by 2030. Growing data center demand is identified as a significant growth catalyst.
Middle East Exposure
While the overall outlook remains constructive, TTE’s Middle East footprint has created headwinds for the stock compared to industry peers. TD Cowen calculates that roughly 15% of production and 10% of upstream cash generation are tied to the region.
On March 12, TTE announced it had commenced shutting down or preparing to shut down select operations in Qatar, Iraq, and offshore UAE in response to investor requests. The firm clarified that onshore UAE production continues uninterrupted, with exports flowing through the Fujairah Oil Terminal.
TTE also declared force majeure on its Qatari LNG volumes. Gabelman suggested that trading opportunities could potentially compensate for this impact.
Company management emphasized that Middle East production generates lower cash margins due to elevated local tax structures. An $8 increase in Brent crude pricing would sufficiently replace the anticipated 2026 cash flow contribution from Iraq, Qatar, and offshore UAE operations at a $60 per barrel oil price assumption.
Analyst Price Targets
JP Morgan analyst Matthew Lofting reaffirmed his Buy recommendation on TTE, maintaining his price objective at €75.
Piper Sandler’s Ryan Todd elevated his price target to $92 from $74 on March 12, while preserving a Neutral rating. This adjustment followed Piper’s decision to increase its mid-cycle West Texas Intermediate crude forecast by $5 per barrel. The firm pointed to potential sustained impacts from geopolitical tensions involving Iran, which could reduce global oil supply by approximately 2 million barrels per day.
TTE indicated that its expansion in 2026 will predominantly derive from assets located outside the Middle East region.
The post TotalEnergies (TTE) Stock Climbs on Bullish Analyst Calls and Price Target Hikes appeared first on Blockonomi.
TLDR
- Macy’s delivered Q4 adjusted earnings of $1.67 per share, surpassing the Street’s $1.57 expectation
- Top-line revenue declined 1.7% annually to $7.64 billion, narrowly exceeding the $7.62 billion forecast
- Comparable sales climbed 1.8%, significantly outperforming the anticipated 0.9% contraction
- Shares surged 9% during Wednesday’s premarket session following a 23% year-to-date decline
- Fiscal 2026 EPS outlook of $1.90–$2.10 disappointed versus analyst expectations of $2.20
Macy’s (M) delivered a solid fourth-quarter performance on Wednesday morning, propelling shares 9% higher in early trading and offering relief after a challenging year for the stock.
The iconic retailer posted adjusted earnings of $1.67 per share for the final quarter, comfortably exceeding Wall Street’s consensus target of $1.57. Total revenue reached $7.64 billion, representing a 1.7% year-over-year decrease but narrowly topping the analyst projection of $7.62 billion.
Macy’s, Inc., M
The top-line contraction primarily stemmed from strategic store closures executed throughout the previous fiscal period. Adjusting for these closures reveals a more encouraging underlying trend.
Comparable-store sales — tracking performance at locations operating for at least twelve months — increased 1.8%. This figure demolished the expected 0.9% decrease and emerged as a standout metric in the quarterly results.
CEO Tony Spring’s “Bold New Chapter” transformation initiative moved into year two, with continued emphasis on attracting affluent consumers. This strategic pivot materialized across brand performance: the flagship Macy’s banner posted modest 0.4% comparable growth, while Bloomingdale’s surged 8.5% and Bluemercury contributed 2.5% growth.
With shares down 23% prior to the earnings release, even a moderate earnings surprise provided meaningful support.
Guidance Falls Short
For the 2026 fiscal year, Macy’s projected net sales ranging from $21.4 billion to $21.7 billion, with adjusted earnings per share between $1.90 and $2.10. Wall Street had anticipated $21.42 billion in revenue and $2.20 in earnings per share.
While the revenue projection aligns closely with consensus, the earnings forecast misses expectations at both the midpoint and upper boundary.
Executives emphasized a “prudent approach” to forecasting, highlighting macroeconomic volatility and geopolitical uncertainty. Consumer spending patterns remain challenged, especially among budget-conscious shoppers grappling with persistent inflationary pressures.
Ongoing store closures are projected to reduce sales by approximately $145 million this year. While anticipated, this represents a meaningful drag on performance.
Tariff Impact Flagged for Q1
Trade policy represents another critical variable in Macy’s planning. With substantial sourcing from China, the company indicated that tariff-related costs will most significantly impact margins during the first quarter of 2026 — representing the peak pressure period.
Macy’s expressed expectations for tariff headwinds to moderate during the latter half of the year. This outlook mirrors projections from other major retailers, including Walmart and Kohl’s, which have similarly issued conservative annual forecasts.
A recent Supreme Court decision established a standardized 10% tariff rate, though retailers that acquired inventory under higher duty structures continue facing near-term cost challenges as existing stock flows through their systems.
Retailers with significant Chinese supply chain exposure remain particularly focused on first-quarter dynamics. For Macy’s, this translates to a more difficult initial six months before anticipated relief materializes in the year’s back half — assuming projections prove accurate.
The fourth-quarter performance provided investors with tangible positives. Comparable sales advanced 0.4% for the core Macy’s brand, jumped 8.5% at Bloomingdale’s, and grew 2.5% at Bluemercury.
The post Macy’s (M) Stock Surges 9% on Strong Q4 Results Despite Conservative 2026 Outlook appeared first on Blockonomi.
CryptoPotato
Binance revealed it will terminate all trading services for certain cryptocurrencies.
Somewhat expected, the tokens included in the effort nosedived by double digits immediately after the disclosure.
The Latest Announcement
Even though Binance supports a wide range of cryptocurrencies, their presence on the platform isn’t guaranteed forever and depends on factors such as trading volume, liquidity, network security, public communication, team commitment, and more.
Following its most recent review, the exchange decided to delist the altcoins Arena-Z (A2Z), Ampleforth Governance Token (FORTH), Hooked Protocol (HOOK), Loopring (LRC), IDEX (IDEX), Neutron (NTRN), Solar (SXP), and Radiant Capital (RDNT). The effort will take place on April 1 and will lead to the removal of spot trading pairs involving the aforementioned tokens. Meanwhile, Binance Spot Copy Trading will delist those assets on March 25.
“After this time, any outstanding assets will be force-sold at market price or moved to the Spot Account if the amount is unsellable. Users are strongly advised to update or cancel their Spot Copy Trading portfolios prior to Binance Spot Copy Trading delisting time to avoid potential losses,” the company warned.
Deposits of these tokens will not be credited to users’ accounts after April 2, while withdrawals won’t be supported after June 1. Delisted cryptocurrencies may be converted into stablecoins on behalf of customers after June 2, Binance clarified.
Such announcements usually trigger negative price reactions for the affected assets. After all, losing Binance support damages a coin’s reputation, reduces its liquidity, and limits its accessibility. Such was the case here as all of the involved altcoins headed south by double digits. IDEX was the biggest loser, with its valuation collapsing by 33% on a daily scale.
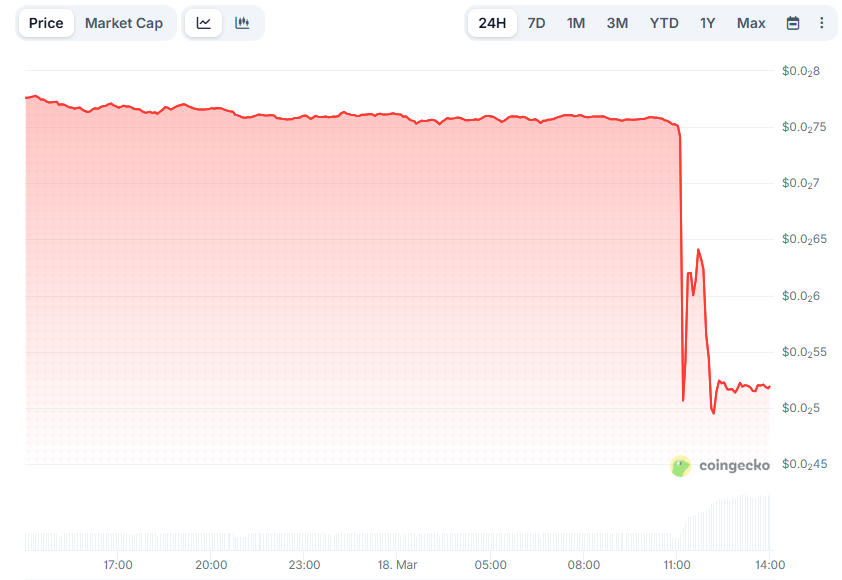
- IDEX Price, Source: CoinGecko
A similar thing was observed last week when Binance removed 21 cryptocurrencies, including WorldShards (SHARD), Alliance Games (COA), BNB Card (BNB Card), MilkyWay (MILK), Hyperbot (BOT), and others. Some of the assets saw their prices crash by an astonishing 70-80% shortly after the news broke.
The Opposite Effect
On the contrary, backing from Binance typically has quite a positive price effect on the involved cryptocurrencies. Earlier this week, the exchange introduced the trading pairs CFG/USDT, CFG/USDC, and CFG/TRY, causing CFG’s valuation to surge 60% within minutes.
At the start of 2026, the lesser-known digital assets Moonbirbs (BIRB) and ETHGas (GWEI) also posted substantial gains after Binance launched the BIRB/USDT and GWEI/USDT perpetual contracts with up to 50x leverage.
The post These Altcoins Crash Hard Following Binance Delisting: Details appeared first on CryptoPotato.
[PRESS RELEASE – Dubai, UAE, March 18th, 2026]
BNB Chain today announced the launch of BNBAgent SDK, the first live implementation of ERC-8183 and a complete developer framework enabling trustless onchain AI workflows. The release represents a major step forward in building the infrastructure needed for autonomous agents to operate at scale, with verifiable workflows, trustless settlement, and decentralized dispute resolution built in.
As AI agents move beyond experimentation into workflows where tangible value is involved, capability alone is insufficient. A key consideration is trust—specifically, the ability to verify results, resolve disputes, and settle payments in a reliable manner without dependence on centralized platforms.
The SDK provides:
- Onchain identity and reputation, built on ERC-8004 Every agent registered through the SDK gets a persistent onchain identity tied to ERC-8004, with a verifiable record of activity and outcomes that builds over time. Rather than being deployed in isolation, agents become discoverable participants that applications and users can evaluate and trust based on their actual track record.
- A standardized job lifecycle, no custom escrow required ERC-8183 establishes a shared protocol covering task creation, funding, execution, and settlement. The SDK puts that protocol directly in developers’ hands, so teams can integrate agent workflows without rebuilding contract logic for every new use case.
- Dispute resolution via UMA’s Optimistic Oracle When agent outputs go unchallenged, jobs settle quickly. When they are disputed, the SDK routes resolution through UMA’s Data Verification Mechanism, where token holders weigh in on the outcome. The process is transparent, decentralized, and doesn’t require either party to trust a third-party intermediary.
- A Python toolkit built for real workflows The SDK packages all of this into a Python developer toolkit with encrypted keystore support included by default. Developers interact with ERC-8183 using familiar patterns rather than writing low-level contract logic, and the architecture is designed to stay flexible as wallet systems and verification models continue to develop.
The code will be released publicly in the coming week, with mainnet to follow. For more information, users can visit the blog HERE.
About BNB Chain
BNB Chain is one of the largest and most active blockchain ecosystems in the world, supported by a global community of developers and users. With high throughput, low transaction costs, and full EVM compatibility, BNB Chain powers scalable applications across finance, gaming, and the broader Web3 economy. For more information, users can visit www.bnbchain.org.
The post BNB Chain Launches BNBAgent SDK, the First Live Implementation of ERC-8183 for Trustless Onchain AI Agents appeared first on CryptoPotato.
PI sellers return in force and threaten to reverse most of the recent gains.
PI Network (PI) Price Predictions: Analysis
Key support levels: $0.15
Key resistance levels: $0.20, $0.28
PI Turns Bearish
With the bullish momentum gone, sellers have returned and have been extremely aggressive, pushing the price under 20 cents this week. Since the recent top at around 30 cents, the price has dropped by over 40%!
The spike above the 28-cent resistance was short-lived and turned into a bull trap since the price failed to hold there and quickly reversed course. This was a key weakness signal that encouraged sellers to push harder and the price gave in soon after.
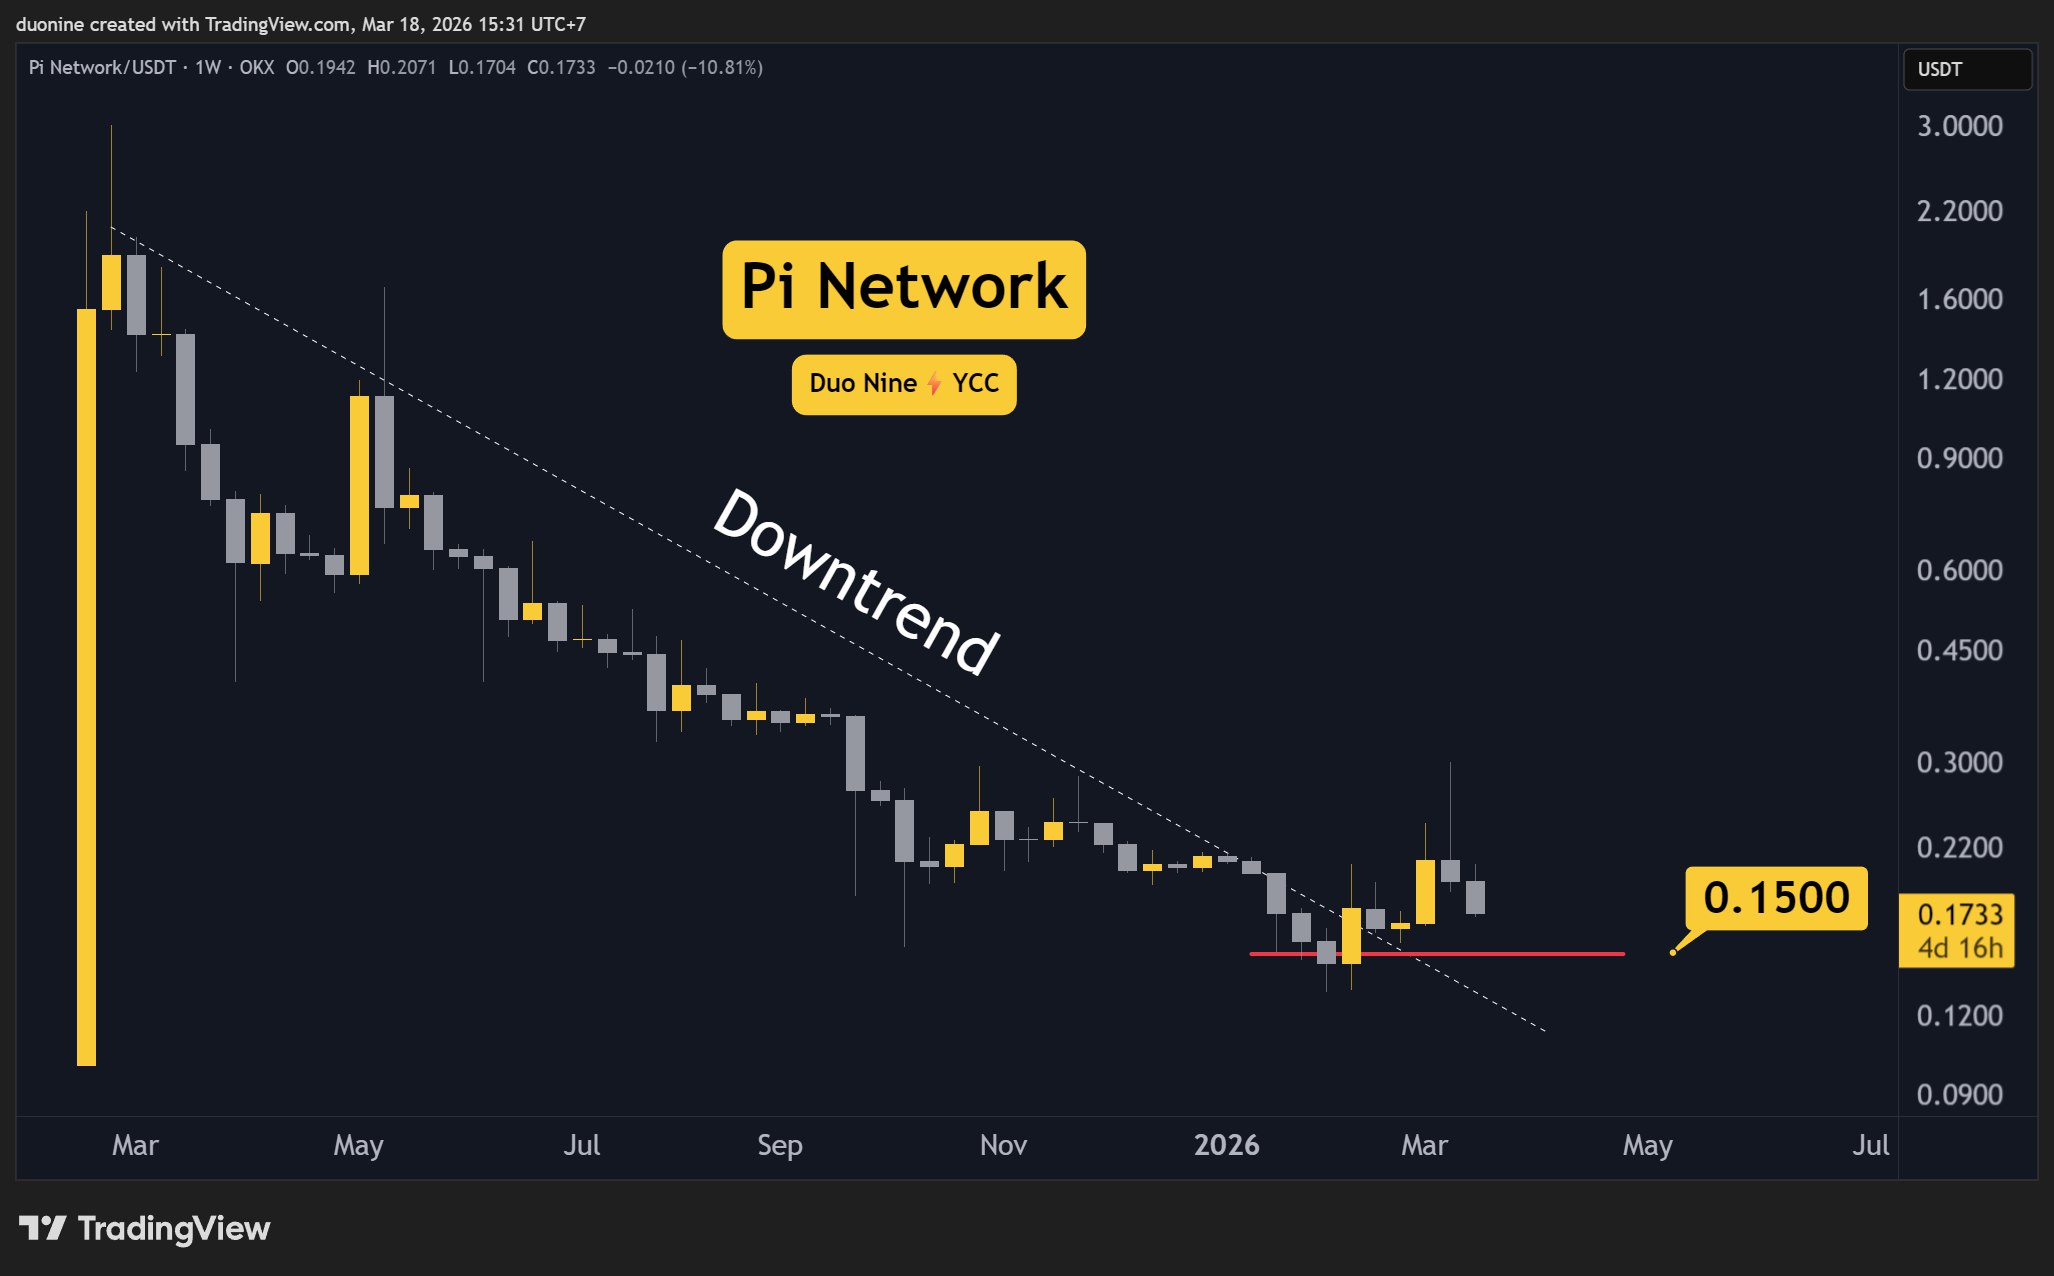
Sell Volume Spiked
During the recent rally, the sell volume spiked, which was a key reversal signal. Since then, the price has been making lower highs and lower lows. The most likely support level to stop this downtrend is at 15 cents.
It is critical for PI bulls to defend the $0.15 support, as any failure there would erase all recent gains and even open the way for new lows later on. In the near future, this support is likely to be tested. Wait for that moment to gain insights into where PI will be headed next.

Daily MACD Turned Bearish
Another key signal that momentum was shifting bearish was seen on the daily MACD, which turned negative last Sunday. Since then, the downtrend has intensified, and there are no signs that it will stop anytime soon.
Keep a close eye on the support at 15 cents for any possible reversal. An early signal would be if the daily MACD histogram stops making lower lows. That would indicate sellers are becoming exhausted, and buyers have an opportunity to return.

The post Pi Network (PI) Price Predictions for This Week appeared first on CryptoPotato.
Bitcoin’s market share is stuck between 58% and 60%, which is a six-month trading range that one expert says will decide whether Ethereum and smaller altcoins enter a bullish season or suffer more losses.
As such, the market observer urged keeping an eye on the level at which dominance could break, ushering in the next big move in the crypto market.
The Narrow Corridor Controlling Crypto’s Fate
Bitcoin dominance (BTC.D), which measures how much of the total cryptocurrency market cap BTC makes up, was stuck between 58% and 60% for the last 6 months. But according to analyst Ash Crypto, this consolidation has created a technical setup where a break above 60% could send dominance up to 63% or 64%.
And if that happened, it would mean that institutions are only buying Bitcoin, causing altcoins to bleed further and pushing the value of the ETH/BTC pair to new lows.
On the other hand, a break below 58% would mean that capital is leaving Bitcoin and going into Ethereum and other altcoins. The analysts said that this would confirm an ETH/BTC breakout above the 0.0320 level, which would mark the start of a genuine altcoin season.
The ETH/BTC pair itself is printing what Ash Crypto described as a bear trap, something it has done twice before.
“Break above 0.0320 and ETH starts outperforming Bitcoin,” the expert wrote. “Break below 0.0280 and new lows follow.”
At the time of writing, ETH/BTC was trading close to 0.0314, just below the critical threshold Ash Crypto had identified.
Ethereum’s Technical Picture Gets Interesting
BTC itself has been mostly flat over the past 24 hours, staying just above $74,000 after hitting a six-week high of about $76,000 on Coinbase on Tuesday. However, there’s much more action over longer periods, with the asset up more than 6% in the last seven days and about 8% across 30 days.
Ethereum has had a pretty good performance in the last few weeks, going up about 14% in the last seven days and about 18% in both the last 14 and 30 days. At the time of writing, it was trading above the $2,300 level, up 22% from the same time last year, compared to BTC’s nearly 11% drop in the same period.
At the same time, ETH’s SuperTrend indicator changed from “Sell” to “Buy” for the first time since September 2025. Recall, the last two times that signal showed up, the cryptocurrency rose by 52% and 174%, respectively, prompting analyst Ali Martinez to identify $2,400 and $2,600 as the next levels to watch.
The post Analyst Warns BTC Dominance Break Will Dictate Whether Alts Explode or Collapse appeared first on CryptoPotato.
XRP just tested the key $1.6 resistance level. Can it break it?
Ripple (XRP) Price Predictions: Analysis
Key support levels: $1.4
Key resistance levels: $1.6
XRP is Challenging the Key Resistance
As expected, XRP has rallied all the way to the key resistance at $1.6. Buyers tried to break this level, but sellers returned to defend it. At the time of this post, the price is found in a pullback as it consolidates under this level.
Buyers will need more force and momentum if they want to break this resistance. That becomes possible if the volume increases, since so far, volume levels have been rather flat. This shows some hesitation here from market participants.
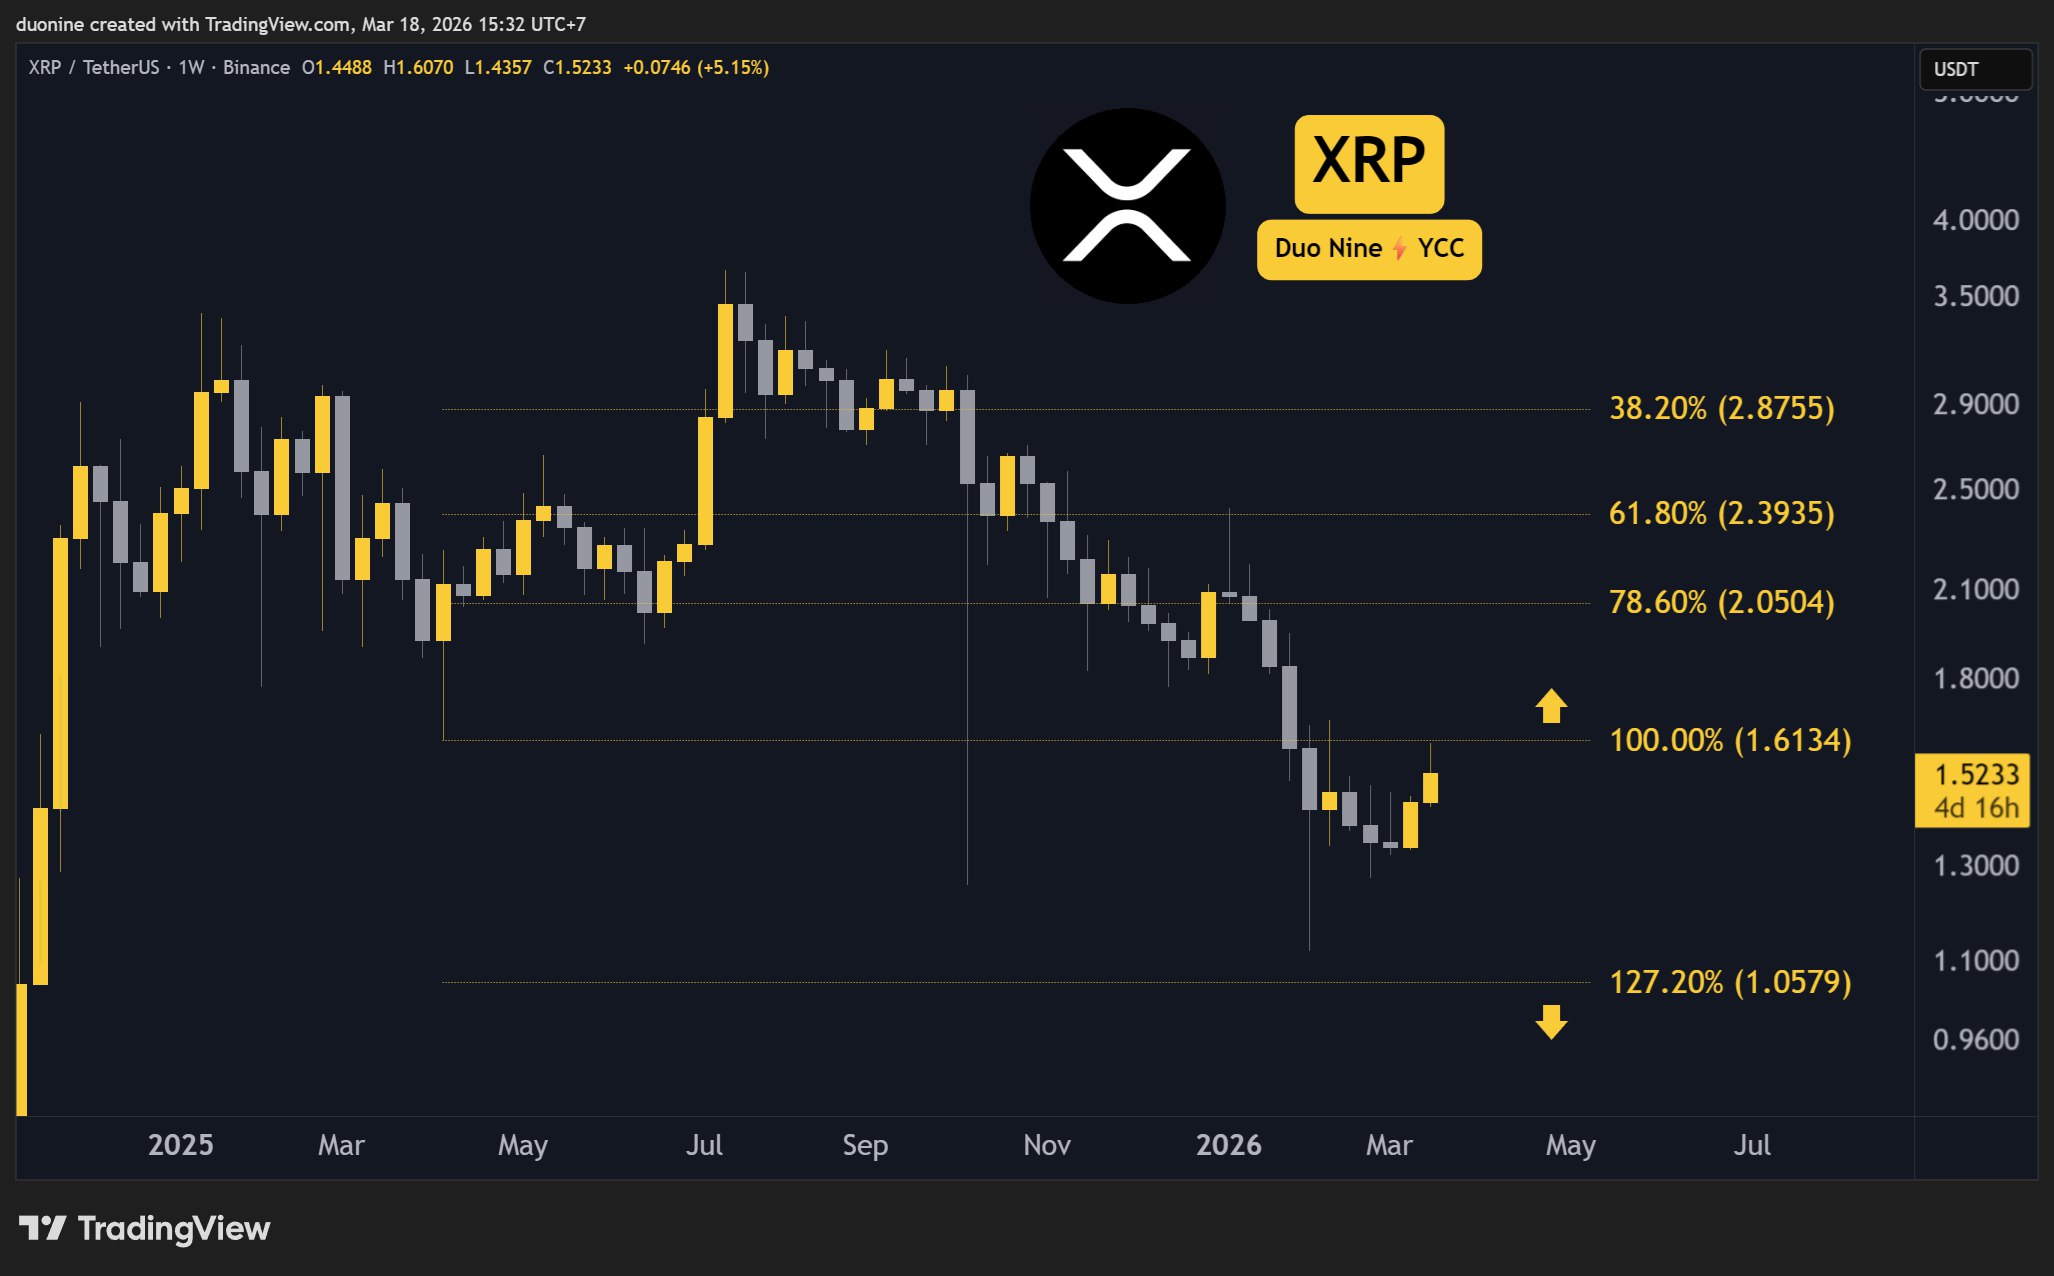
Is a Reversal Possible?
If bulls can turn $1.6 into key support, then this downtrend is likely over, and a sustained reversal will follow, sending XRP back to $2 and beyond. However, this price action remains too uncertain to be confident about such an outcome.
Should the overall market remain bullish with Bitcoin moving above $75k, then XRP has a good shot at higher levels. On the other hand, if the market remains flat, then XRP will also struggle to move above $1.6.
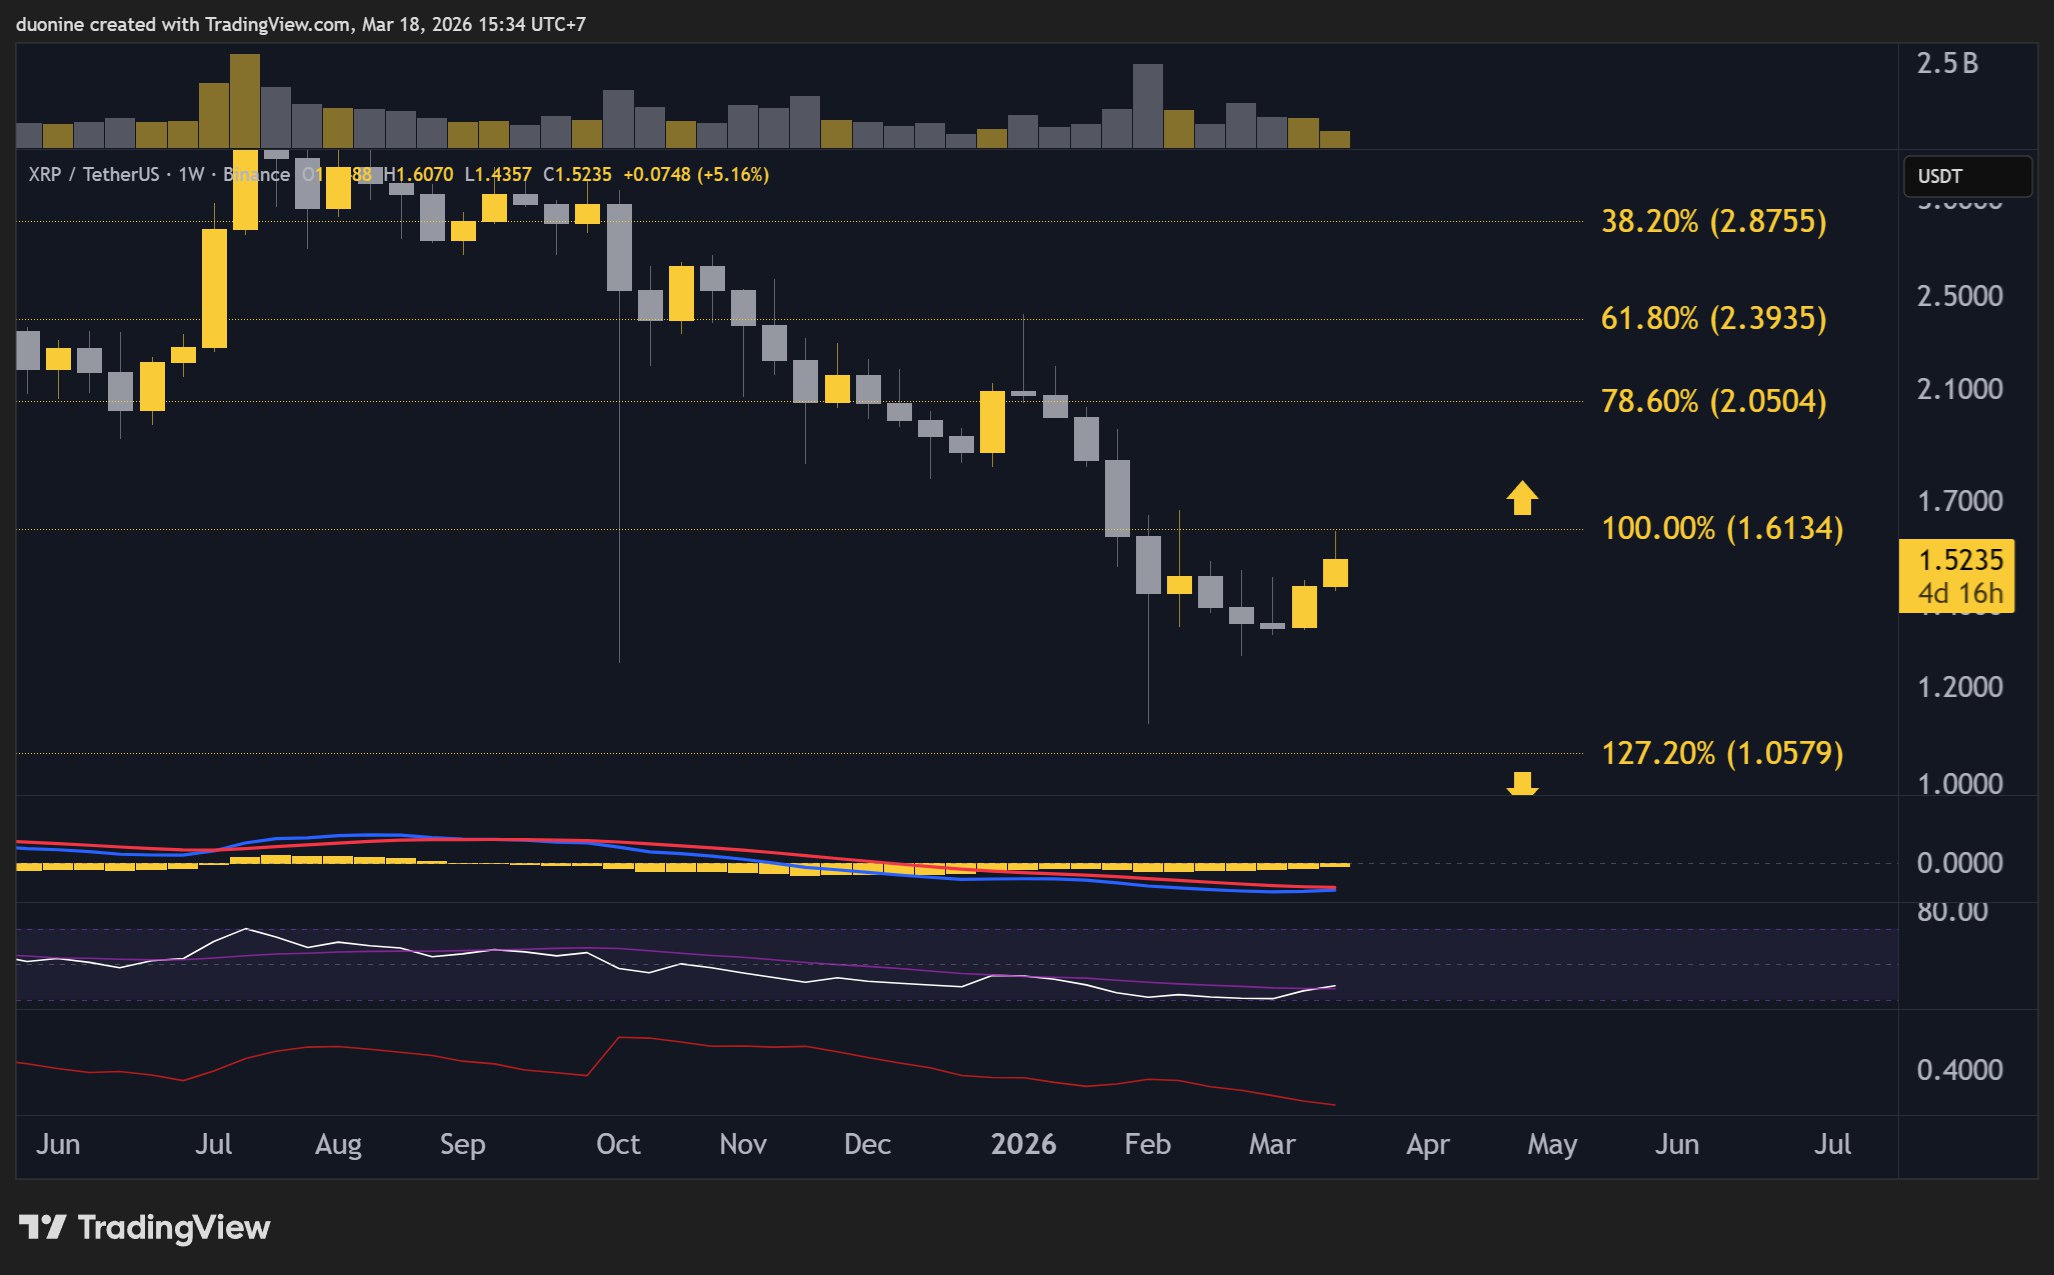
RSI Bullish Cross
On the weekly chart, the RSI just made a bullish cross, which is an early signal that a major reversal could be ahead of us. While this is still early, a price above $1.6 would confirm this breakout and see buyers return in force.
Best to be patient here and let the price develop to build confidence. Ideally, the RSI will continue to make higher highs, which would be a clear signal that sellers have lost control.

The post Ripple (XRP) Price Predictions for This Week appeared first on CryptoPotato.