Cryptocurrency Posts
Crypto Briefing
Robinhood Chain's fee surge highlights the potential for consumer brands to rapidly drive blockchain adoption, benefiting ecosystems like Arbitrum.
The post Robinhood Chain hits record $3.75M in daily fees, funneling hundreds of thousands to Arbitrum DAO appeared first on Crypto Briefing.
Japan's aggressive yen intervention highlights global currency market volatility and the challenges of divergent central bank policies.
The post Yen strengthens 1% against US dollar amid intervention concerns appeared first on Crypto Briefing.
The Leipzig attack heightens EU-Russia tensions, increasing the risk of military conflict and emphasizing the rise of hybrid warfare tactics.
The post Kallas: Leipzig attack shows signs of state-sponsored terrorism appeared first on Crypto Briefing.
The incident highlights the critical need for robust oracle security in DeFi, as vulnerabilities can lead to significant financial losses and protocol shutdowns.
The post Full Sail shuts down after $91K security incident linked to Switchboard oracle compromise appeared first on Crypto Briefing.
Hyperliquid's HYPE token joins Hashdex's NCIQ ETF as the fifth-largest holding at 3.36%, sitting behind Bitcoin, Ethereum, XRP, and Solana.
The post Hyperliquid’s HYPE token debuts in Hashdex’s NCIQ ETF at 3.4% weighting appeared first on Crypto Briefing.
Bitcoin Magazine
Bitcoin Magazine

Bitcoin Slides as US-Iran Tensions Escalate
Bitcoin slid on Tuesday after investors went into “risk-off” mode following escalating attacks between the U.S. and Iran.
The largest cryptocurrency had initially shrugged off President Donald Trump’s threats to the Middle Eastern nation, as well as the first strikes.
But things heated up on Tuesday, and bitcoin’s price slid. It was recently down more than 2% on the day, trading for $77,363. The coin had pushed past as high as nearly $81,282 on Friday.
The Tuesday attacks from the U.S. were because Iran tried to put mines in the Strait of Hormuz, and also because of an attack on an American military base in Jordan, according to President Trump.
U.S. Central Command said on X that Iran had also attacked commercial ships.
“The strikes follow recent attempted attacks by the Islamic Revolutionary Guard Corps against commercial shipping in the Strait of Hormuz and against American service members deployed to the region,” the post read.
Iran responded with a “decisive operation” against U.S. military bases, according to Iranian media. Oil surged on the news.
Bitcoin’s price has been sensitive to geopolitical tensions this year — especially after Iran and Israel attacked Iran. The cryptocurrency has typically faced downward pressure on news of war, only to then rally when Trump raised hopes of a ceasefire.
Despite Bitcoin’s price being relatively muted, in recent months, it has made more wild swings since mid-August.
Bitcoin’s immediate reaction to rising oil prices is to drop: more expensive energy means higher inflation, and higher inflation typically means the U.S. central bank will postpone rate cuts, which can restrict the liquidity that bitcoin needs to gain momentum.
The Federal Reserve’s chair, Kevin Warsh, last week gave his first major speech as leader of the central bank and said that inflation in the world’s largest economy had not come down enough.
Traders are now no longer pricing in an interest rate cut this year, instead expecting a hike. Bitcoin has typically performed well in the past in low interest rate environments.
Still, the coin had one of its best runs in August after the U.S. Treasury said it would at least double the size of its liquidity-support buyback operations, in response to surging borrowing costs.
The announcement hurt the dollar but non-yielding assets like bitcoin and gold have benefited.
This post Bitcoin Slides as US-Iran Tensions Escalate first appeared on Bitcoin Magazine and is written by Mathew Di Salvo.
Bitcoin Magazine

Bitcoin Defies Seasonal Slump With Third-Best August Ever
Bitcoin is known for its summer slumps. But August was different.
In fact, the leading cryptocurrency had its third best August ever.
As highlighted on Tuesday by Bitwise’s European Head of Research, André Dragosch, bitcoin delivered returns of 25% last month.
“No ‘summer lull’ so far,” Dragosch wrote on X, highlighting that the only better Augusts the coin has had were in 2017 when it gave investors returns of nearly 66%, and 2013, with close to 31%.
OFFICIAL: August 2026 is in the books and it's been the 3rd best August in bitcoin's history.
— André Dragosch, PhD
August 2017: +65.6%
August 2013: +30.7%
August 2026: +25.0%
No "summer lull" so far. pic.twitter.com/jwHt2VP5Sk(@Andre_Dragosch) September 1, 2026

Multiple analyses point to the months of June-September showing weaker average returns than the rest of the year.
Throughout most of June and July, bitcoin’s volatility was particularly muted, and the coin traded below $65,000.
But that changed in mid-August after the U.S. Treasury Department said it would more than double the size of its government debt repurchases due to fixed income markets under pressure and yields surging to levels not seen in nearly 20 years.
Lower long-term yields reduce the opportunity cost of holding non-yielding assets like bitcoin and gold, and generally support risk-on sentiment.
Investors flooded into bitcoin as a result.
Positive news soon followed, with President Donald Trump urging lawmakers to get the long-awaited crypto Clarity Act over the line. The digital asset industry has long called for clear rules on how regulators should treat bitcoin, stablecoins and other cryptocurrencies.
Despite a delay in a vote on the legislation, Trump called the draft “very powerful.” The president made the comments after having met with crypto industry bigwigs and CEOs.
Investors also rushed back into ETFs in August, throwing over $2.8 billion at the vehicles — the most since October, when the coin hit a new all-time high.
Bitcoin in August had its best run in three years — and is up nearly over 20% over the past month.
The asset reached as high as $81,281 last week before sliding again on Friday.
Bitcoin’s price recently stood at $76,883, nearly down 3% over a 24-hour period.
This post Bitcoin Defies Seasonal Slump With Third-Best August Ever first appeared on Bitcoin Magazine and is written by Mathew Di Salvo.
Bitcoin Magazine
BlackRock’s iShares Bitcoin Trust Is Beating Top S&P 500 ETF
BlackRock’s iShares Bitcoin Trust exchange-traded fund has delivered better returns since its 2024 launch than Vanguard’s popular S&P 500 fund.
That’s according to Bloomberg data highlighted by the firm’s senior ETF analyst, Eric Balchunas, who said that the BlackRock product’s cumulative percentage return was only slightly ahead of Vanguard’s in the time period.
BlackRock’s bitcoin ETF is up 71% since its January 2024 debut, while Vanguard’s S&P 500 ETF up 66% on a total-return basis.
The iShares Bitcoin Trust — IBIT — started trading in 2024 after the Securities and Exchange Commission gave the green light to 11 spot bitcoin ETFs following a decade of denials.
“IBIT’s path to 70% looks like the El Toro roller coaster at Great Adventure (I needed two Advil last time I rode that thing) while $VOO was a walk in the park in comparison,” wrote Balchunas on Tuesday.
U.S. investors now have several funds to choose from to buy shares that track the price of bitcoin managed by the likes of Fidelity, Grayscale and Morgan Stanley. But BlackRock’s product is the most successful: It currently manages $61.4 billion in assets, according to its website.
By comparison, the second biggest bitcoin ETF, the Fidelity Wise Origin Bitcoin Fund, manages nearly $11 billion.
BlackRock, which manages over $15 trillion in assets, sent shockwaves through the crypto space after it applied for a spot bitcoin ETF in 2023. Its fund now allows more traditional investors to get exposure to bitcoin; its product also experiences more day-to-day trading action than the other ETFs.
Investors piled back into ETFs in August, which has also helped bitcoin’s price. From August 17 to 27, investors threw over $2.8 billion at the vehicles — the most since October, when the coin hit a new all-time high.
Bitcoin reached as high as $81,281 last week before sliding again on Friday.
The price of the biggest cryptocurrency recently stood at $77,539, nearly down 1% over a 24-hour period.
Bitcoin started a phenomenal run two weeks ago — its best in three years — and is up nearly 30% over the past month.
This post BlackRock’s iShares Bitcoin Trust Is Beating Top S&P 500 ETF first appeared on Bitcoin Magazine and is written by Mathew Di Salvo.
Bitcoin Magazine

South Korea’s Bitcoin ‘Kimchi Premium’ Returns
Bitcoin is up this month but there’s one place where it’s more significantly more expensive: South Korea.
The so-called Kimchi Premium — when bitcoin costs more on Korean exchanges — is back as retail investors pile back into the coin. Bloomberg first reported the news and CoinGecko data shows that bitcoin’s price is nearly 1% higher on Upbit, Korea’s biggest exchange, than Binance.
Named after a popular dish in the Asian nation, the phenomenon comes down to Korea’s market being partly walled off. Prices have historically run higher there because of strong local retail demand combined with strict capital controls and trading regulations.
As a result, the Bitcoin/won trading pair is more common in South Korea compared to the Bitcoin/U.S. dollar pair in other places. When there is demand for the asset, it will naturally be higher in the country as compared to other places.
The phenomenon has been described as a retail FOMO indicator, since Korea has few notable crypto funds and tight capital controls. The premium has reached as high as 21.5% in 2022.
Bitcoin was recently trading for $78,287, unmoved over the past 24 hours. It’s also at the same price it was seven days ago, but over the past month, the coin has rallied by 24%.
The price of the biggest digital asset started surging after the U.S. Treasury in August said it would at least double the size of its liquidity-support buyback operations. The announcement hurt the dollar but non-yielding assets like bitcoin and gold have benefited.
President Donald Trump also said the same week that the long-awaited crypto Clarity Act was an important piece of legislation, and urged lawmakers to get it over the line.
JUST IN: There's now a 59% chance Bitcoin will be above $82,500 this month, according to Polymarket.com
— Bitcoin Magazine (@BitcoinMagazine) September 1, 2026pic.twitter.com/kTYEZsxQvk
Crypto industry bigwigs have been calling for clear rules for distinguishing between digital assets that are securities, commodities or payment stablecoins, and news that regulators will soon have such a framework has typically benefited crypto markets.
Speculators are now betting on Polymarket that there’s a 59% chance bitcoin will be above $82,500 this month, leading some to call an end to the bear market.
This post South Korea’s Bitcoin ‘Kimchi Premium’ Returns first appeared on Bitcoin Magazine and is written by Mathew Di Salvo.
Bitcoin Magazine

BlackRock Re-Underwrites Bitcoin, and the Portfolio Math Still Holds
Bitcoin’s roughly 50% decline from its October 2025 high has created a useful test for the institutional investment thesis. It is relatively easy to make the case for a new asset while prices are rising, correlations are favorable and capital is flowing into the market. The more revealing exercise comes after a major drawdown, when investors can revisit the original assumptions and determine which were structural and which were simply products of the preceding cycle.
That is effectively what BlackRock has done in its latest research, Re-Underwriting Bitcoin: Still a Portfolio Diversifier. Rather than treating the recent drawdown as evidence for or against Bitcoin in isolation, the firm returns to the question most relevant to an allocator: how has Bitcoin actually affected the risk and return characteristics of a diversified portfolio?
The results are more consequential than the headline return figures suggest. In BlackRock’s rolling 10-year analysis through May 29, 2026, a traditional 60/40 equity and fixed-income portfolio generated an annualized return of approximately 9.9% with annualized standard deviation of roughly 10.1%. Introducing a 1% Bitcoin allocation increased annualized return to approximately 10.9%, while volatility moved only modestly higher to roughly 10.3%. At a 2% allocation, annualized return reached approximately 11.8%, with standard deviation of about 10.6%.
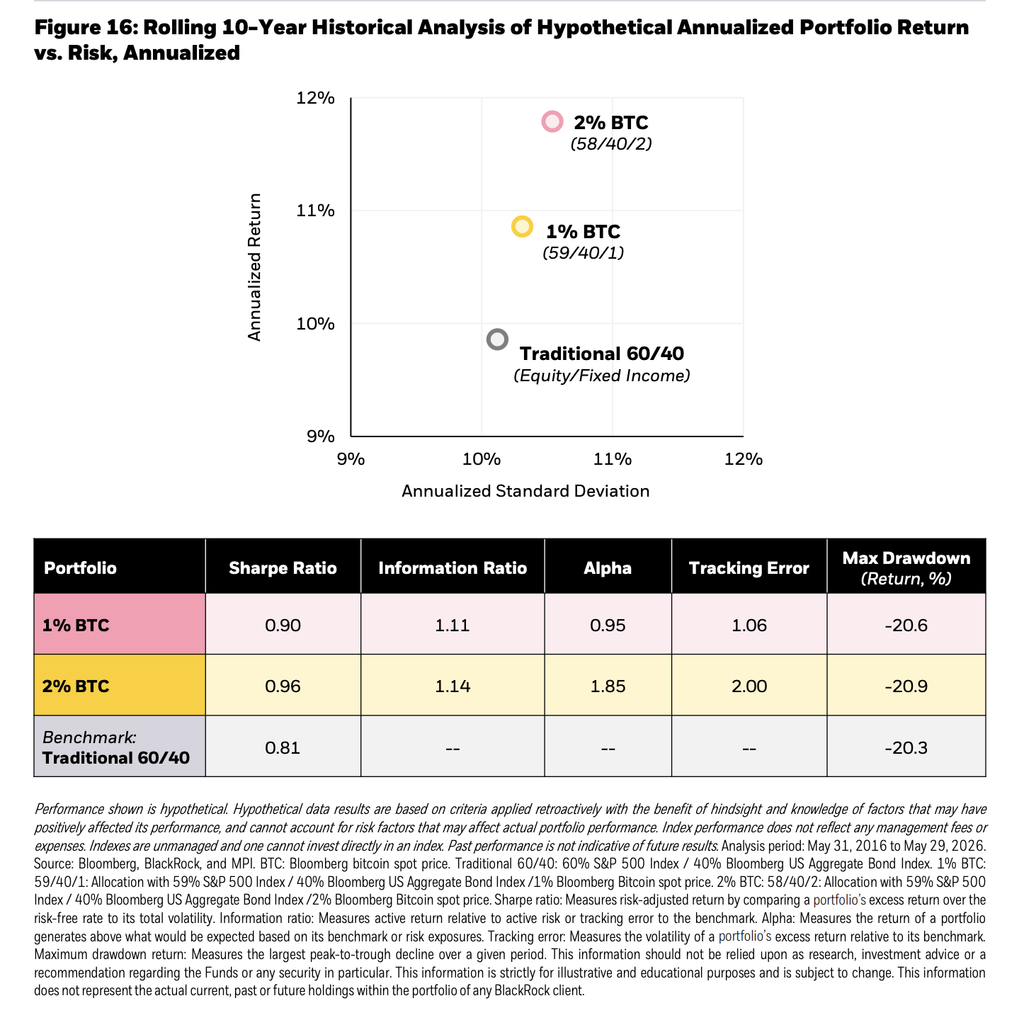
Put differently, the 2% allocation added roughly 190 basis points of annualized return relative to the traditional portfolio while increasing annualized volatility by approximately 50 basis points. The portfolio’s Sharpe ratio improved from 0.81 to 0.96, while maximum drawdown changed from -20.3% to -20.9%. Those figures are hypothetical and backward-looking, but they illustrate why judging Bitcoin primarily by its standalone volatility can produce an incomplete assessment of its portfolio impact.
The more relevant question is how that volatility interacts with everything else an investor already owns. BlackRock continues to characterize Bitcoin as having risk and return drivers that are fundamentally different from traditional assets, rooted in its fixed supply, decentralized structure and independence from any sovereign issuer. Those characteristics do not prevent Bitcoin from trading alongside risk assets during periods of deleveraging, but BlackRock’s research suggests those correlations have historically been episodic rather than permanent.
That distinction helps explain the portfolio results. A modest allocation does not import Bitcoin’s standalone volatility into a portfolio on a one-for-one basis. What matters is the marginal contribution of that allocation to total portfolio risk relative to the return it has historically generated. In BlackRock’s analysis, that trade-off remained favorable at 1% and 2%, even after incorporating one of Bitcoin’s most significant recent drawdowns.
Why 1–2% keeps appearing in BlackRock’s work
This is not the first time BlackRock has arrived at this range. Its earlier portfolio research approached Bitcoin sizing through risk contribution, concluding that a 1–2% allocation could represent a reasonable range for investors willing and able to accept Bitcoin’s risk. At those weights, BlackRock found that Bitcoin could contribute a similar share of overall portfolio risk as an individual mega-cap technology holding in a conventional 60/40 portfolio. Beyond 2%, however, Bitcoin’s contribution to total portfolio risk begins to increase disproportionately.
The new analysis approaches the same question from the opposite direction. Rather than asking how much risk Bitcoin contributes, it examines what investors historically received for assuming that additional risk. The improvement in Sharpe ratio from 0.81 for the traditional portfolio to 0.90 with 1% Bitcoin and 0.96 with 2% Bitcoin suggests that the incremental return historically more than compensated for the additional portfolio-level volatility.
This does not establish 1% or 2% as an optimal allocation, and BlackRock does not present it that way. The appropriate exposure will depend on liquidity requirements, investment horizon, governance constraints and risk tolerance. What the analysis does provide is a more rigorous framework for the discussion. The allocation question can increasingly be evaluated in terms of marginal risk, correlation, drawdown and portfolio efficiency rather than through a binary debate over whether Bitcoin itself is too volatile to own.
BlackRock has also seen the demand firsthand
There is another dimension to BlackRock’s latest analysis that is difficult to separate from the firm’s experience in the market.
BlackRock launched the iShares Bitcoin Trust, IBIT, in January 2024. Less than a year later, it had accumulated more than $50 billion in assets, making it what BlackRock itself has described as the largest exchange-traded product launch in history. It reached that milestone roughly five times faster than the previous record holder.
Its significance has only grown since then. BlackRock now describes IBIT as the world’s largest and most traded Bitcoin ETP, and the fund became the firm’s highest-revenue ETF in 2025 despite competing within a global BlackRock lineup of more than 1,000 products.
The concentration within the U.S. spot Bitcoin ETF market is equally notable. According to current ETF holdings data tracked by Bitcoin For Corporations, U.S. spot Bitcoin ETFs collectively hold approximately 1.25 million BTC, representing nearly 6% of Bitcoin’s fixed 21 million supply. IBIT alone accounts for roughly 775,000 BTC, or more than 60% of the Bitcoin held across the U.S. spot ETF complex.
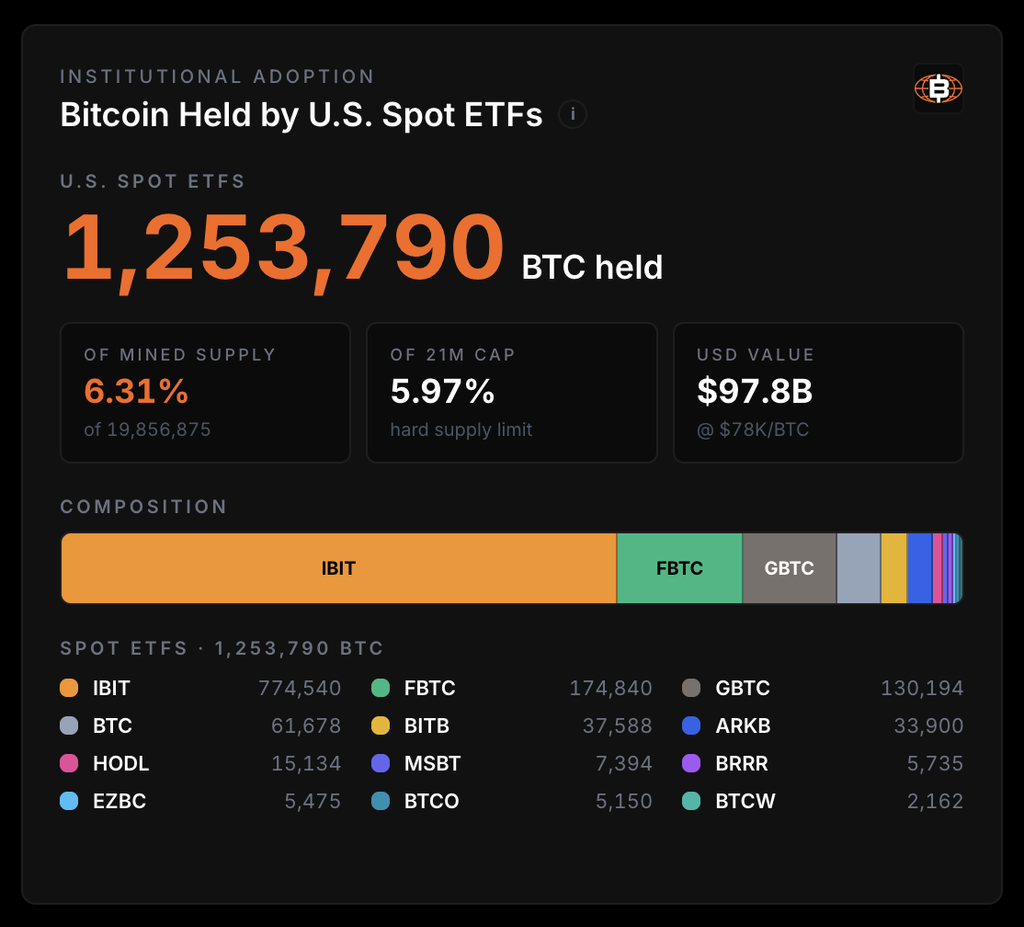
View the full Bitcoin ETF Dashboard.
That does not make BlackRock’s research independent of commercial context; IBIT is an important and increasingly valuable BlackRock product. That context should be understood rather than ignored. But it also means the firm’s reassessment is occurring alongside more than two years of observing how investors actually use Bitcoin exposure at scale.
The distinction is useful. The theoretical case for Bitcoin as a portfolio asset is increasingly being accompanied by observable allocation behavior. Investors have now had access to Bitcoin through familiar brokerage, advisory and institutional infrastructure across multiple market regimes, including periods of rapid appreciation and severe drawdowns. IBIT’s growth suggests that demand has persisted well beyond its initial launch window.
A drawdown is precisely when a thesis should be re-underwritten
The timing of BlackRock’s report may ultimately be more informative than the portfolio simulation itself.
Bitcoin is not being reassessed at an all-time high. BlackRock published the analysis after an approximately 50% drawdown from Bitcoin’s October 2025 peak, a period the firm associates with leveraged positioning being unwound, slowing ETP flows and weaker demand from companies accumulating Bitcoin. Its conclusion is that these forces represented a positioning correction rather than a fundamental change in Bitcoin’s investment case.
That is what re-underwriting is supposed to accomplish. An investment thesis should not survive because investors are attached to it; it should survive because its underlying assumptions continue to hold when conditions change.
For Bitcoin, those assumptions extend beyond historical returns. The asset remains scarce by design, globally liquid, independent of a sovereign issuer and structurally different from the liabilities that dominate traditional portfolios. BlackRock argues that concerns around fiscal sustainability, monetary stability and geopolitical risk may therefore become increasingly relevant to Bitcoin’s long-term adoption.
The portfolio evidence does not prove what Bitcoin will return over the next decade, nor does IBIT’s success establish what an appropriate allocation should be. What the two developments show together is that the institutional conversation has advanced considerably. Bitcoin is no longer being evaluated solely as an unconventional asset that institutions may or may not choose to own. It is increasingly being evaluated through the same disciplines applied elsewhere in capital allocation: sizing, risk contribution, correlation, liquidity, drawdown and expected return.
What this means for corporate leaders
For CFOs, boards and corporate operators, that evolution may be the most important takeaway from BlackRock’s work.
The relevant decision is not whether Bitcoin is volatile; that is already known. Nor does a corporate allocation need to resemble the concentrated Bitcoin strategies pursued by companies that have explicitly built their capital structures around the asset. Between zero exposure and a Bitcoin-centric balance sheet sits a much broader spectrum of possible allocations.
BlackRock’s research provides a useful framework for thinking about that spectrum. A relatively small allocation was sufficient to materially alter the historical return characteristics of a conventional portfolio without producing a comparable increase in portfolio-level risk. At 2%, approximately 190 basis points of additional annualized return came with roughly 50 basis points of additional annualized volatility in the period studied. The allocation was small; its effect was not.
For corporate leaders, the implication is less about adopting BlackRock’s specific allocation range than adopting the discipline behind the analysis. Bitcoin can be underwritten like any other strategic allocation: define its purpose, determine an acceptable risk contribution, establish liquidity and governance requirements, size the position accordingly and periodically revisit the assumptions.
That is a considerably more mature question than whether a company should simply “buy Bitcoin.”
As Bitcoin becomes more deeply integrated into institutional portfolios and financial infrastructure, the burden of analysis is shifting. The question facing the C-suite is increasingly not whether Bitcoin belongs in the conversation, but what allocation, if any, can be justified by the company’s objectives, constraints and cost of capital.
BlackRock has now re-underwritten that question after another full market cycle and a roughly 50% drawdown. Its historical portfolio math still makes the case that, in measured amounts, Bitcoin can improve the equation. For corporate decision-makers, that is the takeaway worth bringing into the boardroom.
Disclaimer: This content was prepared on behalf of Bitcoin For Corporations for informational purposes only. It reflects the author’s own analysis and opinion and should not be relied upon as investment advice. Nothing in this article constitutes an offer, invitation, or solicitation to purchase, sell, or subscribe for any security or financial product.
This post BlackRock Re-Underwrites Bitcoin, and the Portfolio Math Still Holds first appeared on Bitcoin Magazine and is written by Nick Ward.
CryptoSlate
Michael Saylor has roughly one week to orchestrate STRC’s return to its $100 par value by his informal Sept. 8 target, but the financial machinery required to close the final gap is running hot.
Despite deploying $635.2 million on aggressive buybacks, Strategy’s preferred security continues to hover around $97. The company has simultaneously restarted its Bitcoin accumulation after a two-month freeze, signaling confidence that its balance sheet can absorb both demands.
Yet, the path to par has morphed into a highly capital-intensive grind just as a wave of competing Bitcoin-linked yield products hits the market.
The coming days will test more than Saylor’s 70-trading-day timeline, a target calculated from STRC's latest recovery starting May 28. It will reveal how much more capital the firm is willing to deploy before relying on organic institutional demand to anchor the security.
The final $3 is costing Strategy more
The economics of the buyback campaign have deteriorated steadily as STRC climbs toward par, upending the company's initial strategy.
When Strategy began repurchasing STRC in July, management outlined a clear tapering framework: deploy more capital at deeper discounts to capture attractive economics, then scale back as the security approached $100, where independent investor demand would theoretically take the reins.
Instead, weekly spending has accelerated as the discount narrowed.
| Repurchase Period | Capital Deployed | Average Price | Discount to $100 Par |
|---|---|---|---|
| July 20–26 | $25.0 million | $86.52 | 13.48% |
| July 27–Aug. 2 | $81.2 million | $89.02 | 10.98% |
| Aug. 3–9 | $108.6 million | $94.27 | 5.73% |
| Aug. 10–16 | $132.2 million | $95.20 | 4.80% |
| Aug. 17–23 | $136.4 million | $95.30 | 4.70% |
| Aug. 24–30 | $151.8 million | $97.48 | 2.52% |
| Total | $635.2 million | — | — |
Buying below par still carries a basic economic rationale. Every share retired for less than $100 eliminates $100 of stated value, along with its annualized 12% dividend obligation. However, the rapidly shrinking spread alters the campaign's trade-off.
The firm now has just $364.8 million remaining under its $1 billion authorization. At the recent pace of spending, that runway could narrow quickly, leaving Strategy to decide how much more capital it is prepared to commit to support the final move to par.
MSTR and Bitcoin are carrying the STRC repair
Strategy has leaned heavily on its two largest sources of financial firepower, MSTR common stock and its Bitcoin holdings, to finance the STRC repair effort.
Between late June and early August, the firm sold a net 6,916 Bitcoin across four disclosed transactions to fund preferred-stock obligations and, in later transactions, STRC repurchases.
Last week, Strategy pivoted back toward common-equity issuance, selling 4.53 million MSTR shares for $602.8 million in net proceeds. Of that amount, $151.8 million funded the latest STRC repurchase while another $50.7 million covered STRC dividends.
The company also deployed $369.7 million to acquire 4,603 Bitcoin, its first purchase in roughly two months, pushing its total stockpile to 845,050 BTC. Another $30 million went into its flexible cash pool.
To fortify the structure surrounding its preferred securities, Strategy has ring-fenced a $5.1 billion USD Reserve earmarked for preferred dividends and debt interest, backed by a separate roughly $1.6 billion pool of flexible USD Cash.
It has also maintained STRC's annualized dividend at 12% and instituted a policy barring new STRC issuance below $100.
Those moves temporarily invert the security's intended design.
STRC was engineered to raise capital from investors that Strategy could deploy across its balance sheet, including toward Bitcoin purchases. Instead, the company spent much of the summer using proceeds from MSTR issuance and, at times, Bitcoin sales to service and repurchase STRC.
The return to Bitcoin buying suggests Strategy believes the rebuilt mechanics around the preferred are now strong enough to support both sides of the strategy simultaneously.
STRC’s real test begins at $100
The ultimate gauge of success arrives when Strategy reduces its own purchases and asks outside investors to carry STRC around $100.
Traditional finance has already demonstrated substantial appetite for the security. The initial July 2025 offering was originally slated for 5 million shares, or $500 million at stated value. Strong demand allowed the firm to increase the deal to more than 28 million shares and raise $2.52 billion.
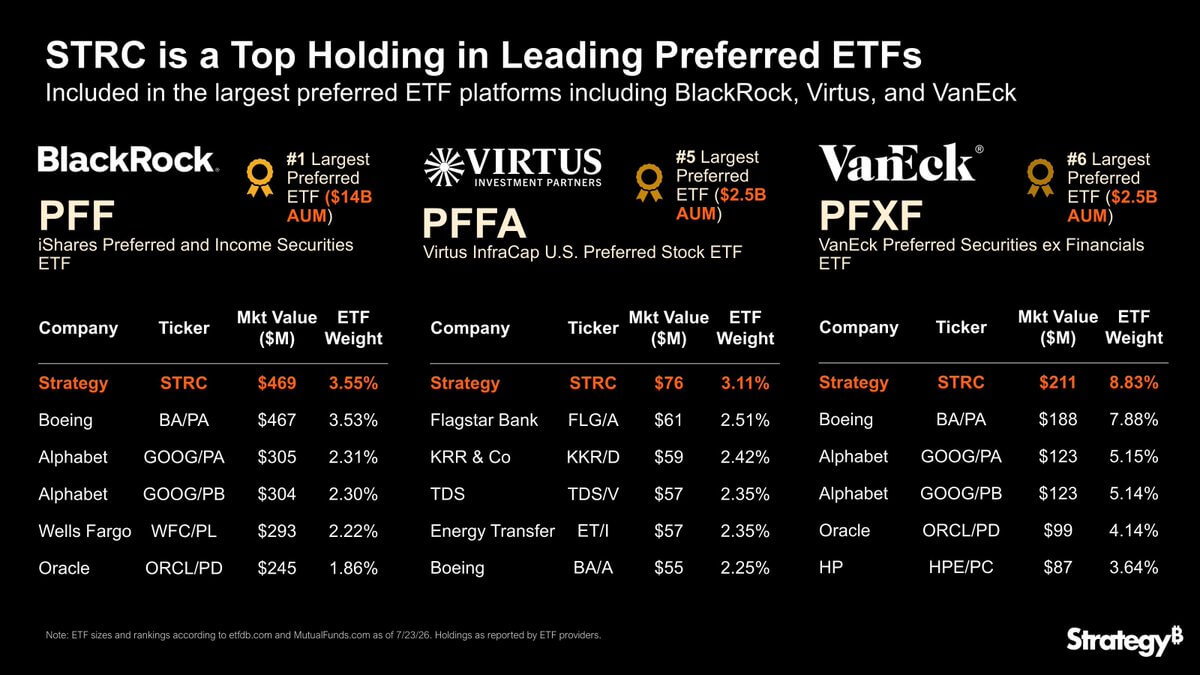
By July 2026, Saylor said Digital Credit was entering the institutional mainstream, pointing to $756 million of STRC held across three major US preferred-stock ETFs: BlackRock’s PFF, Virtus InfraCap’s PFFA and VanEck’s PFXF. STRC was the largest individual holding in all three at the time.
However, as STRC approaches $100, the market it is returning to is becoming more crowded.
Strive has expanded its SATA preferred stock, which carries a 13% annual dividend rate, pays distributions every business day, and follows a similar policy against issuing below $100.
Metaplanet is also building a broader Bitcoin-credit distribution platform. The Japanese Bitcoin treasury company acquired licensed securities platform Siiibo Securities to develop and distribute Bitcoin-linked yield products, while separately expanding its US presence through Super League Enterprise.
Those developments give investors seeking Bitcoin-linked income a growing menu of securities with different yields, payment schedules, and capital structures.
STRC enters that competition with an important advantage: scale and demonstrated institutional adoption. But reaching $100 will test whether that established investor base remains strong enough to replace Strategy's own purchases and eventually absorb fresh issuance at par.
If outside demand does so as Strategy reduces buybacks, STRC can return to its intended role as a funding source for Bitcoin purchases.
However, if demand weakens as issuer support fades and competing products attract capital, reaching $100 may prove easier than sustaining it.
The post Strategy keeps STRC at 12% as Saylor has seven days to salvage the $10 billion Bitcoin yield product as costs spiral appeared first on CryptoSlate.
Bitcoin fell below $77,000 as softer US labor data failed to dislodge expectations for another Federal Reserve rate increase.
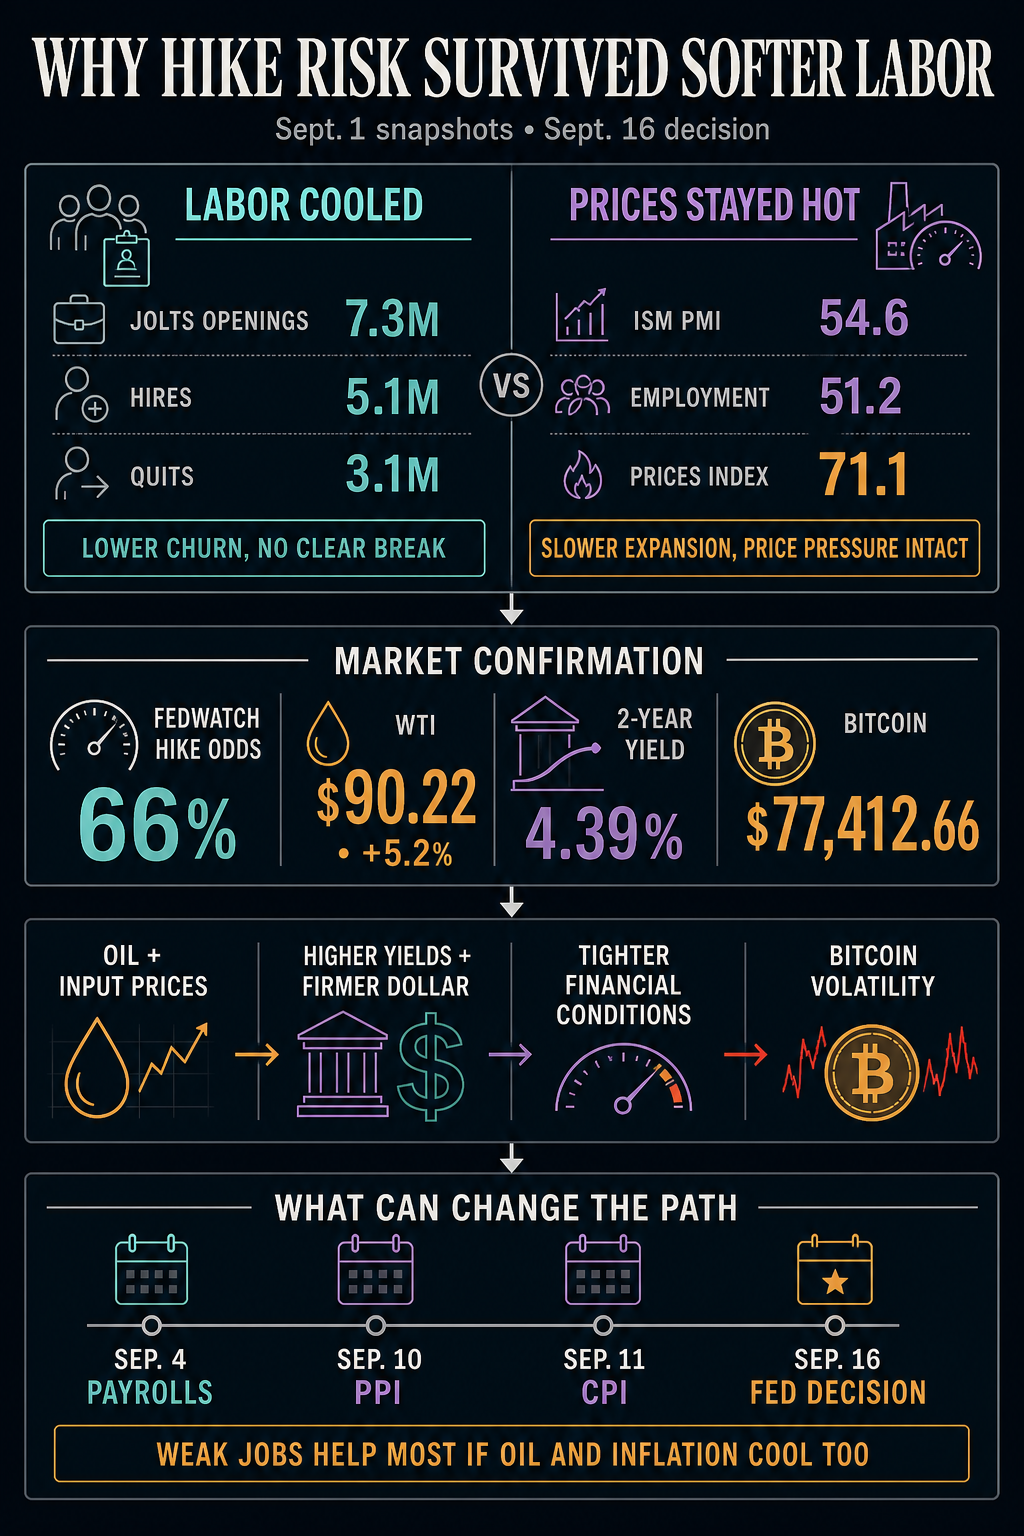
Data from CryptoSlate shows the largest cryptocurrency traded around $76,985 as of press time after July job openings held at 7.3 million and hiring remained subdued.
The release landed into a market already confronting $90 oil, rising Treasury yields and a Fed that has shifted sharply from discussing rate cuts to considering another hike.
Data from CME FedWatch showed the probability of a September rate increase at 66%, up from about 60% following Fed Chair Kevin Warsh’s Aug. 28 Jackson Hole speech.
JOLTS did not make markets more hawkish. Instead, the report failed to overturn an inflation-driven repricing already reinforced by higher energy prices and Treasury yields.
The Bureau of Labor Statistics reported 5.1 million hires and 3.1 million quits in July, with both measures little changed from the previous month. June openings were revised down by 177,000 to 7.2 million, while earlier estimates for hires and quits were also lowered.
The softer turnover arrived less than three weeks before the Fed’s Sept. 15-16 meeting, giving policymakers further evidence that the labor market is cooling without showing the type of contraction that would settle the policy debate.
Warsh had already drawn that distinction at Jackson Hole. He said employment remained consistent with full employment and argued that unusually low turnover partly reflected the wave of worker and employer rematching that followed the pandemic.
His concern instead remained inflation.
$90 oil keeps the hike trade alive
The inflation side of the debate strengthened elsewhere in Tuesday’s data.
The ISM manufacturing index eased to 54.6 in August from 55.6, while new orders fell to 53.7 from 56.7 and employment declined to 51.2 from 52.8.
But prices barely moved.
ISM’s Prices Index held at 71.1 for a second month, while respondents cited fuel and oil-based products among commodities becoming more expensive.
Crude then amplified the pressure. West Texas Intermediate surged 5.2% to settle at $90.22, while Brent gained 4.6% to $94.65 as the Iran crisis continued to unsettle energy markets.
Treasury yields moved higher alongside oil. The two-year yield rose to 4.39% from 4.34%, while the benchmark 10-year climbed to 4.79% from 4.75%.
The combination helps explain why weaker labor turnover failed to knock down September hike expectations. The Fed entered 2026 expecting several rate cuts, but markets are now assigning a better-than-even probability to another increase.
That reversal leaves Bitcoin facing a considerably less forgiving backdrop than investors anticipated earlier in the year.
Higher Treasury yields increase the return available on dollar assets and raise the hurdle for holding assets without contractual yield. A stronger dollar can also tighten financial conditions across speculative markets.
The latest ETF flows suggest some of that pressure is reaching crypto portfolios.
US spot Bitcoin ETFs recorded $236.46 million of net outflows on Sept. 1, reversing $216.7 million of inflows on Aug. 31. The one-day swing removed a source of institutional support just as Bitcoin slipped back below $77,000.
The reversal followed a volatile stretch for the asset. Bitcoin traded above $81,000 before Warsh’s Jackson Hole remarks pushed rate expectations higher and sent the cryptocurrency below $77,000. Its subsequent rebound has struggled to regain momentum as the September policy outlook hardened.
The Fed’s oil problem cuts both ways
The crude rally complicates the outlook because the same shock strengthening the inflation case can also weaken the economy.
James E. Thorne, chief market strategist at Wellington Altus, argued that raising rates in response to an externally driven energy shock could compound the economic damage.
Higher crude prices raise transport and production costs, reduce household purchasing power, and squeeze corporate margins. Consumers spending more on fuel have less available for other purchases, while companies facing higher input costs can respond by cutting investment or hiring.
The Fed can weaken domestic demand through higher borrowing costs, Thorne said, but it cannot increase oil supply or resolve the geopolitical conditions pushing crude higher.
That distinction becomes more important if the labor market deteriorates further.
July JOLTS has already shown weaker turnover, while the latest ISM employment reading cooled. Neither has yet produced the kind of break that would clearly override Warsh’s inflation concerns.
The next employment report could change that balance.
August payroll data arrives Sept. 4, followed by producer prices on Sept. 10 and consumer prices on Sept. 11. The Fed announces its decision Sept. 16.
A materially weak payroll report would challenge the view that employment remains consistent with full employment. If oil also retreats and subsequent inflation data soften, markets would have a clearer reason to unwind September hike expectations and push yields lower.
Weak employment alongside crude near current levels would create a harder problem. Labor conditions would be deteriorating while an external supply shock kept inflation pressure elevated.
Firm hiring alongside persistent price pressure would reinforce the current setup and could push short-term yields higher again.
Bitcoin enters that sequence back near the level reached during the initial post-Jackson Hole selloff, and without the ETF support it carried into the week.
The post Bitcoin hits $77,000 wall as the Fed gets trapped between weak jobs and $90 oil appeared first on CryptoSlate.
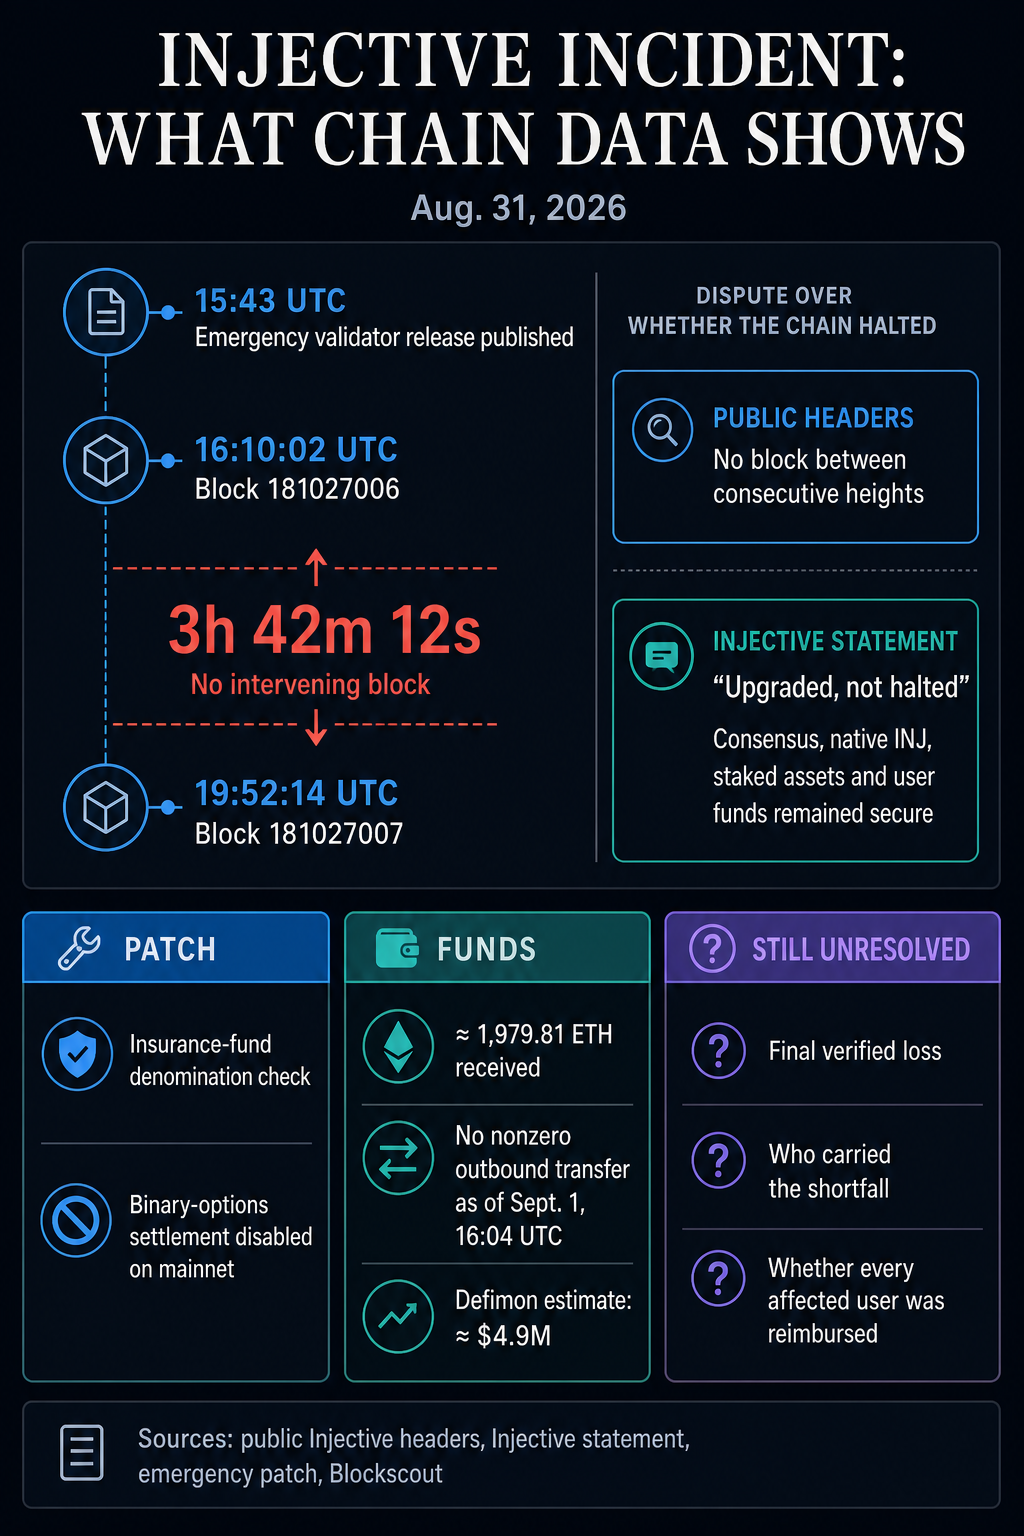
Injective, a layer-1 blockchain network, produced no new block for nearly four hours during an emergency response to an exploit that researchers traced into core modules.
On Sept.1, the foundation said the blockchain was “upgraded, not halted” and that its consensus, native INJ, and staked assets were never compromised. It described the attack as affecting a small number of ecosystem applications using binary-options markets.
On-chain researcher Earthling Paddy challenged both characterizations, while crediting Injective for containing the exploit and keeping staked funds safe.
The ledger shows block 181027005 at 16:09:59 UTC on Aug. 31 before block production stopped for roughly four hours. Paddy said one earlier block alone took about 37 minutes, while infrastructure provider QuickNode also reported a stalled block height during the incident.
Injective said the accelerated upgrade took longer than expected as validators and ecosystem infrastructure moved to the emergency release. Some validators were temporarily jailed after missing the required upgrade window, while exchanges including Coinbase and Coins.ph temporarily restricted transfers.
Data from CryptoSlate shows INJ trading around $4.80 as of press time, down roughly 3% over the previous 24 hours.
Researcher disputes where the vulnerability sat
Paddy also questioned Injective’s description of the exploit as isolated to ecosystem applications.
He said the attack used messages from Injective’s native exchange and insurance modules, while the emergency v1.20.3-safeharbor.1 release patched the chain’s core code by adding an insurance-fund denomination check and disabling binary-options settlement on mainnet.
That would place the vulnerable logic inside a protocol module used by applications rather than solely within application code.
Injective has not yet published a full technical postmortem. Its statement said the relevant attack vector had been contained and patched and that the foundation was adding stronger invariants, real-time monitoring, and other safeguards.
Researchers estimate about $4.9 million was bridged to Ethereum during the exploit. Paddy said roughly that amount remained in the attacker-linked wallet and had not moved.
The final loss allocation remains unclear. Injective has not disclosed how much was ultimately drained, which party absorbed any shortfall, or whether an ecosystem pool that now appears replenished was restored by the foundation, developers, or another participant.
Instead, the blockchain has maintained that its users weren't affected. In an X post, Injective CEO Eric Chen said:
“Injective users aren’t affected and we’ve been helping the team on recovery. Always sad to see exploits happening in the ecosystem but we’re glad that the incident was contained before further harm was done.”
Nonetheless, the incident therefore leaves two separate findings intact. Injective’s consensus and staked INJ were not compromised, while its emergency response still coincided with a multi-hour interruption in block production and required a core-code patch.
The post A layer-1 blockchain froze for 4 hours to stop a $4.9 million hack, then claimed it was just an upgrade appeared first on CryptoSlate.
Standard Chartered estimated in January that stablecoins could pull about $500 billion from US bank deposits by the end of 2028.
Regional banks looked especially exposed given how much they depend on the spread between what they pay depositors and what they earn on loans.
Now, 21 major financial institutions, including Bank of America, Citi, Goldman Sachs and Wells Fargo, committed Sept. 1 to build one.
The group announced plans to establish a company in the second half of 2026, launch a US dollar-denominated stablecoin in the first half of 2027, and comply with both the GENIUS Act and MiCA.
The venture started as a 10-bank exploration into reserve-backed digital money in October 2025 and has since grown to 21 institutions spanning North America, Europe, Asia, Africa, and the Middle East.
Its stated use cases include wholesale and institutional activity, cross-border payments, digital-asset settlement, and retail markets where client benefits can be achieved.
| Earlier bank concern | Sept. 1 bank response |
|---|---|
| Stablecoins could pull deposits out of banks | 21 institutions committed to launch a bank-backed stablecoin |
| Regional banks could be exposed to funding pressure | Large banks are positioning to capture stablecoin flows |
| Crypto platforms could compete for customer cash | Banks are creating their own digital-dollar product |
| Stablecoins could redirect reserves into Treasuries | Banks may seek a role in reserve management and distribution |
| Payments could move outside bank rails | Banks want stablecoins for cross-border payments, settlement and institutional activity |
Why deposits and stablecoins compete for the same dollar
Bank deposits fund lending and balance-sheet activity, with banks earning income on the spread between what they pay depositors and what they collect on loans.
Stablecoins work as fully backed tokens that hold their reserves in cash, bank balances, and short-dated government securities, with Treasuries making up most of Tether and Circle's reserve holdings.
A dollar moving from a bank account into a stablecoin can remain a dollar in every practical sense while changing who controls the customer relationship, the reserve economics and the payment rail underneath it.
That move in control is what Standard Chartered's warning was about.
Owning the stablecoin migration beats losing the relationship
A bank-backed stablecoin customer moving money from a conventional deposit into a fully reserved token still reduces the bank's traditional funding base.
What a bank-issued stablecoin can preserve is everything built around that deposit: the distribution relationship, the compliance layer, the settlement business and a share of the reserve economics.
Banks appear to be accepting cannibalization of one part of their existing model to avoid surrendering the entire customer relationship to a crypto-native competitor.
Total stablecoin market capitalization stands near $303.7 billion, according to DefiLlama, with Tether's USDT alone accounting for more than 60%.
Citi's 2030 research projects a base case of $1.9 trillion in stablecoin issuance and a bull case of $4 trillion, implying roughly $1.6 trillion to $3.7 trillion of additional issuance from today's level.
Citi's base case also puts annual stablecoin transaction activity near $100 trillion at 50 times velocity, climbing toward $200 trillion under its bull scenario.
The consortium is positioning for a share of that future issuance and transaction flow, a much larger prize than any slice of Tether and Circle's existing balances.
The bank that produced one of the industry's most aggressive stablecoin growth forecasts is simultaneously helping build a company designed to compete inside that forecast. It treats its own projection as a live market opportunity worth entering.
| Metric | Estimate | What it means |
|---|---|---|
| Potential US bank deposit outflow | $500B by end-2028 | Stablecoins could pressure traditional bank funding |
| Current stablecoin market cap | ~$303.7B | The market banks are entering today |
| Citi 2030 base case | $1.9T | Roughly $1.6T of additional issuance from today |
| Citi 2030 bull case | $4T | Roughly $3.7T of additional issuance from today |
| Citi base-case transaction activity | ~$100T/year | Stablecoins become payment and settlement infrastructure |
| Citi bull-case transaction activity | ~$200T/year | The market becomes too large for banks to ignore |
Multiple forms of digital money can coexist
None of this means banks are abandoning tokenized deposits for public-chain stablecoins. Citi's research explicitly expects stablecoins, tokenized deposits, deposit tokens and central bank digital currencies to coexist, and projects that bank-token transaction volume could exceed stablecoin turnover by 2030 even as stablecoin issuance itself keeps expanding.
The more accurate read is that banks want exposure across every plausible form of digital dollar at once. Qivalis, a separate 37-institution consortium building a euro-pegged stablecoin, shows the competitive landscape is already splitting by currency and structure as well as by issuer.
The GENIUS Act takes effect on the earlier of 18 months after its July 2025 enactment, which lands on Jan. 18, 2027, or 120 days after federal regulators finalize implementing rules.
The consortium's first-half 2027 target overlaps that threshold. The same law that gave existing stablecoin issuers regulatory certainty also opened a clear, compliant path for heavily regulated banks to enter the category directly.
That turns a compliance milestone for incumbents into a competitive entry point for their newest rivals.
One warning sign for bank-issued stablecoins is Societe Generale's dollar-backed token, which had just $12.5 million in circulation.
Distribution remains the harder test
Institutional trust and compliance infrastructure do not, by themselves, produce the minting volume, secondary-market liquidity, exchange listings, wallet support, and merchant demand that make a stablecoin useful.
Tether and Circle built years of that kind of distribution, and a consortium of banks cannot replicate it by announcement alone.
Whether the bet pays off or produces a compliant token nobody needs
The bull case has stablecoins approaching Citi's $4 trillion scenario, with bank-backed tokens becoming one of several dominant digital-money formats used across payments, treasury and settlement.
Under that path, deposit substitution turns into a genuine structural funding issue for banks that stayed on the sidelines. Institutions in the consortium capture settlement fees, custody relationships, and reserve income in a market many times larger than today's.
| Scenario | What happens | Who wins | What it means for banks |
|---|---|---|---|
| Bull case: bank stablecoins scale | Stablecoins approach Citi’s $4T scenario and bank-backed tokens gain institutional usage | Consortium banks, regulated issuers, institutional clients | Banks cannibalize some deposits but retain settlement, custody and customer relationships |
| Base case: partial adoption | Bank tokens find use in wholesale, cross-border and institutional settlement but do not displace USDT/USDC broadly | Banks in specific niches; crypto-native issuers in public markets | Banks capture some future flows without fully reshaping deposit funding |
| Bear case: compliant but unused | The consortium launches a well-regulated token that fails to build liquidity or integrations | Existing stablecoins and tokenized-deposit systems | Banks spend years building infrastructure customers do not need |
| Regulatory shock case | Stablecoin rules tighten after a failure, run or liquidity event | Tokenized deposits and bank-controlled rails | Stablecoins lose momentum, and banks pivot harder toward deposit tokens |
The bear case has the consortium building a fully compliant, well-capitalized stablecoin that fails to attract liquidity, matching the same pattern Societe Generale's token already shows.
In that scenario, deposit strain stays limited because stablecoins never scale far past their current niche. The 21 institutions end up having spent years and real capital building infrastructure that crypto-native issuers and tokenized-deposit systems continue to outcompete on usage.
Banks spent months warning that stablecoins could hollow out part of their business. Their answer was to make sure that if the dollar keeps moving onto programmable rails, some of the largest banking names control the rails it moves on.
The post Wall Street is now racing to control the $1.9T stablecoin shift to avoid losing its customer base appeared first on CryptoSlate.
Binance is putting options on more than 1,000 selected US stocks and exchange-traded funds inside the same account that already offers crypto and several forms of equity exposure.
The product is limited to eligible users outside the US, and the securities machinery behind the offer does not belong to Binance.
The company said on Sept. 1 that Nest Trading Limited will introduce the orders and route them to Alpaca Securities LLC. Alpaca will execute, clear, and settle the trades, then custody any shares delivered when an option is exercised.
Eligible customers can move among more products without leaving Binance, while Nest and Alpaca carry distinct responsibilities behind the scenes.
Who does what behind Binance
Binance is the customer-facing access point, Nest Trading is the introducing broker, and Alpaca provides execution and post-trade infrastructure.
An options customer places an order through Binance, but Nest introduces it to Alpaca. If physical settlement produces shares, Binance says Alpaca holds them on the user's behalf.
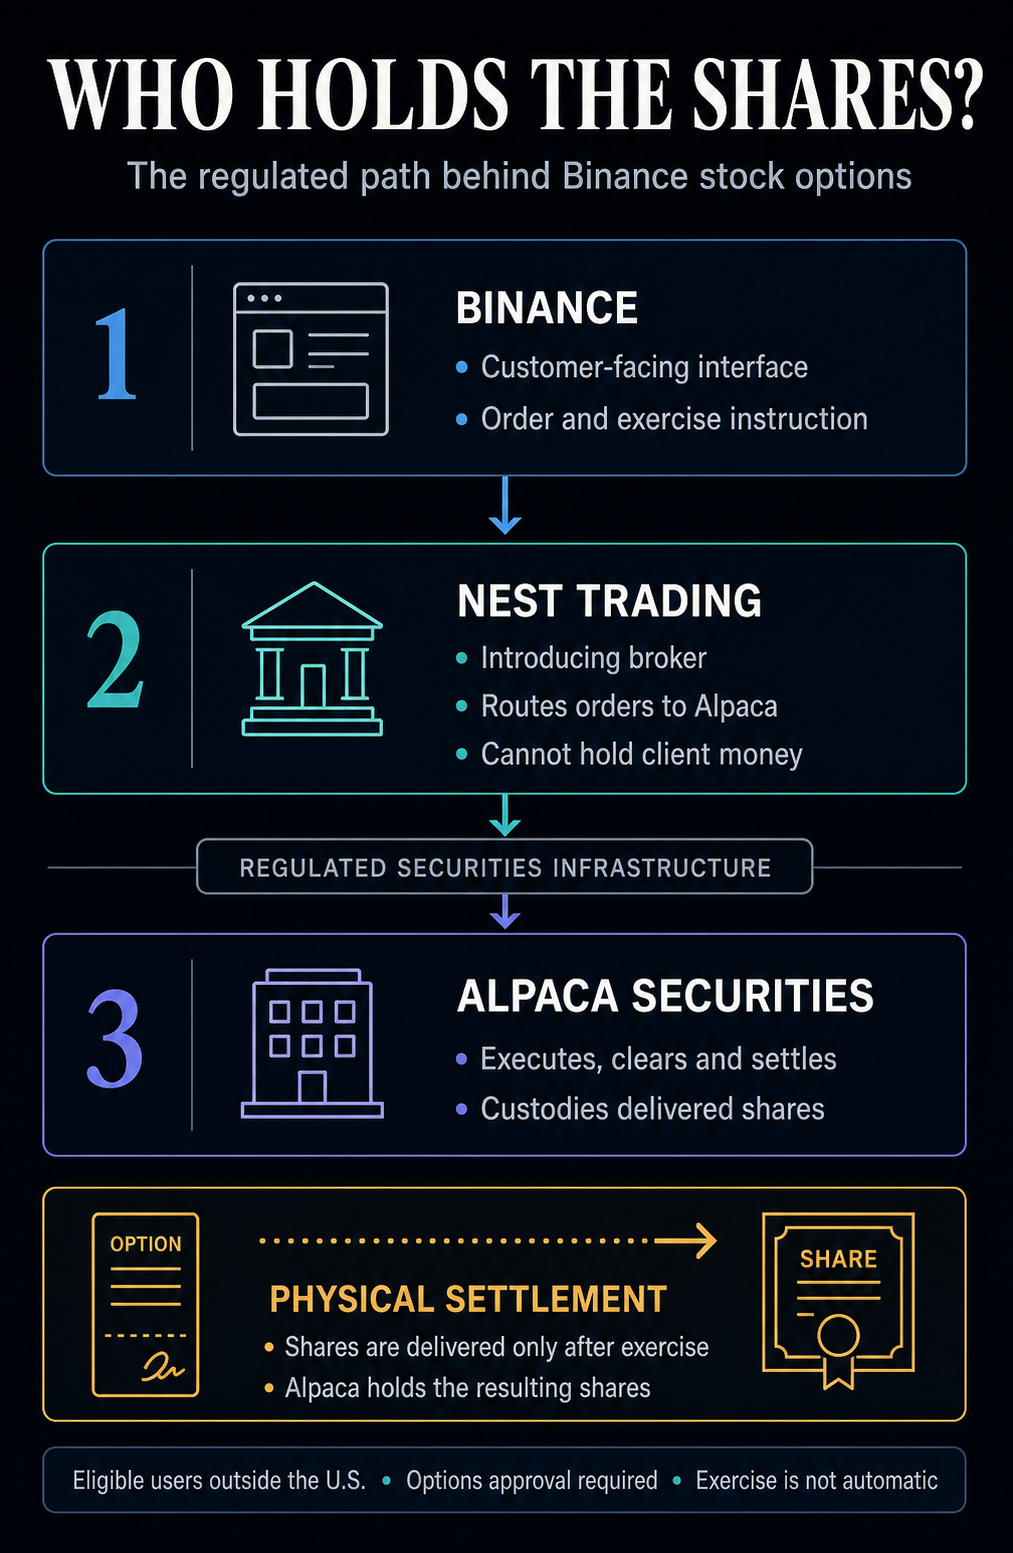
Nest's Abu Dhabi Global Market register lists the firm as active under financial services permission 260000. Its permitted activities include arranging deals, dealing as an agent, and arranging custody, but the register says Nest cannot hold or control client money.
Alpaca's FINRA BrokerCheck profile identifies the firm as SEC- and FINRA-approved and lists options activity, securities clearing and settlement, and electronic trading among businesses it conducts or expects to conduct.
The profile also says Alpaca can hold or maintain funds or securities and provide clearing services for other broker-dealers.
The contracts are physically settled. Exercising a call can produce the underlying shares, while exercising a put can require delivery of them. Until exercise and settlement, the option is a contractual right.
Binance says an exercise instruction must be submitted through its platform by the relevant cutoff, as late as 30 minutes before expiry. Even an in-the-money contract will not exercise automatically without that instruction.
A position without an instruction becomes subject to best-efforts auto-liquidation before trading closes. If it cannot be sold, it may expire worthless, leaving the holder with a loss of the premium.
Binance said eligible retail users may buy calls and puts, with maximum potential loss limited to the premium. The statement does not extend that defined-loss description to option-writing strategies.
The exchange also says that the options remain subject to jurisdictional and user restrictions. Alpaca's options documentation says every customer account must be approved before its first options trade, with financial circumstances, experience, risk tolerance and investment objectives supplied alongside a signed options agreement.
Four products behind one account
The options join three existing routes to equity exposure inside Binance. A single account can make them look adjacent, but their ownership and settlement mechanics differ.
| Product | What the user holds | Ownership or settlement |
|---|---|---|
| Direct U.S. stocks | Shares | Direct equity ownership held through a U.S.-regulated clearing broker |
| bStocks | Tokenized securities | No direct ownership of the underlying company share |
| Equity-linked perpetuals | Derivative exposure | No delivery of the underlying share described |
| Stock options | A right to buy or sell | Underlying shares are delivered or received after exercise and held by Alpaca |
Binance made the ownership distinction explicit when it introduced direct stock trading and previewed bStocks in June. It said direct-stock users would own equities held by a US-regulated clearing broker, while bStocks would not give holders direct ownership of the underlying company shares.
The options add another regulated route, consolidating convenience for users.
Shunyet Jan, Binance's head of exchange and trading, called stock options an “important next step” toward a “fuller multi-asset platform.” Binance said equity-linked perpetuals generated about $342.9 billion in volume during August, represented about 79% of its TradFi perpetual activity and grew more than 800-fold from January.
The launch release shows how Binance is presenting demand within its own ecosystem, but it does not establish how much demand the new physically settled contracts will attract.
The options announcement expands what a crypto account can distribute. Binance controls product discovery and the customer experience, while Nest and Alpaca define the operational route into regulated securities markets.
That structure gives Binance much of the strategic benefit of a securities super-app without making it the entity that executes, clears, or custodies every product on screen.
For users, the practical test is whether they understand which firm holds the asset, which rules govern the account, and which action they must take before an option expires.
The post Binance deepens TradFi push with physically settled options on over 1,000 US equities appeared first on CryptoSlate.
HTTP error 429 on https://cryptoticker.io/en/feed/
Failed to fetch feed: https://cryptoticker.io/en/feed/
Failed to fetch feed.
Decrypt
So far, Rektember is living up to its name as Bitcoin slips. Will this September follow the historical averages, or break the trend?
CrowdStrike and the DOJ isolated more than 15,000 infected machines in a malware takedown spanning four countries.
New Form TA-2 questions would make agents report how many share registers they keep on distributed ledgers.
The North Carolina Republican bought less than $1,000 of contracts on her own race and drew a three-year ban.
The open-source agent framework that started the "autonomous AI" hype cycle just shipped its biggest update ever, almost by accident, and it's coming for the enterprise now.
U.Today - IT, AI and Fintech Daily News for You Today
Key crypto updates for Sep. 2: a $369 million long squeeze hits 90,000 XRP, ETH, and SOL traders while the SEC bypasses Congress to integrate blockchain into TradFi.
3.59 million SHIB burned at the start of September, a month deemed historically poor for risk assets.
Dogecoin is certainly not finding a recovery ground as quickly as we anticipated.
A Shiba Inu mega whale has moved another 600 billion SHIB worth roughly $3.09 million.
Crypto community gets safety warning as Coinbase adds support for wrapped Zcash and HYPE assets.
Blockonomi
Quick Summary
- Moderna shares advanced 3.6% Tuesday, reaching approximately $145.40, though trading activity was 79% lighter than usual.
- Encouraging late-stage trial data emerged for Moderna and Merck’s personalized mRNA-based melanoma treatment.
- U.S. regulators greenlit Moderna’s updated COVID-19 vaccine, bolstering market sentiment.
- Analyst consensus sits at “Hold” with a mean price objective of $80.53, significantly under current market levels.
- GSK’s progression of its own mRNA influenza vaccine to Phase III trials presents emerging competition.
Moderna shares climbed 3.6% during Tuesday’s session, peaking at $143.74 before settling near $145.40. Trading activity was notably subdued, with approximately 2.4 million shares changing hands—a 79% decline from the typical daily volume exceeding 11 million.
Moderna, Inc., MRNA
The upward movement stemmed from two significant developments. Initially, Moderna and Merck disclosed promising Phase 3 trial outcomes for their individualized mRNA melanoma treatment. These results sparked optimism that Moderna’s cancer-focused development programs could evolve into substantial revenue sources beyond its COVID-19 franchise.
Additionally, American health authorities granted approval for Moderna’s refreshed COVID-19 vaccine, providing the biotech company with a marketable product as the autumn respiratory illness season approaches.
These twin catalysts propelled the stock upward and maintained investor attention on Moderna’s expanding development portfolio.
Wall Street Maintains Cautious Stance
Notwithstanding Tuesday’s surge, analyst sentiment remains reserved. The consensus recommendation stands at “Hold,” with a mean price objective of $80.53—substantially beneath current trading levels.
Multiple prominent financial institutions have recently adjusted their forecasts higher, though most maintain a guarded position. JPMorgan elevated its objective from $40 to $77 while preserving an “underweight” stance. Morgan Stanley increased its target from $39 to $89 yet maintained an “equal weight” recommendation. Bank of America upgraded its rating from “underperform” to “neutral.”
Loop Capital established a $135 price objective, representing the closest alignment with current pricing among major brokerages. Brookline Capital Markets retained its “Buy” recommendation and continues projecting profitability in 2029 and 2030, despite marginally reducing its earnings per share projections for those periods.
Among the 23 analysts tracking the stock, seven assign it a Buy rating, thirteen recommend Hold, and three rate it Sell.
GSK Emerges as Competitive Challenge
An emerging concern involves GSK. The pharmaceutical powerhouse has advanced its proprietary mRNA-based influenza vaccine into Phase III clinical trials, entering the arena shortly after Moderna secured the inaugural U.S. regulatory approval for a seasonal flu mRNA vaccine.
While that approval represented a significant achievement for Moderna, GSK’s advancement into the identical therapeutic category introduces questions regarding Moderna’s ability to maintain market dominance over time.
From a financial perspective, Moderna’s latest quarterly report, released July 31, revealed a loss of $1.97 per share, surpassing expectations of a $2.03 loss. Revenue totaled $145 million, exceeding analyst projections of $102.9 million and representing a 2.1% year-over-year increase.
The biotech firm completed a $2.6 billion convertible notes offering, reinforcing its cash reserves to support continuing clinical initiatives. Moderna maintains a debt-to-equity ratio of merely 0.09 and a current ratio of 2.29, providing considerable financial maneuverability in the immediate term.
Moderna has additionally announced participation in the Morgan Stanley Global Healthcare Conference on September 14 and the Bernstein Healthcare Forum on September 23.
Since the beginning of this year, MRNA stock has surged approximately 376%.
The post Moderna (MRNA) Stock Climbs Nearly 4% Following Melanoma Trial Success and Vaccine Approval appeared first on Blockonomi.
Key Highlights
- Dell stock rallied 10% following a 58% year-over-year revenue surge to $46.97B, powered by robust AI server sales
- GitLab shares rocketed 22% higher after exceeding Q2 forecasts with 21% revenue expansion and upbeat guidance
- MongoDB shares plunged 15% even after beating estimates, as Atlas growth deceleration concerned market participants
- Credo Technology declined 7% despite revenue doubling, with margin compression triggering investor concerns
- U.S. stock futures showed mixed signals Wednesday as market participants monitored Treasury yields and anticipated Fed reports
Dell Technologies delivered impressive results that sent its stock soaring in Wednesday’s premarket session. The tech giant’s shares surged 10% after reporting second-quarter revenue of $46.97B, representing a remarkable 58% increase from the prior year and easily surpassing analyst projections.
Dell Technologies Inc., DELL
The Infrastructure Solutions Group emerged as the primary growth driver. This division experienced explosive 89% revenue growth, reaching $31.78B, propelled by surging demand for servers optimized for artificial intelligence workloads.
Dell boosted its full-year revenue projection by $25B to $192B, significantly exceeding the Street’s $173.3B estimate. The company reported record AI server bookings of $60.9B, complemented by a substantial $95B pipeline that signals sustained momentum in coming quarters.
GitLab Posts Impressive Results
GitLab emerged as another standout performer on Wednesday. The software development platform saw its shares climb 22% following second-quarter revenue of $286.3M, marking 21% year-over-year expansion and surpassing analyst expectations.
The company reported net annual recurring revenue growth exceeding 40%, while dollar-based net retention reached 117%. These metrics helped alleviate concerns about competitive pressure from Microsoft’s GitHub platform and emerging rivals like Cursor.
For the third quarter, GitLab projected revenue between $281M and $283M, aligning closely with Wall Street estimates. Executives highlighted increasing customer demand as artificial intelligence tools accelerate software development activity.
MongoDB and Credo Declined Despite Strong Numbers
Wednesday’s session proved that beating expectations doesn’t always guarantee positive market reactions. MongoDB saw its shares crater 15% despite posting 30% revenue growth and upgrading its full-year forecast.
The stock’s decline centered on decelerating growth rates for Atlas, the company’s flagship multi-cloud database service. Additionally, operating expenses climbed 12%, fueled by elevated investments in AI capabilities and infrastructure expansion, dampening investor enthusiasm.
MongoDB provided full-year revenue guidance of $2.99B to $3.03B and adjusted earnings per share between $6.39 and $6.58, both exceeding analyst estimates, yet the stock still sold off sharply.
Credo Technology experienced a similar fate, sliding 7% despite first-quarter revenue more than doubling to $479M compared to last year. Adjusted earnings per share jumped from $0.52 to $1.20 year-over-year.
The challenge for Credo centered on profitability metrics. Gross margin contracted to 64.5% from 67.4% in the year-ago period, while operating margin declined to 25.2% from 27.2%. Market analysts noted the company’s outlook appeared less robust relative to previous quarterly projections.
For its second quarter, Credo projected revenue ranging from $525M to $535M, topping consensus expectations, but simultaneously warned of ongoing margin headwinds stemming from increasing operational spending.
Palo Alto Networks dipped 1.7% despite delivering solid fourth-quarter results. The stock had already surged 97% heading into Tuesday’s close, prompting shareholders to lock in gains.
U.S. equity futures traded in mixed territory Wednesday. Market participants awaited the Federal Reserve’s Beige Book release alongside critical economic indicators, while escalating U.S.-Iran military tensions and climbing global sovereign yields constrained appetite for riskier assets.
Broadcom, Snowflake, and Hewlett Packard Enterprise are scheduled to announce quarterly results following Wednesday’s market close.
The post Market Movers Today: Dell (DELL) Rockets 10% on AI Server Boom as MongoDB, Credo Tumble appeared first on Blockonomi.
Key Highlights
- HPE shares climbed 4.7% to $53.28 during Wednesday’s pre-market session before the company’s fiscal third-quarter earnings release scheduled for after-hours
- Dell Technologies’ impressive $95 billion AI server backlog and strong Q2 performance sparked enthusiasm throughout the AI hardware sector, benefiting HPE
- Deutsche Bank launched coverage on HPE with a Buy recommendation and $62 target; Bank of America lifted its price objective to $82 from $80
- Wall Street forecasts approximately 32% revenue growth year-over-year and earnings per share that could more than double compared to last year
- HPE maintains a $6.3 billion AI server backlog, with approximately two-thirds linked to enterprise clients and sovereign nation deployments
Hewlett Packard Enterprise (HPE) shares were changing hands at $53.28 during Wednesday’s pre-market hours, marking a 4.7% increase from the previous day’s closing price of $50.87, as market participants prepared for the technology firm’s fiscal third-quarter 2026 financial results scheduled for release after trading concludes.
Hewlett Packard Enterprise Company, HPE
The upward momentum followed a 3.99% extended-hours gain on Tuesday evening that elevated shares to $52.90, a movement catalyzed by Dell Technologies delivering exceptional second-quarter performance metrics.
Dell unveiled $46.97 billion in quarterly revenue alongside an unprecedented $95 billion AI server backlog, simultaneously elevating its full-year outlook. This combination energized investor sentiment throughout the AI infrastructure ecosystem, where HPE maintains direct competition.
HPE finished Tuesday’s standard trading session at $50.87, representing a 2.62% daily decline, before the after-hours momentum erased most of that day’s losses.
Brokerage Firm Activity Before Results
Two separate analyst developments contributed to the optimistic atmosphere surrounding the earnings announcement. Deutsche Bank launched coverage on September 1 with a Buy designation alongside a $62 price objective. Bank of America independently elevated its HPE target to $82 from a previous $80, highlighting the firm’s strategic positioning within AI infrastructure markets.
These analyst price objectives represent professional assessments and do not constitute guaranteed future valuation levels.
Wall Street Projections
Consensus analyst forecasts indicate approximately 32% year-over-year revenue expansion for the fiscal third quarter.
Financial analysts additionally anticipate earnings per share will exceed double the figure reported during the comparable year-ago period.
HPE has surpassed consensus EPS projections across its previous four quarterly reports, delivering an average upside surprise of approximately 16%. Historical results do not ensure future repetition.
HPE’s current AI server order backlog stands at $6.3 billion. Roughly two-thirds of this pipeline connects to enterprise customer and sovereign nation implementations, illustrating the demand profile.
The technology provider recently unveiled a “Saudi Made, Developed, Deployed” initiative in collaboration with Intel and Saudi Arabia’s Ministry of Communications and Information Technology. HPE has also expanded its manufacturing alliance with Saudi company Alfanar, establishing localized server production and assembly operations within the Kingdom.
Across the trailing twelve-month period, HPE shares have appreciated 124%, oscillating between a 52-week floor of $19.84 and a ceiling of $64.25. The company’s market capitalization currently stands at approximately $67.36 billion.
Broadcom is similarly scheduled to release quarterly results on Wednesday, maintaining investor attention on AI infrastructure investments.
HPE’s fiscal third-quarter financial report will be published following Wednesday’s market close.
The post Hewlett Packard Enterprise (HPE) Stock Climbs 5% Pre-Market on AI Hardware Momentum Before Q3 Report appeared first on Blockonomi.
TLDR
- The precious metal has declined for four consecutive sessions, reaching a three-week low around $4,327 per ounce
- An appreciating U.S. dollar and climbing Treasury yields are weighing on gold prices
- Traders are assigning a 70% probability to a Federal Reserve rate increase at the September 15-16 policy meeting
- Military action against Iran by the U.S. has elevated oil prices, intensifying inflation worries
- The yellow metal has fallen beneath its 200-day moving average, a critical technical indicator
The price of gold has continued its downward trajectory this week, reaching its weakest point in over three weeks as the greenback gains strength and market participants increasingly anticipate a Federal Reserve rate increase.
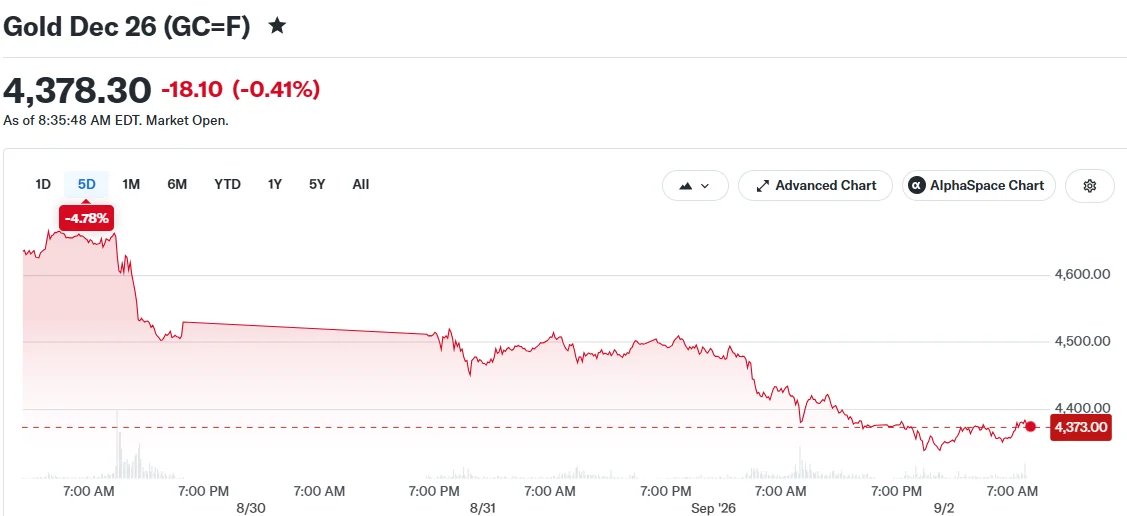
Currently, spot gold is trading near $4,327 per ounce, with futures contracts declining 0.5% to settle at $4,373. The precious metal has shed approximately 6% over the course of the week.
Hawkish Fed Rhetoric Pressures Precious Metals
Gold is facing headwinds from several sources. Federal Reserve Chair Kevin Warsh struck a hawkish tone during his Jackson Hole address last week, suggesting that monetary policy may need to remain restrictive for an extended period.
Fed Governor Michael Barr reinforced these concerns during Tuesday’s remarks. He emphasized that central bank officials must stand ready to tighten policy further should inflation fail to moderate, highlighting that price growth has persisted above the Fed’s 2% objective for over five years.
According to CME’s FedWatch tool, financial markets are currently assigning a 70% likelihood to an interest rate hike at the upcoming September 15-16 Federal Open Market Committee gathering.
Rising borrowing costs typically undermine gold’s appeal. Since the metal generates no income, it loses competitiveness when fixed-income securities and deposit accounts deliver superior returns.
Iran Conflict Escalation Drives Energy Prices Higher
New U.S. military operations targeting Iran on Tuesday introduced additional market uncertainty. Iranian officials reported retaliatory strikes, signaling a significant intensification following approximately a month of reduced hostilities.
Brent crude traded near $94 per barrel while U.S. crude remained just under $90. Market participants are monitoring whether sustained conflict could interrupt petroleum shipments through the Strait of Hormuz.
Elevated oil prices contribute directly to inflationary pressures. This complicates the Federal Reserve’s ability to maintain current rates or implement cuts, which sustains downward pressure on gold valuations.
The U.S. Dollar Index advanced 0.1% to reach 99.73. A robust dollar increases gold’s cost for international buyers utilizing alternative currencies, potentially reducing overall demand.
Rising Treasury Yields Compound Headwinds
International bond yields have also advanced. Thirty-year U.S. Treasury yields climbed above 5.28%, reverting to levels observed prior to Treasury Secretary Scott Bessent’s announcement of expanded bond buyback programs on August 19.
That policy action had initially propelled gold approximately 10% higher during August, marking its strongest monthly gain since January. The advance reflected anxieties regarding escalating government debt and currency devaluation, commonly referred to as the debasement trade.
Gold has also penetrated below its 200-day moving average during this week’s trading, a threshold that technical analysts monitor closely as an indicator of long-term price momentum.
Market strategists at Sucden Financial noted that Friday’s U.S. nonfarm payrolls report will probably shape gold’s near-term direction. Weaker employment figures could attract bargain hunters, whereas robust job growth might drive yields higher and prolong the metal’s downtrend.
The post Gold Prices Slump to Three-Week Lows Amid 70% Fed Hike Probability appeared first on Blockonomi.
Key Takeaways
- Shares of FCEL declined approximately 12% during premarket hours following a third-quarter fiscal 2026 report that disappointed on both revenue and earnings metrics.
- Quarterly revenue totaled $33 million, representing a 29% year-over-year decline and falling short of the $38.8 million analyst consensus.
- The company reported a per-share loss of $0.64, significantly worse than the anticipated $0.40 loss.
- Gross losses expanded dramatically to $24.5 million compared to $5.1 million in the prior-year period, influenced by charges related to the Fit Energy contract.
- On a positive note, the committed project backlog increased to $1.3 billion, and the firm secured its inaugural Capacity Reservation Agreement with a prominent data center operator.
FuelCell Energy delivered underwhelming fiscal third-quarter results, prompting an immediate negative response from investors. Shares of FCEL plunged roughly 12% in Wednesday’s premarket session, trading at $15.11, following the release of financial results that missed expectations across key metrics.
FuelCell Energy, Inc., FCEL
For the quarter that concluded on July 31, the company generated $33 million in revenue, marking a 29% decrease from the $46.7 million recorded in the comparable year-ago period. Wall Street analysts had projected revenue of approximately $38.8 million. Meanwhile, the per-share loss of $0.64 exceeded the consensus forecast of roughly $0.40 to $0.41.
Shares had finished Tuesday’s session at approximately $17.08, already down 0.9% for the day. Despite Wednesday’s premarket decline, FCEL shares had still gained around 134% year-to-date through Tuesday’s close, benefiting from robust investor enthusiasm surrounding AI infrastructure and data center expansion.
FUELCELL ENERGY $FCEL Q3’26 EARNINGS HIGHLIGHTS
Revenue: $33.0M (Est. $41.3M)
; -29% YoY
Signs first data center power agreement (75 MW)
Segment Revenue:
— Wall St Engine (@wallstengine) September 2, 2026
However, the stock had already retreated 53% from its June 30 levels. That decline began following the company’s announcement of a $200 million common stock public offering in early July. Wednesday’s earnings results intensified the selling pressure.
Substantial Expansion in Gross Losses
The most concerning metric in the quarterly report was the dramatic expansion in gross losses. The figure surged to $24.5 million for the period, a substantial increase from the $5.1 million recorded in the same quarter last year.
A significant portion of this increase stemmed from product costs that surpassed contractual pricing arrangements within the Fit Energy agreement, resulting in $17 million in charges throughout the quarter. Additionally, generation revenue suffered as the Groton facility underwent a temporary shutdown for equipment upgrades.
These challenges were firm-specific rather than indicative of broader industry trends. Major market indices showed minimal movement on the day, with the S&P 500 essentially flat and the Nasdaq declining a modest 0.3%.
Data Center Opportunities Continue to Expand
While the earnings report disappointed, FuelCell did highlight several encouraging developments. The company revealed its first Capacity Reservation Agreement with a major data center operator for a proposed 75 MW project located in Texas.
The committed backlog also expanded nearly 5% to reach $1.3 billion. CEO Jason Few emphasized the increasing electricity requirements driven by artificial intelligence and data center growth as a significant long-term opportunity for the company.
“With a growing commercial pipeline, expanding manufacturing capacity, and differentiated technology, we believe FuelCell Energy is well positioned to capitalize on these long-term market tailwinds,” Few said.
Nevertheless, investors appear to be prioritizing immediate financial performance over future potential, showing less patience for the timeline required to convert backlog into recognized revenue. This tension between current results and forward-looking opportunities has been a persistent challenge for the stock.
In premarket trading, FCEL shares at approximately $15.49 remained considerably below the 52-week peak of $37.88.
The post FuelCell Energy (FCEL) Shares Plummet 12% Following Disappointing Q3 Earnings Report appeared first on Blockonomi.
CryptoPotato
[PRESS RELEASE – HONG KONG, HONG KONG, September 2nd, 2026]
New suite of standalone products gives institutions principal OTC dealing and LP connectivity alongside Liminal’s existing wallet and key-management infrastructure
Today, Liminal, a provider of institutional digital asset wallet and key-management infrastructure, announced the launch of Liminal Prime, an enterprise software suite designed to provide stablecoin liquidity connectivity. It is built exclusively to enable locally licensed exchanges, financial institutions, payment providers, fintechs, market makers, corporate treasuries and OTC trading desks to access principal-to-principal OTC dealing and LP connectivity alongside Liminal’s existing wallet and key-management infrastructure. Liminal’s technology is delivered strictly as a tech infrastructure solution to authorised entities responsible for their own local regulatory compliance.
As cross-border payments, tokenized assets and enterprise blockchain applications move from pilot projects into production deployments, financial institutions increasingly need trading and liquidity infrastructure designed to integrate with the governance and compliance controls institutions have already established. Liminal Prime has been built to address that gap precisely.
For many institutions, secure wallet infrastructure is no longer the primary challenge. As digital asset operations mature, attention is shifting toward trading, liquidity access, and operational efficiency. Liminal Prime has been developed to address this next phase of institutional adoption.
This launch marks the next phase of Liminal’s evolution as an institutional partner, expanding its core wallet and key-management offering with OTC and liquidity connectivity. Each product operates as an independent module, licensed and deployed separately, giving institutions the flexibility to adopt what fits their operational and regulatory requirements, without displacing existing infrastructure
Liminal Prime is built by the team behind Liminal’s institutional wallet infrastructure and key-management infrastructure, which has processed more than US$100 billion in on-chain transactions across more than 20 blockchain networks for institutions in over 12 countries.
The products have been shaped by direct engagement with the licensed exchanges, payment companies, financial institutions and digital asset businesses that form Liminal’s client base. What those clients identified consistently was a common operational gap: institutional-grade trading and liquidity access that works within, not alongside, their existing governance and compliance frameworks.
“What we keep hearing from institutions, across markets, is that the wallet question is largely settled. The conversation has moved on. They are now asking how they actually operationalise digital assets at scale — how they trade, how they manage liquidity, and how they do all of that without introducing new counterparty risk or compliance gaps. Liminal Prime is built to close that gap. We have the relationships and the trust already in place. This is a natural next step.” Rajesh Sabari, Chief Commercial Officer, Liminal
Liminal Prime comprises three products, each addressing a distinct institutional operating requirement:
White-Glove OTC supports high-value, complex, and time-sensitive block trades through a dedicated dealing desk. A desk reaches Liminal directly, gets a price, and confirms the trade; no automated flow, a human on the other end for every transaction. Where regulatory frameworks permit, Liminal acts as principal counterparty for its own account on every trade, buying and selling digital assets. Designed for licensed institutions where transaction size, confidentiality and tailored workflow requirements are paramount.
Electronic OTC (eOTC) provides GUI and API-driven access to streaming and firm quotes for organisations managing recurring, high- frequency digital asset transaction flows at scale. A GUI and API connection enables automated, always-on pricing; a web platform provides a self-serve, screen-based experience for systematic dealing without a manual conversation for every trade. Subject to applicable local licensing, Liminal acts as principal counterparty for its own account.
Bridge is a technology platform that gives institutions a single screen or API to request quotes from, and trade directly with, liquidity providers they have separately onboarded with and been approved by. Liminal is not the counterparty to the trade, does not operate an exchange, brokerage or trading venue, and takes no custody of assets. Liminal’s role is limited to routing quote requests, displaying prices and supporting communication between the two parties; the trade and its settlement happen directly between the institution and its chosen liquidity provider, off-platform, under their own bilateral agreement.
Across all three products, Liminal Prime delivers configurable reporting, audit-ready workflows and integration with Liminal’s wallet and key-management infrastructure. The products support multiple blockchain networks and major digital asset pairs, providing the transparency, governance and operational controls that institutions require.
“The time for discussing institutional digital assets in theory is over. Institutions now need practical solutions that can be deployed against real treasury, payment and liquidity requirements. Whether you are managing stablecoin flows, entering a new market or looking for more efficient execution, bring us the challenge. Liminal Prime is ready to help you put into action.” Clarence Leong, Senior Manager – Institutional Markets, Liminal
Liminal Prime is the first step in a broader infrastructure strategy. As institutional participation in digital asset markets deepens across tokenization, cross-border payment infrastructure and enterprise treasury management, Liminal will continue building out its product offering. The company’s objective is to serve as a trusted infrastructure partner for licensed institutions at every stage of their digital asset operations, from wallet and key-management infrastructure to OTC and liquidity connectivity solutions.
Important Notice
White-Glove OTC and Electronic OTC (eOTC) are restricted and unavailable to entities operating or residing in the UAE, India, Singapore and Taiwan, as well as any jurisdiction where local laws prohibit their use. Bridge is available subject to local regulatory requirements. Note: Users are solely responsible for ensuring compliance with all local regulations before attempting to access any of our services.
Communication Notice: The following Important Notice is an integral part of this release and must be reproduced in full wherever this release, or any substantial portion of it, is published or reproduced.
About Liminal Prime
Liminal Prime is a suite of institutional OTC and liquidity connectivity products comprising three distinct offerings: White-Glove OTC, Electronic OTC and Bridge. Where regulatory frameworks permit, White-Glove OTC and eOTC are principal-to-principal dealing products in which Liminal acts as counterparty for its own account. Bridge is a technology platform through which institutions can request quotes from, and trade directly with, approved and licensed liquidity providers of their choosing; the legal trade is formed and settled bilaterally between the institution and its chosen LP under their own agreements. Each product is operated and assessed independently and is designed to complement existing institutional infrastructure. Institutions may adopt individual products independently, based on their operational and regulatory requirements.
About Liminal
Liminal is an institutional digital asset infrastructure provider offering enterprise-grade wallet infrastructure, key management and governance solutions for exchanges, financial institutions, fintech companies, digital asset businesses and enterprises. Liminal has processed over US$100 billion in on-chain transaction volume across more than 20 blockchain networks for institutions in over 12 countries.
The post Liminal Launches Liminal Prime for Institutional OTC and Stablecoin Liquidity appeared first on CryptoPotato.
The August 19 monetary pivot from the US Treasury Department led to some major changes in the cryptocurrency markets, including how investors view and operate with the spot ETFs tracking BTC and the largest altcoins.
However, another investor shift came on Friday after the hawkish speech by Fed Chair Kevin Warsh. Some crypto ETFs have fallen out of grace, but others remain strong. Interestingly, the winner on Tuesday was neither of the two largest cryptocurrencies.
Who Won The Monday Battle?
Before we get to who stood out as the clear victor in terms of net inflows, let’s ensure that we know who didn’t. The first funds to go live on Wall Street, those tracking the performance of the market leader, were the only ones in the red on Monday. Investors pulled out $236.46 million, according to data from SoSoValue. As such, the Monday inflows of $216.70 million were dwarfed, and the week has turned red, even though there are three more business days left.
The ETFs tracking SOL, ETH, and XRP were all in the green. The Solana ETFs attracted $10.19 million, which was significantly higher than the Monday inflows of just $925,000.
The spot Ethereum funds fared slightly better, gaining $10.95 million on Tuesday. However, their Monday numbers were a lot more impressive, standing at $87.68 million. The ETH-tracking financial vehicles have been on a green-only streak for weeks, with no red days since August 11.
As the title of this article suggests, the winner on Tuesday was XRP. The exchange-traded funds tracking the cross-border token gained $14.38 million, which was nearly 3x higher than Monday’s $5.64 million. The funds have been on an even more impressive streak, as their last red day was August 5. Moreover, they have seen just two days with more outflows than inflows since July 2.
Naturally, the vast XRP Army was quick to celebrate the September 1 win.
US Spot ETF Flows Sep 1
XRP: +$14.38M
BTC funds saw net outflows while XRP, ETH and SOL ETFs all posted inflows a clear rotation signal despite the broader market being down 4% today. https://t.co/uK0Bs00Of0 pic.twitter.com/lUV9v4LHma
— 𝗕𝗮𝗻𝗸XRP (@BankXRP) September 2, 2026

XRP Fails to Capitalize
Although the spot XRP ETFs have become a fan favorite once again in recent weeks, the underlying asset has failed to continue its run. The token exploded in mid-August from $1.00 to $1.70 within 72 hours, but was rejected there and pushed south hard.
It lost a few key support levels, including $1.40 earlier this week. It now struggles below $1.35 after a 6% weekly decline. Nevertheless, analysts remain confident that its actual bull phase is around the corner, outlining some major targets of $7 and beyond.
The post The Crypto ETF Battle: How Ripple (XRP) Won September’s First Fight appeared first on CryptoPotato.
Ethereum’s post-breakout consolidation is beginning to tilt toward a corrective phase, with the price slipping below the lower end of its recent range. While the broader recovery remains intact, weakening short-term structure suggests ETH could seek liquidity at lower levels before buyers attempt another sustained advance.
Ethereum Price Analysis: The Daily Chart
Ethereum’s daily chart shows the market cooling considerably after the explosive rally from the $1.85K-$1.92K base. The move carried ETH directly into the major $2.44K-$2.51K resistance zone, but buyers have repeatedly failed to establish acceptance above this area.
The latest candles are now showing a gradual shift in favor of sellers. ETH has fallen below the lower boundary of the $2.44K-$2.51K resistance zone and is trading near $2.37K. This follows several unsuccessful attempts to continue toward the $2.57K local high, suggesting that the initial bullish momentum has been exhausted for the time being.
If the correction develops further, the Fibonacci retracement levels provide a useful roadmap. The 0.5 level sits around $2.21K, while the 0.618 retracement near $2.13K overlaps closely with the broader $2.07K-$2.16K support zone. This confluence makes the $2.07K-$2.21K region an important potential demand area during a deeper pullback.
Nevertheless, the broader bullish structure would not necessarily be invalidated by such a correction. A recovery back above the $2.44K-$2.51K resistance zone would instead reduce the immediate bearish pressure and put the $2.57K high back in focus.
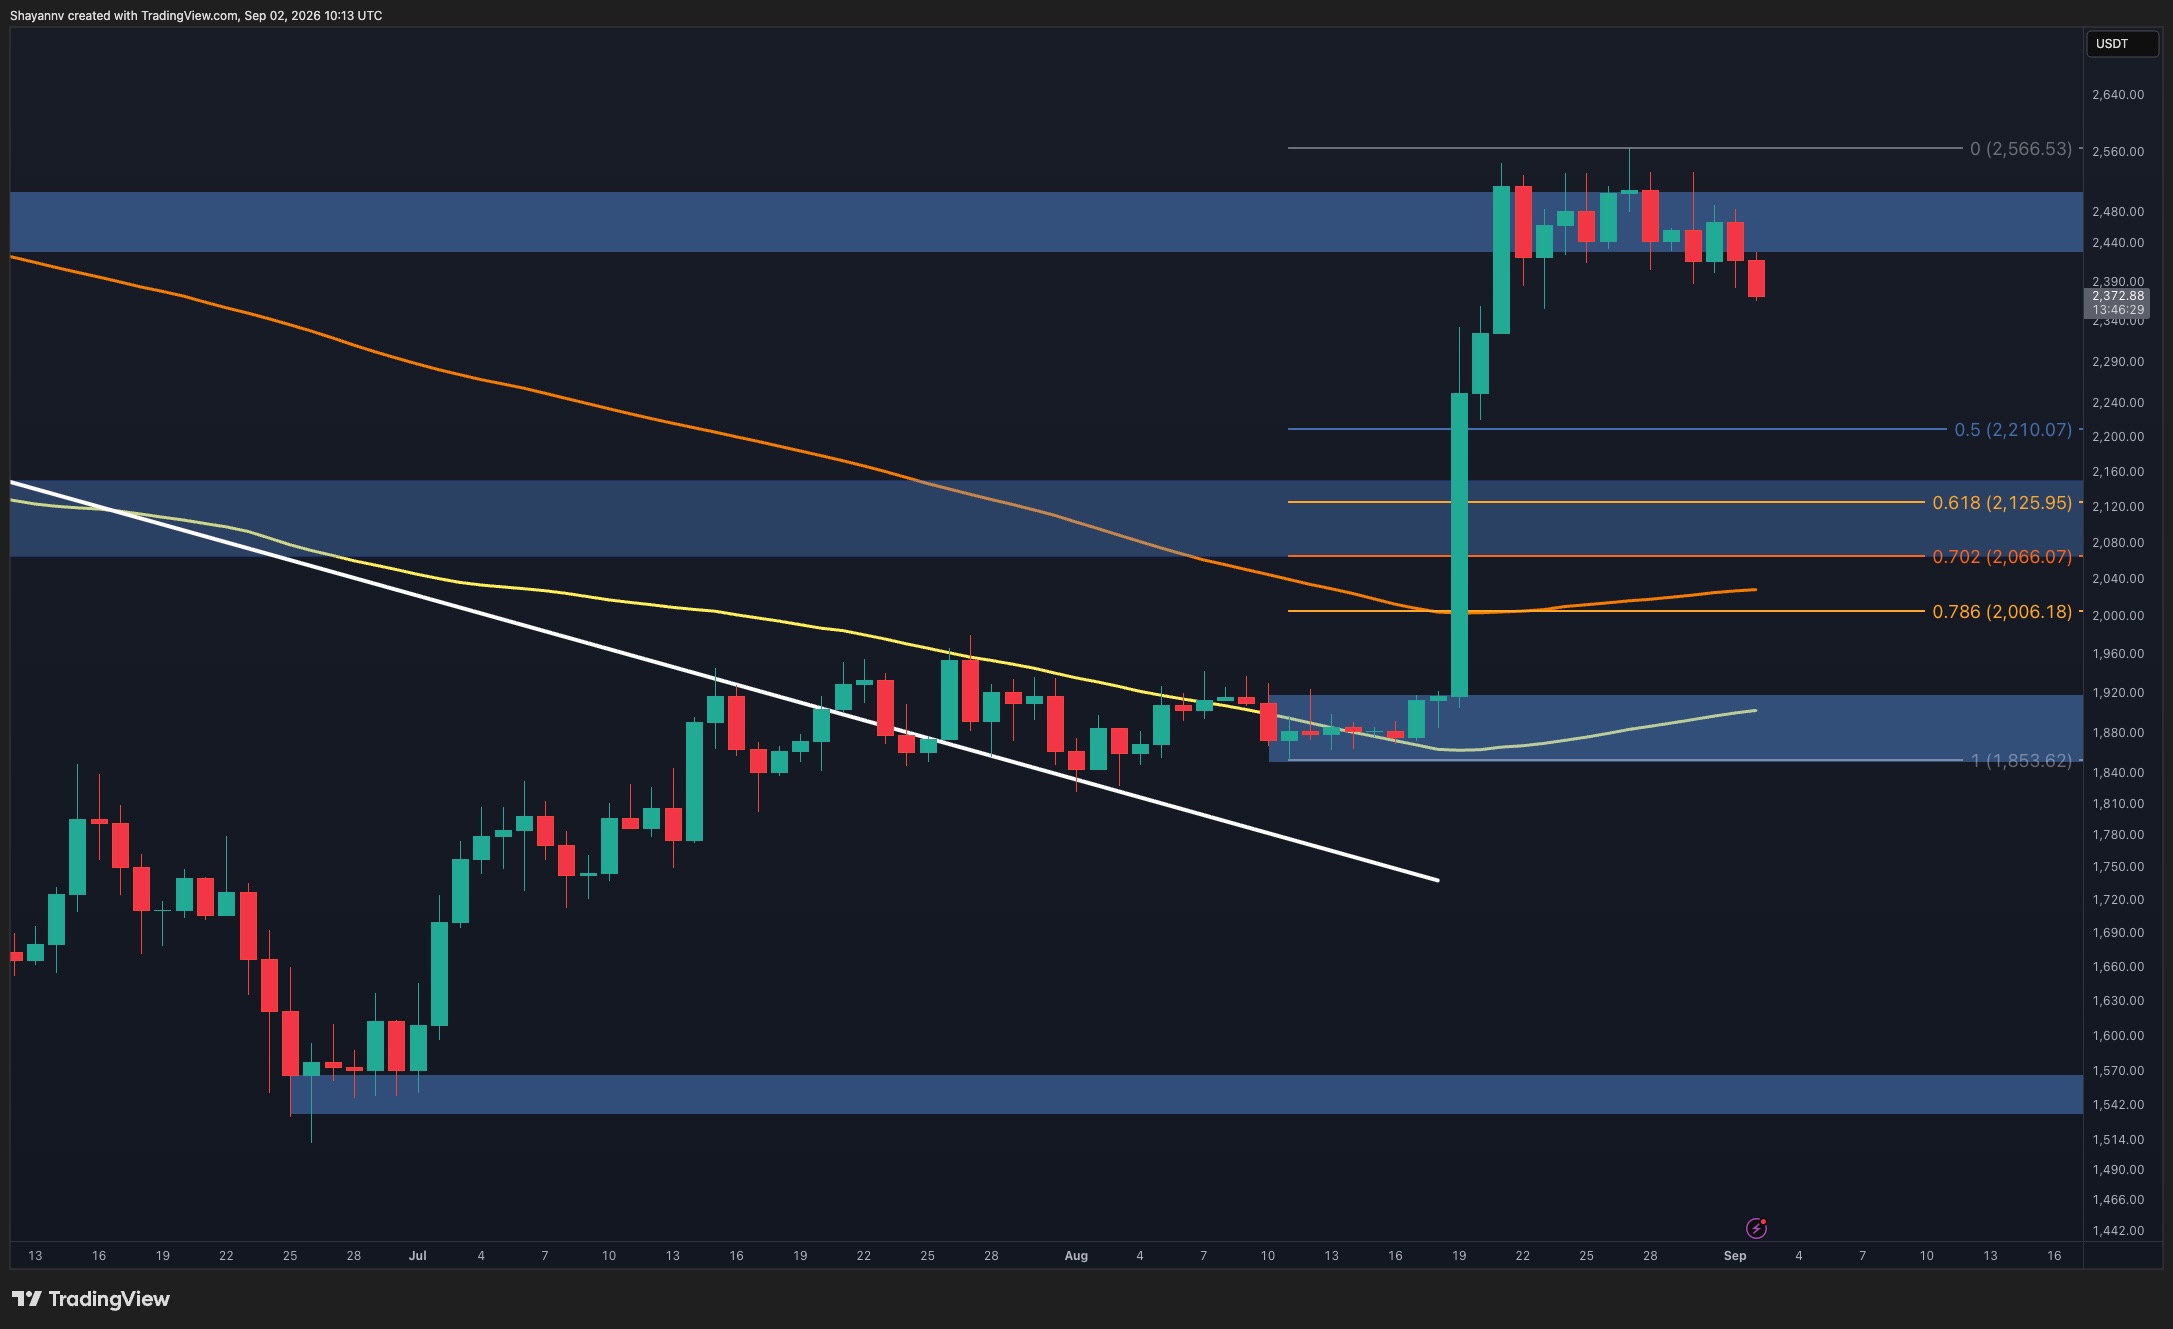
ETH/USDT 4-Hour Chart
The 4-hour timeframe presents a clearer deterioration in short-term market structure. After spending several sessions oscillating inside the $2.43K-$2.51K range, ETH has broken beneath its lower boundary and is now approaching $2.37K.
More importantly, recent rebounds have become progressively less effective at sustaining upside momentum. The latest rejection from the $2.48K-$2.50K area was followed by another sharp move lower, indicating that sellers are gaining control as the previous consolidation resolves to the downside.
The first major technical pullback zone is located around $2.21K-$2.31K. Considering the vertical nature of the original rally, relatively little price structure was established between the current market and this area, making a deeper retracement toward it increasingly plausible if selling pressure continues.
The next significant support sits around $2.07K-$2.12K. However, a recovery above the $2.43K-$2.51K zone would weaken the corrective scenario and indicate that the latest breakdown lacked sufficient follow-through.

Sentiment Analysis
The two-week ETH liquidation heatmap reinforces the possibility of a near-term move lower. With ETH trading around the upper-$2.3K region, a substantial concentration of liquidation liquidity is visible immediately beneath the market, roughly around $2.32K-$2.36K.
This downside liquidity represents the most relevant near-term target on the heatmap. If the current decline continues, the market could be drawn toward this cluster as leveraged positions are cleared and liquidity is collected.
Therefore, the liquidation data aligns with the weakening technical structure. A sweep of the liquidity below the current price could serve as the first objective of the developing pullback before the market determines whether a larger correction toward the major technical support zones is necessary.

The post Ethereum Price Prediction: Will ETH Drop to $2K Next if Buyers Fail to Regain Control Soon? appeared first on CryptoPotato.
You have all probably heard the speech that Ursula von der Leyen, the European Commission President, gave at the annual conference “La Rencontre des Entrepreneurs de France 2026,” held on August 26th. It’s been circulating on crypto Twitter like wildfire throughout the past few days.
To those of you who might have missed it, her message was rather clear: the world has already changed, and Europe must respond by becoming more independent, more industrially capable, and more willing to direct capital toward strategic priorities.
Von der Leyen argued that many of the assumptions that once underpinned the Union’s economic model have disappeared. Part of her point was that Europe must become a continent that “produces, invests and protects.” She said that the expanding access to China, open global trade, strategic American protection, cheap imported energy, as well as the West’s technological dominance can no longer be taken for granted.
And as a European, I can get behind some of the things she’s saying. European companies are facing increasingly high energy costs, regulatory complexity, and growing competition from China. However, I can’t help but consider one particular point she’s making to be rather alarming.
Today, 10 trillion EUR in household savings are kept in bank accounts. And a large share of Europe’s savings is invested outside our continent. Europe now needs to put these savings to work for its companies.
The intention behind this may be to boost growth, but the language, to me, reveals something important about the relationship between private wealth and governments.
E.U. Commission President said households have €10T sitting “idle” that can be “put to work” to boost the economy.
Yes, Ursula von der Leyen really said that.
Buy Bitcoin while you can! pic.twitter.com/hguuQjzk3r
— Bitcoin Archive (@BitcoinArchive) September 2, 2026

Who Should Control Your Savings?
From her speech, I see one thing: to policymakers, our household savings are increasingly viewed not just as our property, but as a resource – an economic catalyst that could be encouraged, incentivized, or regulated toward potential objectives.
And, mind you, consider this statement in light of how heavily Europe has traditionally been taxed. A very brief Google search shows that 4 of the top 5 countries in the world with the highest income tax rates are in the European Union.
We already surrender a massive share of our economic output to the state. That, apparently, isn’t sufficient to accomplish the Union’s political and industrial objectives.
So here’s my question: who should decide what my savings are for?
I’ve worked for my money; I’ve paid my taxes when I earned it; I’m also paying consumption taxes when I spend it in the form of VAT. Oh, by the way, guess where the top six countries with the highest VATs are located. So, having this in mind, should my savings be regarded as capital waiting to be deployed toward certain priorities, which may or may not align with my own?
Something’s Becoming Interesting
This is exactly where Bitcoin becomes interesting. With all of its flaws, Bitcoin represents the absolute opposite philosophy.
It’s an asset without a central issuer. The European Central Bank, or any other bank for that matter, cannot increase its total supply. The EC cannot decide to mint more BTC to finance industrial expansion. There is no government that can determine its issuance schedule.
There will never be more than 21 million bitcoin in existence. I can hold it without an intermediary (I know, lately this has become a touchy subject, but still). If I hold it on my own and keep my private keys private, theoretically, nobody can confiscate it. Nobody can tell me what to do with it.
This is an important distinction – one that carries increasing significance in the times that we appear to be headed toward.
Now, don’t get me wrong, I’m not trying to call out European politicians for doing something they haven’t yet done. Most headlines on this topic scream “the EU wants to steal your savings,” while I’m taking a more moderate approach. As an EU citizen, however, as someone who has spent my entire life here, I cannot rule that possibility out, especially not in the face of modern politics.
A few years ago, we were in Amsterdam at a Bitcoin conference, and we asked a bunch of people: “Why do you Bitcoin?”
I guess this is my answer: this is why I Bitcoin.
The post When Governments Want to Direct Your Wealth, Bitcoin Offers an Exit appeared first on CryptoPotato.
Financial markets experienced enhanced turbulence in the middle of August after the US Treasury Department’s Scott Bessent announced a major monetary pivot.
Bitcoin and gold were among the most significant beneficiaries, posting substantial gains in the first few days. However, the landscape has since changed, especially for the precious metal.
What Happened?
On August 19, the US Treasury Department said it will at least be doubling the maximum size of liquidity-support buybacks for longer-dated government debt, raising them from $2 billion to $4 billion per operation. This came after the bond market’s notable rise to a 19-year high, as the 30-year Treasury yield touched 5.34% the day before.
The impact on financial markets was immediate. The same 30-year Treasury yield corrected to 5.2%, while gold, stocks, and crypto rocketed. The precious metal went from $4,360/oz to $4,530/oz in hours. It kept surging in the following days and skyrocketed to $4,700 per ounce on August 25, which became its highest price tag in over three months.
Bitcoin also reached a similar local peak, but its rally was even more impressive. The cryptocurrency struggled below $65,000 for weeks before it exploded to $81,500 last week.
The two assets, considered safe havens by many investors, were at the forefront of financial gains. Moreover, analysts began commenting that their spectacular rise was due to the ‘debasement trade’ narrative as the greenback weakened while the US debt kept growing.
Gold Down, BTC Stable
The macro situation has since changed, and most of the aforementioned price movements have returned to their starting point. Perhaps the most significant change came last Friday, when the new Federal Reserve Chairman, Kevin Warsh, spoke at Jackson Hole. Although he didn’t say it directly, his speech was quite hawkish, and markets interpreted it as a sign of upcoming rate hikes.
BTC slipped by a few grand to $77,000, while the US bond market reclaimed almost all of its lost value. Gold, on the other hand, was rejected at $4,700 and plunged to $4,300 earlier today. This meant that it not only gave up all its gains but also dropped below its starting level, as it is down by over 8.5% from the local peak.

Although bitcoin has fallen from $81,000, it remains 20% higher than $64,000, where its run began. However, there are a few cracks now, which could suggest that its price might follow the bullion. Aside from the macro perspective returning to unfavorable for risk-on assets, the spot BTC ETFs have experienced more withdrawals than inflows in the past couple of business days as the initial rush is over.
Separately, if you want to know about the market state, the recent Iran-US tension, and other hot crypto news, please check our video below.
The post Gold Just Erased All Its August Gains – Bitcoin Is Holding Up Better at $77K appeared first on CryptoPotato.