Cryptocurrency Posts
Crypto Briefing
Meta's open-weight AI model testing in Arena could accelerate innovation in AI development, fostering collaboration and transparency.
The post Meta’s Muse Spark Open lands in Arena for public testing appeared first on Crypto Briefing.
Solana's record tokenized equities volume in Q3 2026 signals robust network engagement and potential positive impacts on its market value.
The post Solana hits record $7B in tokenized equities volume in Q3 2026 appeared first on Crypto Briefing.
The slow AI adoption highlights a competitive gap, urging firms to embrace transformation or risk falling behind in revenue and productivity.
The post Accenture CTO says few companies have truly reinvented operations with AI appeared first on Crypto Briefing.
Ethereum's evolution towards decentralized leadership could enhance resilience and innovation, reducing reliance on any single individual.
The post Vitalik Buterin says Ethereum is outgrowing its founder appeared first on Crypto Briefing.
Catalio's fundraising efforts highlight growing investor confidence in AI-driven healthcare innovations, potentially reshaping the industry landscape.
The post KKR-backed Catalio Capital seeks $500 million for AI healthcare startups appeared first on Crypto Briefing.
Bitcoin Magazine
Bitcoin Magazine
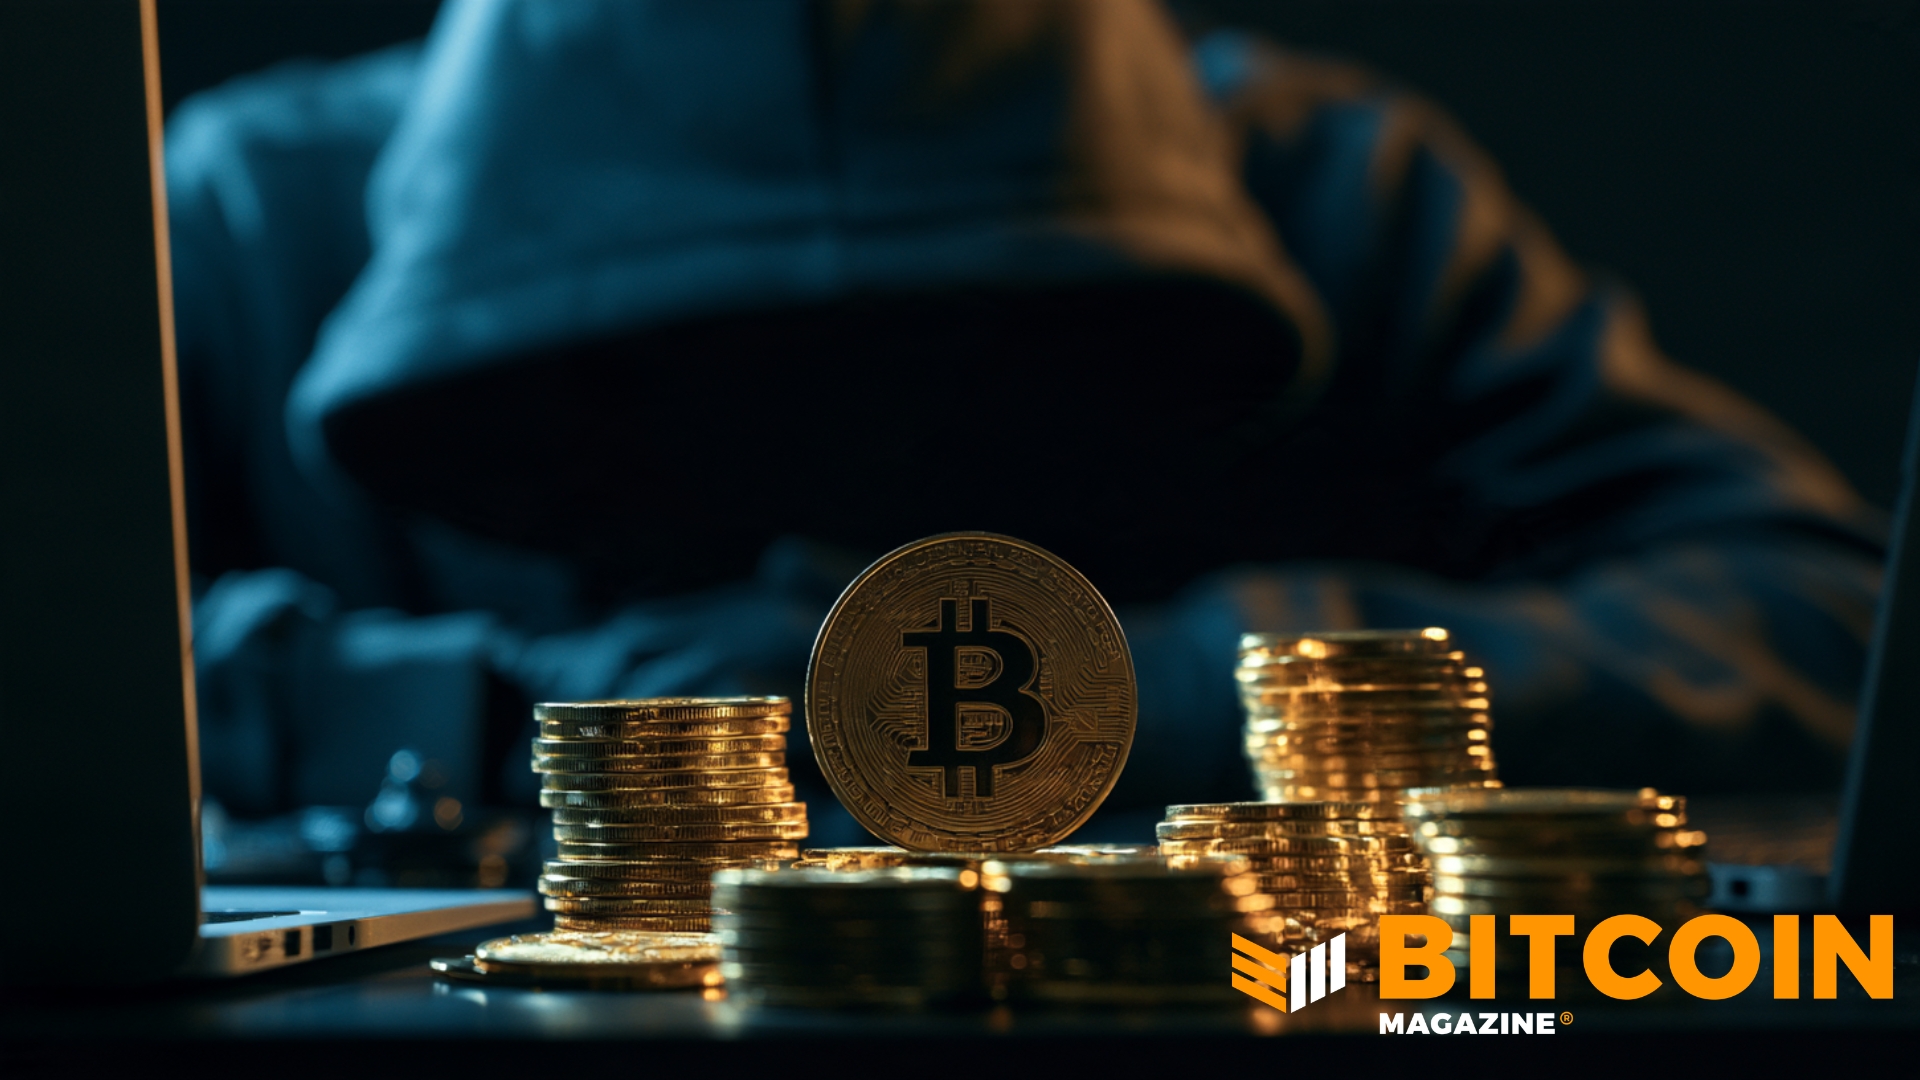
Ledger Says Organized Crime Group Spent Millions Targeting Hardware Wallet Users
Ledger has issued a statement following reports from customers of loss of funds and tampered devices, calling it one the most “sophisticated attacks” the digital asset industry has experienced.
The hardware manufacturer said Thursday that a “highly organized criminal group” bought Ledger devices and installed implants that could read users’ seedphrases before then putting them back into the supply chain via resellers.
Paris-based Ledger last week said it had started an investigation after customers in South East Asia reported they’d lost funds after buying from Malaysia-based reseller, CryptoBilis.
The company then said it confirmed that one of the impacted users’ devices contained an unauthorized hardware implant.
It isn’t clear how much money has been lost from the tampered devices but blockchain investigator Specter said $86 million had been drained. Ledger did not respond to Bitcoin Magazine’s written questions.
“[The criminal group] built their own logistics and technology infrastructure with seeds collector servers, draining and laundering infrastructures. They were patient, they spent millions, and they struck in one coordinated operation, draining wallets,” Ledger said in a Thursday statement.
“There was no flaw in Ledger’s chip, operating system or servers. Ledger’s systems were not compromised. This was an attack on the distribution channel after the devices left our control.”
The company said that in its “largest investigation to date” it sent employees to other markets — including Europe — to make sure other supply chains hadn’t been targeted.
It said that screened devices were clean and authorized resellers and distributors in Southeast Asia and Hong Kong have suspended their sales.
Ledger added that it was working with law enforcement to “follow the funds and dismantle the attackers’ infrastructure.”
It isn’t clear how many customers had been targeted from Ledger’s statement.
The crypto industry is still reeling after hackers in July were able to steal close to $120 million in bitcoin from Coldcard users.
There have also been a number of data breaches this year, with scammers targeting Ledger to get customer information via the company’s payment processor Global-e.
This post Ledger Says Organized Crime Group Spent Millions Targeting Hardware Wallet Users first appeared on Bitcoin Magazine and is written by Mathew Di Salvo.
Bitcoin Magazine
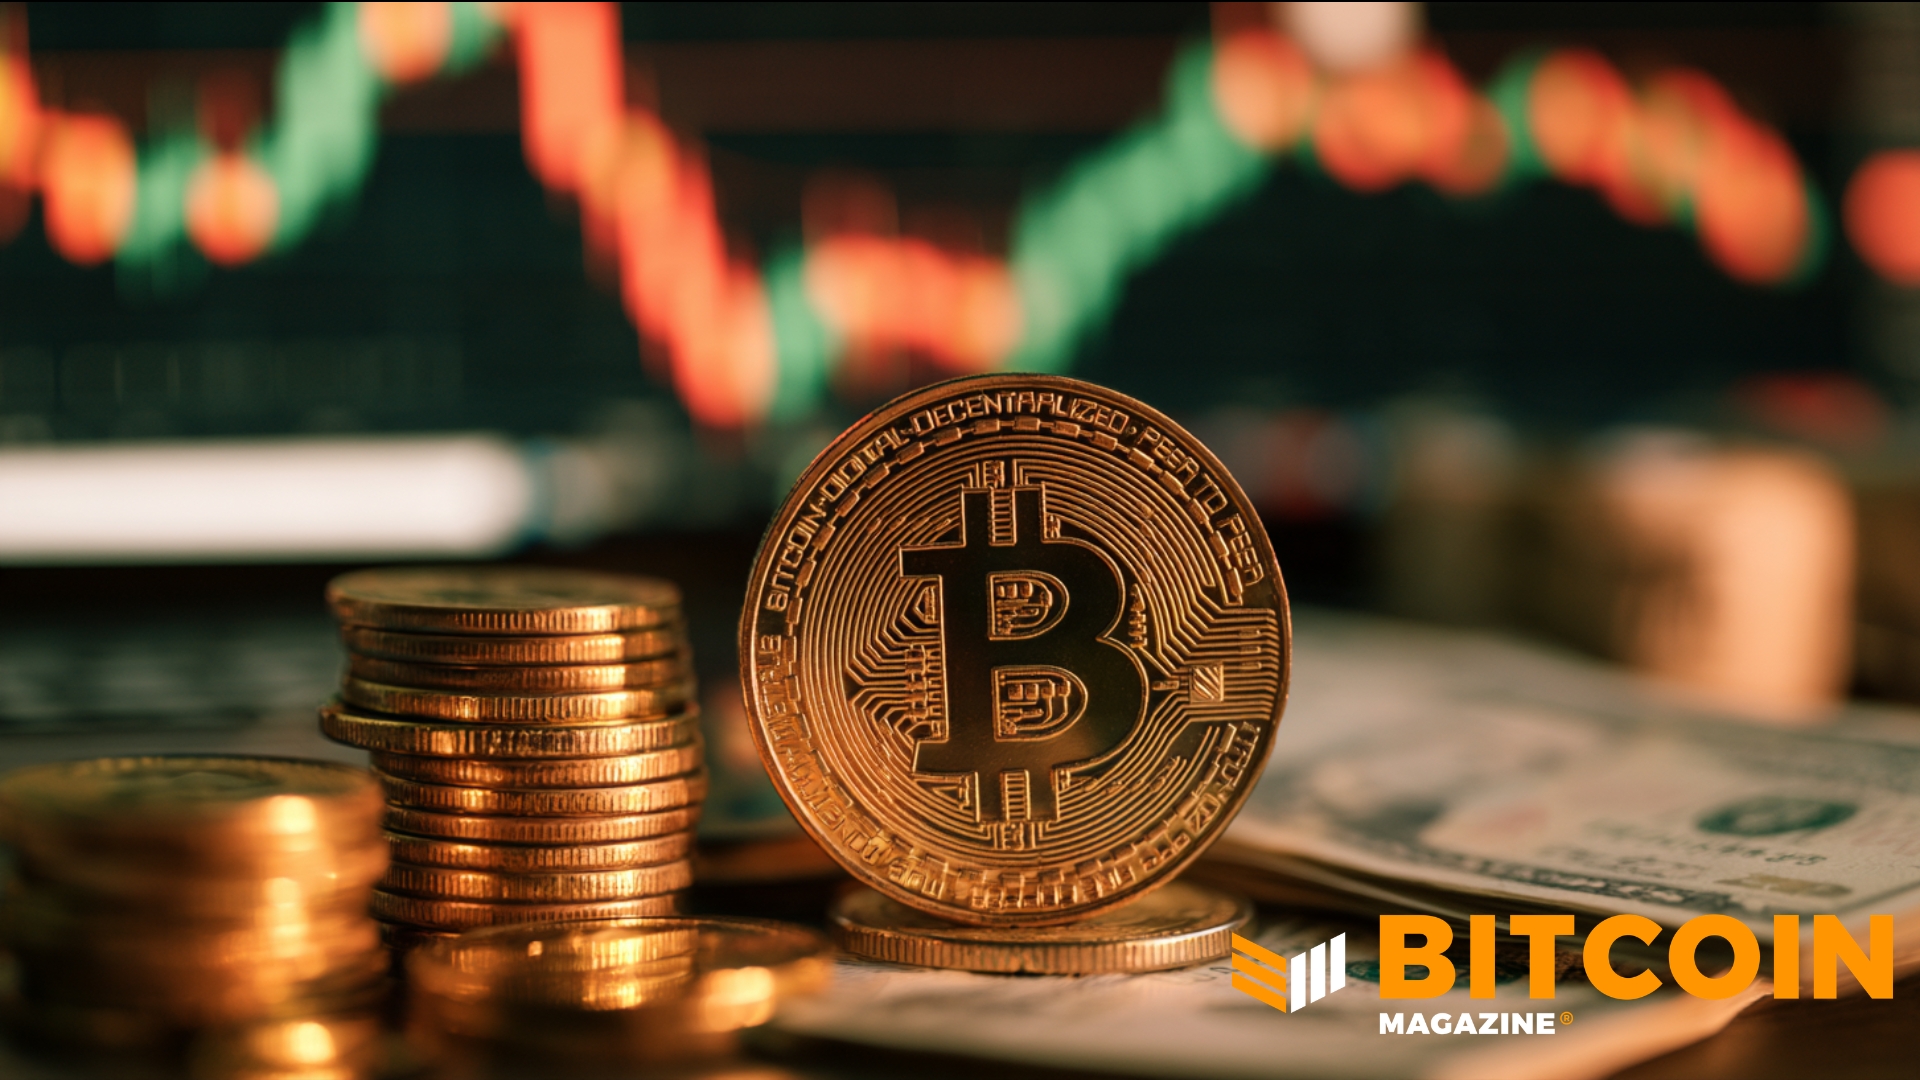
Bitcoin Briefly Slides Below $80,000 On More Hot Inflation Data
Bitcoin’s price momentarily dipped below $80,000 on Thursday following more hotter-than-expected U.S. inflation data.
The price of the biggest cryptocurrency recently stood at $81,028 after dropping as low as $79,805 on Thursday morning in New York.
Over a 24-hour period, it’s only down over 1% after making a recovery. But over the past week, it’s shed nearly 3% of its value.
Data Thursday from the Labor Department’s Bureau of Labor Statistics showed U.S. producer prices rose in September at the fastest pace in more than four years.
The numbers came one day after September’s Consumer Price Index came out higher than expected.
Bitcoin has news that high prices won’t go away in the world’s largest economy — leading traders to bet that the Federal Reserve may keep interest rates higher for longer.
The Federal Reserve will make a decision on what to do with interest rates at the end of this month.
Bitcoin’s price has previously done well in a low interest rate environment as when borrowing costs are cut, more liquidity can be used to buy the cryptocurrency.
But the Fed this year has raised interest rates, with the head of the central bank claiming that getting inflation down in the U.S. is its number one priority.
The biggest cryptocurrency is currently nearly 36% below the record of $126,080 it touched last October.
Despite the dip this week, analysts have declared the asset to be out of the bear market it spent most of 2026 following a rally in August and September.
This post Bitcoin Briefly Slides Below $80,000 On More Hot Inflation Data first appeared on Bitcoin Magazine and is written by Mathew Di Salvo.
Bitcoin Magazine

Latin America’s MSTR: How OranjeBTC is Running the Saylor Playbook in Brazil | Gui Gomes
Bitcoin is “likely the best collateral one could ask for,” says OranjeBTC CEO Gui Gomes. He explains how digital credit, Bitcoin-backed loans, and new financial products are pushing Bitcoin deeper into global financial markets, including a first-of-its-kind Bitcoin-backed loan in Brazil. He also shares why every step brings Bitcoin closer to becoming the world’s reserve currency.
Chapters:
0:00 – OranjeBTC CEO Gui Gomes on Running the Strategy Playbook in Latin America
0:32 – Why Brazil Ranks No. 1 in Grassroots Bitcoin Adoption
1:57 – Brazil’s Advantages for Building a Bitcoin Treasury Company
3:38 – Brazil’s New Bitcoin Regulations and VASP Licensing
5:23 – Brazil’s Elections and the Shift Toward a Pro-Market Economy
7:22 – Lower Rates, the Real and Brazil’s Next Growth Phase
8:27 – How Global Investors Can Buy OranjeBTC Shares
9:21 – DIGI11: Bringing STRC and SATA to Brazilian Investors
11:21 – How DIGI11 Delivered Its First Dividend
14:08 – Bitcoin as Collateral and the Future of Digital Credit
DISCLAIMER: The views and opinions expressed in this show are those of the participants and do not necessarily reflect the official policy or position of BTC Inc., Bitcoin Magazine, or any affiliated entities. This content is provided for informational and educational purposes only and should not be construed as investment, legal, tax, or accounting advice. Nothing contained in this show constitutes a solicitation, recommendation, endorsement, or offer to buy or sell any securities or financial instruments. Viewers should consult their own advisors before making financial or business decisions.
This post Latin America’s MSTR: How OranjeBTC is Running the Saylor Playbook in Brazil | Gui Gomes first appeared on Bitcoin Magazine and is written by Patrick Green.
Bitcoin Magazine

Charles Edwards: Why Quantum Risk Could Be MASSIVE BTC Upside Catalyst
What will it take for Bitcoin to break to new all-time highs? Charles Edwards says something substantial has to happen, whether it’s real progress on quantum, a shift in Fed policy, the U.S. government buying Bitcoin, or a stimulus event. He also discusses how institutional buying through ETFs is keeping the backdrop strong.
Chapters:
0:00 – Charles Edwards on Rates, Liquidity and Bitcoin’s Market Outlook
1:36 – ETFs vs. Treasury Companies: Who’s Driving Bitcoin Buying?
2:54 – How AI-Driven Unemployment Could Change the Fed and Bitcoin
4:01 – Hash Ribbons: Why Rising Hash Rate Is a Bullish Signal
6:13 – Is This Hash Rate Cycle Different With AI?
8:14 – Is Bitcoin Still Undervalued? Production Cost, Energy Value and MVRV
10:37 – Global Liquidity, 5% Rates and Bitcoin’s Uncharted Territory
14:50 – Quantum Computing: Why a Roadmap Could Be an Upside Catalyst
17:21 – Can AI Break Bitcoin? Superintelligence and Encryption Risk
19:15 – What Could Trigger Bitcoin’s Next All-Time High
DISCLAIMER: The views and opinions expressed in this show are those of the participants and do not necessarily reflect the official policy or position of BTC Inc., Bitcoin Magazine, or any affiliated entities. This content is provided for informational and educational purposes only and should not be construed as investment, legal, tax, or accounting advice. Nothing contained in this show constitutes a solicitation, recommendation, endorsement, or offer to buy or sell any securities or financial instruments. Viewers should consult their own advisors before making financial or business decisions.
This post Charles Edwards: Why Quantum Risk Could Be MASSIVE BTC Upside Catalyst first appeared on Bitcoin Magazine and is written by Patrick Green.
Bitcoin Magazine

Wellington-Altus’ James Thorne: Bitcoin “Supercycle” has Begun
“The next run in Bitcoin is going to be one for the ages.” Economist James Thorne, Chief Market Strategist at Wellington-Altus Private Wealth, joins Grace Remington and Sean Hagan to explain why he believes Bitcoin is entering a generational supercycle. Drawing on his experience with the commodities supercycle, he explains why a changing market structure makes this time different. He also explains why he thinks the four-year cycle is done.
Chapters:
0:00 – James Thorne on Hot Core CPI: Why Shelter, Not Energy, Drove It
1:30 – Is the Fed Making a Policy Mistake by Hiking?
5:35 – Why Hedge Funds Are Acting Like the New Bond Vigilantes
6:42 – Can AI Deliver a Greenspan Moment? Warsh’s Jackson Hole Miss
10:22 – Why Bitcoin Is Entering a Generational Supercycle
14:11 – The Four-Year Cycle Is Done and Who Buys Bitcoin Next
18:45 – Why Bitcoin Solves the Settlement Problem
21:15 – Strategy, Pristine Collateral and Harvesting Bitcoin Volatility
24:59 – Tokenization and the End of Delayed Innovation
27:04 – Bitcoin vs. Gold: Will Bitcoin’s Market Cap Surpass Gold?
DISCLAIMER: The views and opinions expressed in this show are those of the participants and do not necessarily reflect the official policy or position of BTC Inc., Bitcoin Magazine, or any affiliated entities. This content is provided for informational and educational purposes only and should not be construed as investment, legal, tax, or accounting advice. Nothing contained in this show constitutes a solicitation, recommendation, endorsement, or offer to buy or sell any securities or financial instruments. Viewers should consult their own advisors before making financial or business decisions.
This post Wellington-Altus’ James Thorne: Bitcoin “Supercycle” has Begun first appeared on Bitcoin Magazine and is written by Patrick Green.
CryptoSlate
Hyperliquid force-liquidated 1,650 ETH early on Oct. 15, and the tracked wallet held a new 2,500 ETH long by 13:16 BST.
Read the full story on CryptoSlate
Understand the crypto stories that matter and what to watch next. Get The Catalyst in your inbox
Bitcoin registered an intraday low of $79,730 before recovering to around $82,000 as surging US wholesale inflation intensified a cryptocurrency selloff that triggered nearly $940 million in liquidations. This price action extended losses as stronger-than-expected inflation data raised concerns about another interest rate hike by the Federal Reserve. According to CoinGlass, 176,506 traders were liquidated…
Read the full story on CryptoSlate
Understand the crypto stories that matter and what to watch next. Get The Catalyst in your inbox
President Donald Trump's crypto agenda has lost a White House negotiator as Patrick Witt confirms his departure and the administration's flagship digital-asset legislation remains stalled in Congress. On Oct. 15, Patrick Witt, executive director of the White House Crypto Council, confirmed his departure after nearly two years in the administration, leaving the government for an…
Read the full story on CryptoSlate
Understand the crypto stories that matter and what to watch next. Get The Catalyst in your inbox
The proposed A$200,000 custody floor comes with asset and revenue tests and requirements for the outside custodian.
Read the full story on CryptoSlate
Understand the crypto stories that matter and what to watch next. Get The Catalyst in your inbox
Chainalysis’s rate covers wallets already active on multiple days, leaving overall retention and independent commercial demand unmeasured.
Read the full story on CryptoSlate
Understand the crypto stories that matter and what to watch next. Get The Catalyst in your inbox
CryptoTicker.io
Memeland is the crypto project behind the joke platform 9GAG, and MEME is its token. Three years after the launch, two figures capture where it stands: MEME trades around 99 percent below its record of March 2024, and the floor price of the project's best-known NFT collection has fallen from 9.73 Ether to 0.02 Ether. We measured both ourselves at midday on Wednesday.
This is not a report on a single day but a stocktake. Anyone coming across Memeland today finds a well-known brand, two fully minted NFT collections, a token with 64.8 billion units in circulation and no published development plan. This article sets out what of that is documented, how pricing works in collections of this kind, and what a loss on a sale means for tax in Germany. If you are looking for a venue to trade meme tokens, our overview of crypto exchanges licensed in Germany helps place the providers.
Memeland, 9GAG and the idea behind the meme ecosystem
9GAG is one of the older platforms for internet humour, founded in Hong Kong in 2008. Memeland is the Web3 arm of that house and describes itself on its own site as a Web3 venture studio and ecosystem. The thinking behind it was common at the time: a brand with wide reach issues NFT collections, the buyers of those collections form a community, and later that community receives a token.
An NFT is an entry on a blockchain tied to a single item, which is why it cannot be swapped for an equivalent piece the way one unit of Bitcoin can be swapped for another. What rights an NFT actually transfers is set by the issuer's licence alone, not by the blockchain. On that basis Memeland issued two collections: The Potatoz and The Captainz, each with 9,999 pieces.
How the token came about
MEME launched in November 2023 and reached further trading venues in January 2024. According to CoinGecko's classification, the token belongs to the Binance Launchpool and to the portfolio of YZi Labs, formerly Binance Labs. It runs on Ethereum rather than on a blockchain of its own, and the house has not disclosed an investment figure in the reports available.
The MEME token: 69 billion units and a price of $0.0005
At midday on Wednesday MEME stood at $0.000515, or €0.00046. Market capitalisation was around $33.4 million and trading volume over the preceding 24 hours around $4.9 million. CoinGecko ranks the token 617th by market capitalisation.
The supply side matters more than the price. Maximum supply is 69 billion MEME, of which 64.77 billion are in circulation, just under 94 percent. According to the token page on the Ethereum explorer, around 738,000 addresses hold it. A unit count that high against a small market capitalisation has an arithmetic consequence: every cent of price movement would be a multiple of today's level, which is exactly why price targets that the supply side rules out circulate around tokens like this. At 69 billion units, a price of one cent would imply a valuation of $690 million.
99 percent below the record: what the MEME price figures say
MEME reached its high on March 4, 2024, at $0.056324. From today's price that is a gap of 99.1 percent. Over twelve months the token is down 69.3 percent, but over the last thirty days only 2.3 percent: the large move lies further back than those thirty days.
A low from August of this year sits at $0.0004437 according to CoinMarketCap, just under today's price. The token has therefore been moving in a narrow band close to its low for months. For context, that means neither a slump nor a recovery defines the picture, but a long sideways stretch at a low level.
The Captainz: from a 9.73 Ether floor price to 0.02
The trend reads more clearly in the NFT collections than in the token. For The Captainz, the better known of the two, the highest floor price ever reached was 9.73 Ether, around $21,226 at the time. At midday on Wednesday the price tag read 0.01999 Ether, or $49.65. That is 99.8 percent less.
The collection comprises 9,999 pieces spread across 2,969 addresses. That works out at a total valuation of around $496,000 for the whole collection. Trading volume over the last 24 hours came to 0.10 Ether, roughly $250 for the entire day.

The Potatoz: same unit count, a different path
The Potatoz came before the Captainz and also comprises 9,999 pieces, spread across 2,329 addresses. At midday on Wednesday the floor price was 0.025 Ether, or $62.87, and therefore above that of the Captainz. The highest floor price ever reached was 6.78 Ether, around $16,143, leaving a gap of 99.6 percent.
The relationship between the two collections is worth noting. The Captainz counted as the higher-grade collection and held the higher record, yet today they sit below the Potatoz. Trading volume tells a similar story: 0.68 Ether for the Potatoz against 0.10 for the Captainz over 24 hours. Buying or selling today means meeting a market in which, on some days, only a handful of pieces change hands in either collection. For an overview of the venues that trade collections like these, see our comparison of NFT marketplaces.
Why a floor price is not a market price
The floor price is the cheapest active sell offer in a collection. It says at what price someone would be willing to sell, not that anyone is buying at that price. In a collection of 9,999 pieces with a daily turnover of a few units, that distinction carries real weight: the floor price can stand for weeks without a single sale going through.
A caution follows for any valuation. The calculation of unit count times floor price, which we made above as well, produces a theoretical number. If all 9,999 Captainz were offered at once, the achievable price would be lower than today's floor. The figure works for comparison over time, not as a statement of wealth.
What Ether as the unit of account changes
Floor prices for NFT collections on Ethereum are quoted in Ether, not in euros. If the Ether price falls, the euro value of a collection falls too, even when its floor price in Ether stays the same. In the Captainz both directions coincide: the floor price in Ether is down 99.8 percent, and in dollar terms the figure comes out at almost the same 99.8 percent, because the Ether price today sits at a similar level to the time of the record.
No official roadmap: what the valuation rests on instead
According to CoinMarketCap's classification there is no published development roadmap for MEME, and the valuation therefore rests on the brand and on community interest. The same service lists recent activity around MemeDay events, the Meme69 Awards and brand collaborations.
That assessment comes from a data service, not from the project itself, and should be read as such. The counter-check is documented: on the official project pages of Memeland and of the token, no development plan with dates was findable on Wednesday. What is missing is not an accusation but a finding about the information available. It matters for valuing a token all the same: without an announced function or use of revenue, there is no measure against which a price could be tested.
The technical question behind it
Utility in crypto usage means the function a token performs within a system: paying fees, voting on changes, securing computing power. A token without such a function is not therefore worthless, but its price forms purely out of supply, demand and attention. More on that distinction and on what sets the segment apart is in our overview of meme tokens.
Binance Launchpool and YZi Labs: how MEME reached the exchanges
MEME entered circulation through the Binance Launchpool, a scheme in which users lock existing balances for a limited period and receive units of a new token in return. For a young project that route brings reach and a widely distributed initial supply; for the participants it brings units at no purchase price. Both shape trading in the first months, because part of those holdings is sold early.
Added to that is the classification as a YZi Labs holding, formerly Binance Labs. A stake points to a funding round, but it is not a mark of quality and not a commitment for the future. The size of the investment has not been published in the reports available, so no valuation can be derived from it either.
What separates a meme token from a network token
A network token such as Ether belongs to a blockchain and is needed there to pay transaction fees. A meme token, by contrast, is usually a contract on someone else's blockchain; in MEME's case a standard contract on Ethereum. The technical bar is low, so what distinguishes two meme tokens is not the technology but the reach behind them.
On reach Memeland had a genuine head start, namely an existing platform with a large audience. Today's figures show that the advantage did not carry the price over three years. That is the sober lesson from this case, and it holds beyond Memeland: reach generates attention at launch, but it does not replace continuing demand. How other houses of the same years have fared, we counted up in our review of the state of the Web3 gaming companies and in our review of Illuvium, Axie and Sandbox.

Tax in Germany: how to treat losses on crypto sales
Selling tokens or NFTs at a loss can be used for tax purposes in Germany, but only within narrow limits. Crypto assets count as other economic goods under section 23 of the Income Tax Act. A loss on their sale therefore reduces only gains from private disposals in the same year, not gains from shares or interest. Any remainder can be carried back to the previous year or forward into coming years.
Two points are easy to miss here. First, a sale has to actually take place: a price decline on its own creates no usable tax loss while the position is held. Second, the same one-year period applies as it does to gains. If the purchase lies more than a year back, a gain is tax-free, and consequently a loss is then irrelevant for tax too. How a complete write-off differs from that, we set out in the case of a total loss.
What belongs in the records
For every position you need the purchase date, purchase price, sale date and sale price, and for NFTs the contract address and the item number as well. For a collection traded across several marketplaces, that statement rarely sits in one place. Only the tax office or a tax adviser can give binding answers on an individual case.
Where MEME can be traded in Germany and what MiCA has to do with it
Since the European regulation on markets in crypto assets, MiCA for short, providers addressing customers in the European Union need authorisation from a national supervisor. In Germany, BaFin grants it and supervises them. The licence says nothing about the quality of an individual token: what is examined is the provider, its custody, its capital adequacy and its duties towards customers.
In practice, for a token well outside the large caps that means this: it appears in the range of licensed providers less often than on unlicensed platforms. Before buying, it is worth checking whether the chosen venue holds a European licence and how it keeps the tokens in custody, because that determines what can be recovered if something goes wrong.
MEME token: without a roadmap, attention alone decides
Memeland remains a well-known brand with two fully minted collections and a widely held token. What the figures lack is demand reaching beyond the launch phase. Three steps help in judging a case like this soberly:
- Look at the supply side before the price. Multiply maximum supply by your target price and see what valuation comes out. At 69 billion units, one cent already means $690 million. Where a token can be traded at what cost, and which providers hold European authorisation, is shown in our exchange comparison.
- Read trading volume alongside the floor price. A floor price without turnover is an offer, not a price. Check the number of sales over recent days and the number of holding addresses next to the floor price. Which venues generate any turnover at all for a collection is in our comparison of NFT marketplaces.
- Document losses before you sell. Purchase and sale data for each position determine whether a loss is usable and against which gains. For pulling records together across several marketplaces, portfolio trackers with tax reporting help.
(As of October 14, 2026. This article is not investment advice. Prices and fee structures change; check the terms with the provider before you buy.)
The first American spot fund on Polkadot manages $11,567,725.24, according to its provider. That is the reading from October 14, 2026, a good seven months after it launched on March 6. By way of comparison: the DOT spot market turned over $160.9 million in the past 24 hours. The fund meant to bring institutional money into Polkadot is therefore smaller than a fifteenth of a single trading day.
This article answers three questions. What exactly sits inside the fund, and what that says about demand for DOT. Why a vehicle of this size neither carries the price nor weighs on it. And what investors in Germany gain from it when they cannot buy the product in the first place. The shortest answer to the third question up front: the American fund costs 0.30 percent a year, while the route open to you in Germany costs 2.50 percent. More hangs on that gap than on any price level this week.
What the 21Shares Polkadot ETF has gathered since March 6
The product is called the 21shares Polkadot Staking ETF and trades under the ticker TDOT on the Nasdaq. On the issuer's product page, 21Shares gives March 6, 2026 as the launch date, 0.30 percent as the management fee and the $11,567,725.24 above as assets under management, as of October 14. The page lists BitGo Bank & Trust, Coinbase Custody and Anchorage Digital Bank as custodians. The word staking in the name means the fund does not merely hold the DOT in custody but stakes them in the network and collects the rewards.
A spot ETF is an exchange-traded fund that holds the asset itself, here real DOT with a custodian, rather than futures contracts on it. The share price therefore follows the coin price directly, less the fee.
At the data service SoSoValue, whose daily figures the industry outlet TokenPost reported on October 14, TDOT shows cumulative net inflows of $3.33 million. The fund was unchanged that day and the day before, so no money flowed in or out. The same table gives trading turnover of $111,586 and a ratio of 0.62 percent. It names no reference figure for that percentage. Checked against the market capitalisation of DOT, which stood at $1.847 billion on Thursday, $11.57 million comes to exactly 0.626 percent. The figure therefore refers to the share of the entire Polkadot market.
Measured in DOT, at a price of $1.082 that is around 10.7 million units. Circulating supply is 1.707 billion DOT. The largest American fund on Polkadot thus holds fewer than one in every hundred coins.
$111,586 in a trading day: the size against the DOT spot market
The more telling figure is not the assets but the turnover. Trading volume of $111,586 in a day sounds like little, and in relative terms it is less still: the DOT spot market turned over $160,945,583 in the same period. By our calculation, ETF trading accounts for 0.069 percent of that, barely seven hundredths of a percent.
That ratio is why the fund figures are practically meaningless for the price. A spot ETF acts on the price by buying coins in the market on inflows and selling them on outflows. No inflows, no buying power. At the Bitcoin ETF launch in January 2024 precisely the reverse happened: billions flowed in over the first weeks, and the funds had to buy in the spot market every day. At TDOT, seven months have produced $3.33 million of net inflows.
The Dogecoin case: the size at which an altcoin fund gets closed
How small an altcoin fund can get before its provider gives up has just been shown elsewhere. On October 10 we wrote about the wind-down of the Bitwise Dogecoin ETF. That vehicle, ticker BWOW, held around 8.2 million DOGE according to the holdings on its fund page, roughly $707,000 at the price of the time. It traded for the last time on October 14, just under eleven months after launch.
At $11.57 million, TDOT is therefore about sixteen times the size of the Dogecoin fund on its final trading day. The product is a long way from closure, and nobody should read an imminent wind-down out of the weak inflows. What the comparison shows is something else: the American fund industry launched a run of altcoin products in 2026, and demand is spread very unevenly. Bitcoin and Ethereum draw the money, while the remaining funds collect sums that have no measurable effect on the price of their coin.
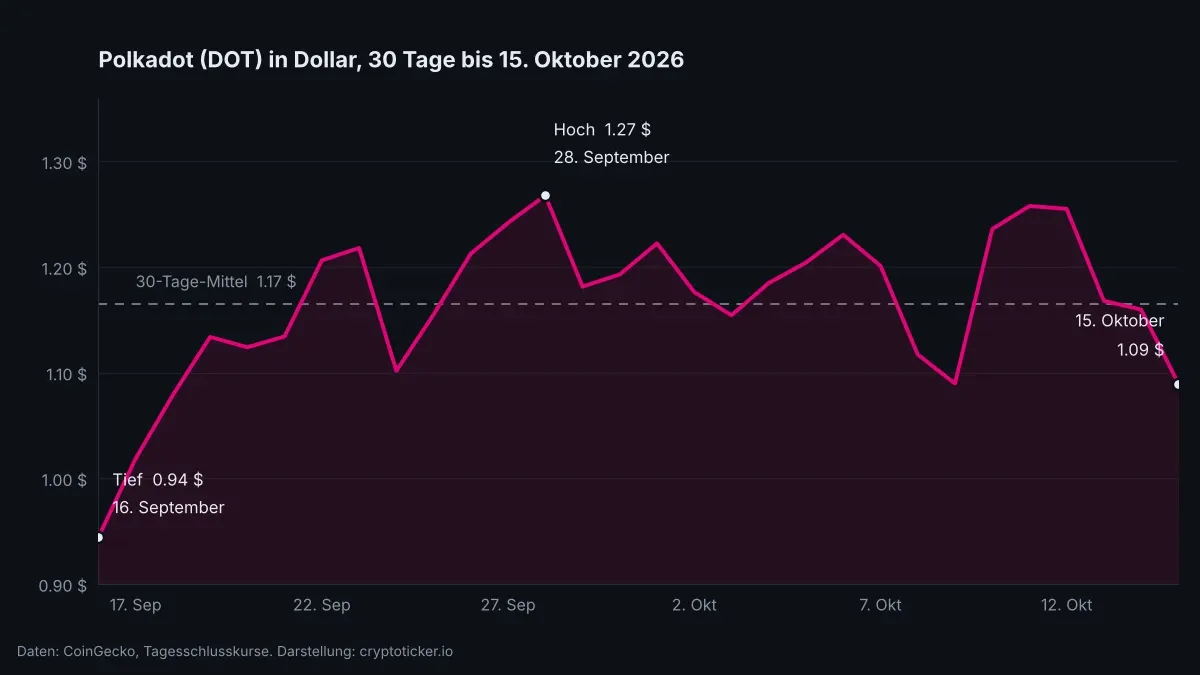
Polkadot price at $1.08: 14 percent below the September 28 high
DOT trades at $1.082 on Thursday afternoon, 3.4 percent below the previous day. The high of the day was $1.16, the low $1.05. The wider market gave up considerably less that day: Bitcoin lost 0.5 percent, Ethereum 1.6 percent. Polkadot is therefore falling about six times as hard as Bitcoin.
Over 30 days the picture is the one in the chart above. CoinGecko daily closes give a low of $0.9441 on September 16 and a high of $1.2677 on September 28. DOT has recovered 15.4 percent from the low and is 14.1 percent short of the high. The average of those 30 days is $1.1652, putting today's price 6.5 percent below it.
From the all-time high of $54.98, reached on November 4, 2021, the price is around 98 percent away. That number belongs in any honest assessment of DOT, even if it says little about today's question.
Authorized participants: when a spot ETF has to buy DOT at all
The mechanism takes three sentences. A spot ETF creates and destroys shares through so-called authorized participants, large traders who deliver or take in coins in exchange for shares. When demand for shares appears, those traders have to source DOT in the market, and that purchase hits the order book. When demand stays away, nothing happens at this point.
What counts is the ratio between the volume to be moved and daily turnover. At a 0.069 percent share of trading volume, any move by the fund disappears into the noise of an ordinary morning. Even if TDOT had to sell its entire assets on a single day, that would be 7.2 percent of one day's turnover, spread across several venues. The daily range between $1.05 and $1.16 is 10.5 percent today. The fund's move would therefore stay inside what the market produces on a normal day anyway.
For the price question that means anyone betting on ETF inflows as a driver for DOT is waiting for leverage that does not work at this order of magnitude. This week's price move comes from the wider market and the futures market, not from Nasdaq share certificates.
Since October 13: what has changed since referendum 1954
We last wrote about Polkadot on October 13, then on the vote 1954 and the mandate of the DOT DAO, which stood at 73 percent against. The price that day was $1.1679. DOT has lost 6.7 percent since. The $1.10 level, which held twice over the past fortnight, was breached intraday today for the first time since October 9.
The governance question of then and the fund question of today are connected more loosely than they appear. Both are attempts to pull money and attention towards Polkadot, once through the treasury, once through the American capital market. The fund figures deliver a sober verdict on the second: the Wall Street route has produced $3.33 million in seven months.
0.30 against 2.50 percent: European investors pay eight times the rate
Here is the part that counts in practice. The American fund cannot be bought in Germany. US ETFs may not be offered to retail investors in the EU because they lack the key information document in German required under the PRIIPs regulation. Your broker will not put TDOT in your portfolio, however cheap the product is.
The route open to you runs through an exchange-traded product of European construction. 21Shares offers the 21Shares Polkadot ETP for that purpose, listed on the SIX Swiss Exchange in dollars and on Börse Stuttgart in euros, with the ISIN CH0593331561. The ongoing charges of that product are 2.50 percent a year. The same fund house charges 0.30 percent in America and more than eight times the rate in Europe.
What that difference adds up to over time is quickly worked out. Invest 5,000 euros and you pay 125 euros in the first year with the European product, against 15 euros with the American one. Over five years and at an unchanged price it is around 595 euros against 75 euros. That fee keeps running whether the price rises, falls or stands still. For a wider view of the products tradable in Germany, see our overview on buying crypto ETFs and ETPs in Germany.
The alternative is a direct purchase on an authorised exchange. There you pay a trading fee and a spread on the way in and on the way out, and no ongoing product fee after that, but you carry responsibility for custody yourself. Which providers are authorised in Germany and what their trading costs is set out in the comparison of regulated crypto exchanges.

How to check the delivery claim on your certificate
The second difference between the portfolio route and a direct purchase is a tax one, and over a longer holding period it weighs more than the fee. On a direct purchase the holding period under Section 23 of the German Income Tax Act applies: hold a crypto asset for more than a year and the gain is untaxed. That rule continues unchanged. The federal cabinet did not pass the decision on abolishing the holding period expected for October 14, the draft is stuck in departmental consultation, and the December 31, 2026 cut-off date named in it would separate old holdings from new ones.
With an exchange-traded product the position cannot be answered across the board. We set that out in detail on October 10 on the crypto offering at ING: whether the one-year period applies to your certificate depends on whether it grants you a delivery claim on the real coin. Certificates without that claim are treated as a capital claim, and there the flat-rate withholding tax applies with no one-year period. Certificates with a delivery claim are classed by parts of the advisory profession like a direct investment. There is no supreme court ruling covering every product design, and no issuer decides this for your tax office.
Three steps lead to a sound answer. First, take the ISIN of your certificate and read in the key information document which product type is stated there. Second, request the final terms from the issuer and look in them for a provision on physical delivery. Third, have the result confirmed for your case by a tax adviser before you rely on the one-year period. Document the acquisition dates with a tool from our comparison of crypto tax software, because with a savings plan the period runs separately for every instalment.
Our assessment: the fee is certain, the tax effect is not
In the view of the editorial team, the product question at Polkadot currently matters more than the price question, and the answer is an uncomfortable one. What is evidenced: the European product costs 2.50 percent a year, the American one 0.30 percent, and both come from the same provider. Evidenced too: the one-year holding period applies on a direct purchase, while on a certificate it depends on a delivery claim that few investors have checked. Our conclusion: hold DOT for longer than two years and you pay a certain fee in a securities account for an uncertain tax effect. There is a serious argument against, and we do not play it down: lose your private key and you lose everything, and not everyone wants to carry that responsibility. For investors who prefer the securities account for exactly that reason, the surcharge is the price of custody they need not attend to. This assessment weighs up the situation and is not a recommendation to buy or sell.
Polkadot in a securities account: 2.50 percent a year against an open tax question
The first American spot fund on DOT manages $11.57 million after seven months and trades $111,586 in a day, which is 0.069 percent of the spot market. For the price that carries no weight. What counts for you is the layer beneath: which product you buy, and what it costs over the years.
- Project the product fee onto your intended holding period. At 2.50 percent a year that is around 595 euros on 5,000 euros over five years. Set that against the one-off trading fee of a direct purchase, which you can look up in the comparison of regulated crypto exchanges.
- Settle the delivery claim before you rely on the one-year period. The ISIN, the key information document and the final terms supply the answer, and a tax adviser confirms it. Which products are tradable in Germany at all is set out in the overview of crypto ETFs and ETPs.
- Document every acquisition date from today. Should the draft with its December 31, 2026 cut-off arrive, that date decides between old and new holdings. A tool from the comparison of crypto tax software keeps track of the periods for you.
(As of October 15, 2026. This article is not investment advice. Prices and fee structures change; check the terms with the provider before you buy.)
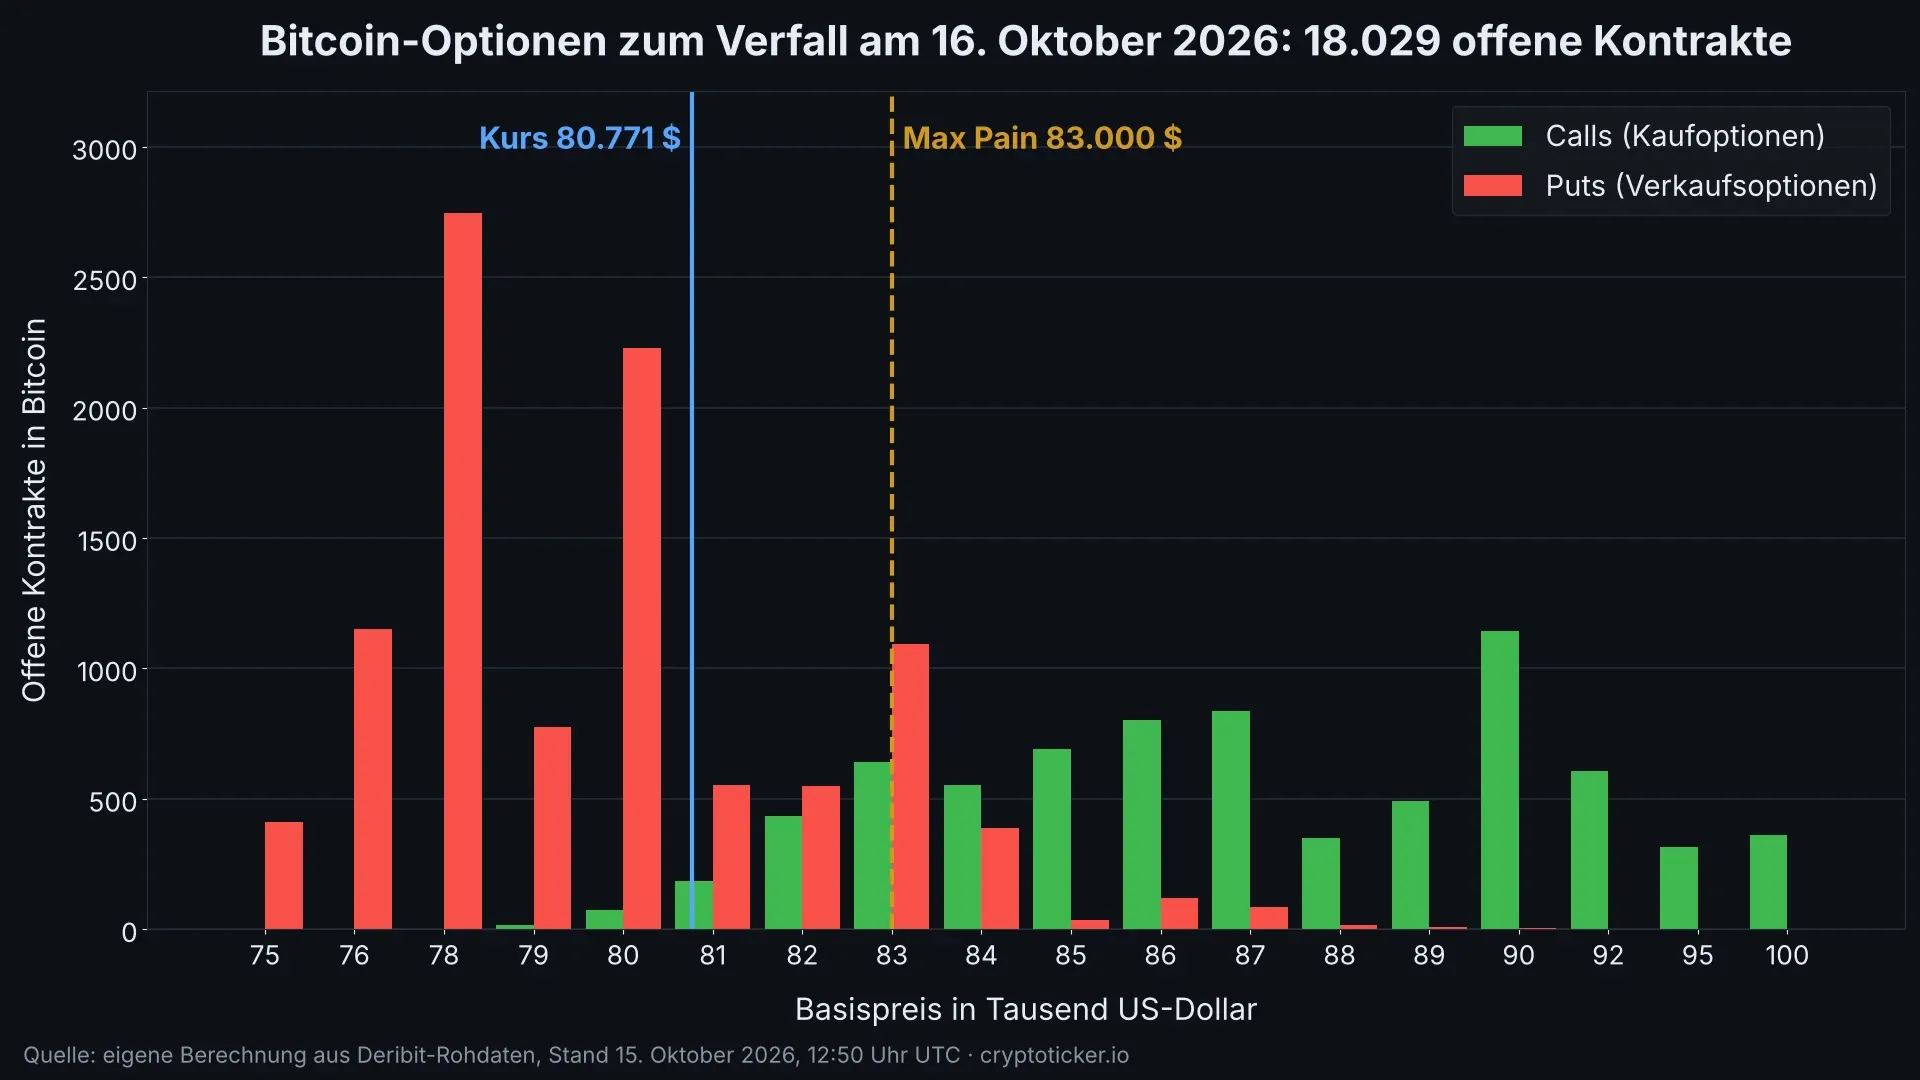
On Friday, October 16, 18,029 Bitcoin contracts expire on the options exchange Deribit. The calculated pain point of this expiry sits at $83,000, while the price on Thursday afternoon was $80,771. That leaves $2,229 between the market and the level at which options buyers collectively gain the least. Whether the gap closes on Friday is not for the expiry alone to decide, and the structure of the open contracts explains fairly precisely why.
Bitcoin traded at $80,771, or 72,029 euros, at around 2:50 pm German time on October 15, down 2.46 percent over 24 hours (source: CoinGecko). The high of the day was $83,005, the low $80,444. Over a week the loss stands at 2.12 percent, and the price is 35.9 percent below the record of $126,080 set on October 6, 2025.
Friday's Bitcoin options expiry: 18,029 contracts on Deribit
Deribit is the largest venue for Bitcoin options. An option is a right, not an obligation: the buyer of a call may buy Bitcoin at an agreed strike price, the buyer of a put may sell at that price. If the option runs out without the right being worth exercising, it expires worthless.
For Friday's expiry, our own reading of the Deribit raw data from October 15, 12:50 pm UTC, shows 18,029 open contracts. Of those, 10,410 are puts and 7,619 are calls. Measured against a price of roughly $80,800, that is a notional value of a good $1.45 billion. One Deribit contract covers one Bitcoin.
For a sense of scale: the monthly expiry on October 30 carries 148,348 contracts, more than eight times as many. Friday is one of the small weekly dates, not a quarterly event.
Max pain at $83,000: what the Bitcoin options figure measures
Max pain is the strike price at which the sum of all payouts to options buyers comes out smallest. The calculation is plain: for every conceivable closing price, the combined worth of all calls and all puts is added up, and the price with the smallest result is the point of maximum pain.
For October 16 our own calculation puts that point at $83,000. At $80,000 the options together would be worth around 8.2 million units, at $83,000 only 2.3 million, and at $86,000 again 7.2 million. The curve has a clear trough, and the trough lies above today's price.
What the figure is not: a price target. Max pain describes where the interests of the options writers lie, not a forecast. The notion that the market drifts towards maximum pain on expiry day is an observation with plenty of counter-examples, not a law. Read the number as a target and you have mistaken a statistic for an intention.
A Bitcoin put-call ratio of 1.37: hedging has the upper hand
Divide the open puts by the open calls and Friday comes out at a ratio of 1.37. For every three calls there are a good four puts. A reading above 1 means more capital is positioned for falling prices, or for protection, than for rising ones.
The comparison with the monthly expiry makes the difference visible. For October 30 the ratio is 0.52, with 97,612 calls against 50,736 puts. Positioning further out is therefore mostly bullish, while the near term looks defensive. Together the two describe a market that is hedging the next few days without writing off the month.
How a Bitcoin options expiry affects the price at all
The mechanism runs through the traders who sold the options. A writer carries the other side's risk and offsets it on the futures market by buying or selling Bitcoin. How much they have to move depends on how close the price is to the strikes at which they hold open contracts.
As the price approaches a strike with many open contracts, the hedge required changes quickly, and the trader has to adjust more often. In quiet phases that adjustment dampens the market, because it works against the move. It can also amplify, when the price cuts through a densely occupied level and many traders have to buy or sell in the same direction.
After the expiry that tie is cut. The bigger move therefore often comes not on expiry day itself but in the days that follow, once the hedge is no longer needed.
The Bitcoin put clusters at $78,000 and $80,000
The densest positions into Friday are the puts below the price. At $78,000 there are 2,746 contracts, at $80,000 2,142, at $76,000 1,150 and at $79,000 777. Those four strikes alone carry 6,815 contracts, or 38 percent of the entire expiry.
On the other side the calls sit far above: 1,144 contracts at $90,000, 835 at $87,000, 690 at $85,000 and 606 at $92,000. Those levels are 5 to 11 percent away from today's price and play practically no part in Friday.
The $80,000 level deserves particular attention because it counts twice: as the second-largest put cluster of the expiry, and as a level $771 below the current price. Should Bitcoin fall through it, those 2,142 contracts move into the money, and the writers on the other side have to widen their hedge.
The monthly Bitcoin expiry on October 30: 148,348 contracts
The month's real date falls on October 30, two days after the next US Federal Reserve rate decision on October 28. It carries 148,348 open contracts, by far the largest position of the coming weeks. The expiry on November 27 follows with 25,150 contracts.
For placing Friday in context, that means the small date clears out short-dated hedging while positioning for the end of the month is left untouched. The next larger turning point is more likely to come at the end of October than on Friday.
What has changed since Tuesday's inflation reading
In our article of October 14 on US inflation at 3.7 percent and the core rate above forecast, Bitcoin stood at $83,115 on the day. The price has since given up 2.8 percent and sits at $80,771. The $82,000 level discussed at the time broke during Wednesday and has not been recovered.
In between came a wave of liquidations on Thursday morning, in which market data show $489 million of leveraged positions closed within an hour; the details are in our report on the liquidation cascade. What is new since Tuesday is therefore less the direction than the nature of the move: the selling pressure now comes from the futures market rather than from the macro headline.
Sentiment has turned accordingly. The Fear and Greed Index from alternative.me stands at 53 points on October 15, which is neutral, after 62 points and greed the day before.
Our assessment: Friday's expiry will not carry the big move
In the view of the editorial team, Friday's expiry is too small to pull the price to $83,000 on its own. Three pieces of evidence support that. First, the volume of 18,029 contracts is only a good eighth of the monthly expiry on October 30. Second, the futures market is not stretched right now: the funding rate on the Deribit perpetual is 0.0041 percent per eight hours and 0.0046 percent at OKX, both close to zero and therefore without an imbalance on either side. Third, historical volatility at Deribit stands at 32.8, in the lower range of recent months.
The argument against: the put clusters at $78,000 and $80,000 sit tightly below the price. If the $80,000 level goes, the writers' hedging amplifies the move downwards instead of damping it. The expiry is then not a driver, but an amplifier. Our assessment weighs up the situation and is not a recommendation to buy or sell.

Leverage and liquidation on a Bitcoin expiry day
Open positions in the Deribit perpetual add up to $881.5 million. Perpetuals are futures contracts without an expiry date, tied to the spot price through a funding rate. When that rate sits near zero as it does today, the long and short sides pay each other almost nothing, and the market carries no pronounced imbalance.
For leveraged positions an expiry day is still the more uncomfortable part of the week, because swings around densely occupied levels increase. The liquidation price is the price at which the exchange force-closes a position because the posted collateral has run out. At five times leverage it sits around 20 percent from entry, at ten times around 10 percent, at twenty times still around 5 percent.
Applied to today's price, twenty times leverage means a liquidation price of roughly $76,700. That value sits between the two largest put clusters of the expiry. If you hold a leveraged position, set your own liquidation distance against the $80,000, $78,000 and $76,000 levels instead of thinking of it in percent. Which venues charge which fees and demand which collateral is set out in our comparison of the best perp DEXs.
Thursday morning's wave shows how fast that happens: $489 million in one hour is more than half of all open interest in the Deribit perpetual.
Holding period and exemption limit: December 31 is closing in
For investors in Germany, more hangs on the turn of the year than the price question. Under Section 23 of the German Income Tax Act, the gain on a Bitcoin sale is tax-free if more than a year lies between purchase and sale. Inside that window the gain is taxed at the personal income tax rate, though an exemption limit of 1,000 euros per calendar year applies to all private disposals taken together.
Exemption limit means a gain of 999 euros is taxed at nothing, while a gain of 1,001 euros is taxed in full. The difference from a tax-free allowance is expensive here, and it is regularly confused.
A planned extension of the holding period was recently on the political agenda without a decision being taken. The cabinet date passed without a result, so the December 31 cut-off stands unchanged. To offset this year's losses against gains, you need your transactions documented cleanly by the turn of the year; a tax tool with a portfolio tracker takes that work off your hands.
Buying route and custody under MiCA
Since the EU's MiCA regulation applied in full, providers of crypto services in the EU need authorisation and are supervised, in Germany by BaFin. For the buying route that means an authorised provider must hold client funds separately from its own assets and must evidence custody.
The choice between an exchange and self-custody is untouched by that. Leave Bitcoin sitting on an exchange and you hold a claim against that exchange, not Bitcoin on the blockchain. Move it to your own wallet and you carry responsibility for the key yourself. For amounts beyond what you intend to trade at short notice, self-custody is the safer route.
Bitcoin expiry on October 16: $2,229 short of max pain
With 18,029 contracts, Friday's expiry is a small date with a clear tilt to the downside. The deciding question is not the $83,000 calculation but whether the $80,000 level holds.
- Recalculate your liquidation distance. Put your own liquidation price next to the $80,000, $78,000 and $76,000 levels. If it falls between them, the leverage is too high for this expiry day. The terms offered by the venues are in the perp DEX comparison.
- Sort the holding periods in your portfolio. Every position that completes its year before December 31 can be sold tax-free afterwards. Which transaction was bought when is settled faster by a tax tool with a portfolio tracker than by a spreadsheet kept by hand.
- Check the buying route for authorisation. Before the next purchase it is worth looking at fees, withdrawal costs and the provider's MiCA authorisation; the exchange comparison provides the overview.
The next test comes on October 28 with the US Federal Reserve's rate decision, two days before the monthly expiry and its 148,348 contracts. Until then the $80,000 level remains the line on which October is decided.
(As of October 15, 2026. This article is not investment advice. Prices and fee structures change; check the terms with the provider before you buy.)
On Wednesday, 15 October 2026, forced closures on the crypto market wiped out roughly $489 million in leveraged positions within a single hour. That is more than half the sum that accumulated over the full 24 hours. Across the day, traders lost about $942.1 million according to figures from CoinGlass, and $863.3 million of that fell on long positions, that is, on bets that prices would rise.
For anyone trading with leverage, the decisive number is not the price loss. Bitcoin gave up just under three percent that day, Ethereum a good five. Holding without leverage, you see a red day in the portfolio. Being long with tenfold leverage at a five percent price loss means half the stake is gone, and at ten percent the position is closed before any recovery can catch up with it. That is exactly what happened on a mass scale in this one hour.
$942 million in 24 hours, more than half in 60 minutes
The numbers diverge depending on the time window and the provider, and they are not going to be smoothed over here. CoinGlass reports $489.4 million for the hour in question. The news service PANews names $476 million for a window as of 10:35, of which $457 million on long and $18.2 million on short positions. The range therefore lies between $476 million and $489 million, depending on where the hour begins. Both are robust on the point that matters: the lion's share of the day's losses fell into a very short window.
A liquidation is not a decision to sell but an enforcement measure by the exchange. Once the posted margin no longer covers the accumulated loss, the risk system closes the position automatically at the market price. The client is not asked, and gets no grace period. CoinCentral traces the course of the day with the values for the individual coins.
Leverage works in both directions, and that is what makes it dangerous in down phases: the larger it is, the smaller the price move that wipes out the stake. At fivefold leverage that threshold sits at a 20 percent price loss, at twentyfold at five, at fiftyfold at two. Fees and funding costs move the point forward further still.
Long positions carry 91.6 percent of the losses
Of the day's $942.1 million, $863.3 million fell on long positions. That is 91.6 percent. A distribution that lopsided says something about sentiment in the preceding days: the market was predominantly positioned for rising prices, and the other side was thinly occupied.
From that arises the mechanism that turns a pullback into a cascade. A forced closure is a sale into the market. That sale pushes the price down another notch. A notch lower sit the liquidation prices of the next positions, and those get closed too. In a market where almost everyone has bet in the same direction, one initial nudge is enough to set that sequence in motion. It explains why the losses clustered into a single hour instead of spreading evenly across the day.

Why Ether was hit harder than Bitcoin
According to the daily data, roughly $286 million in liquidations fell on Ethereum and roughly $197 million on Bitcoin. That is remarkable, because Bitcoin is considerably larger by market value. A market worth three times as much carried a third fewer forced closures that day.
Reports say that on Binance alone more than $106 million in Ether long positions were closed within about an hour. The explanation lies not in the price but in how the futures market was positioned: before the slump, markedly more accounts stood on the long side in Ether than in Bitcoin. That claim can be recalculated, and we did it.
Our analysis: 2.36 long accounts per short account in Ether
This analysis was compiled by cryptoticker.io itself on 15 October 2026. It is based on the public market data of the exchange OKX on its perpetual futures contracts on Bitcoin and Ether, queried across ten individual data points: account ratio, open contracts, funding rate, daily range and turnover, in each case for both coins.
The result: for every account betting on falling prices in Ether there are 2.36 accounts betting on rising ones. In Bitcoin the figure is 1.73. The long overhang in Ether is therefore a good third larger. In the hours before the slump the Ether ratio even stood at 2.65 to one, the highest reading in the series examined.
Add to that the open contracts. On the Ether contract, 622,656 ETH were open at the time of the query, equivalent to $1.47 billion. On the Bitcoin contract it was 30,777 BTC, or $2.49 billion. Over the past thirty days the dollar value of open Ether positions has fallen by just under two percent, that of Bitcoin risen by a good 16 percent. Against its respective monthly high, Ether sits just under 15 percent lower, Bitcoin only just under four percent.
Both funding rates were still positive at the time of the query, at 0.0051 percent for Bitcoin and 0.0036 percent for Ether per settlement period. A positive funding rate means the long side pays the short side. As long as that figure sits above zero, the overhang on the long side has not been worked off, not even after a cascade of this size.
What has changed since the deleveraging of 13 October
On 13 October 2026 we described in this space how the Ether futures market had shed 16 percent of its leverage within five days, at a price of $2,534 (Ethereum price $2,534, 16 percent less leverage in five days). Two days later the price stands at roughly $2,364, that is $170 lower. The $2,500 level, which held back then, has fallen.
The deleveraging, in other words, did not settle the matter. It brought the market into a new long-overhang position at a lower price, and that position was unwound for the second time this Wednesday. The difference from 13 October lies in the speed: back then the unwind spread across five days, this time more than half of it fell into one hour.
Liquidation price and margin: how a forced closure runs
The liquidation price is the price at which the posted margin is used up. Every exchange calculates it from position size, leverage, maintenance margin and fees, and displays it in the trading window before the position is opened. Trading without knowing that number is trading blind.
Two points are regularly overlooked here. First, many platforms work with a reference price drawn from several exchanges rather than their own last traded price. A brief spike on a single venue therefore does not necessarily trigger a closure, whereas a market-wide move very much does. Second, risk systems tier the maintenance margin by position size: a large position needs proportionally more margin than a small one, and its liquidation price therefore sits closer to the current price.
In practice that means the distance between the current price and the liquidation price is the only buffer there is. That distance can be widened in three ways, and all three cost something. Adding margin ties up additional capital. Partly closing the position shrinks the possible gain. Lowering the leverage means putting up more equity for the same position size. What does not exist is a way to widen the buffer for free.

The daily ranges and what they offer as levels
According to our query at OKX, Bitcoin moved between $80,168 and $83,910 that day and was last quoted at $80,913.70. Ether ran between $2,315.26 and $2,520 and stood at $2,363.78. Those daily lows are the levels that matter now for leveraged positions, because below them there are no fresh reference points from current trading.
The distance is narrow in both cases. Bitcoin sits less than one percent above its daily low, Ether around two percent. A position with twentyfold leverage opened this morning is therefore already close, on the arithmetic, to its closure threshold. Waiting in that situation for a quick counter-move relies on the cascade being complete. The positive funding rates argue against it.
Leveraged trading in Europe: what is permitted and what is not
Retail clients in the European Union can trade crypto contracts for difference only with leverage of at most 2:1. That cap has applied since the product intervention measures of the European securities authority and was adopted for Germany by BaFin. Negative balance protection applies for retail clients: the loss cannot exceed the stake.
The leverage of ten, twenty or fifty that produced this day's liquidations comes predominantly from platforms outside that framework. Trading there means giving up two things: the leverage cap and the protection against a loss beyond the stake. On top of that, no deposit guarantee exists for crypto assets in any case, neither here nor there. An orderly overview of providers with clear leverage limits and local settlement is given in our crypto broker comparison; for trading perpetual futures contracts on decentralised venues, the differences in funding costs and risk systems are set out in our perp DEX overview.
Spot instead of leverage: holding period and custody
For investors watching this day from the outside, the real point lies elsewhere. A cascade of this kind hits leveraged positions exclusively. Holding coins directly and keeping them in self-custody means having no risk system above you that sells in a price slide. A red day stays a red day.
Added to that is the tax difference, and in Germany it is considerable. Gains from selling directly held crypto assets are tax-free after one year of holding, provided the coins were not used for staking or lending in that time. Gains from contracts for difference and other derivatives, by contrast, fall under capital gains tax, and losses from futures transactions are restricted in how they can be offset. One year of holding is therefore no side issue but the most tax-efficient route German law provides for crypto assets. If you prefer the spot purchase to leverage, the best way to compare venues and fees is our crypto exchange overview.
Our assessment: the deleveraging is not complete
In this newsroom's view the data argues that this Wednesday was not a clean-out but a stage. Three pieces of evidence carry that assessment. The account ratio in Ether, at 2.36 to one after the cascade, still sits above the Bitcoin figure, and Bitcoin came through the cascade better. The funding rates are positive for both coins, so the long side keeps paying for its positions. And the dollar value of open Ether contracts sits only just under 15 percent below the monthly high, after a day in which roughly $286 million in forced closures fell on this coin alone.
Against that stands the speed of the sequence. A cascade that works through more than half its volume in one hour clears out the most thinly margined positions thoroughly. The accounts still long now are on average better cushioned than those closed at ten o'clock. That makes a second wave of the same size less likely, but does not rule it out. This assessment evaluates the market situation and is not a recommendation to buy or sell; with crypto assets a total loss is possible.
Liquidation cascade: below $80,168 it gets tighter for longs
Bitcoin's daily low at $80,168 and Ether's at $2,315.26 are the two levels from which the coming trading days will show whether the market has digested the cascade. If the distance above them holds, this Wednesday was a clean-out. If the levels fall, the next nudge meets a futures market that by our measurement still stands predominantly long.
- Look up the distance to the liquidation price. Every open leveraged position shows that price in the trading window. If it sits closer than today's daily range of three to four percent, a day like this one is enough for the forced closure. How platforms differ on leverage limits, maintenance margin and funding costs is set out in the broker comparison.
- Check the funding rate before the next position. It is quoted on every perpetual contract and says which side pays. Positive values mean running costs for long positions, which add up over a longer holding period. The differences between the decentralised venues are broken down in the perp DEX overview.
- Set the spot share against the leveraged share. Directly held coins are tax-free after one year and are sold by no risk system. Which venues charge what on a plain purchase is shown by the exchange overview.
(As of October 15, 2026. This article is not investment advice. Prices and fee structures change; check the terms with the provider before you buy.)
Dogecoin trades at $0.0801 on Thursday midday, down 8.6 percent over seven days. Bitcoin gave up 2.0 percent in the same period. That distance is the real finding of the day: Dogecoin is falling more than four times as hard as the market's largest asset, and it is doing so at a point the price already visited four weeks ago.
Dogecoin at $0.0801: the numbers at Thursday midday
As of 15 October the price stands at $0.080056. Over 24 hours that is 5.0 percent lower, over seven days 8.6 percent, over 30 days 3.0 percent. On a one-year view there is a loss of 61.1 percent. Spot turnover over the past 24 hours is $1.07 billion and market capitalisation $12.52 billion. That is rank twelve in the overall market. All figures come from CoinGecko and were read off at Thursday midday.
CoinGecko reports the day's low from tick data at $0.078426. On hourly values, which allow lows to be compared cleanly across weeks, the lowest hourly print of the day is $0.078951, reached in the early morning. The two numbers do not contradict each other; they measure at different resolutions. For the comparison with September, the second one counts.
Seven days down 8.6 percent, Bitcoin down 2 percent
The weekly comparison places the move. Over seven days Ethereum loses 7.3 percent, XRP 6.6 percent, Shiba Inu 7.8 percent, Litecoin 9.3 percent, Solana 10.2 percent and Cardano 11.5 percent. At 8.6 percent, Dogecoin sits in the middle of that group. The only striking figure is the distance to Bitcoin, which at 2.0 percent is almost unmoved and over 30 days is even 5.5 percent up.
That yields a plain reading which needs no speculation. What is under way bears the marks of a rotation out of the smaller assets into the largest. Managing a portfolio by weights shows it in Dogecoin's share of the overall market, which has fallen this week, while Bitcoin's share has risen.
What the term rotation means here
Rotation describes capital shifting between segments of the same market without money leaving that market. It is recognisable when one segment falls while another holds or rises, with turnover overall normal. That is precisely the picture this week's numbers show.
Since yesterday: $0.0845 has become $0.0801
On 14 October the price stood at $0.0845 in our look at the large-address share, as set out in Wednesday's edition on the Dogecoin price and the share held by large addresses. Since then 5.2 percent has been given up. The level named there as the next test has now been reached and was briefly breached during the day.
What matters here is keeping the time frames apart. This year's February low was $0.0887, measured on 6 February. That line has been history since June, a month that brought hourly prints down to $0.0731. The line where something is being decided today is younger and sits lower.
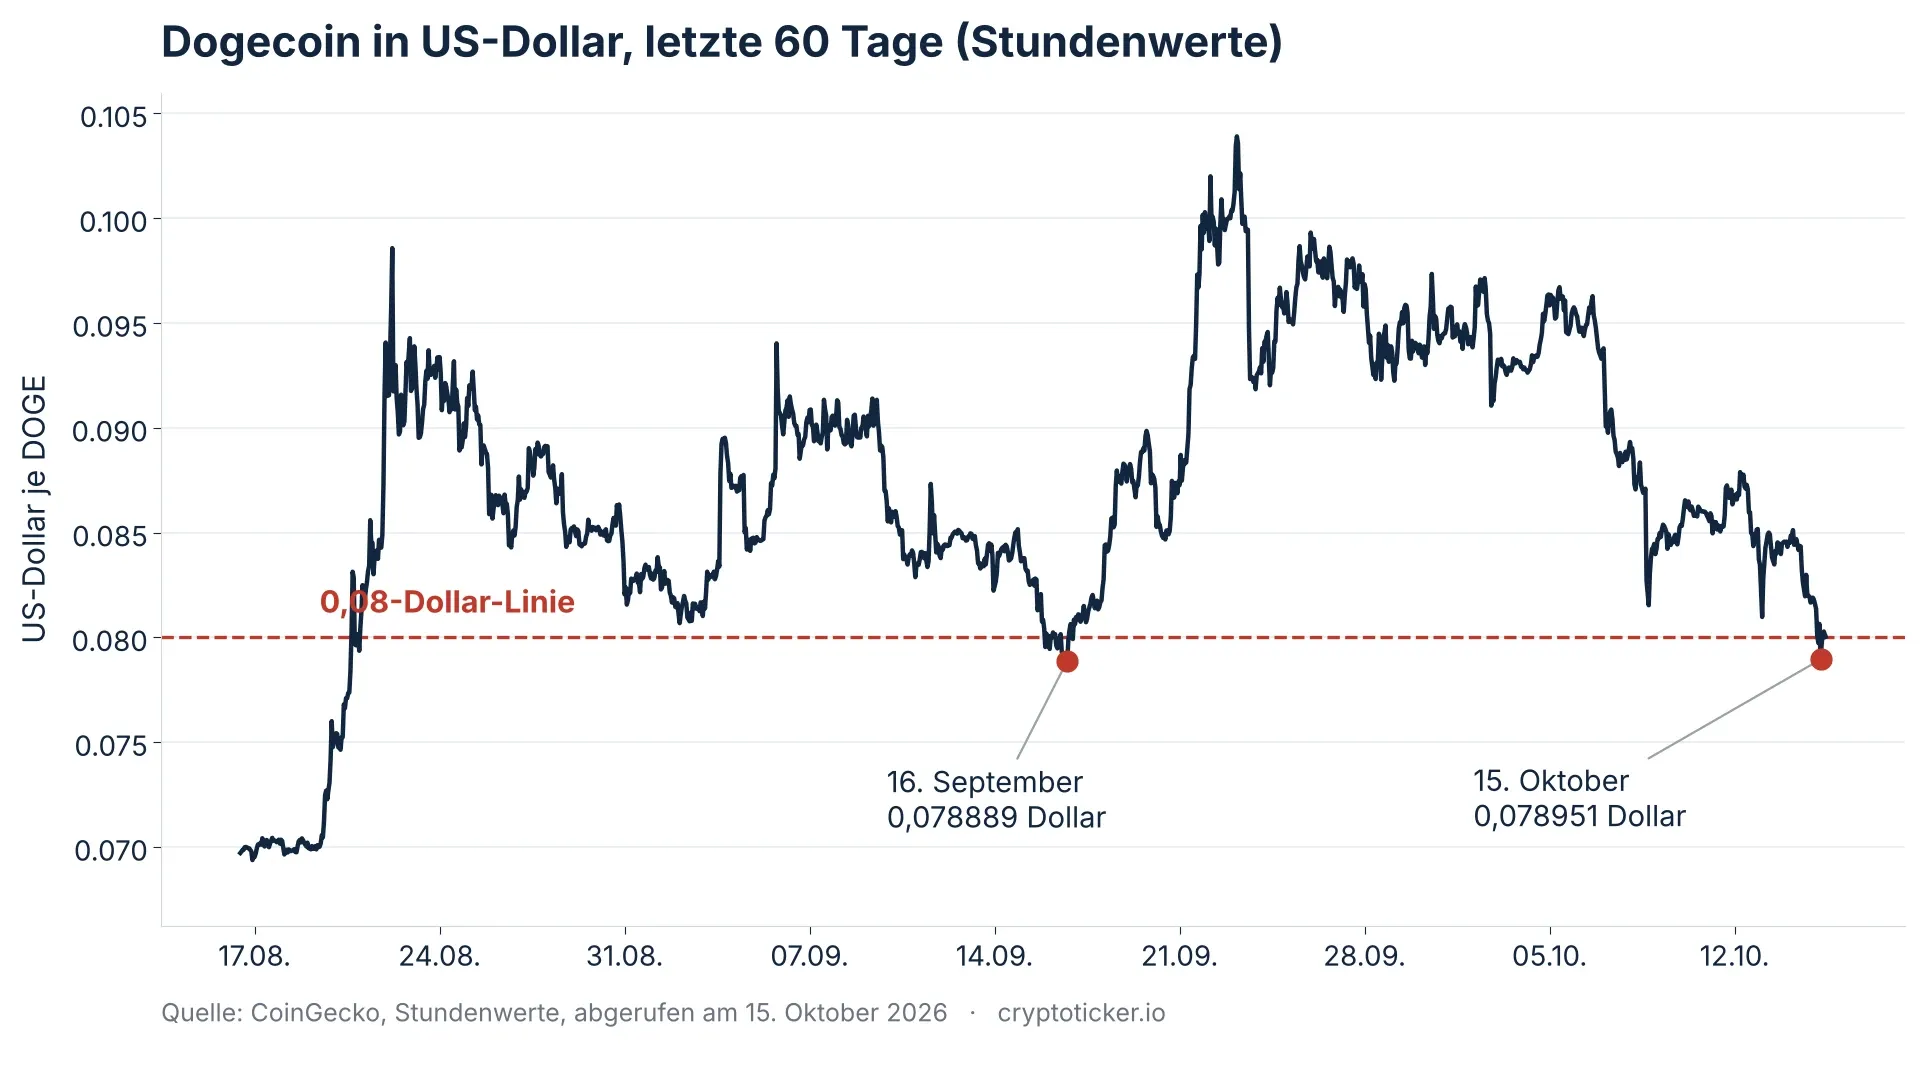
The $0.08 line and the September low at $0.078889
On 16 September the lowest hourly print fell to $0.078889. On 15 October it was $0.078951. Between the two values lie $0.000062, less than a tenth of a percent. Two attempts 28 days apart therefore ended at practically the same point.
Alongside that stands September as a month with a lowest daily value of $0.080051 and October with $0.080024. On a daily basis the round $0.08 line has held twice; on an hourly basis it was briefly breached both times. In practice a level is rarely an exact line. Usually it is a zone a few tenths of a percent wide.
To the upside the next well-founded level is the October high of $0.097149 from 2 October. To the downside the year's low sits at $0.06902, reached on 7 August. The current price is 89.1 percent away from the all-time high of $0.7316.
The last test on 16 September and the recovery to $0.1039
The comparable case is four weeks back and can be recalculated to the hour. After the low of 16 September the price turned up and reached $0.103908 on 23 September. That is 31.7 percent above the low, achieved in seven days. After that it went down again in stages: $0.097149 on 2 October, $0.088349 on 8 October, $0.0801 today.
For investors that means two things. The line held at the last test, and it brought no trend reversal. The recovery ended 32 percent higher and then retraced in full. Taking September as a template means taking both halves of the template.
Where Dogecoin is traded and at what cost differs markedly from venue to venue. A look at the crypto exchange comparison shows the ranges on trading fee, spread and withdrawal, which weigh more heavily on a price with four decimal places than they do on Bitcoin.
Mining supply: 13.64 million new DOGE a day
A second way into the subject lies not in the chart but in the blockchain itself. Dogecoin has no cap on total supply. Each block creates 10,000 new DOGE, as the project site at dogecoin.com describes it. Over the past 24 hours, 1,364 blocks were found according to Blockchair.
That works out to 13.64 million new DOGE in a day and around 4.98 billion a year. At the current price the daily amount corresponds to a value of roughly $1.09 million. Circulating supply lies between 156.3 billion units at CoinGecko and 172.0 billion at Blockchair, depending on the count. Annual expansion thus comes to just under three percent.
Why that number does not explain today
$1.09 million in new supply faces $1.07 billion in spot turnover. New supply therefore accounts for roughly one part in a thousand of daily turnover. As an explanation for a weekly loss of 8.6 percent it does not serve. It works as a permanent drag over years, not as the trigger of a single trading day. Anyone seeking to understand the annual balance of minus 61.1 percent finds one building block here. For today it contributes nothing.
The blockchain, incidentally, shows no congestion. 23,015 transactions in 24 hours, 17 items in the mempool, an average fee of $0.028. Panic-driven movement on the blockchain looks different.

Holding period and the exemption limit: 31 December under section 23 of the German Income Tax Act
Here lies the concrete check an investor in Germany can carry out today, and it has little to do with the chart. Crypto falls under private disposal transactions. The governing rule is section 23 of the German Income Tax Act. It sets the period between acquisition and disposal at "not more than one year", and it sets the exemption limit: gains stay tax-free if the total gain from private disposal transactions in the calendar year comes to less than 1,000 euros.
What the annual balance of minus 61.1 percent has to do with it
Anyone who bought Dogecoin within the past twelve months is, at today's price, sitting on a loss on paper. Losses from private disposal transactions realised within the one-year period can be offset against gains in the same category in the same year, for instance gains from other coins or from gold. The calendar year ends on 31 December, and a disposal takes effect only in the year in which it occurs.
Two points belong with that. First, with every month a part of the holding runs out of the one-year period, and what lies outside the period has no tax effect, in gain or in loss. Second, the order of acquisitions is decisive, which is why a clean record per purchase matters more than any view on the price. Which tools keep that record and track the deadlines per lot is shown in the overview of tax software and portfolio trackers.
This account is no substitute for tax advice. What is named here is the deadline, the section and the exemption limit, so that the question to check is on the table before the turn of the year.
Buying route and custody: fees, spread and your own keys
At a price of $0.08 the buying route decides a noticeable part of the outcome. On the cost side at entry we have already broken down the ranges between instant buy and order book, as set out in our look at the buying route for Dogecoin. The finding there still holds: the convenient route costs the larger mark-up.
For custody the usual trade-off applies. On the exchange the holding stays quickly tradable and sits with a third party. On your own hardware it sits with you, with full responsibility for securing the recovery words. Which devices support Dogecoin and what they cost is set out in the hardware wallet comparison. For amounts earmarked for a sale within the one-year period anyway, moving to your own hardware is rarely the first job.
Our assessment: the line is holding so far, the annual balance is not
In this newsroom's view the situation is less dramatic than the daily loss of 5.0 percent suggests, and at the same time less reassuring than the line holding makes it look. Three documented points support that. First, the zone around $0.0789 has stopped the price twice within 28 days, at $0.078889 on 16 September and at $0.078951 on 15 October. Second, the blockchain is unremarkable: 17 items in the mempool and an average fee of $0.028 show no selling pressure backing up in the network. Third, the weekly loss sits in the middle of the larger altcoins, not at the bottom of them.
Against that stands the longer view. On a one-year basis there is a 61.1 percent loss, over 30 days 3.0 percent, while Bitcoin gained 5.5 percent in the same month. The recovery after the September low ended at $0.103908 and retraced in full. A line that holds twice is a floor and not yet a turn. A turn can only be proven once an attempt ends above the October high of $0.097149. This assessment evaluates the situation and is not a buy or sell recommendation.
Dogecoin: below $0.078889 the path to the August low opens
Three steps order the coming weeks, each of them checkable.
- Watch the zone around $0.0789. If it holds a third time, the picture of the past four weeks stays intact. If a daily close lands clearly below it, the year's low of $0.06902 from 7 August is the next figure the market can refer to. To be ready to trade on that, know the costs of your venue and check them against the exchange comparison.
- Write down the one-year deadline for each purchase lot. Purchase date, quantity, price, and from that the date on which the one-year period under section 23 of the German Income Tax Act ends. Until 31 December this list decides which losses can still be offset. The tools for it are in the overview of tax software.
- Match the place of custody to the investment horizon. Holdings that will sit longer than the one-year period belong on your own hardware rather than at a trading venue. The devices and their costs are in the hardware wallet comparison.
(As of October 15, 2026. This article is not investment advice. Prices and fee structures change; check the terms with the provider before you buy. Crypto investments can lead to a total loss.)
Decrypt
Speaking after BlackRock’s Q3 earnings, Fink said AI infrastructure spending has become so central to growth that a construction halt would be dangerous—calling the backlash “misinformation” as data centers become a midterm flashpoint.
Google DeepMind's first internal audit of AI-driven research finds no measurable speedup in AI progress.
The first major integration since Mastercard’s $1.8 billion BVNK acquisition lets banks, fintechs and enterprises hold, convert, and spend fiat and stablecoins through a single API, with agentic commerce support planned.
Hot inflation data revived Fed rate-hike bets, and leveraged bulls paid the bill as nearly $1 billion in crypto positions were liquidated.
Market analysts say that macro factors are pushing altcoin prices down, after ETH, XRP, and SOL all dropped on the day.
U.Today - IT, AI and Fintech Daily News for You Today
Overnight liquidations hit $932 million as XRP, DOGE, and NEAR face deep corrections before a sudden market reversal.
Dogecoin whale activity may be rising as the ongoing market volatility pushes traders to dump their crypto holdings to hedge against further losses.
Bitcoin is missing from Google trends as global search interest collapses to multi-year lows.
Cardano’s 5,747% liquidation Imbalance raises fresh questions for ADA bulls.
Ripple is expanding its Wall Street ambitions by giving institutional investors access to perpetual futures tied to more than 100 traditional asset markets, tapping into a rapidly growing $9 billion trading sector.
Blockonomi
TLDR
- CleanSpark’s September Bitcoin production fell nearly 11% to 529 BTC from 593 BTC in August.
- CleanSpark sold 702 BTC and closed September with Bitcoin holdings of 13,530 BTC.
- CleanSpark discontinued monthly mining reports while advancing its $2.276 billion data center financing.
- BitFuFu’s cloud mining output fell to 69 BTC as an electricity dispute threatened its Ethiopia acquisition.
- Canaan mined 44 BTC, while its Nordic heating project supplied recovered heat to approximately 2,800 homes.
CleanSpark mined 529 Bitcoin in September, down from 593 in August, while rival BitFuFu also recorded lower production. Canaan held steady at 44 BTC. The three publicly traded miners reported different changes to their operations.
CleanSpark reduces production and ends monthly updates
CleanSpark finished September with 13,530 BTC, compared with 13,703 at August’s end. It sold two BTC on spot markets and another 700 through exercised call options. The company reported an average sale price of $72,928, including option premiums.
Its average daily production reached 17.64 BTC. CleanSpark reported 50 exahashes per second in operational computing power and nearly 200,000 deployed mining machines. The company will now report quarterly rather than release monthly mining updates.
Data center investment remains a priority
CleanSpark closed a $2.276 billion secured bond offering to fund construction at Sandersville, Georgia. It expects a data center lease there to generate approximately $6.6 billion during its initial term. A separate report on AI chip supplies examined potential problems for miners.
On October 13, Bitcoin Magazine shared an X discussion about Bitcoin mining and artificial intelligence computing. CleanSpark said the bond financing covers Sandersville through completion, while its mining business continues operating.
BitFuFu faces an Ethiopian power dispute
BitFuFu produced 167 BTC in September, versus 174 in August. Its own mining increased from 88 to 98 BTC, but customer cloud mining fell from 86 to 69 BTC. Total managed computing power dropped to 19.4 exahashes per second.
Its proposed Ethiopian mining acquisition remains unfinished because of a dispute involving the site’s electricity supplier. BitFuFu paid $4.1 million and deployed around 13,700 machines there. Separately, Binance announced plans to close its cloud mining service in November.
Canaan maintains output and expands heat recovery
Canaan ended September holding 1,875 BTC, up from 1,868 at August’s close. Its non-joint-venture computing capacity remained at 10 exahashes per second, while joint ventures operated at 4.18. September mining production matched the previous month.
Thursday’s trading also followed a wider fall in Bitcoin mining shares. CleanSpark traded at $8.76, BitFuFu at $1.27 and Canaan at $0.25. Several rival miners had fallen more than 12% during Wednesday’s stock market selloff.
Canaan said its eight-megawatt Nordic heating facility now supplies recovered mining heat to about 2,800 homes. The company is also preparing a similar heat-recovery project for Canadian greenhouses, pending final site inspections.
The post CleanSpark Mines 529 BTC, but Reporting Takes a Turn appeared first on Blockonomi.
TLDR
- Ledger introduces tighter sales controls following the discovery of modified hardware wallets sold through resellers.
- Criminals installed hidden components that captured customers’ 24-word recovery phrases and transmitted them through mobile networks.
- Bitquery estimates $102 million was stolen from 324 wallets, exceeding Specter’s earlier $86 million estimate.
- Ledger says inspections found no tampering in the retail and warehouse samples its teams examined.
- Authorized dealers must keep devices off display shelves, while returned wallets remain barred from resale.
Ledger has introduced tougher rules for hardware wallet sellers after criminals altered genuine devices and stole cryptocurrency. In its October 15 statement, the company reaffirmed its ban on reselling returned wallets and ordered retailers to keep new devices away from display shelves.
Criminals altered devices before resale
Ledger said attackers purchased legitimate wallets, fitted hidden components, and returned them to reseller channels in Southeast Asia. The company said the group spent months preparing the operation and built systems to collect recovery phrases and move stolen funds.
The investigation began on October 9 after customers reported missing assets from devices sold by Malaysia-based CryptoBilis. An earlier Ledger wallet theft investigation connected the complaints to the reseller, which subsequently halted sales.
How the hidden implants worked
Ledger’s security team found an implant that copied the 24-word recovery phrase displayed during wallet setup. The component then sent those words through a mobile data connection using a built-in electronic SIM card.
The company said the device’s security chip and operating system remained intact. Binance founder Changpeng Zhao warned on X on October 9 that the evidence pointed to an attack through one seller, rather than a problem across all Ledger wallets.
Loss estimates rise as investigators trace funds
Blockchain researcher Specter initially estimated losses above $86 million. However, Bitquery’s October 15 update traced $102 million from 324 wallets across six networks. Earlier confirmation of device tampering established that investigators found an unauthorized component. Ledger has not confirmed total losses or the number of affected customers.
Bitquery said Tether froze $10 million in USDT linked to the theft. Its investigation also tracked stolen funds through swaps and privacy services. The researchers counted wallets, not individual customers, and noted that one owner could control several affected addresses.
Ledger changes distribution and customer guidance
Ledger said its teams examined devices from stores in Germany and stock held in warehouses. Those samples showed no tampering. In an October 14 X update, the company called for a pause in sales across seven markets, including Hong Kong. Resellers in Asia suspended wallet sales as the investigation continued.
Authorized dealers must now store wallets away from public shelves and hand them to buyers at purchase. Ledger advises CryptoBilis customers against setting up unused devices. Those who already used one should move assets to a new wallet with a fresh recovery phrase.
The post Ledger Reveals How Hidden Chips Exposed Crypto Wallets appeared first on Blockonomi.
TLDR
- Trump Media stock recovered intraday Thursday after six consecutive losing sessions.
- Similarweb estimated Truth Social’s September audience at 260,000 daily users, below its June 2025 peak of 420,000.
- Trump Media reported an 89% quarterly revenue increase despite weaker Truth Social advertising sales.
- DJTB tokenized shares fell approximately 8% over 24 hours in the cited Thursday morning quote.
- Binance’s DJTB token offers economic exposure to Trump Media without direct share ownership or voting rights.
Trump Media stock recovered from an early Thursday decline while new estimates showed shrinking traffic on Truth Social. Shares traded at $7.34 around 12:40 p.m. Eastern, after an earlier quote near $7.10.
The rebound followed six consecutive losing sessions for Trump Media & Technology Group (NASDAQ: DJT). The Washington Post published the audience findings after Wednesday’s market close. Thursday’s session had not ended.
Trump Media & Technology Group Corp., DJT
Trump Media Stock Rebounds After Six Losses
Trump Media stock closed Wednesday at $7.22, down 6.84% for the session. The stock had fallen from $8.65 on October 6, a drop of 16.5% across six sessions.
Wednesday’s losses came during a broader selloff after annual U.S. inflation reached 3.7% in September. The Nasdaq fell 1.88%, amid declines across several technology and financial stocks.
Truth Social Audience Estimates Fall
Similarweb estimated roughly 260,000 daily Truth Social users in September 2026, compared with about 420,000 at its June 2025 peak. That peak comparison spans approximately fifteen months.
The research firm also estimated a traffic decline exceeding 30% over the latest year. These are third-party estimates rather than daily user totals released by Trump Media. The figures measure users, not advertising sales or subscription income. The company has not yet reported its September advertising results.
Trump Media operates Truth Social, its Truth+ streaming platform, and financial products under Truth.Fi. Separately, Binance’s expansion into U.S. shares includes blockchain-based stock products linked to public companies.
Advertising Revenue and Tokenized Shares
Trump Media’s June-quarter filing recorded lower Truth Social advertising revenue from a year earlier. Total quarterly revenue nevertheless rose 89% to $1.67 million, helped by barter advertising, streaming subscriptions and fund management fees. Its second-quarter net loss reached $238.1 million, company filings show.
A Thursday morning quote placed DJTB, the token linked to DJT, near $7.17, down about 8% over 24 hours. Separately, Kraken recently detailed plans to offer tokenized shares in the UAE.
Binance listed DJTB on August 26. Its issuer, BTech Holdings Limited, holds underlying securities, but token buyers do not directly own DJT shares or gain voting rights. DJTB’s round-the-clock trading means its daily price change cannot be directly compared with Nasdaq’s regular session.
The post Trump Media Stock Rebounds, but Truth Social Faces a Test appeared first on Blockonomi.
TLDR
- Binance bStocks surpassed $1 billion in managed assets four months after launching in June 2026.
- The tokenized stock platform recorded over $40 billion in trading volume and nearly 100 listed securities.
- Binance users converted $6 billion between tokenized shares and direct stock positions at 1:1 parity.
- Around 62% of bStocks trading in July occurred outside regular U.S. market hours.
- Borrowing against deposited bStocks collateral reached 46.2%, while decentralized finance deployment rose to 11.2%.
Binance tokenized stocks surpassed $1 billion in assets under management four months after launch. Binance announced the October 15 milestone, citing Dune data and claiming the fastest rise to that level.
Binance tokenized stocks expand beyond launch
Binance launched bStocks on June 11 with five tokenized U.S. stocks and exchange-traded funds. Its list now covers nearly 100 securities. The exchange reported over $40 billion in trading, averaging more than $300 million daily.
Users converted $6 billion between bStocks and direct stock holdings, according to Binance. Each token has one-to-one backing through securities held in custody. The conversion figure measures cumulative activity, not assets held today.
In an October 5 X post, Binance told eligible users they could switch between stocks and tokens. Separately, the exchange plans to close its mining pool in November as it expands access to American securities overseas.
Most trading happens outside Wall Street hours
In July, only 38% of bStocks trades occurred during regular U.S. market hours. Binance compared that with 89.2% for conventional equities. Eligible customers can trade tokens on weekends and transfer them into compatible personal wallets.
Shunyet Jan, Binance’s head of exchange and trading, said continued market activity matters beyond launch. He said customers trade bStocks, pledge them as collateral, and convert them into direct stock positions.
Other companies are also developing tools for tokenized securities. Chainlink recently expanded tools that connect financial networks. Binance reported that 11.2% of bStocks value was deployed in decentralized finance by early October 2026, exceeding comparable products by 3.8 percentage points.
Collateral borrowing rises with tokenization
Borrowing against Binance tokenized stocks reached 46.2% of deposited collateral by September 10, up from 5.5% at June’s end. The exchange extended collateral access to eligible retail customers in September, with account checks and risk controls.
Traders can pledge supported bStocks for margin and futures positions, with borrowing up to five times their collateral. Binance said 58.5% of early users also traded perpetual futures or direct shares by late July.
The trend comes as banks expand tokenized deposits, including Wells Fargo. Binance also estimated tokenized stock transfers exceeded $100 billion during the third quarter, compared with $6 billion during the first. Binance says bStocks are backed by underlying securities, but holders do not receive direct shareholder rights.
The post Binance Tokenized Stocks Hit $1B. What Fueled Growth? appeared first on Blockonomi.
TLDR
- Amazon (AMZN) shares slip 0.27% to $253.40 following new Bee device launch
- Bee Frontier costs $74.99, while the Eclipse phone accessory sells for $99.99
- Amazon introduces Bee Pro at $11.99 monthly with extended AI service features
- Bee devices turn daily conversations into reminders, summaries, and task lists
- Amazon links Bee with Alexa+ and says raw audio is deleted after processing
Amazon expanded its personal technology lineup on Thursday as its shares declined during the session. Amazon (AMZN) stock fell 0.27% to $253.40, a decline of $0.68. The company introduced two Bee devices and a monthly service for organizing information from everyday conversations.
Amazon.com, Inc., AMZN
Amazon Introduces Two Bee AI Devices
Amazon unveiled Bee Frontier, a wearable device priced at $74.99, for its hardware lineup. The company also introduced Bee Eclipse, a magnetic phone attachment with a listed price of $99.99. Amazon plans to release both products in the coming weeks through its newly expanded Bee product lineup.
The devices capture spoken conversations and convert the information into reminders, summaries, and organized tasks. Users can review the resulting information through dedicated mobile and desktop applications after the devices process conversations. The products target routine activities, including appointments, discussions, and personal task management during ordinary daily work and activities.
The launch extends Amazon’s work on voice-based digital services beyond Echo. The company also connects voice features with portable devices. Bee adds a wearable format and a phone accessory to Amazon’s range of tools.
Amazon Bee Pro Adds Monthly Subscription Features
Amazon introduced Bee Pro alongside the hardware, at $11.99 monthly. The paid tier provides advanced integrations, third-party application connections, and unlimited processing of past conversations. The service combines hardware purchases with software functions.
The company also linked its Bee ecosystem with Alexa+ and its online retail platform. Through that connection, subscribers can request conversation summaries using compatible Echo devices. They can also receive product recommendations based on information captured during earlier interactions.
Amazon already operates consumer services spanning shopping, voice assistance, and connected devices. The Bee integration brings those services together around information collected through daily conversations. However, the new offering creates another paid service within Amazon’s consumer business.
Amazon Details Audio Handling and Market Context
Amazon said its Bee devices delete raw audio immediately after processing spoken input. It called this a zero-storage system. Consequently, the devices retain processed information rather than the raw audio used to create it.
The announcement enters a consumer technology market where major companies continue developing voice-enabled personal features. Apple and Meta have also introduced products and services that support hands-free digital interactions. Both companies support personal assistance through devices and applications.
Amazon’s announcement covered the two devices, the Bee Pro subscription, and connections with existing services. The company outlined pricing and planned availability, but did not disclose initial subscription figures. Thursday’s share movement accompanied the product news, as Amazon expanded its devices.
The post Amazon (AMZN) Stock: Falls as Company Launches New Bee AI Wearables appeared first on Blockonomi.
CryptoPotato
The primary cryptocurrency posted substantial gains in September, fueling expectations that the uptrend would continue this month. In fact, BTC started October on the right foot and briefly surged to nearly $87,000 at one point.
However, the bulls couldn’t maintain momentum, and the asset headed south. The past 24 hours brought more pain for investors as Bitcoin dipped below $80,000 after US inflation came in hotter than expected, while South Korea’s KOSPI index crashed over 7% on the day. The latest red wave, though, might be just a temporary correction before a renewed rally, and here’s why.
The Bullish Signals
Let’s start with the fact that October has historically been one of the best months for BTC, earning it the nickname “Uptober.” The asset has finished the period in the red on only 3 of 13 occasions. We still have more than two weeks left to see whether bulls can regain control and secure another successful “Uptober.”
Next is whale activity. Not long ago, Ali Martinez revealed that large investors used the slump from $87K to $80K to stack an additional 16,010 coins (worth nearly $1.3 billion).
An analysis published by CryptoQuant also shows that whales have launched a buying spree. The team revealed that big wallets (excluding exchanges and mining pools) have increased their total holdings to 3.03 BTC, the highest combined balance since November last year.
This accumulation is generally seen as a bullish signal, as large investors are often considered smart money with a longer-term investment horizon. Their buying leaves fewer coins available on the open market, which, combined with steady demand, could trigger a price uptick. In addition, these efforts can encourage smaller players to join the ecosystem, bringing in fresh capital.
Last but not least, we will observe BTC’s price movement after the previous US CPI data. The asset saw major initial volatility after the last four announcements (similar to what we witnessed over the past 24 hours), but X user Crypto Rover noted that the bulls eventually gained control each time, and Bitcoin rallied hard. It remains to be seen whether this time will be the same.
The Latest Predictions
According to the X account Wealthmanager, BTC has “major bid zones” stacked between $75,000 and $80,000. That said, the price could sweep lower toward that range before resuming its next big move.
X user Aman claimed that Bitcoin might be developing a “head-and-shoulders” pattern. The analyst suggested that if this plays out, $76,000-$77,000 could become “the next area to watch.”
“Not saying it will happen for sure, but the setup is there. Better to prepare for the possibility now than panic if BTC actually breaks down,” they added.
Martinez also recently chipped in. He identified $84,000 as a key level marking the 50 SMA and potentially unlocking the next rally.
The post 3 Reasons Why Bitcoin (BTC) Could Bounce Back Quickly After the Latest Pullback appeared first on CryptoPotato.
XRP is approaching a key technical inflection point after weeks of declining price action erased much of its August recovery. Trading around $1.30, the asset is testing an important support zone on both the daily and 4-hour charts. The next move around this area could determine whether buyers manage another rebound or sellers push XRP toward lower support levels.
Ripple Price Analysis: The USDT Pair
The daily chart shows XRP maintaining a broader bearish structure after falling from its early-2026 highs above $2.30. The asset has formed a series of lower highs, while the descending orange trendline continues to reflect the prevailing downward pressure, as the price has once again dropped below it and failed to continue higher. Although XRP staged a sharp recovery from the $1.00 region in August, the subsequent rally toward $1.70 failed to establish a sustained bullish reversal.
The latest decline has brought the token back to the $1.30 support zone. This area is key because it previously consolidated before the June sell-off. Holding above it could help XRP stabilize and attempt another recovery, while a decisive daily close below it would raise the risk of a deeper correction.
If support breaks, the $1.15 zone represents the next major downside area visible on the chart. Below that, the $1.00 region remains an important floor, having preceded the sharp August rally.
On the upside, XRP would first need to reclaim the $1.50 region created by recent highs to show signs of improving short-term structure. Beyond that, the $1.70 resistance zone stands out as the major obstacle, and the main level buyers must break through to start a new long-term rally.
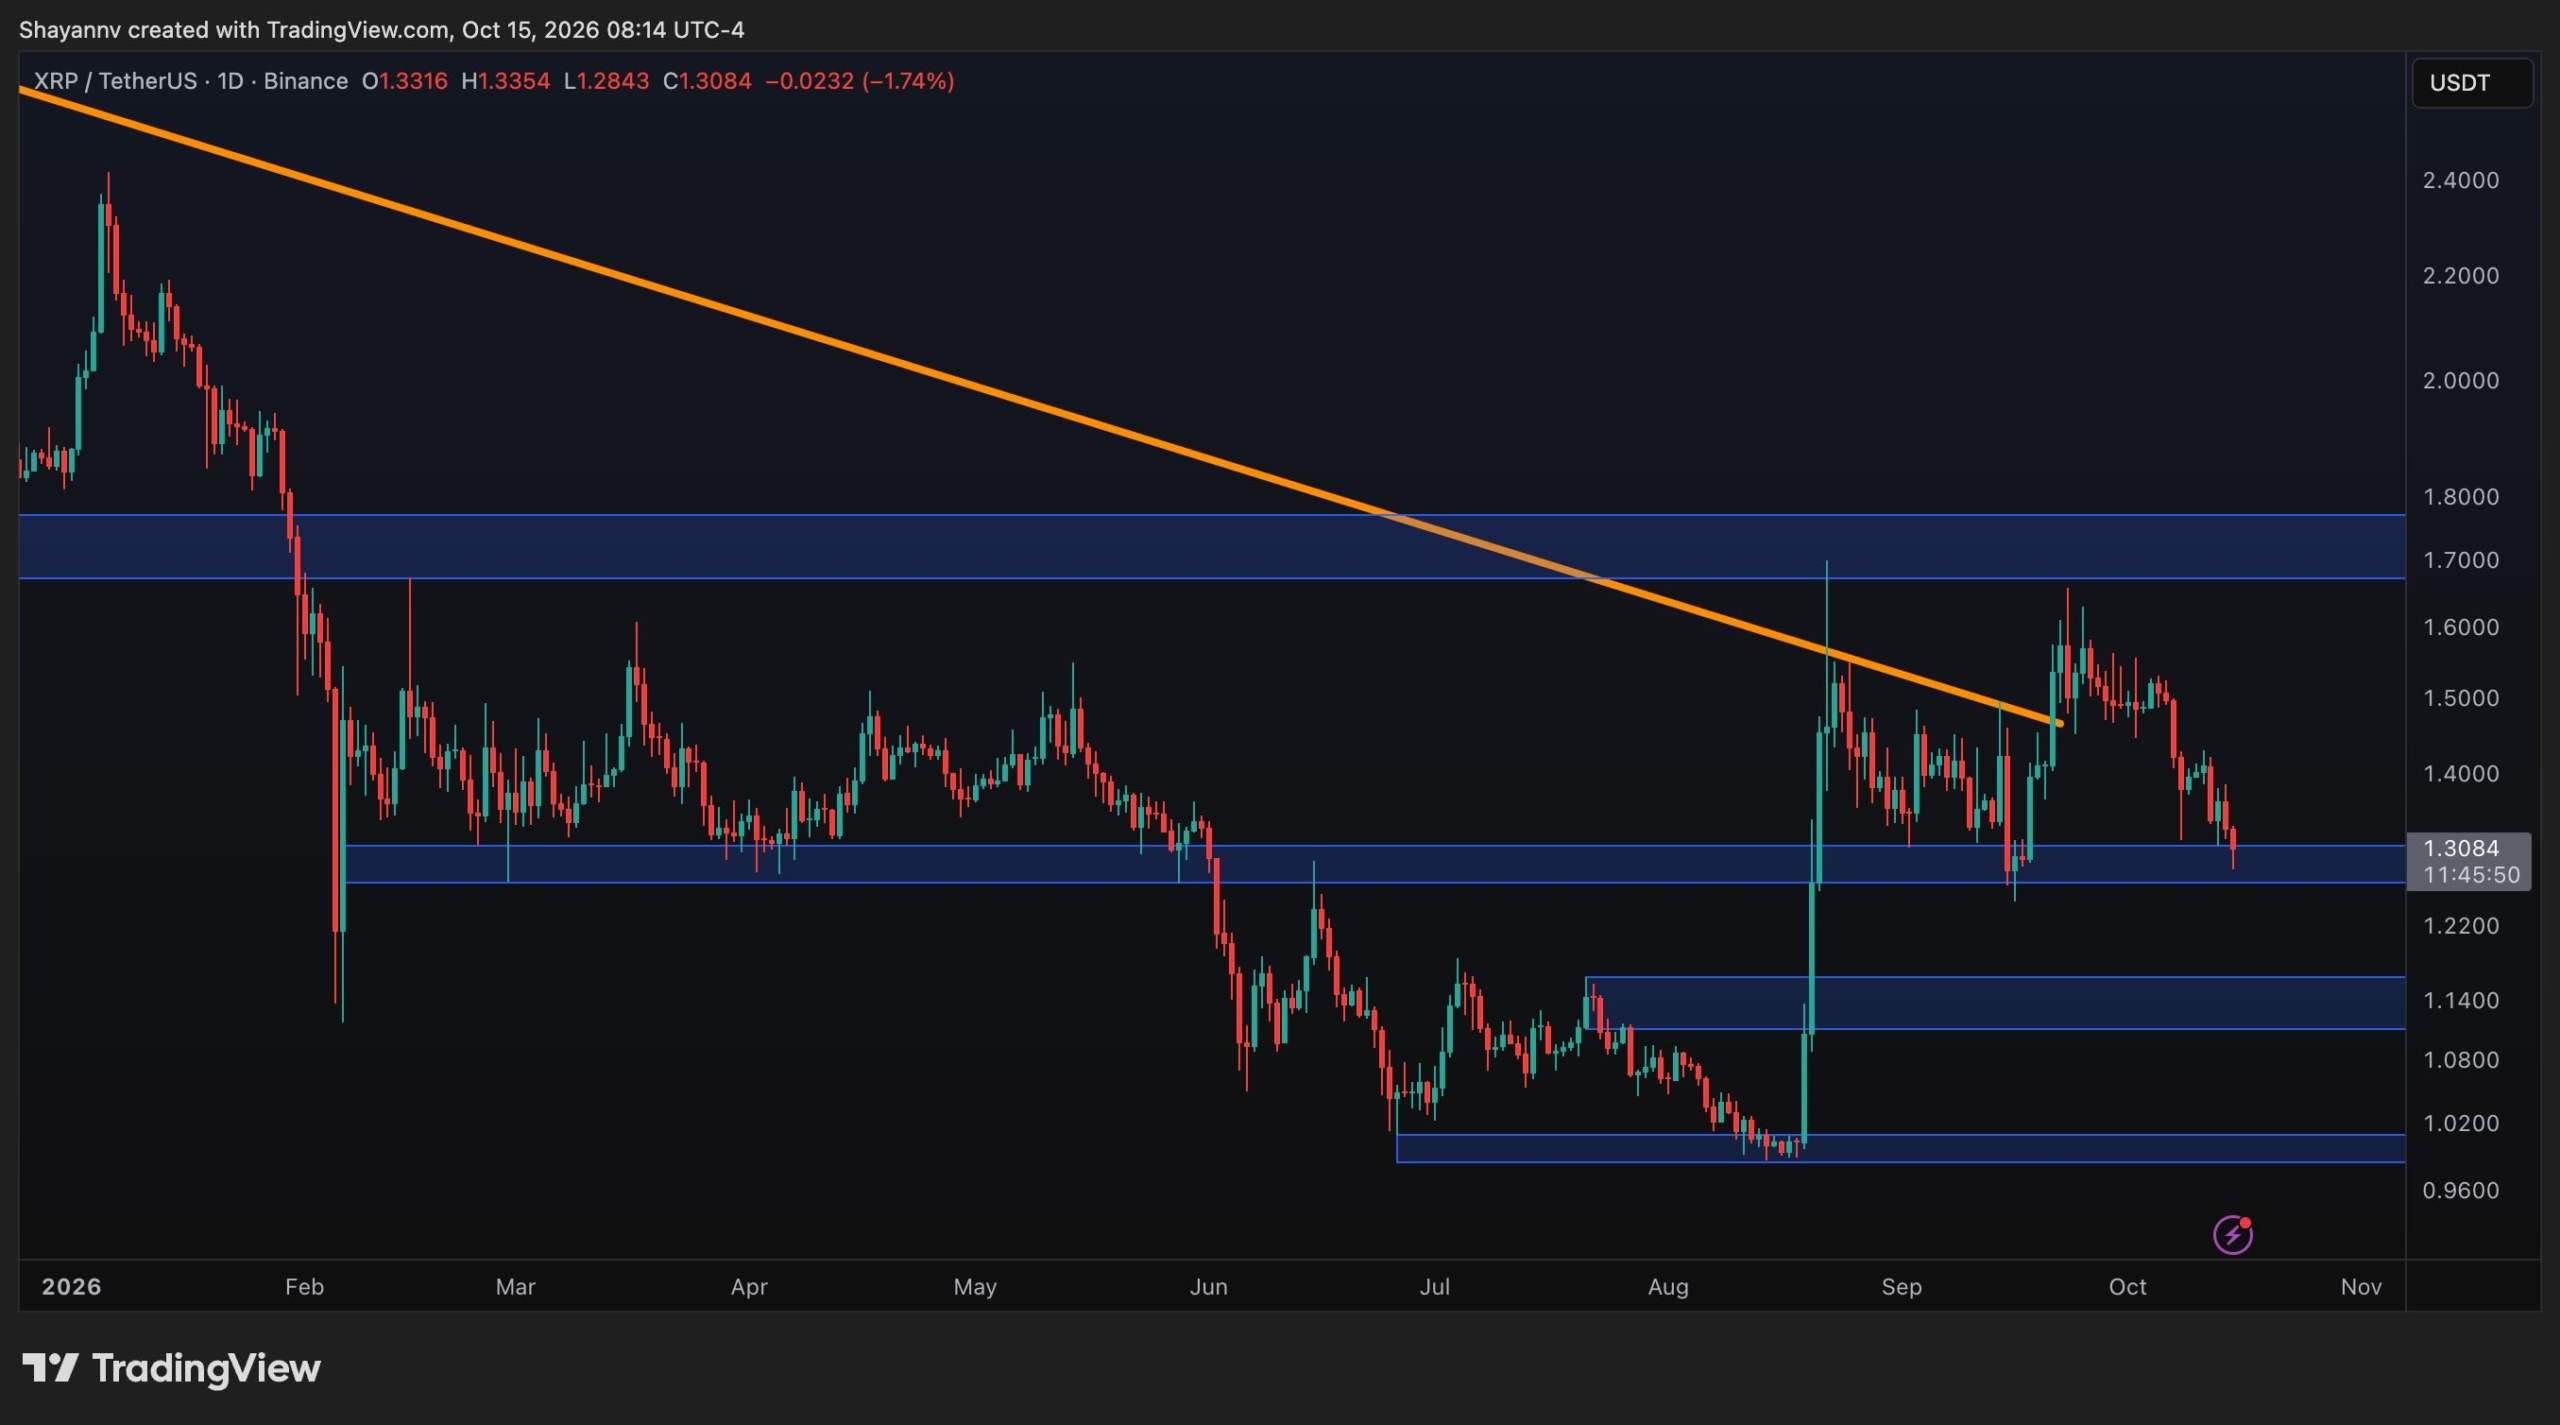
The 4-Hour Chart
The 4-hour chart offers a clearer view of immediate selling pressure. Since reaching approximately $1.65 in late September, XRP has been trading within a descending channel, characterized by lower highs and lower lows. Both channel trendlines remain relevant, with the upper boundary acting as dynamic resistance and the lower boundary marking the area where buyers could attempt to defend the price.
XRP is now testing the $1.30 support zone, which overlaps with the lower boundary of the descending channel. This confluence makes the current area particularly important for the short-term outlook. The latest candles show the price pressing against this support, but the chart does not yet confirm a decisive breakdown or a valid bullish reversal.
If buyers defend the zone, the asset could attempt a relief rally toward the $1.40 region, where the upper channel boundary is located. A breakout above this resistance would weaken the immediate bearish structure and potentially bring the $1.60-$1.70 area back into focus.
However, a confirmed move below $1.30 would suggest that buyers are losing control of the current support area. In that scenario, XRP could face further downside pressure, with the daily $1.15 zone emerging as the next major support region.
The descending channel therefore remains the dominant short-term pattern. While its lower boundary could provide a foundation for a rebound, a bullish shift would require XRP to reclaim nearby resistance and eventually break above the channel’s upper trendline.

The post Ripple Price Analysis: Is the Worst Over for XRP After Holding $1.30? appeared first on CryptoPotato.
Bitcoin is facing renewed selling pressure after failing to continue its recent advance through the $88K resistance area. With BTC now trading around $82K, the market is approaching a key support zone that could determine whether the latest pullback remains a correction within the broader recovery or develops into a deeper bearish move.
Meanwhile, the Bull-Bear Market Cycle Indicator points to a more complicated market backdrop, suggesting that the price rebound has not yet fully resolved the broader cycle uncertainty.
Bitcoin Price Analysis: The Daily Chart
Bitcoin continues to trade within a broad ascending channel, with the lower and upper boundaries defining the broader recovery structure. However, the latest rejection from the $88K region has weakened the short-term outlook, pushing BTC back toward a critical support area.
The immediate focus is on the $80K-$81K zone, which represents the recent bullish order block before the final rally toward resistance. Bitcoin is currently trading around $82K after dipping below $80K briefly earlier today, as bears are trying to push the price below the mentioned demand zone. Yet, if buyers manage to hold, the market would likely stabilize and attempt another move toward the $88K area.
Below the $80K support level, the more significant demand zone is located around $75K-$77K. If the $80K area fails to hold on a daily closing basis, this lower region could become the next downside target.
For now, the ascending channel remains intact, but the rejection from its upper region and the subsequent loss of short-term momentum suggest that buyers need to defend support quickly. A breakdown through the lower channel boundary would weaken the bullish case and increase the risk of a full bearish reversal in the upcoming months.
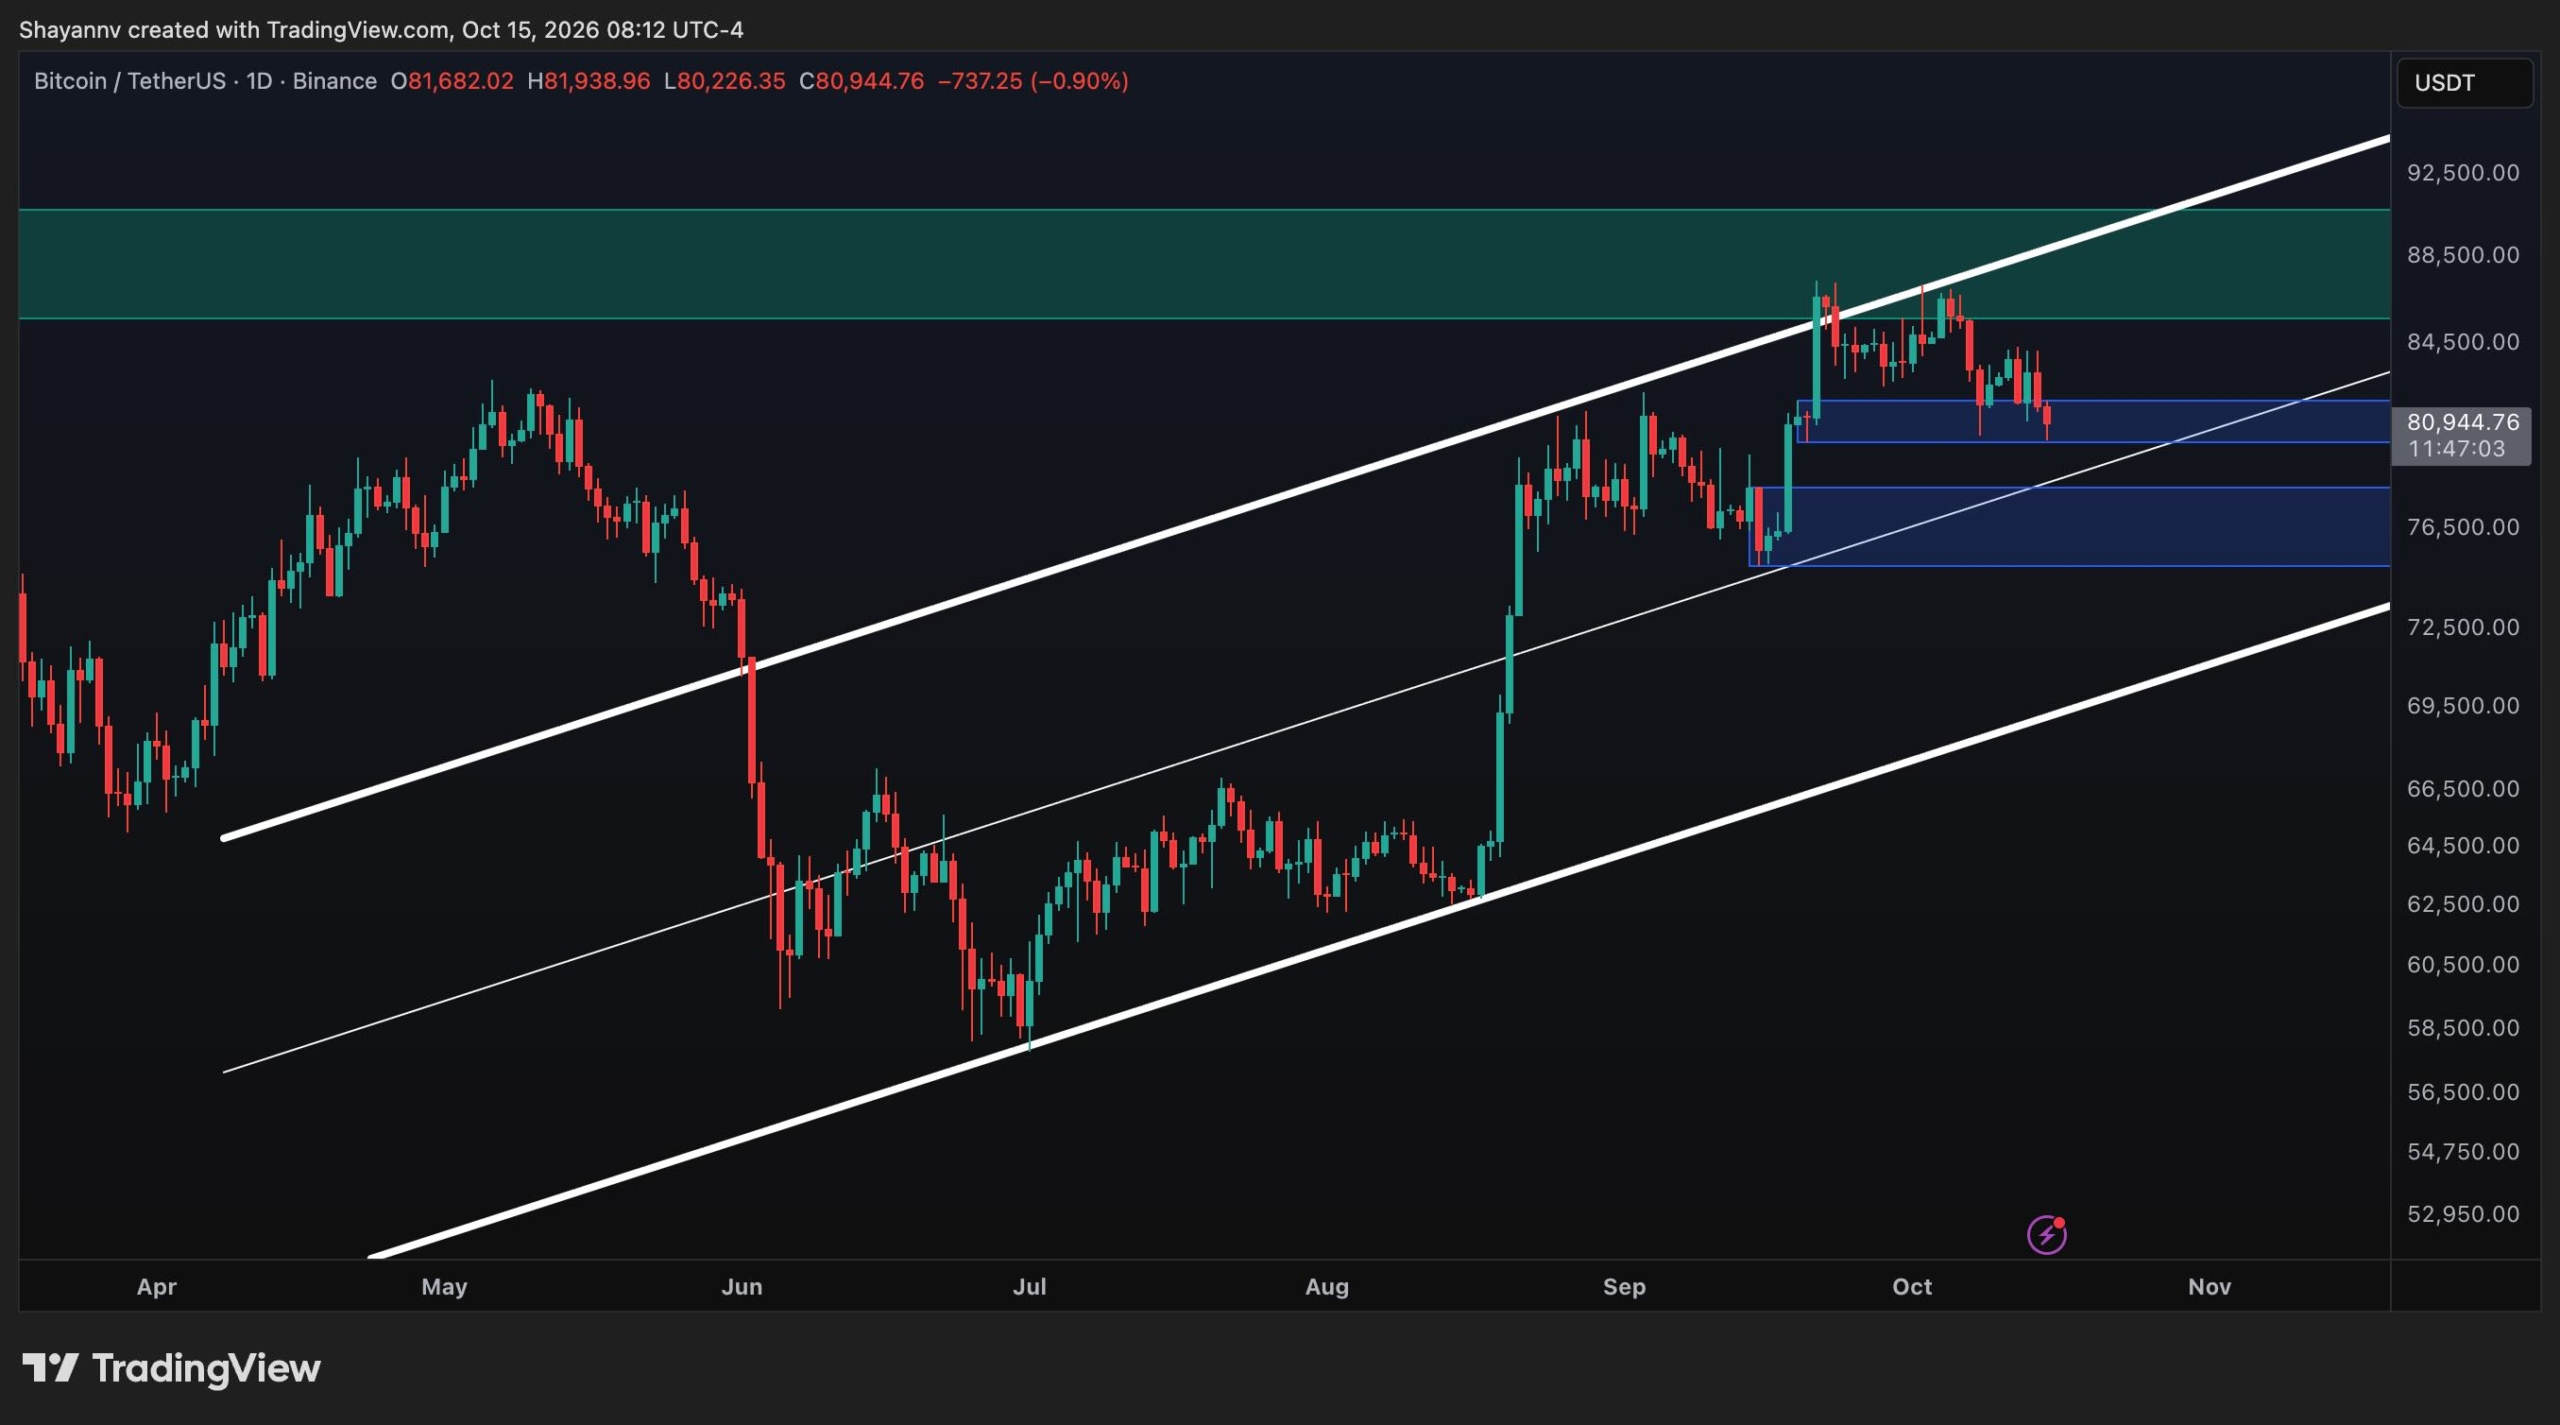
BTC/USDT 4-Hour Chart
The 4-hour chart shows a clear deterioration in market structure. After repeatedly failing to establish a sustained breakout above $87K, Bitcoin began forming lower highs before experiencing another sharp sell-off. The latest decline has brought BTC into the marked buyers’ decision zone between approximately $80K and $81K.
The immediate concern is that price has slipped below the short-term rising trendline, which had been supporting the recovery from the September lows. This breakdown suggests that the trendline is no longer providing reliable near-term support. Bitcoin is now testing whether horizontal demand around $80K can absorb the selling pressure.
A successful defense of the $80K region could produce a relief bounce toward $84K short-term highs. However, buyers would need to reclaim this area rapidly to improve the short-term outlook. Until that happens, rebounds could encounter selling pressure before reaching the more significant resistance zone.
On the contrary, if the $80K demand zone fails, the next downside level would likely be the $75K order block, which is the base of the significant rally initiated in September. In any case, the short-term structure favors caution. Bitcoin is testing support after losing its rising trendline, and the next move will likely depend on whether buyers can defend the $80K area or sellers can turn it into resistance.

On-Chain Analysis
The Bull-Bear Market Cycle Indicator on CryptoQuant provides a more nuanced view of Bitcoin’s position than price action alone. The indicator measures the distance between the P&L Index and its 365-day moving average, with positive readings associated with bull-cycle conditions and negative readings associated with bear-cycle conditions.
The chart shows that the indicator spent a prolonged period in bearish territory from late 2025 through much of 2026, including an extended and deep negative phase during the first half of 2026. This coincided with Bitcoin’s decline toward the $60K region before the subsequent recovery.
More recently, the indicator has moved back into positive territory, with the latest readings appearing in the orange bull zone. The 30-day moving average has also turned sharply higher, while the 365-day average has flattened after its extended decline. These developments suggest that the market’s underlying cycle momentum has improved considerably from its earlier bearish phase.
However, the recovery in the indicator should not automatically be interpreted as confirmation that a sustained bull market is underway. The 365-day moving average remains an important longer-term reference, and the indicator’s recent transition into positive territory still needs to be assessed alongside price behavior. The latest pullback toward $80K adds further uncertainty to that assessment.
Overall, the cycle indicator suggests that Bitcoin’s underlying momentum has recovered from the earlier bearish phase, but the price chart shows that sellers remain active near resistance. The divergence between improving cycle momentum and weakening short-term price action makes the $80K support zone especially important.

The post Bitcoin Price Analysis: Has the $80K Drop Killed BTC’s Bullish Setup? appeared first on CryptoPotato.
The company behind XRP and RLUSD has expanded its institutional trading business again, launching support for real-world asset perpetual swaps through its prime brokerage, Ripple Prime.
The offering allows clients exposure to more than 100 reference markets 24/7, spanning stocks, ETFs, metals, energy, currencies, and other traditional assets.
Ripple Prime Goes Further
The official announcement published by Ripple earlier today states that its prime brokerage will offer the swaps as principal and reference perpetual futures listed by trade.xyz on Hyperliquid. Unlike traditional stock and commodity markets, which operate during fixed hours, Ripple’s alternatives can trade continuously, including weekends.
The company argued that this gives institutions far greater flexibility to react to market developments and manage risk outside normal exchange sessions.
“Institutions want exposure to equities, commodities, and currencies with the round-the-clock access and efficiencies of digital infrastructure. Ripple Prime was built to operate in both worlds, with deep experience clearing trades and managing digital collateral and risk across venues, 24/7.
With RWA swaps, we are enabling clients to execute increasingly sophisticated trading strategies and actively manage their portfolios in response to today’s dynamic global markets,” said Michael Higgins, International CEO, Ripple Prime.
Clients can also cross-margin their RWA swap positions against other asset classes supported by Ripple Prime, while RLUSD can be used as collateral for trades. This allows institutions to manage multiple exposures through one counterparty and consolidate margin and risk management across their portfolios.
Ripple’s Wall Street Expansion Grows
Earlier this month, CryptoPotato reported that Ripple Prime expanded its relationship with Brevan Howard, providing the investment giant with multi-asset prime brokerage, clearing, and financial services. Ripple has also moved into leveraged ETF swap financing, a market historically dominated by large banks.
This expansion builds on the company’s major acquisition of Hidden Road last year for $1.25 billion, which it later rebranded as Ripple Prime.
The post Ripple (XRP) Deepens Wall Street Push With 24/7 RWA Swaps for Institutions appeared first on CryptoPotato.
GMGN is a cryptocurrency trading platform with a twist. It’s designed to help users discover, analyze, and trade meme coins.
It provides real-time token data, smart money tracking, wallet analytics, automated trading tools, and more in a single interface, along with a range of other features that I will be exploring in this review.
Overall, the goal is to make it easier to spot emerging opportunities in the fast-moving trenches market.
Unlike traditional cryptocurrency exchanges, GMGN is focused entirely on on-chain trading activity. Users are able to monitor profitable wallets, track newly launched tokens and analyze different patterns. They can also execute trades without having to switch between multiple platforms.
In the following review, I will take a look at some of its key features, supported networks, trading fees, security, and overall usability. The goal is to help you decide whether it’s the right platform for your specific trading needs and requirements.
Before we continue!
GMGN is hosting a major global trading championship that starts on October 16th. It will feature 10 days of relentless live, on-chain trading, with the top six users heading to a Grand Final in London during the flagship conference Solana Breakpoint. Entry is completely free and the champion will win a custom Aston Martin Vantage. Check out the GMGN Global Championship and sign up here.

What is GMGN?
As mentioned above, GMGN is a multi-chain cryptocurrency trading platform. It’s designed to help you discover, analyze, and ultimately trade meme coins. The protocol combines real-time market data with wallet tracking, token security checks, and automated trading tools. You can access this through a single interface, which is convenient.
How does GMGN work?
GMGN aggregates on-chain information to help you identify trading opportunities and analyze the activity of a certain token. You can explore trending tokens, search using contract addresses, examine price charts, as well as monitor transactions from other wallets.
The platform also supports automated trading through limit orders, take-profit, and stop-loss settings. It also features copy trading. You can configure various execution parameters, including slippage tolerance and priority fees. This can help you manage the way your transactions are prioritized and processed.
Supported Blockchains and Trading Markets
GMGN supports multiple networks. These include:
- Solana, which is the core primary network for high-speed meme coin trading
- BNB Smart Chain (BSC)
- Base
- Ethereum
- MegaETH
- Robinhood Chain
- Monad
- TRON
However, the protocol also supports cross-chain integration support for networks such as Solana, BSC, Rohinhood, Base, ETH, Arbitrum, Stable, Arc, Xlayer, HyperEVM, MegaETH, Monad, and Tron.
Who Should Use GMGN?
Now, GMGN is primarily suited to active meme coin traders who look for real-time market insights and advanced trading capabilities. Its wallet tracking and copy trading tools, however, may also appeal to users who want to monitor experienced traders. That said, if you have no previous experience in dabbling in the world of on-chain meme coin trading, there might be a learning curve to go through.
That said, beginners can use GMGN to explore tokens and analyze market activity. Of course, most of its advanced capabilities make understanding of on-chain transactions and adjacent trading risks very important.
Key Features of GMGN
GMGN provides a range of different tools that can help you discover new meme coins, analyze on-chain activity, and execute trades. Let’s have a look at some of the most important ones.
Meme coin discovery and token tracking
The platform’s core functionality allows you to discover newly launched and trending tokens through dedicated market lists. You can filter tokens using various criteria, including but not limited to market capitalization, transaction activity, price movements, and trading volume.
Every single token has a dedicated page that displays price charts, transaction histories, holder information, and trading activity. GMGN is also designed to support cross-chain multicharts, allowing users to monitor multiple charts at the same time.

These features can help you identify emerging tokens and compare market activity. You won’t have to switch between multiple analytics platforms, which is a considerable benefit.
Smart money and wallet tracking
The platform’s smart money tracking feature is designed to allow you to monitor wallet addresses that are associated with profitable traders, whales, and other market participants that you may find interesting.
You can follow individual wallets and receive notifications when those addresses execute transactions. Trading activity can also be categorized by the type of wallet, including KOLs, smart money, developers, and snipers.
Another notable feature is Wallet Radar, which helps users identify profitable wallets by analyzing trading activity across the selected tokens. Some of the factors used to categorize addresses include:
- Highest profit
- Earliest bought
- Most bought
- Shared holdings
You can analyze multiple tokens at the same time and add discovered addresses to your list for copy trading. Naturally, this brings me to the next feature.
GMGN copy trading
Now, copy trading has become particularly popular in the crypto space, and GMGN supports automated copy trading, which allows you to replicate buying and selling made by selected wallet addresses.
You can configure fixed purchase amounts or set maximum follow-buy limits. Selling options also include automatically copying a wallet’s sales or using separate take-profit and stop-loss conditions.

The platform also offers a Lightning Mode. This is designed to accelerate trade execution while copy trading. However, it’s worth noting that this introduces additional risks because it uses unconfirmed blockchain transaction data.
All in all, copy trading can definitely save time, but users should also account for slippage, transaction costs, as well as the differences between the original trade and its execution.
Token security analysis
This is another very important feature for on-chain traders because a lot of the upcoming and trending meme coins have not been verified by anyone. That’s why GMGN includes token security checks that can help you identify potentially suspicious assets.
Depending on the network, the platform can display indicators such as:
- Honeypot detection: Identifies tokens that may restrict selling.
- Liquidity status: Shows whether liquidity pool tokens have been locked or burned.
- Mint authority: Indicates whether additional tokens can be created.
- Holder concentration: Highlights potential risks associated with concentrated token ownership.
- Contract permissions: Shows whether certain administrative privileges have been relinquished.
- Rug pull indicators: Provides information about potential rug pull risks and previous token creator activity.
These checks can help you assess common warning signs before committing to a trade. Of course, these can never guarantee complete accuracy and even GMGN recommends consulting multiple security tools before coming to a conclusion.
Trading tools and automated orders
GMGN offers several features that are designed to automate trade execution and manage your positions.
Traders are able to place instant buy and sell orders, configure limit orders, and establish automatic take-profit or stop-loss strategies.
Specialized automated trading strategies such as Dev Sell are also included. This allows you to trigger a sale when a token creator sells a specified portion of their holdings. There are also Migrated Sells, which allow the user to automate selling when eligible Solana tokens migrate to a decentralized exchange liquidity pool. This is important for those traders who participate in launchpads such as Pump.fun, for instance.
On top of that, users are able to adjust execution settings such as slippage tolerance, priority fees, and Anti-MEV protection. The latter is designed to reduce exposure to sandwich attacks. However, stronger transaction protection could also involve additional fees or slower execution, so it’s a trade-off that you would have to consider.
It’s also important to understand that while all of these features reduce the need for constant market monitoring, automated transactions remain subject to other factors such as liquidity conditions, execution failures, network congestion, and more – all of which bring challenges that you need to take into account.
Wallet analytics and profit tracking
Another interesting feature is the ability to analyze a lot of compiled data. GMGN provides wallet-level analytics. These allow you to examine transaction histories and evaluate trading performance. You can then use the conclusions to determine whether a certain trader is worth following.
You can review metrics such as realized and unrealized profit, total buying and selling activity, average purchase prices, and current holdings.
The platform also displays historical trading activity, making it possible to investigate how individual wallets have interacted with particular tokens.
These analytics complement GMGN’s tracking and copy trading features by helping users assess wallet activity before deciding whether to follow another trader.
However, wallet performance data should be considered alongside transaction costs and market conditions, as historical profitability does not guarantee future returns.
How to Use GMGN
Getting started with the platform is going to feel incredibly familiar to anyone who has previously done any sort of on-chain trading and a bit intimidating for those who are new to it. That said, the learning curve is not that steep once you get the hang of it.
GMGN does a fairly good job of dividing the interface in clear sections, which become easy to follow once you connect your wallet.
Getting started
Once you have landed on the homepage, you can select your preferred blockchain network and start exploring trending meme coins, newly launched tokens, and market activity. If you don’t want to trade, that’s fine, you’re not required to. GMGN also allows you to search for specific tokens using their contract addresses.
When you’re ready to trade, you can connect a compatible wallet or log in through Telegram, which can expand the available automated trading features.
Setting up and funding a wallet
GMGN supports different types of wallet connection methods including Telegram-based wallets and compatible Web3 wallets such as Phantom and MetaMask, for example.
Once you have done that, you can select the deposit option, which is found in your account tab in the top-right section of the main navigation menu.
Finding and Trading Tokens
Once the wallet is funded, you can browse GMGN’s token discovery lists or search for a token using its contract address.
Before trading, you can review price charts, liquidity, transaction activity, holder distribution, and available security indicators.
To execute a trade, users select the desired token, enter the purchase amount, and configure transaction settings such as slippage tolerance and priority fees. They can then submit the transaction through the trading interface.
GMGN also allows you to configure automated orders and exit strategies, including take-profit and stop-loss conditions.
Before confirming a transaction, you should review the expected execution costs. GMGN charges a 1% trading fee, while blockchain gas fees, priority fees, tips, and any applicable token launchpad fees may increase the total cost.
Is GMGN Safe and Legit?
GMGN is a well-known and established name in the world of on-chain crypto trading. It provides several safety features, but it’s important to know that these do not eliminate the possibility of losses or malicious activity pertaining to events that are not directly associated with the platform itself. That said, let’s have a look.
Wallet Security and Asset Custody
GMGN supports external Web3 wallets alongside Telegram-based wallets for automated trading.
Now, when you connect an external wallet, you retain full responsibility for protecting your private keys and recovery phrases.
In essence, if you connect your wallet, you retain full custody of your funds. However, if you decide to use the Telegram bot, then you also need to export the private key of the newly created wallet. That said, there are caveats, so I highly recommend that you check here.
Potential Risks and Limitations
Despite the non-custodial model, there are several risks that you need to account for, all of which are not really manageable by the platform but stem from the nature of trading meme coins and newly launched cryptocurrencies.
- Severe volatility: newly launched tokens and meme coins can experience sudden price crashes and liquidity shortages.
- Copy trading risks: you can get different results based on execution delays and slippage.
- Transaction risk: blockchain congestion, network failures, and incorrect execution settings can cause unfavorable trades or failed transactions
- Phishing threats: fake websites and Telegram bots may attempt to compromise your wallet
GMGN also discussed these at length in their documentation. Overall, though, the platform provides a useful set of security and risk-analysis tools but as with all on-chain platforms, it shouldn’t be considered risk-free.
GMGN Pros and Cons
Pros
- Advanced token discovery
- Smart money tracking
- Automated trading
- Built-in security indicators
- Multiple trading products
Cons
- Trading fees
- Steep learning curve for beginners
Final Verdict: Is GMGN Worth Using?
If you are an on-chain trader, GMGN is absolutely worth using. It offers valuable tools for discovering up-and-coming tokens, meme coins, analyzing on-chain activity, and automating trading strategies. Its combination of wallet analytics, copy trading, token security indicators, and wallet tracking makes it a very appealing choice for active crypto traders.
However, it’s also worth noting that a 1% trading fee on top of common execution costs can add up, especially if you are a frequent trader.
That said, GMGN is worth considering, especially if you are an experienced meme coin and on-chain trader. If you are a beginner, you should approach the platform with caution and familiarize yourself with all the features and potential risks before committing funds.
The post GMGN Review 2026: Features, Fees, Trading Tools, and Safety appeared first on CryptoPotato.