Cryptocurrency Posts
HTTP error 403 on https://cryptobriefing.com/feed/
Failed to fetch feed: https://cryptobriefing.com/feed/
Failed to fetch feed.
Bitcoin Magazine
Bitcoin Magazine

Saylor’s Strategy (MSTR) Arms Itself With $44.1 Billion ATM Capacity to Fuel Bitcoin Treasury Expansion
Strategy has moved to sharply expand its capacity to raise capital through at‑the‑market equity and preferred offerings, adding new Wall Street agents and reshaping its preferred stock authorization to favor a key floating‑rate series.
The steps, disclosed in a March 23 Form 8‑K, give the company scope to sell up to an additional $44.1 billion in securities on top of large existing programs.
In the filing, Strategy said it entered joint agreements with Moelis & Company LLC, A.G.P./Alliance Global Partners, and StoneX Financial Inc., adding them as sales agents under its Omnibus Sales Agreement dated November 4, 2025.
That agreement already named TD Securities (USA), The Benchmark Company, Barclays Capital, BTIG, Canaccord Genuity, Cantor Fitzgerald, Clear Street, Compass Point, H.C. Wainwright, Keefe Bruyette & Woods, Maxim Group, Mizuho Securities USA, Morgan Stanley, Santander US Capital Markets, SG Americas Securities, and TCBI Securities doing business as Texas Capital Securities as agents.
Under the joinders, each of Moelis, Alliance, and StoneX becomes an agent on the same contractual footing as the original banks, with the right and obligation to place Strategy’s securities in at‑the‑market, or “ATM,” transactions.
JUST IN: Michael Saylor’s Strategy announces new $42 billion plan to buy more Bitcoin
— Bitcoin Magazine (@BitcoinMagazine) March 23, 2026pic.twitter.com/w2WA2YIzHl
Strategy’s new ATM programs and size
Alongside the added agents, Strategy and the syndicate executed three “Additional Program Addenda” that establish new ATM programs for its Class A common stock (ticker MSTR), its Variable Rate Series A Perpetual Stretch Preferred Stock (STRC), and its 8.00% Series A Perpetual Strike Preferred Stock (STRK).
These addenda operate under Section 8(i) of the Omnibus Sales Agreement and are structured so they do not cancel or limit rights under the underlying framework.
The company then filed new prospectus supplement annexes under its automatic shelf registration statement, which became effective on January 27, 2025.
Those annexes authorize at‑the‑market offerings of:
- Up to $21.0 billion of new Class A common stock (the “New Common ATM Shares”).
- Up to $21.0 billion of new STRC preferred shares (the “New STRC ATM Shares”).
- Up to $2.1 billion of new STRK preferred shares (the “New STRK ATM Shares”).
In other words, Strategy has established new ATM programs to sell up to $21 billion of common stock, $21 billion of STRC preferred, and $2.1 billion of STRK preferred shares.
These programs supplement existing authorizations, with the old STRK program replaced by the new $2.1 billion offering.
These new capacities sit alongside existing shelf authorizations. Strategy had previously registered the sale of about $15.85 billion of common stock and $4.2 billion of STRC preferred under prior annexes and the base prospectus, and it intends to keep using those prior prospectuses until those capacities are fully sold.
In contrast, the company terminated its prior STRK preferred ATM program effective March 22, 2026, and the new $2.1 billion STRK annex replaces that earlier effort.
Strategic tilt in preferred structure
To support this mix of funding options, Strategy also amended its charter with two targeted preferred stock actions. A Certificate of Increase raised authorized shares of STRC preferred from 70,435,353 to 282,556,565, more than tripling the pool available for issuance. A separate Certificate of Decrease reduced authorized STRK preferred shares from 269,800,000 to 40,270,744.
Both certificates were adopted by the board’s Pricing and Financing Committee under authority granted in the company’s Second Restated Certificate of Incorporation and Section 151(g) of the Delaware General Corporation Law.
Strategy also said they secured legal opinions confirming that its new ATM shares — both common and preferred — will be validly issued, fully paid, and non-assessable.
The 8‑K clarifies that no offers or sales are happening yet, and any actual issuances will depend on market conditions, investor demand, and internal decisions.
Overall, the expanded ATM programs and reallocated preferred shares give Strategy flexibility to raise capital while prioritizing floating‑rate preferred issuance over the 8.00% STRK series.
This post Saylor’s Strategy (MSTR) Arms Itself With $44.1 Billion ATM Capacity to Fuel Bitcoin Treasury Expansion first appeared on Bitcoin Magazine and is written by Micah Zimmerman.
Bitcoin Magazine

H100 Eyes Strategic Bitcoin Acquisition to Triple its BTC Holdings and Expand Institutional Scale
H100 Group AB (H100), the Stockholm-based publicly listed bitcoin treasury company, announced a letter of intent (LOI) to acquire Norwegian bitcoin-focused firms Moonshot AS and Never Say Die AS.
The move, if completed, would roughly triple H100’s holdings to around 3,500 BTC, positioning the company among Europe’s largest listed bitcoin treasury firms and enhancing its institutional profile, according to a press release seen by Bitcoin Magazine.
Currently holding 1,051 BTC, the company would add the target companies’ combined 2,450 BTC through the transaction.
The acquisition is structured as a bitcoin-for-bitcoin exchange, meaning ownership in the combined entity will be determined solely by the number of BTC contributed.
This preserves the existing shareholders’ exposure per share while significantly expanding the company’s balance sheet. The deal is set up as an all-share transaction with no cash consideration, consistent with H100’s strategy of bitcoin-based mergers and acquisitions.
The move comes on the heels of H100’s January announcement regarding its combination with Switzerland-based Future Holdings AG, also a bitcoin treasury company, highlighting the firm’s ongoing effort to consolidate institutional-scale bitcoin holdings in Europe.
H100’s backing
Both acquisitions have backing from Adam Back, the British cryptographer and co-founder of Blockstream, reinforcing the network of experienced bitcoin investors involved in the transactions.
Chairman Sander Andersen emphasized the industrial rationale for the deal, citing scale, credibility, and access to capital markets as increasingly important for publicly listed bitcoin firms.
“This transaction would significantly strengthen H100 in all these areas,” Andersen said, noting that the acquisition aligns with H100’s ongoing capital markets and M&A strategy while leaving its listing structure and core operations unchanged.
The target companies bring more than just bitcoin holdings. Moonshot AS and Never Say Die AS are led by seasoned professionals including CEO Eirik Grøttum, a former systematic trader and asset manager, and CIO Peter Warren, a hedge fund veteran with extensive experience across equities, derivatives, and FX markets.
Together with founder Geir Harald Hansen, the pioneer behind the Bitminter BTC mining pool, the Norwegian teams bring operational expertise and technology capabilities expected to complement H100’s treasury management and capital markets activities.
Following completion, the company will remain the listed parent company. Management and board positions are expected to include representatives from both H100 and the acquired firms, ensuring continuity of existing leadership while integrating new expertise.
Current executives, including Andersen and CEO Johannes Wiik, will continue in central roles. Definitive agreements are targeted by April 22, 2026, with completion expected shortly after H100’s annual general meeting on May 21, subject to regulatory approvals and customary conditions.
The company continues to operate its health technology business alongside its bitcoin treasury strategy, combining digital health tools and AI-powered solutions for providers of health and lifestyle services.
The firm said its core business model and listing structure will remain unchanged even as it pursues aggressive growth in bitcoin holdings.
This post H100 Eyes Strategic Bitcoin Acquisition to Triple its BTC Holdings and Expand Institutional Scale first appeared on Bitcoin Magazine and is written by Micah Zimmerman.
Bitcoin Magazine

Bitcoin Price Rockets to $71,000 as Trump Orders Pause on Iran Strikes
Bitcoin price surged to $71,000 on Monday, rebounding from weekend lows near $67,000, as markets reacted to a sudden shift in geopolitical risk after Donald Trump announced a pause on planned U.S. strikes against Iran.
The move, which followed what Trump described as “very good” and “productive” talks with Tehran, triggered a broad relief rally across risk assets.
Bitcoin price rose roughly 5% into the start of the week, reclaiming key technical levels that traders had identified as critical to maintaining bullish momentum.
The announcement marked a sharp reversal from escalating rhetoric over the weekend, when Washington had threatened strikes on Iranian energy infrastructure if shipping lanes through the Strait of Hormuz were not fully reopened. That ultimatum had pushed global markets into a defensive posture, with oil spiking and equities sliding.
Instead, Trump said via social media that the U.S. would delay any military action for five days, citing ongoing discussions and the possibility of a broader de-escalation. “Very good talks” had taken place over the past 48 hours, he said, raising hopes for an end to hostilities that have destabilized the region for weeks.
Iran’s response cast doubt on that narrative. Officials in Tehran denied that any direct dialogue had occurred, describing Trump’s statement as a tactic aimed at lowering energy prices and buying time for potential military planning.
The country has previously warned it would retaliate against energy infrastructure across the Middle East if attacked.
JUST IN: Bitcoin pumps above $71,000 following President Trump’s announcement of potentially ending the war with Iran
— Bitcoin Magazine (@BitcoinMagazine) March 23, 2026
Bitcoin price and broader markets respond
Despite the conflicting accounts, markets focused on the immediate implication: a pause in escalation.
Oil prices dropped sharply on the news, reversing gains tied to fears of supply disruption. Hundreds of vessels remain stranded around the Strait of Hormuz, a chokepoint that handles a significant share of global energy flows, though some tankers have begun cautiously transiting the corridor.
The reopening of the waterway remains a central condition for any sustained de-escalation.
The prospect of strikes on power plants had represented a potential inflection point in the conflict. Targeting electricity infrastructure could trigger cascading humanitarian and economic consequences, particularly in Gulf states reliant on desalination and cooling systems. Iranian threats to expand retaliation to similar targets across the region heightened those concerns, raising the risk of a wider war.
That scenario now appears temporarily delayed, though far from resolved.
On the ground, military activity continues. Israeli forces have expanded operations in both Iran and southern Lebanon, targeting infrastructure and supply routes tied to Hezbollah.
Meanwhile, nuclear safety concerns have resurfaced after reports of military activity near Iran’s Bushehr facility prompted discussions between international and Russian officials. The International Atomic Energy Agency reiterated warnings against any action that could compromise nuclear plant safety.
Gold crashes while Bitcoin price stays strong
Against this backdrop, Bitcoin price reflects a market recalibrating its view of geopolitical risk.
The asset had shown resilience throughout the conflict, holding a firm floor near $66,000 even as traditional safe havens faltered.
Gold, which typically benefits from geopolitical stress, has declined in recent sessions, while equities faced sustained pressure from rising yields and energy volatility.
Bitcoin price’s response to the latest developments reinforces a shifting narrative. Rather than trading purely as a risk asset, it has begun to absorb flows during periods of macro uncertainty, particularly when confidence in traditional hedges weakens.
For now, it seems like the market hinges on a five-day window with peace talks to continue this coming week.
Elsewhere, Strategy added 1,031 bitcoin for $76.6 million last week, slowing its recent aggressive accumulation despite holding one of the largest corporate bitcoin positions.
At the time of writing, the bitcoin price is slightly shy of $71,000.

This post Bitcoin Price Rockets to $71,000 as Trump Orders Pause on Iran Strikes first appeared on Bitcoin Magazine and is written by Micah Zimmerman.
Bitcoin Magazine

Strategy (MSTR) Buys $76.6 Million in Bitcoin, Slowing Recent Accumulation Pace
Strategy made a smaller-scale bitcoin purchase last week, adding to a balance sheet that has grown into one of the largest corporate holdings of the asset, even as market conditions shift and the firm sits on a sizable unrealized loss.
Led by executive chairman Michael Saylor, Strategy disclosed that it acquired 1,031 bitcoin for $76.6 million between March 16 and March 22, according to a regulatory filing. The purchases were made at an average price of $74,326 per coin and funded through the sale of common stock.
The pace marks a sharp slowdown from the prior two weeks, when the company deployed more than $1 billion into bitcoin through a mix of equity issuance and preferred share offerings. The shift suggests a more measured approach after a period of aggressive accumulation tied to capital market activity.
Strategy now holds 762,099 BTC, acquired for roughly $57.7 billion at an average cost of $75,694 per coin.
With Bitcoin trading near $71,000, the position carries an unrealized loss estimated at several billion dollars. The gap between cost basis and market price underscores the firm’s continued exposure to bitcoin’s price swings, even as it maintains a long-term accumulation strategy.
Saylor signaled the purchase ahead of the official announcement, posting an update to the company’s bitcoin acquisition tracker with the message “The Orange March Continues.” The firm has already acquired 43,346 BTC this month for roughly $3.05 billion.
JUST IN: Michael Saylor's Strategy purchased 1,031 bitcoin for $76.6 million
— Bitcoin Magazine (@BitcoinMagazine) March 23, 2026
Strategy is racking in bitcoin
The company’s approach has centered on raising capital through equity markets and redirecting proceeds into bitcoin, a model that has drawn both support and scrutiny.
Supporters view the strategy as a levered bet on bitcoin’s long-term appreciation, while critics point to dilution risk and balance sheet concentration.
Last week’s purchases were funded entirely through at-the-market sales of Class A shares. Strategy sold more than 500,000 shares to finance the latest acquisition and still retains billions of dollars in remaining capacity under its issuance program.
In contrast, there was no issuance tied to its preferred stock offerings during the period, a departure from recent weeks when those instruments played a larger role.
Market conditions may also be shaping the firm’s cadence. Bitcoin has traded in a narrow range in recent sessions, reflecting a mix of macro pressure and cautious sentiment. Price action has remained below Strategy’s average acquisition cost, limiting the immediate impact of continued buying on its balance sheet.
At the same time, broader risk markets showed signs of stabilization. U.S. equities moved higher in premarket trading, and Strategy’s shares edged up alongside bitcoin’s rebound toward the $70,000 level.
The move followed a pause in geopolitical escalation after the Trump administration delayed potential strikes tied to tensions in the Middle East, easing pressure on energy markets and risk assets.
At the time of writing, Bitcoin is trading slightly shy of $71,000 and MSTR is trading near $139 a share.
 Buys $76.6 Million in Bitcoin, Slowing Recent Accumulation Pace 2")
This post Strategy (MSTR) Buys $76.6 Million in Bitcoin, Slowing Recent Accumulation Pace first appeared on Bitcoin Magazine and is written by Micah Zimmerman.
Bitcoin Magazine

White House Reaches Tentative Crypto Regulatory Agreement: Report
Key senators and the White House have reached a tentative agreement on cryptocurrency legislation aimed at resolving a dispute between banks and digital asset firms over stablecoin yields, according to Politico reporting.
The move could clear the way for a landmark crypto regulatory bill stalled in the Senate Banking Committee since January.
Sen. Thom Tillis (R-N.C.) and Sen. Angela Alsobrooks (D-Md.) said Friday they have an “agreement in principle” on language intended to balance innovation with financial stability. The legislation seeks to prevent stablecoin rewards programs from triggering widespread deposit withdrawals from traditional banks, a concern raised by Wall Street groups.
“The agreement allows us to protect innovation while giving us the opportunity to prevent widespread deposit flight,” Alsobrooks said. Tillis described the deal as a positive step but noted the need to consult with industry stakeholders before finalizing details.
While specifics of the agreement remain unclear, early indications suggest it could bar yield payments on passive stablecoin balances. The tentative deal signals progress toward an April vote on the crypto market-structure bill, potentially unlocking the first major federal regulatory framework for digital assets.
Crypto legislation background
The fight over a U.S. crypto market‑structure bill stems from a broader effort to build on 2025’s landmark stablecoin legislation, the GENIUS Act, which established a federal framework for stablecoins — requiring full backing, transparency and reserve disclosures for digital dollars.
That law was widely seen in the crypto industry as a breakthrough for regulatory clarity while attempting to align digital assets with traditional financial standards.
After the GENIUS Act’s passage, the Senate turned its attention to more expansive digital asset oversight through what’s often referred to as the CLARITY Act or the crypto market‑structure bill.
This legislation aims to define how U.S. regulators would police and oversee trading platforms, tokens, custody services and other infrastructure — essentially the backbone of a regulated digital asset ecosystem.
However, negotiations bogged down over one central issue: whether regulated exchanges should be allowed to offer yield‑bearing rewards on stablecoin holdings.
Banks and major financial institutions argue that these rewards resemble unregulated deposit‑like products that could siphon funds away from FDIC‑insured accounts, potentially threatening lending and financial stability.
Crypto firms — including major issuers like Circle and Coinbase — counter that such incentives are crucial for competitive markets and for user adoption of digital money.
The current tentative deal being negotiated between senators and the White House seeks a middle ground — potentially allowing activity‑based rewards while restricting passive yield — in hopes of unlocking Senate committee action by April. Whether that compromise holds both bank and crypto support will be decisive for the future of U.S. digital asset regulation.
This post White House Reaches Tentative Crypto Regulatory Agreement: Report first appeared on Bitcoin Magazine and is written by Micah Zimmerman.
CryptoSlate
Bitcoin’s jump back above $70,000 on Monday morning came with unusual clarity.
The move started when Donald Trump posted on Truth Social that the United States and Iran had held “very good and productive conversations” on a “complete and total resolution” of hostilities in the Middle East, and that planned strikes on Iranian power plants and energy infrastructure would be delayed for five days.
Within seconds, global markets repriced. Oil tumbled more than 10%, U.S. stock futures jumped more than 2%, European equities reversed sharp early losses, and Bitcoin sprinted from the upper $67,000s back through $70,000.
Kobeissi estimates the move added about $2 trillion in market value. The rally then reversed slightly after Iran said there had been “no contact” with Washington. By 8:00 a.m. ET, futures were down about 120 points from the peak, erasing roughly $1 trillion.
In Kobeissi’s words, that left the S&P 500 with a total headline-driven swing of about $3 trillion in implied market value in 56 minutes.

Trump’s post was the trigger, but the force came from the macro chain that followed
Before the post, the market had been moving in the opposite direction. Higher crude prices were feeding a stagflation scare. Rising energy costs were threatening to push inflation expectations higher just as growth data had started to soften. Bond yields were climbing again. Bitcoin, gold, and equity futures were all under pressure while rates rose into a more sensitive zone.
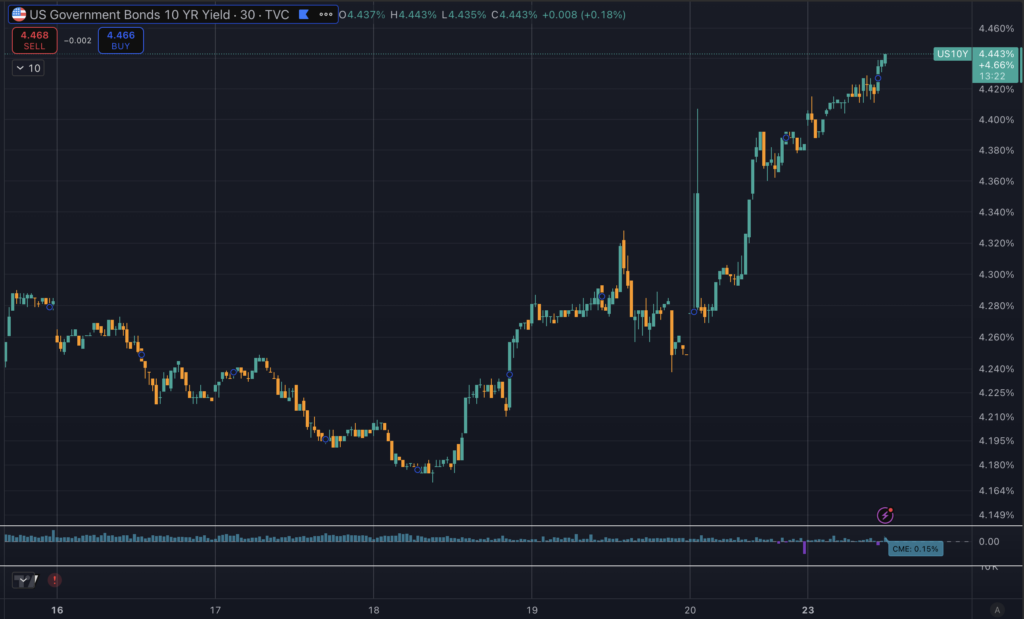
In CryptoSlate’s morning analysis of the week ahead, the focus had already shifted from oil alone to the bond market, with the U.S. 10-year yield approaching a level that can tighten financial conditions quickly.

Then the market received a de-escalation signal.
The reaction after Trump’s post filled in the sequence in real time. Brent crude dropped more than 10% as traders stripped out part of the war premium. Dow futures rose about 2.6%, while the FTSE 100 recovered almost all of an earlier 250-point slide. Gold also reversed sharply, with an intraday slide of more than 7% before losses narrowed.
In rates, the U.S. 10-year yield dropped more than 20 basis points to around 4.30% before settling near 4.36% as of press time. Bitcoin followed the same repricing path at high speed, reclaiming $70,000 as the pressure embedded in oil and yields started to ease.
Oil cracked first. Yields backed off. Gold reversed. Equity futures snapped higher. Bitcoin then expressed the same repricing faster than most major assets.
The significance for Bitcoin sits one layer below the spike itself. Nothing about the crypto market changed in a structural sense during those five minutes. The post did not bring a new ETF catalyst, a policy shift from the Fed, or a sudden change in on-chain conditions.
What changed was the macro environment that had been pressing on every risk-sensitive asset for days. The market moved from pricing a wider energy shock to pricing the possibility of a pause.
CryptoSlate’s recent coverage has already mapped that transition.
- On March 7, we argued that oil had become one of Bitcoin’s clearest macro signals.
- On March 9, Bitcoin slipped below $70,000 as oil moved higher and stagflation fears intensified.
- On March 11, the market showed its first instinct during an oil panic, when traders sold Bitcoin rather than treating it as a haven.
- On March 12, Bitcoin held up better even as Brent briefly reclaimed $100, which suggested the market was beginning to separate immediate panic from broader positioning.
- By Monday morning, the center of gravity had shifted again, from oil shock alone to the risk that higher yields would become the dominant problem.
Monday’s move above $70,000 needs to be read inside that framework.
The timing invites a stronger political-economic reading
The U.S. 10-year had been approaching a zone that can become politically and financially difficult very quickly. Mortgage costs respond to it. Equities respond to it. Fiscal sensitivity rises with it. The White House watches it.
My morning piece already outlined the market’s concern around the 4.5% area, especially with Treasury auctions, flash PMIs, jobless claims, and inflation expectations lined up to shape the week. Trump’s post arrived just as the bond market was threatening to become part of the problem in a larger way.
Trump's post could be more than a diplomatic update. It looks like an intervention into a market sequence that was beginning to grow expensive.
Oil was pushing inflation risk back into the system. Rising yields were tightening financial conditions. Gold and stock futures had already moved into defensive positions. A de-escalation signal at that point gave traders permission to reverse the most painful part of the morning’s repricing.
That interpretation rests on incentives and timing, rather than on any official confirmation of motive. It fits the market sequence cleanly. It also fits the broader sensitivity around borrowing costs. The Guardian’s live coverage captured the pressure that rising yields had already started to place on the UK mortgage market, while we had already identified bond yields as the more dangerous extension of the oil shock for Bitcoin.
Once yields started to ease after Trump’s post, the path higher in BTC reopened immediately.
Bitcoin’s own market structure helps explain why the move traveled so fast.
A session shaped by higher oil and rising yields usually creates a defensive posture across crypto. Spot demand softens. Leveraged players hedge. Short exposure can build when macro pressure aligns across rates and energy.
Once the macro impulse flips, crypto often becomes the fastest outlet for the reversal. That appears to be what happened on Monday.
The move through $70,000 reads as a relief repricing amplified by positioning, speed, and the market’s existing sensitivity to macro inputs.

Macro repricing added an important confirming signal
Gold's sharp reversal suggests that traders were taking out part of the immediate war premium rather than rotating into a classic safe-haven structure. Bitcoin moved with that same repricing wave, which places it firmly inside the macro risk complex for this session.
That fits the recent pattern we have shown in our own reporting, where Bitcoin has traded more like a high-beta expression of financial conditions than a defensive shelter during energy-driven stress.
There are still limits to how far Monday’s relief can be extended.
Iranian media quickly pushed back on Trump’s account of the talks. Business Insider noted that oil rebounded from its lows as traders began to question how durable the de-escalation signal really was.
That leaves the market with a pause, rather than with resolution. The difference is important because Bitcoin’s hold above $70,000 now depends less on the post itself and more on whether the broader macro relief can survive a week, which remains difficult to read.
The normal inflation anchor is absent. The Bureau of Economic Analysis release calendar shows that the February PCE will not arrive until April 9, leaving traders leaning more heavily on secondary indicators and Treasury supply.
Our morning analysis highlighted the immediate sequence: flash PMIs on Tuesday, the 2-year auction on Tuesday, the 5-year on Wednesday, jobless claims and the 7-year auction on Thursday, and the final University of Michigan sentiment reading on Friday.
With oil having shaken inflation expectations and bond yields already testing market tolerance, those events now carry more weight for Bitcoin than any crypto-native development on the calendar.
That leaves Bitcoin with a clearer near-term map
If oil stays contained and the U.S. 10-year remains below the earlier stress zone, Monday’s move can become a platform. A reclaimed $70,000 then starts to look like a level the market can build above while it reassesses the inflation path and broader financial conditions.
If oil regains momentum and yields resume their climb, the relief trade loses force quickly. Bitcoin would then move back into the same macro regime that had been dragging on it before Trump posted, one defined by tighter financial conditions, more expensive risk, and a market that still sees stagflation as a live possibility.
The answer to the morning’s initial question is now fairly tight.
Bitcoin jumped almost 5% in five minutes because Trump’s post broke a one-way macro sequence that had been building across oil, rates, metals, and equities.
The post gave traders a reason to cut some of the war premium. Oil fell, yields followed, stocks reversed, gold dropped, and Bitcoin expressed the repricing fastest.
The deeper layer is the one traders will keep watching. Trump’s post arrived at a point where rising oil and rising yields were beginning to feed into a more dangerous mix for financial conditions.
The market response suggests participants understood the signal immediately.
For Bitcoin, the move above $70,000 restored momentum. Whether that level holds now depends on the next phase of the same macro chain, crude, yields, and whether the market believes the relief has enough substance to keep financial conditions from tightening again.
The post Markets reversed over $3 trillion this morning as Bitcoin price exploded above $70k in 5 minutes appeared first on CryptoSlate.
Bitcoin climbed back above $70,000 after President Donald Trump said the United States had held “productive conversations” with Iran and would postpone planned strikes on Iranian power plants and energy infrastructure for five days.
In a March 23 post on Truth Social, Trump wrote in capital letters:
“BASED ON THE TENOR AND TONE OF THESE IN DEPTH, DETAILED, AND CONSTRUCTIVE CONVERSATIONS, WHICH WILL CONTINUE THROUGHOUT THE WEEK, I HAVE INSTRUCTED THE DEPARTMENT OF WAR TO POSTPONE ANY AND ALL MILITARY STRIKES AGAINST IRANIAN POWER PLANTS AND ENERGY INFRASTRUCTURE FOR A FIVE DAY PERIOD, SUBJECT TO THE SUCCESS OF THE ONGOING MEETINGS AND DISCUSSIONS.”
Trump said the delay would depend on the outcome of talks that are set to continue through the week.
This eased some of the risk aversion that had spread across global markets earlier in the session.
Data from CryptoSlate showed that the move pushed Bitcoin up about 3.6% on the day to $70,968, after it traded as low as $67,436 intraday.
Other digital assets, including Ethereum, XRP, Solana, and the top 10 crypto assets by market capitalization, all registered gains of more than 4% as traders moved back into risk assets following the White House signal.
Following the uptick, short sellers who were betting against upward market momentum lost $271 million in the past hour, bringing their total losses to $364 million over the last 24 hours.
Trump's shifting position on Iran war
This marketwide rebound came after a volatile weekend in which Trump issued a series of shifting statements on the conflict.
Trump had previously threatened to destroy Iranian power infrastructure if the Strait of Hormuz was not reopened, while Iran warned it would retaliate against infrastructure linked to US interests and regional allies.
Those exchanges pushed markets toward a classic risk-off posture earlier on Monday, with oil surging, equities sliding, and investors reassessing the outlook for inflation and interest rates.
Once Trump announced the pause, the reaction spread quickly across asset classes. Oil prices fell sharply as traders reduced some of the geopolitical premium tied to fears of disruption in the Gulf.
Data from Oilprices show that West Texas Intermediate crude dropped 13% to $85.45 a barrel and Brent fell 12% to $98.66 after Trump’s post signaled a temporary opening for diplomacy.
At the same time, US stock futures rebounded more than 2%, reflecting a partial unwind of the defensive positioning that had dominated earlier in the day.
While, Europe’s STOXX 600 reversed losses of more than 2.2% to trade higher, and the dollar gave back earlier gains as investors responded to the prospect of a temporary de-escalation.
The post Bitcoin rockets to $70,000 as Trump announces shock pause on Iran strikes appeared first on CryptoSlate.
Bond markets, not oil alone, may decide Bitcoin’s fate this week
The market is still treating oil as the center of the current macro shock.
Market conditions after this weekend point somewhere else. Oil is the spark, bond markets are the channel, and Bitcoin is trading inside that channel as the week begins.
That is the setup now facing investors.
The geopolitical shock still carries weight. Crude can reshape inflation expectations, complicate central-bank decisions, and hit risk sentiment in a single move. The bigger issue, however, is what that energy shock is doing to sovereign debt markets at a moment when investors were already questioning how much inflation relief they could realistically expect in 2026.
That shift in focus takes the conversation from oil to yields, from yields to global bond pricing, and then directly to Bitcoin.
Bitcoin is operating in a market where the long end of the curve has become impossible to ignore.
Right now, the long end is under pressure.
The core thesis is straightforward: markets have already priced in war risk through energy, while the next repricing phase is centered on whether that energy shock becomes persistent enough to keep long-term yields elevated, delay policy relief, and tighten financial conditions across the board.
Every risk asset feels that process, and Bitcoin sits especially close to it because it still straddles two roles. In the short run, it behaves like a liquidity-sensitive macro asset. Over a longer horizon, it still carries the appeal of a hard-asset hedge.

That tension sits at the center of the current setup.
The Kobeissi Letter moved closer to the right framework this weekend, arguing that oil prices are no longer the only threat to markets and that bond markets will play a major role in determining how long Washington can maintain pressure in the Iran conflict. The key takeaway from that argument lies in the market mechanics.
The U.S. 10-year yield climbed sharply after the war began on Feb. 28. Official Treasury data shows it moved from 3.97% on Feb. 27 to 4.39% by March 20, with live trading pushing it back toward the 4.4% area on Monday. That move is large enough to confirm that yields have risen quickly and that the bond market is applying real pressure on broader financial conditions.
Yield zone becomes the binding constraint for risk assets
The 4.50% to 4.60% zone on the 10-year deserves a more careful description. It reads best as a politically and financially sensitive range, rather than a fixed tripwire that forces an immediate response.
Markets rarely move with that kind of precision. Even so, recent experience suggests the White House pays close attention when the long end rises far enough to threaten broader risk conditions.
For Bitcoin, the implication is clear. The central question is no longer limited to whether oil moves higher. The more important issue is whether oil remains firm enough to keep inflation fears alive and lift yields into a range that pressures duration, equity multiples, and speculative positioning at the same time.
That is why the yield response deserves the bulk of investor attention.
The broader macro backdrop offers little relief.
The Federal Reserve held rates at 3.50% to 3.75% last week and signaled that the Middle East situation adds another layer of uncertainty to the policy outlook. The surrounding data reinforced that caution.
February CPI came in at 2.4% year over year, with core at 2.5%. February PPI ran hotter on a monthly basis. Payroll growth has cooled, and consumer sentiment has weakened. The University of Michigan’s preliminary March reading also showed inflation expectations rising, with gasoline prices standing out as a visible pressure point for households.
That combination leaves markets facing a difficult mix, softer growth signals arriving alongside renewed inflation anxiety.
Bitcoin tends to struggle when that mix starts feeding directly into the term premium.

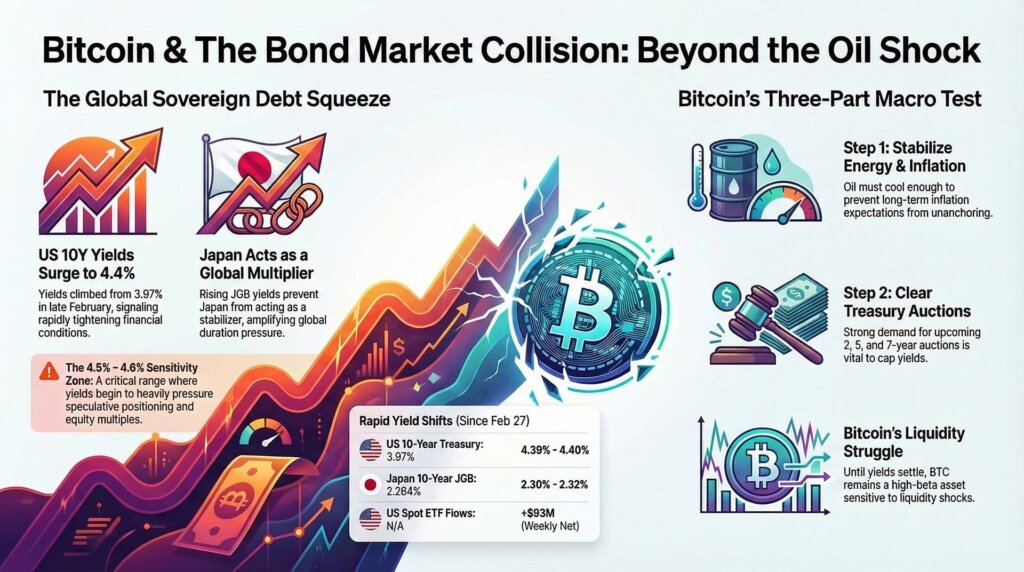
Japan now deserves a much bigger place in the conversation
One of the most underappreciated risks in the current environment is that this has expanded beyond a U.S. Treasury move. Japanese government bond yields have also moved higher since Friday, with the 10-year JGB rising from 2.264% on March 20 into roughly the 2.30% to 2.32% range on Monday.
Longer-dated yields moved higher as well, with the 30-year and 40-year both pressing upward.
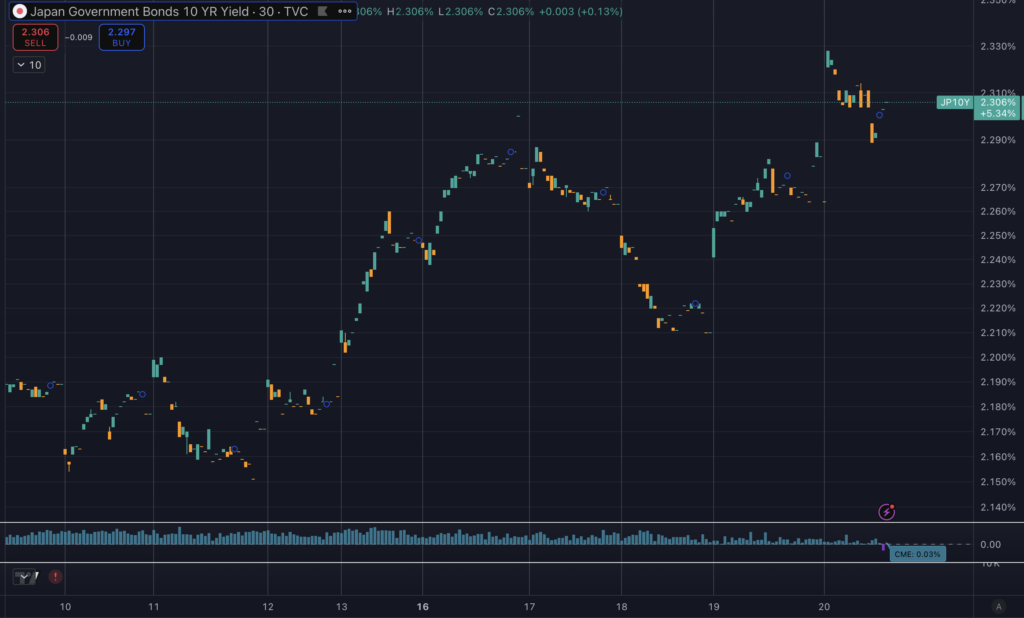
At the same time, 10-year JGB futures remained pinned near recent lows after Friday’s selloff instead of staging a convincing rebound.
That development adds another layer to the macro pressure.
Japan matters in global duration markets because rising JGB yields can influence capital flows, relative-rate pricing, hedging decisions, and the broader cost of money worldwide.
When JGBs reprice higher while Treasuries and gilts remain under pressure, the market begins to treat the energy shock as a global bond-market event rather than a localized oil panic.
That shift creates another challenge for Bitcoin.
The Bank of Japan reinforced that theme last week when it acknowledged that crude prices had risen significantly and warned that higher oil would place upward pressure on consumer prices.
The BOJ did not signal panic, but it also did nothing to cool the sense that inflation risk is broadening. Markets had already been pricing meaningful odds of another BOJ hike, and reports that Japan is considering trimming buybacks of inflation-linked bonds have only added to the sense that local inflation expectations are stirring again.
That leaves Japan acting less like a stabilizer and more like an amplifier.
Bitcoin traders often want the asset treated as digital gold during geopolitical stress. Price action has so far pointed to a more complicated reality. When the oil shock hit, traders sold Bitcoin instead of moving into it as a traditional haven. That response does not invalidate the hard-asset case over a longer horizon. It does show that timing plays a crucial role.
Bitcoin can still attract a more defensive bid later, especially if the policy response to weaker growth becomes more aggressive or if investors begin focusing more intensely on fiat credibility and sovereign debt sustainability. In the first stage of a liquidity shock, rising yields still create a hostile backdrop.
The week ahead carries unusual weight
This week does not include the usual PCE inflation anchor, because February U.S. PCE has been pushed back to April 9.
As a result, markets will lean more heavily on secondary signals. That raises the importance of Treasury auctions, PMI data, jobless claims, and survey-based inflation expectations.
Those releases form the scoreboard for the week.
Tuesday’s flash PMIs will offer an early sense of whether business activity is absorbing the shock or beginning to wobble. The 2-year Treasury auction lands the same day, followed by the 5-year on Wednesday and the 7-year on Thursday. Friday brings the final University of Michigan sentiment reading and an updated look at inflation expectations.
If the auctions come in weak and inflation-expectations data stay firm, the 10-year could move toward the mid-4% range quickly. That environment would keep Bitcoin under pressure even if oil pauses. Under that scenario, BTC would likely remain inside the market’s liquidity bucket as investors reprice higher-for-longer conditions.
A different path is also possible. If auctions clear well, PMIs soften enough to cap the long end, and inflation expectations cool, yields could stabilize even without a dramatic collapse in crude. That would offer a more constructive opening for Bitcoin.
Markets could begin shifting away from immediate concern over sticky inflation and toward a broader view in which the growth hit from the shock eventually outweighs the energy spike itself.
That is the point where Bitcoin’s hard-asset appeal can start to re-enter the conversation more forcefully.
Bitcoin market structure still looks intact
Spot prices have pulled back from recent highs, yet institutional demand has continued to show through in pockets of the market. U.S. spot ETF flows for the week ending March 20 were still net positive overall (+$93 million), even though the final sessions weakened.
Futures basis also remained positive. That combination suggests a market that is still engaged and still highly sensitive to macro conditions, rather than one facing broad internal collapse.
Which brings the focus back to bonds.
Bitcoin’s next move may depend less on the next jump in crude and more on whether the bond market decides the inflation shock is temporary or persistent. Oil created the initial shock. Treasuries are shaping how tight financial conditions become, and Japan is increasingly reinforcing that repricing instead of easing it.
Bitcoin now faces a three-part macro test this week.
- Can oil stabilize quickly enough to keep inflation fears from building further.
- Can Treasury auctions prevent another sharp move higher in the long end.
- Can Japan avoid turning a U.S. bond selloff into a broader global duration squeeze.
If those pressures keep building, Bitcoin is likely to stay under strain and trade like a high-beta macro asset. If those pressures begin to ease, even partially, BTC has room to recover as markets start separating immediate war-driven stress from the wider monetary path ahead.
The current setup therefore runs deeper than crude alone. Oil started the fire, bonds are determining how far it spreads, and Japan is adding evidence that the repricing in sovereign debt is global.
Until the rate market settles, Bitcoin remains caught in the middle.
[Update 11:23 GMT: Rates nearing 4.5% have coincided with President Trump issuing a statement declaring “THE UNITED STATES OF AMERICA, AND THE COUNTRY OF IRAN, HAVE HAD, OVER THE LAST TWO DAYS, VERY GOOD AND PRODUCTIVE CONVERSATIONS REGARDING A COMPLETE AND TOTAL RESOLUTION OF OUR HOSTILITIES IN THE MIDDLE EAST.” Bitcoin jumped 4.5% immediately.]
The post Bitcoin focus shifts from oil to bonds as US and Japan 10-year yields spike into a critical week appeared first on CryptoSlate.
The crypto industry finally got the clear lines it spent years demanding from Washington.
Six days after the SEC and CFTC unveiled their new crypto framework, the policy is now moving into the formal publication process through the Federal Register, giving the market a clearer sense of what this week's regulatory reset actually is and what it still is not.
On Mar. 17, the SEC and CFTC said most crypto assets are not securities, drew a formal taxonomy, and handed staking, airdrops, mining, and wrapped tokens more breathing room than the market has seen in years.
However, the new framework is an interpretive rule that creates no new legal obligations, takes effect without notice-and-comment, and comes with an explicit reservation: the Commission may refine, revise, or expand the interpretation once public comment concludes.
Chair Paul Atkins said the announcement was “a beginning, not an end.” He has also said that only Congress can genuinely future-proof the rulebook. Both things are true simultaneously, and the tension between them is the actual story of this week.
What the agencies actually did
The Mar. 17 release is a genuine break from the era of former chair Gary Gensler.
The SEC formally stated that most crypto assets are not securities, and only tokenized versions of traditional securities fall squarely within the securities bucket.
It also created a five-part taxonomy covering proof-of-work mining, staking, wrapping, covered airdrops, and the treatment of non-security assets that were once offered under investment contracts.
That last point carries real weight: the release states that a non-security crypto asset need not remain tied to an investment contract in perpetuity, and it describes how that separation can occur.
Secondary market trading is one of the most consequential developments in years.
Since the announcement, the framework has started moving into the formal publication process through the Federal Register, while the CFTC has followed with a no-action position for Phantom's self-custodial wallet software and a set of crypto and blockchain FAQs published on Mar. 20. That does not turn interpretation into statute, but it does show the agencies are trying to operationalize the new posture quickly.
The CFTC joined the release and said it would administer the Commodity Exchange Act in a manner consistent with the SEC's interpretation.
The two agencies signed a new MOU on Mar. 11 and created a Joint Harmonization Initiative. On paper, Washington's two main financial regulators are more aligned on crypto than at any point in the asset class's history.
The release also formally supersedes the SEC staff's 2019 Framework for Investment Contract Analysis of Digital Assets, which the industry has identified as the source of the greatest regulatory ambiguity.
Commission-level interpretation replacing staff guidance is a meaningful upgrade. This is not a speech. It is not a one-off no-action letter. It carries the weight of a Commission acting collectively.
Formal publication and follow-on staff guidance improve visibility and compliance planning, but they do not move the framework onto statutory ground. They make the policy easier to use today, not harder to reverse tomorrow.
Why the win has a ceiling
The durability ladder runs from most permanent to least, and most of this week's relief sits toward the bottom.
At the top is the statute and binding court doctrine. The Howey test still governs investment contract analysis, and the SEC explicitly preserved it.
The GENIUS Act stablecoin lane, enacted Jul. 18, sits on statutory ground. Those parts of this week's picture are genuinely hard for a future Commission to erase.
Below that is the Commission interpretation. Stronger than staff guidance, but the release itself says it is revisable. The taxonomy categories, the staking and airdrop and wrapping interpretations, and the investment-contract-separation concept are all Commission readings of existing law, not a congressional rewrite of it.
Below that is the inter-agency infrastructure. The SEC-CFTC MOU creates no legally binding obligations, and either party may terminate it with 30 days' written notice. Agencies aligned today are a political fact, not a legal one.
At the bottom is the staff relief. The Phantom no-action position and the Mar. 20 FAQs are the easiest layer to unwind. They are useful now but structurally fragile.
The gap between where investors feel relief and where legal permanence actually resides is the core vulnerability of this week's framework.
SEC commissioners serve staggered five-year terms, one ending each Jun. 5, with roughly 18 months of holdover eligibility if a replacement is not confirmed.
The CFTC operates on the same staggered structure. A future administration needs 12 to 24 months to reshape both commissions, but the chair can move faster without a full Commission vote on every decision.
Atkins acknowledged this directly in November 2025, saying there will always be a risk that a future Commission could reverse course. His February testimony to the House Financial Services Committee was sharper: no SEC action can future-proof the rulebook as effectively as market structure legislation.
He repeated the point on Mar. 17, the same day the release landed.
One of the architects of crypto's biggest regulatory win in years spent part of that day publicly explaining why the win is incomplete.
The European contrast
The bull case requires Congress. Senate market structure legislation introduced in January would convert today's interpretive bridge into a statutory framework, defining when tokens are securities or commodities and handing the CFTC spot market authority.
If that bill clears, exchange access, token classification, and the staking and airdrop treatments move from Commission interpretation onto ground that a future chair cannot revise with a memo.
Atkins' own promised safe-harbor-style rulemaking would be a meaningful intermediate step: formal rulemaking builds a thicker administrative record than an interpretive release, making any future rollback procedurally heavier even if not impossible.
The bear case requires only that Congress stay stuck. The Senate stablecoin bill stalled in February, despite recent signs of progress.
If market structure legislation follows the same path, the industry's new clarity rests entirely on the current Commission's willingness to hold the line.
Citi already priced that risk by cutting its 12-month Bitcoin target to $112,000 from $143,000, specifically because US legislation had stalled, with a recessionary bear case at $58,000.
Wall Street is already distinguishing between good guidance and durable law.
The contrast is becoming clearer in another way too. The SEC has also approved Nasdaq rule changes to support tokenized settlement for certain already-regulated securities, reinforcing the idea that Washington is increasingly comfortable with blockchain inside familiar market infrastructure even while much of crypto still rests on revisable interpretation rather than durable statute.
The EU's MiCA regime has been in force since December 2024, with stablecoin rules in place since mid-2024, creating a statutory bloc-wide framework for crypto-asset service providers.
America's core question is still permanence. Crypto won the agencies, but it has not yet won the law.
The post The SEC just gave crypto its clearest win in years, but much of it could still be reversed appeared first on CryptoSlate.
A crypto hack never ends when the wallet is drained. The theft lands first, fast and visible, and then a slower collapse starts to work through the rest of the project.
The token keeps sliding, the treasury shrinks with it, hiring plans get cut back, product deadlines move, partners pull away, and the company that was supposed to recover spends months fighting for credibility instead of building.
That's the picture Immunefi's new “State of Onchain Security 2026” report paints. Its argument is simple enough for any market, crypto or otherwise: the initial loss is only one part of the damage.
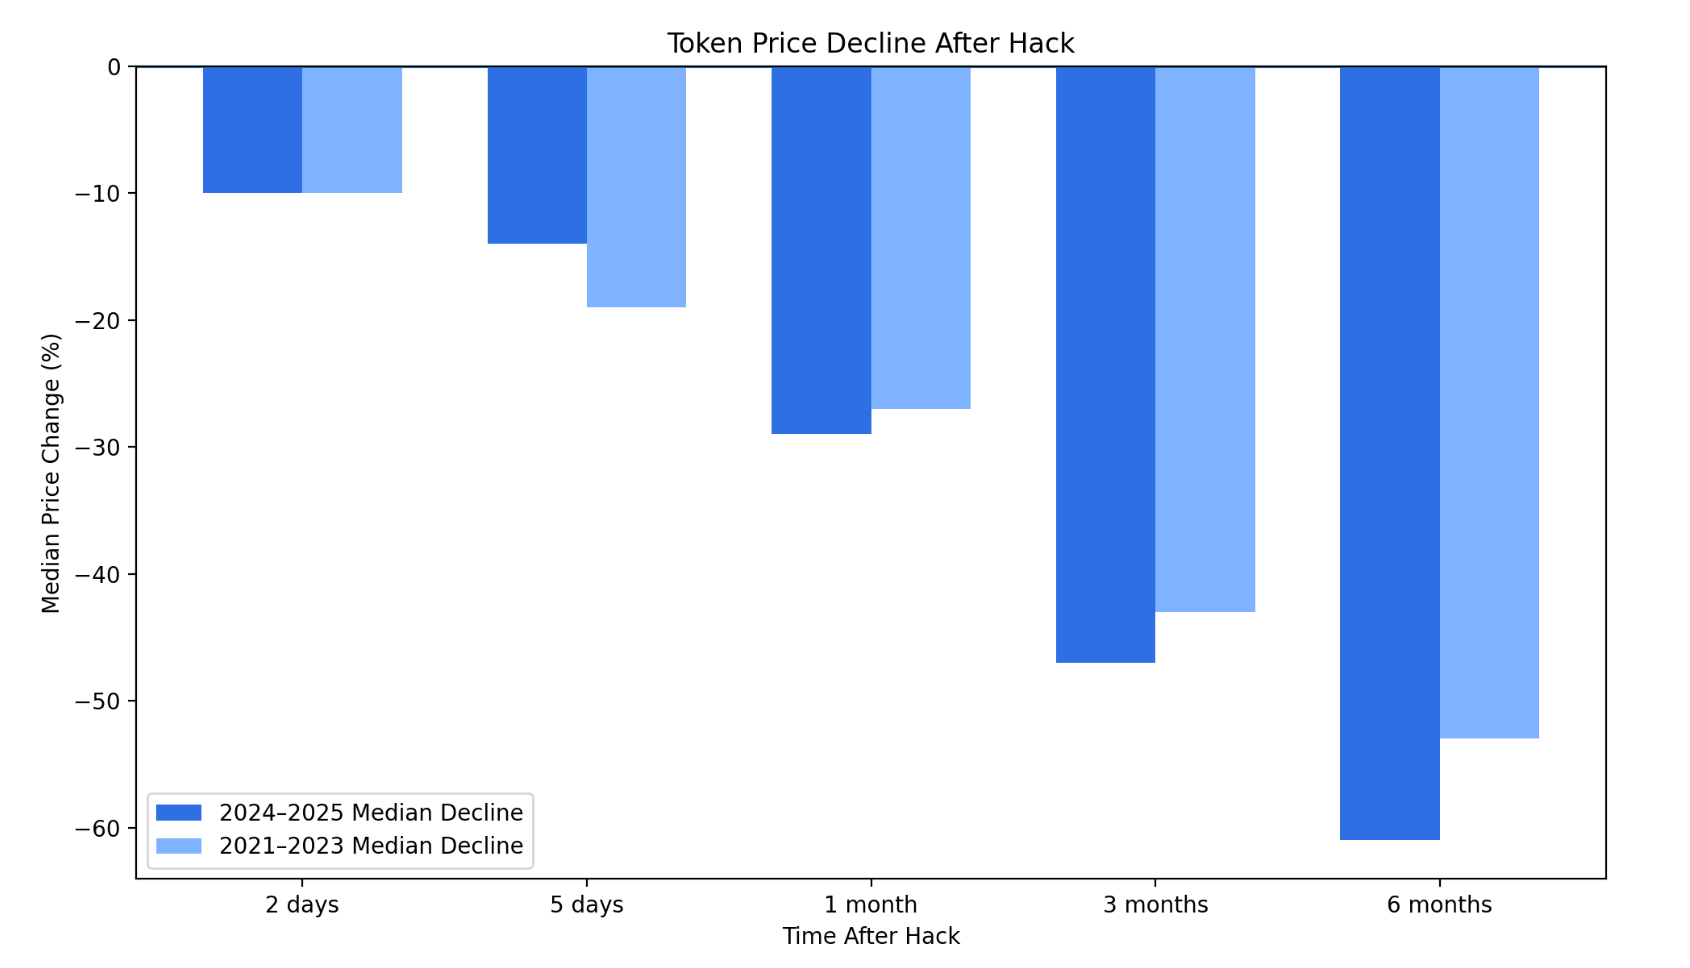
The much bigger problem comes from what the exploit does to a project's future. Immunefi says the average direct theft in its sample came to about $25 million, while hacked tokens saw a median six-month decline of 61%. In that window, 84% failed to recover to their hack-day price, and teams lost at least three months of progress to recovery work.
But those numbers come with caveats. Token prices fall for many reasons, and hacked projects are often fragile before an exploit hits. Some are illiquid, overvalued, or already losing momentum.
Immunefi acknowledged that it can't always fully separate hack damage from broader market weakness or project-specific troubles. Even so, the pattern it lays out deserves attention because it shows that hacks don't behave like isolated thefts anymore, and they now look like long-tail corporate crises.
That's what gives weight to the report: it shows how often the post-hack period keeps inflicting damage well after the headline fades.
The median hack might have gotten smaller, but the worst ones got more dangerous
Immunefi counted 191 hacks across 2024 and 2025, totaling $4.67 billion and bringing its five-year total to 425 hacks and $11.9 billion in losses.
The yearly count barely moved, with 94 known hacks in 2024 and 97 in 2025, almost identical to 2023. That tells us that the market didn't do a very good job of becoming safer. Hacks are now just part of everyday life in crypto, while the giant ones go on to define the year.
The main contradiction laid out in the report is in the averages.
The median theft in 2024-2025 was $2.2 million, down from $4.5 million in 2021-2023. On the surface, that might look like progress. However, the average theft still came to roughly $24.5 million, more than 11 times the median. In the earlier period, that gap was 6.8 times. The top five hacks accounted for 62% of all funds stolen, and the top 10 made up 73%.
This is a very dangerous kind of distribution. It makes the market look and feel safe and stable until one giant event rips through it. So, the typical exploit might be smaller than it used to be, but the danger sits in the tail. That's where a handful of huge failures absorb most of the damage and crash the market in a day.
Just look at Bybit. The exchange's $1.5 billion exploit became the defining hack of 2025 and, in Immunefi's accounting, represented 44% of all funds stolen that year.
It's easy to treat that kind of event as a spectacle. But it reveals a much deeper concentration problem. One failure at one major venue can distort the industry's annual loss profile and expose how much risk still sits in just a couple of critical chokepoints.
The longer decline is where projects start to break
While the report's data on theft is certainly interesting, the most eye-opening part is its price damage section.
In Immunefi's sample of 82 hacked tokens, the initial shock was essentially the same. The median two-day decline was about 10%, roughly in line with the earlier cycle. But the biggest effect was felt later, as the median six-month decline worsened to 61%, up from 53% in the 2021-2023 study.
At the six-month mark, 56.5% of hacked tokens were down more than half, and 14.5% were down more than 90%. Only about 16% traded above their hack-day price six months later.
To understand the full effect of a hack, we need to stop treating token prices as an isolated market feature. For most crypto companies, the token acts as a treasury, financing base, and often a public scorecard. A prolonged drawdown cuts directly into a company's runway, recruiting power, dealmaking leverage, and internal morale.
The report noted that hacked projects often lose security leadership within weeks and spend at least three months in recovery mode. Even if those timelines vary by project, the consequences are plain to see. A company with a damaged token and a damaged brand has fewer ways to buy time.
Plenty of markets can absorb a theft, or a bad quarter, or even a reputational hit. But crypto often compresses all three into the same event. The exploit drains funds, the token reprices the business in public, and counterparties react before the internal cleanup is finished. That's a hard environment in which to recover, especially for teams that were never overcapitalized in the first place.
Dependency risk makes it even worse. Immunefi argues that a more interconnected DeFi stack has created longer chains of vulnerability across bridges, stablecoins, liquid staking, restaking, and lending markets.
That point should be handled carefully, especially when the report uses case studies that deserve outside verification. Still, the broader direction is hard to dismiss. Crypto systems are more layered than they were a few years ago, and that means a hack can travel much farther than the protocol where it started.
Centralized venues still sit near the center of the blast zone.
The report says only 20 of the 191 hacks in 2024-2025 involved centralized exchanges, yet those incidents accounted for $2.55 billion, or 54.6% of all stolen funds.
That pushes the issue beyond just smart-contract bugs and back toward custody, key management, and infrastructure concentration. For a market that often sells decentralization as a cure for fragility, some of the largest losses still emerge from places where trust is concentrated.
But it doesn't mean every hacked project is doomed. The industry has now entered a phase where survival doesn't depend on whether a team can endure a hack, but whether it can endure the six months that come next.
The theft starts the crisis, but the slower damage decides whether the project still has a future once the market moves on.
The post Why crypto hacks don’t end and continue even when the money is gone appeared first on CryptoSlate.
Cryptoticker
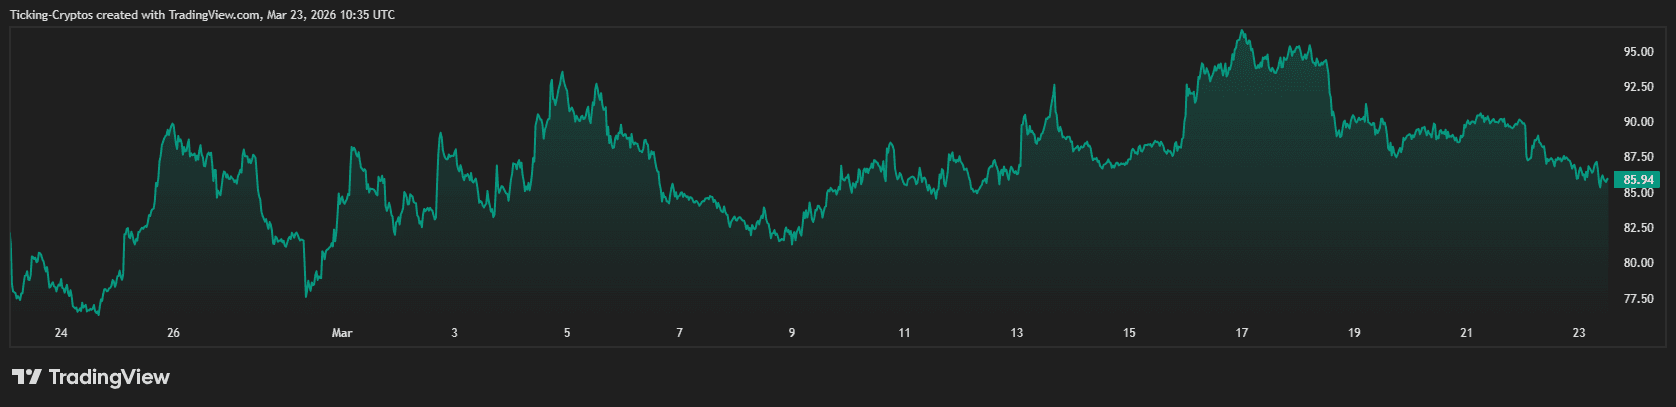
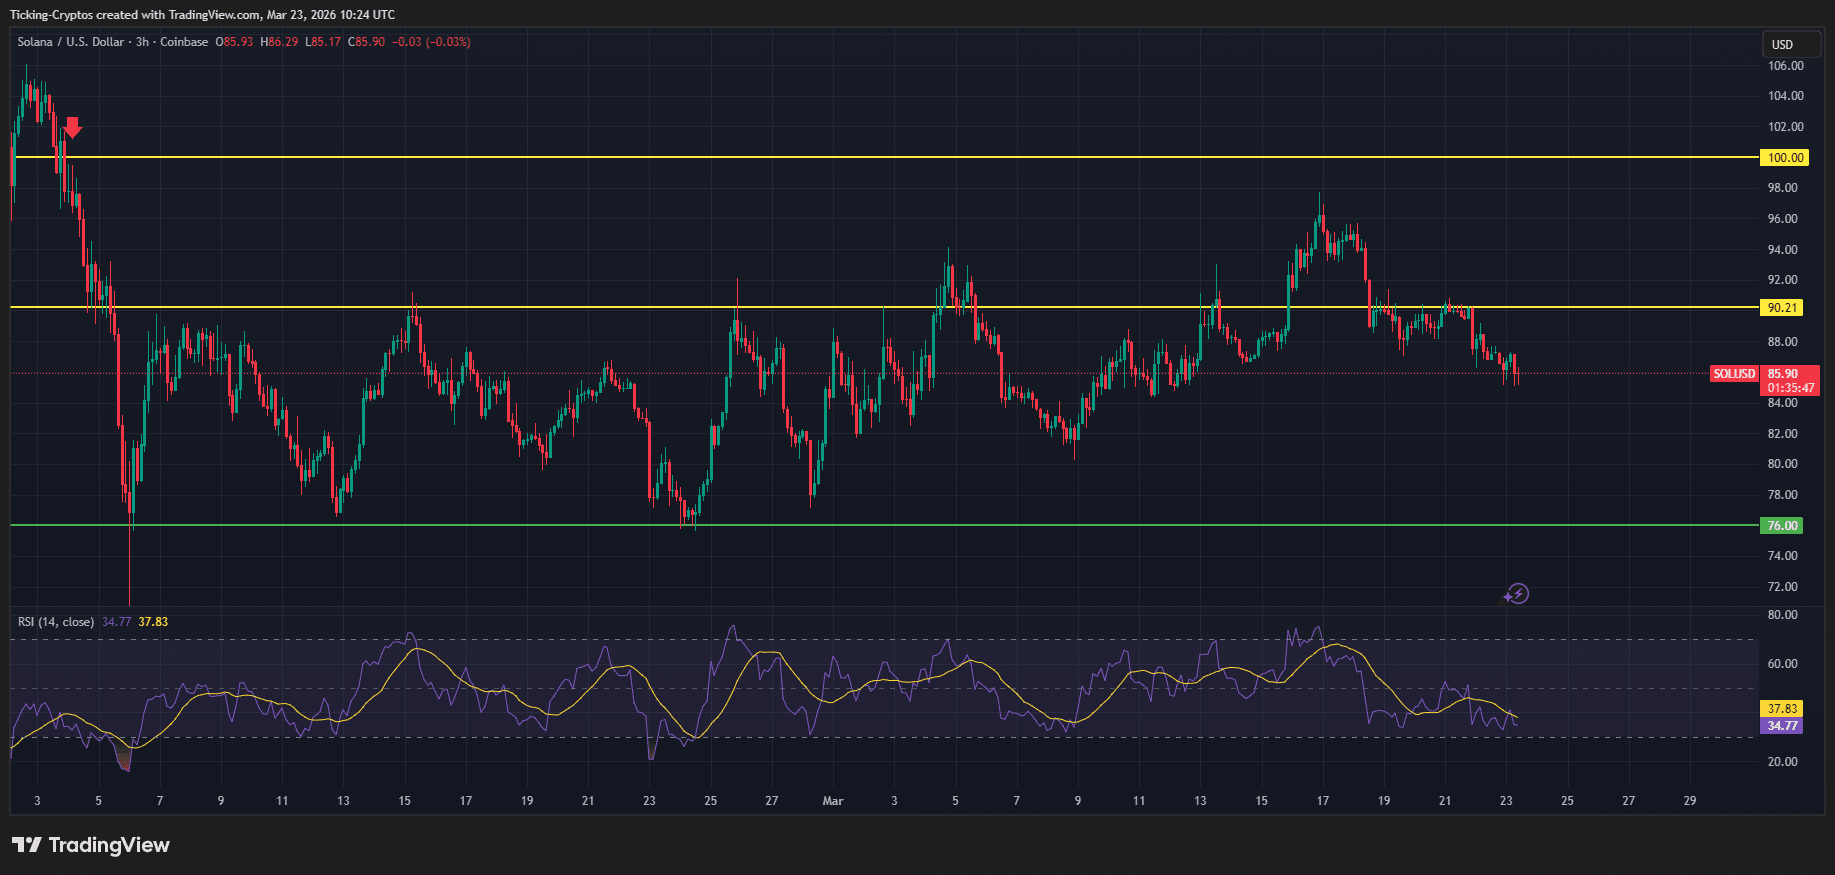
As of March 23, 2026, Solana ($SOL) is positioned at a critical technical juncture. Following a period of intense market-wide volatility triggered by geopolitical shifts in the Middle East and a hawkish "hold" from the Federal Reserve (FOMC), the asset is currently trading between $80 and $90. While the broader market remains cautious, Solana’s internal ecosystem is showing signs of decoupling, driven by massive institutional adoption and the imminent deployment of the Alpenglow consensus upgrade.
Is Solana a Good Buy Now?
Traders looking for a short-term direction should focus on the $92.34 resistance zone. A daily close above this level could catalyze a rally toward $98.65 by the end of March. Conversely, if SOL fails to defend the $86.66 support, a deeper correction toward the $80.00 psychological floor is highly probable.
What Should Driving Solana’s Value in 2026?
In the current 2026 landscape, Solana’s value is increasingly tied to its Network Finality and Institutional Liquidity. Unlike 2024, where retail "meme" activity dominated, the primary drivers now are:
- Spot Solana ETFs: Regulated vehicles providing direct exposure to institutional capital.
- Alpenglow Upgrade: A transition from Tower BFT to a new consensus mechanism aiming for 150ms finality.
- Digital Commodity Status: Confirmed regulatory taxonomy that has stabilized long-term investor sentiment.
Solna Price Analysis: Technical Chart Patterns
Analyzing the current SOL price action, we see a consolidation pattern forming after the mid-March dip.
- Moving Averages: SOL is currently hovering near its 20-day EMA ($88.93). Staying above this level is vital for maintaining a bullish "bias." The 50-day SMA at $87.23 serves as a secondary safety net.
- RSI (Relative Strength Index): At 51.63, the RSI is neutral. This suggests the market is "resetting," providing enough room for a significant move without being immediately overbought.
- MACD Signal: We observe a slight bearish divergence on the daily histogram. This indicates that while the price is stable, buying momentum is currently thinning, requiring a fresh catalyst to break overhead resistance.
Solana Price: Key Support & Resistance
| Level Type | Price (USD) | Significance |
|---|---|---|
| Major Resistance | $117.71 | 2025 structural high; targets if $100 breaks. |
| Short-term Ceiling | $92.34 | Immediate hurdle; upper Bollinger Band target. |
| Pivot Point | $88.52 | Current "Fair Value" and 20-day EMA support. |
| Critical Support | $80.27 | The "Line in the Sand"; break here invalidates the bull case. |
Solana Upgrade: The Alpenglow and Firedancer Effect
The stagnant price action masks a massive technical shift. The Alpenglow upgrade is currently rolling out, which promises to reduce transaction finality from 12 seconds to under 150 milliseconds. This makes Solana faster than many centralized servers, a factor that major financial outlets cite as a reason for the record $1.45 billion in cumulative ETF inflows. Institutional players like Goldman Sachs and Electric Capital now hold significant SOL exposure via these ETFs, creating a "floor" of demand that was absent in previous cycles.
Will Solana Price go up? March 2026 Outlook
For the final week of March, the following three factors will dictate SOL's path:
- ETF Inflow Consistency: If net inflows exceed $20M daily, expect a test of $95.
- Geopolitical De-escalation: A reduction in energy-related inflation fears will allow capital to rotate back into "high-beta" assets like Solana.
- Bitcoin Stability: Solana's correlation with $Bitcoin remains high (0.84); a $BTC push past $72k would likely drag SOL above $100.
The XRP price is showing notable resilience despite ongoing volatility across the crypto market. While many altcoins struggle to maintain support levels, XRP is holding steady, suggesting that underlying demand remains strong.
As macro uncertainty continues to impact markets, traders are now asking: Is XRP preparing for its next breakout?
XRP price stabilizes near key levels
Currently, the XRP price is trading around the $1.38–$1.42 range, holding above an important short-term support zone.
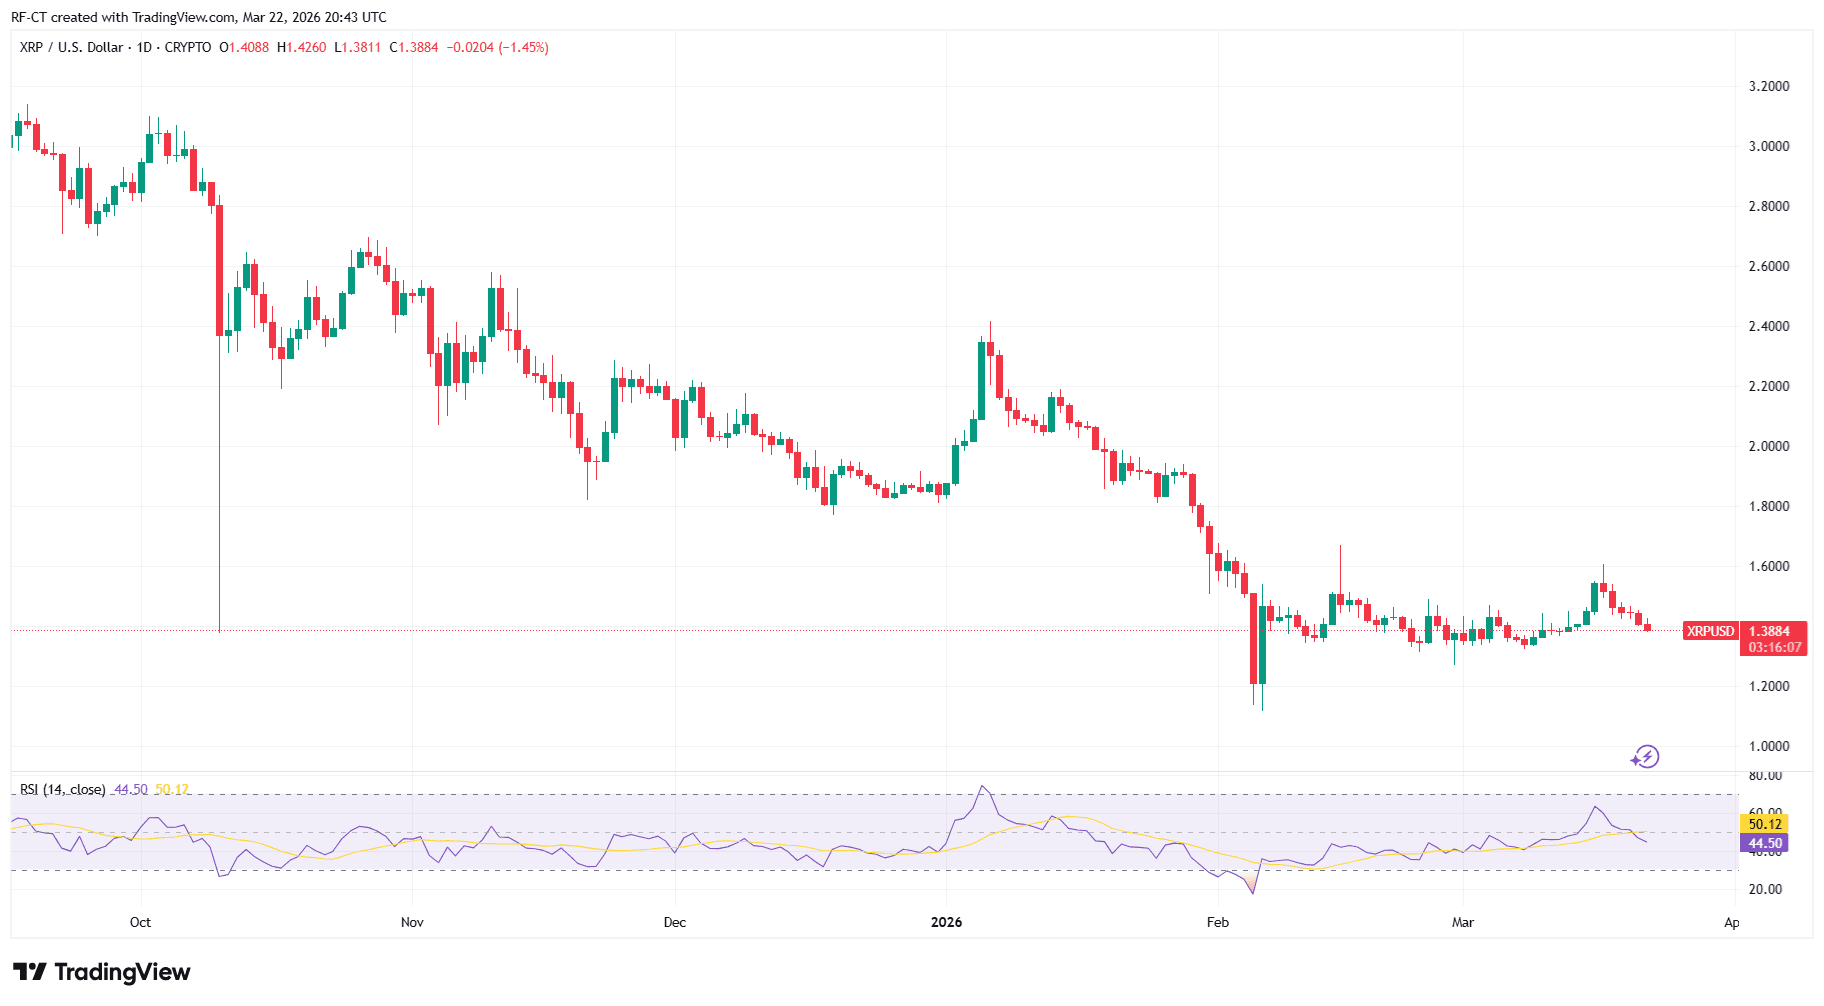
This level has acted as a strong base in recent sessions, preventing further downside despite broader market pressure driven by macro news and geopolitical tensions.
Holding this zone is critical. If XRP maintains this support, it could build momentum for the next move higher.
Why XRP price is showing strength
Unlike many altcoins, XRP benefits from a unique narrative:
- Ongoing institutional interest
- Strong positioning in cross-border payments
- Continued relevance in regulatory discussions
This combination helps XRP remain relatively stable even when market sentiment shifts.
Additionally, XRP often reacts later than Bitcoin, meaning delayed but stronger moves can follow periods of consolidation.
Key levels to watch next
For the XRP price, traders should closely monitor:
- Support: $1.35 – $1.38
- Resistance: $1.45 – $1.50
👉 A break above $1.50 could trigger a stronger bullish move
👉 A drop below $1.35 may lead to a deeper correction
Right now, XRP is sitting at a decision point.
Conclusion — XRP price at a turning point
The XRP price is currently consolidating at a key level, showing resilience while the broader market remains uncertain.
This type of price action often precedes a larger move.
Whether XRP breaks upward or revisits lower levels will largely depend on overall market sentiment — but one thing is clear:
👉 XRP is not weak — it is waiting.
Stablecoins are rapidly moving from niche crypto tools to a central pillar of the global financial system. While much of the market focuses on Bitcoin volatility and geopolitical tensions, a quieter but far more structural shift is taking place.
From regulatory breakthroughs in the United States to global expansion by major payment companies, stablecoins are positioning themselves as the digital version of the dollar — faster, borderless, and increasingly integrated into everyday finance.
This raises a critical question: are stablecoins quietly becoming the new global dollar?
PayPal and Big Tech Are Accelerating Stablecoin Adoption
One of the clearest signals of this shift comes from PayPal, which has expanded its stablecoin services to over 70 countries. This move significantly lowers the barrier for millions of users to access digital dollars without relying on traditional banking systems.
Unlike earlier crypto adoption cycles driven by speculation, this wave is infrastructure-driven. Payment giants are embedding stablecoins directly into financial ecosystems, allowing users to send, receive, and store value globally in seconds.
This is not just innovation — it is a transformation of how money moves.
US Regulation Is Turning Bullish for Stablecoins
At the same time, regulatory clarity is beginning to emerge in the United States. Coordination between agencies like the U.S. Securities and Exchange Commission and the Commodity Futures Trading Commission is reducing uncertainty that has long slowed crypto adoption.
More importantly, recent discussions between lawmakers and the White House around stablecoin frameworks signal a shift toward integration rather than restriction.
This is a major turning point.
Instead of treating stablecoins as a threat, regulators are increasingly viewing them as an extension of the dollar’s global dominance — but in digital form.
Stablecoins Are Solving Real Global Problems
Stablecoins are gaining traction because they address real-world inefficiencies in traditional finance:
- Cross-border payments remain slow and expensive
- Banking access is limited in many regions
- Currency instability drives demand for dollar-based assets
Stablecoins offer:
- Instant transactions
- Lower fees
- Access to dollar liquidity anywhere in the world
In regions facing inflation or capital controls, stablecoins are already functioning as a practical alternative to local currencies.
A New Financial System Is Emerging
What makes this shift particularly important is its timing.
As geopolitical tensions rise and global trade faces increasing friction, the demand for neutral, digital, and liquid financial tools is growing.
Stablecoins are uniquely positioned at the center of this transformation:
- Backed by fiat currencies
- Integrated into crypto ecosystems
- Increasingly adopted by institutions
This creates a hybrid financial system where traditional and digital finance converge.
Risks and Challenges Still Remain
Despite their rapid growth, stablecoins are not without risks:
- Regulatory fragmentation across countries
- Dependence on underlying reserves
- Centralization concerns
- Potential competition from central bank digital currencies (CBDCs)
However, these challenges are being actively addressed as the market matures and institutions become more involved.
Conclusion — The Rise of the Digital Dollar
Stablecoins are no longer just a crypto niche — they are becoming a core layer of global finance.
With major companies expanding access, regulators moving toward clarity, and real-world demand increasing, stablecoins are quietly evolving into the digital equivalent of the dollar.
This transformation may not be as visible as Bitcoin price swings, but its long-term impact could be far greater.
Bitcoin Price Analysis: The Current Market State
The digital asset market is currently at a critical crossroads as we move through March 2026. After hitting local highs, the $Bitcoin price has retraced to stabilize around the $68,500 – $69,500 zone. While some retail investors view this sideways movement as a sign of weakness, professional traders recognize it as a high-probability "coiling" phase. This period of consolidation often precedes a massive directional breakout, offering a unique window for those looking to trade Bitcoin with a structured approach.
Bitcoin Price Prediction: Is $75,000 Next?
Current data suggests that the Bitcoin price prediction for the remainder of Q1 2026 hinges on the $70,000 psychological level. As of March 22, 2026, BTC is trading at approximately $68,625, showing a slight cooling off from the recent rally. For traders, this "easy period" refers to the clear technical boundaries currently in play on the BTC-USD chart, which allow for well-defined risk management and high-reward entries before the next volatility spike.
Defining the Bitcoin Price Action and Volatility
To capitalize on this movement, it is essential to understand the BTC/USD price action. Price action refers to the movement of a security's price plotted over time. In the current context, we are observing a "Bull Flag" on the daily chart. Trading this successfully involves identifying support (where buying pressure starts) and resistance (where selling pressure begins).
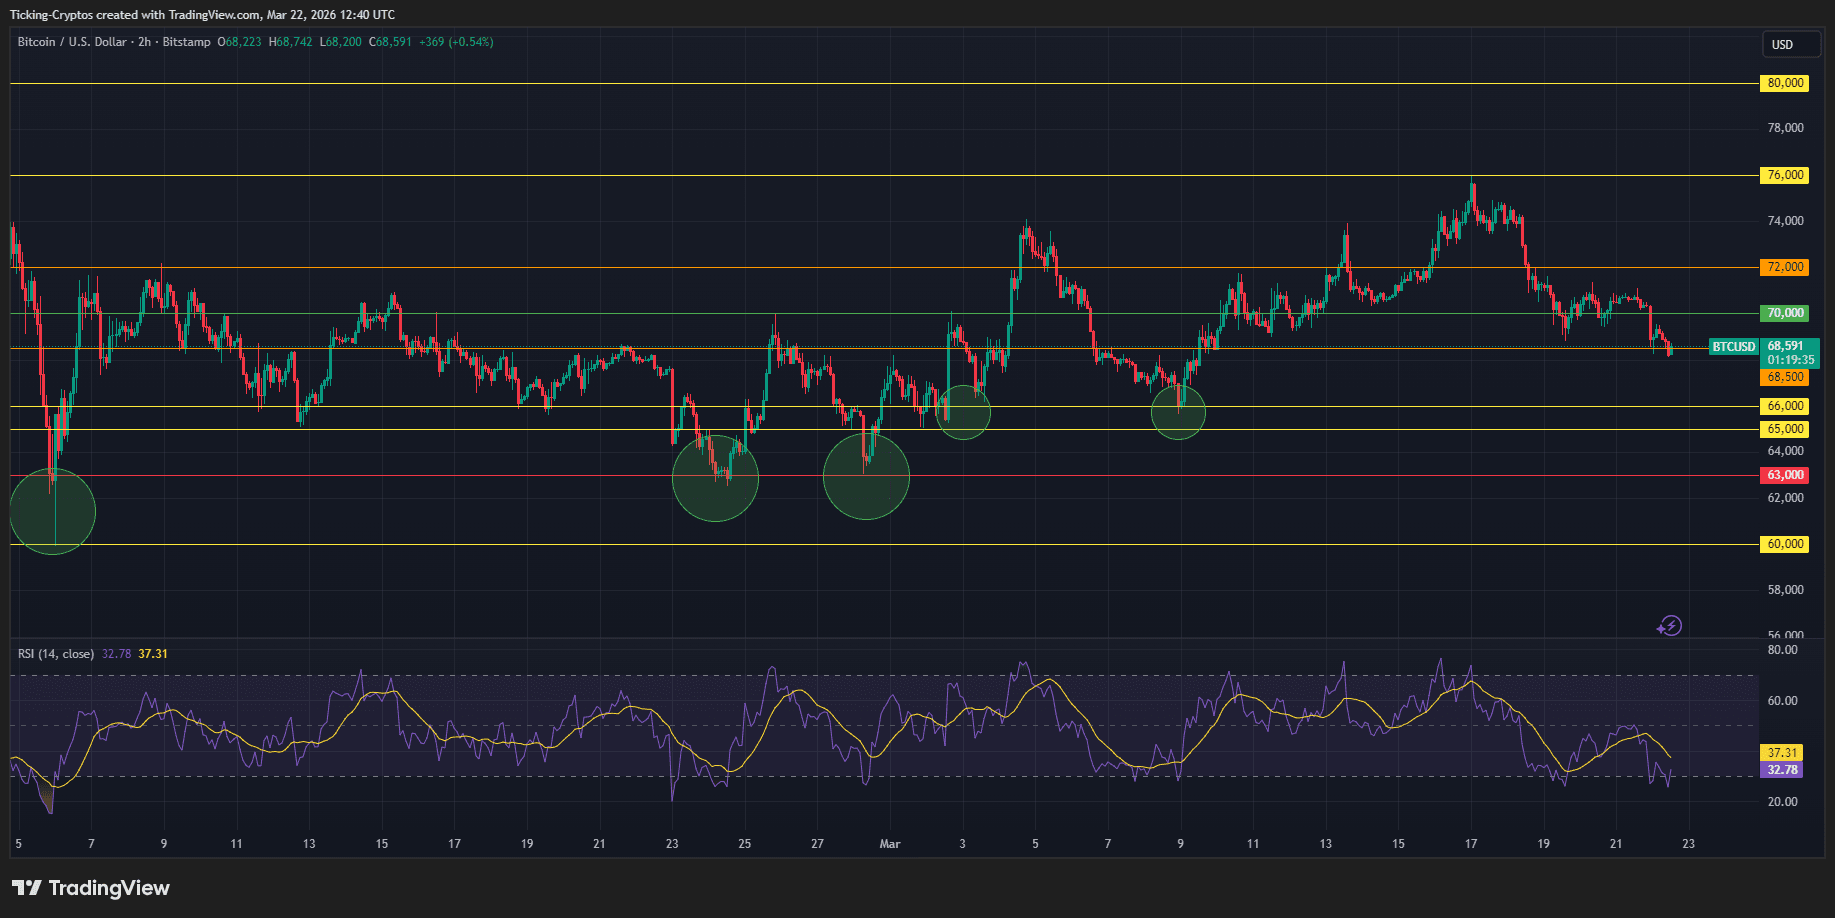
Technical Breakdown: Key Levels for the Bitcoin Price
Looking at the current market structure, we can see a distinct pattern emerging. After the "flash crash" of late 2025, the market spent months finding a floor.
The Technical Setup
- Support Zone: $65,000 - $68,000. This area has been defended vigorously by institutional "whales."
- Resistance Zone: $72,000 - $76,000. This is the ceiling that must be cracked for a move toward $100k.
- Correlation Factors: BTC currently shows an increasing correlation with the S&P 500. According to data from Bloomberg, this often precedes a period of heightened volatility in the Bitcoin price.
Pro Strategy to Trade Bitcoin During Consolidation
During this period, the most effective way to make money is not by guessing the direction, but by reacting to the levels. Here is a professional strategy to trade Bitcoin right now:
- The Range Play: Buy near the $67,500 support with a tight stop-loss at $66,000. Target the upper resistance at $72,000.
- The Breakout Entry: Set a "Buy Stop" order at $72,500. If the Bitcoin price breaks this level with high volume, it confirms a bullish reversal.
- The Hedge: Use hardware wallets for long-term holdings while keeping only trading capital on top-tier exchanges.
Fundamental Catalysts Driving the Bitcoin Price
While the charts look technical, fundamentals are driving the sentiment. The Federal Reserve’s stance in 2026 has kept "risk-on" assets under pressure. However, the increasing adoption of BTC as a reserve asset provides a long-term regulatory tailwind. This "flight to quality" is why the Bitcoin price is outperforming the broader market.
Bitcoin Price Metrics
| Indicator | Status | Trading Action |
|---|---|---|
| RSI (14) | 52 (Neutral) | Wait for divergence |
| Fear & Greed | 26 (Fear) | Contrarian Buy Opportunity |
| Moving Average | Trending Up | Maintain Long Bias |
| Institutional Flow | Positive | Accumulate on Dips |
- Summary for Traders: The current Bitcoin price prediction suggests we are in a "calm before the storm" phase. By utilizing a disciplined strategy to trade Bitcoin and keeping a close eye on the $70,000 pivot point, traders can position themselves for the next leg of the bull cycle.
The cryptocurrency market experienced a significant "risk-off" event over the past few days, triggered by escalating geopolitical tensions in the Middle East. Following statements from U.S. President Donald Trump suggesting an extension of military operations and potential strikes on Iranian oil infrastructure, investors have fled volatile assets. This shift has led to a noticeable correction across major digital assets, as seen in the latest market data.
Crypto Crash Reason: Trump and Wars
When global stability is threatened, speculative markets like cryptocurrencies often react with high volatility. The recent announcement that the U.S. might target Iranian oil facilities—specifically strategic hubs like Kharg Island—sent oil prices toward $120 per barrel, creating fears of a global inflationary shock.
Historically, while Bitcoin has been labeled "digital gold," it often trades in correlation with high-growth tech stocks during the initial phase of a geopolitical crisis. The current crash reflects a liquidity squeeze as traders move to safer havens like the U.S. Dollar and physical gold.
Crypto Price Analysis: Top 10 Performance
Based on recent exchange data, the market is overwhelmingly "in the red," with YTD (Year-to-Date) performances showing significant double-digit losses for the first time this quarter.
| Asset | Current Price | 24h Change | YTD Change | Market Cap |
|---|---|---|---|---|
| Bitcoin (BTC) | $68,303.42 | -3.25% | -21.95% | $1.36 Trillion |
| Ethereum (ETH) | $2,068.43 | -4.07% | -30.29% | $249 Billion |
| Solana (SOL) | $87.16 | -3.06% | -29.98% | $49.8 Billion |
| Hyperliquid (HYPE) | $37.93 | -4.91% | +49.18% | $9.7 Billion |
Bitcoin (BTC) Performance
The Bitcoin price has struggled to maintain the $70,000 psychological support level. Dropping 3.25% in 24 hours, $BTC is now down over 21% YTD. This suggests that even institutional inflows through ETFs are currently being outweighed by macro-driven sell pressure.
Ethereum and Altcoins
Ethereum ($ETH) has taken a harder hit than Bitcoin, sliding 4.07% today and sitting at a staggering -30.29% YTD. Other major players like Solana ($SOL) and $BNB follow a similar pattern, losing roughly 3-5% of their value as the market anticipates further military escalation.
Impact of Energy Prices on the Industry
The threat to hitting Iranian oil targets doesn't just affect investor sentiment; it has a direct impact on the crypto mining industry. Rising energy costs can make mining less profitable, potentially leading to a lower "hashprice" and increased selling pressure from miners who need to cover operational costs. According to reports from Bloomberg, the closure of the Strait of Hormuz remains the biggest tail risk for global energy markets in 2026.
Decrypt
BitMine Immersion Technologies now holds more than $10 billion worth of Ethereum, leading the ETH treasury pack as the asset rebounds.
Strategy shared plans to issue $44 billion in equity, a move aimed at providing its Bitcoin-buying machine with fuel for future purchases.
Crypto ETFs shed $177M last week as Bitcoin pulled back from $75,000, though experts remain bullish on Q2's prospects.
Crypto is soaring on a major development in the Iran war, while A Senate deal could finally unlock the Clarity Act.
The price move came after Donald Trump touted "productive conversations" regarding a cessation of hostilities in the Middle East.
U.Today - IT, AI and Fintech Daily News for You Today
Binance Coin has gained a serious advantage over XRP's placement at the market's top, but a recovery is still possible.
US investors via Kraken are buying Dogecoin, a move that comes as the DOGE price dropped below $0.09.
Shiba Inu kickstarts the new week with massive SHIB burn activity, seeing the token record a rapid surge in its burn rate over the past day.
This morning in crypto: XRP targets $2 on diplomatic shifts, Bitfinex whales load up on SHIB and experts explain the Bitcoin Cash quantum advantage.
XRP sees positivity on the futures market with volumes rising, but there is still more to be watched for price action.
Blockonomi
Key Highlights
- On March 23, 2026, GMEX Robotics announced an AU$4.2 million contract with an Australian hospitality operator
- The agreement includes deployment of a minimum of 50 intelligent kitchen robots, featuring Bon Vivant 3.0 and Max units
- This represents GMEX’s inaugural commercial restaurant contract following its December 2025 cooking robotics platform debut
- Installation sites include premium dining establishments and key airport food service locations throughout Australia
- Shares climbed more than 24% following the announcement, despite a 99% decline year-over-year
GMEX Robotics (GMEX) announced its inaugural commercial restaurant agreement on Monday, triggering a significant rally in its share price. The company secured an AU$4.2 million contract with an Australian hospitality and food service operator that has not been publicly identified.
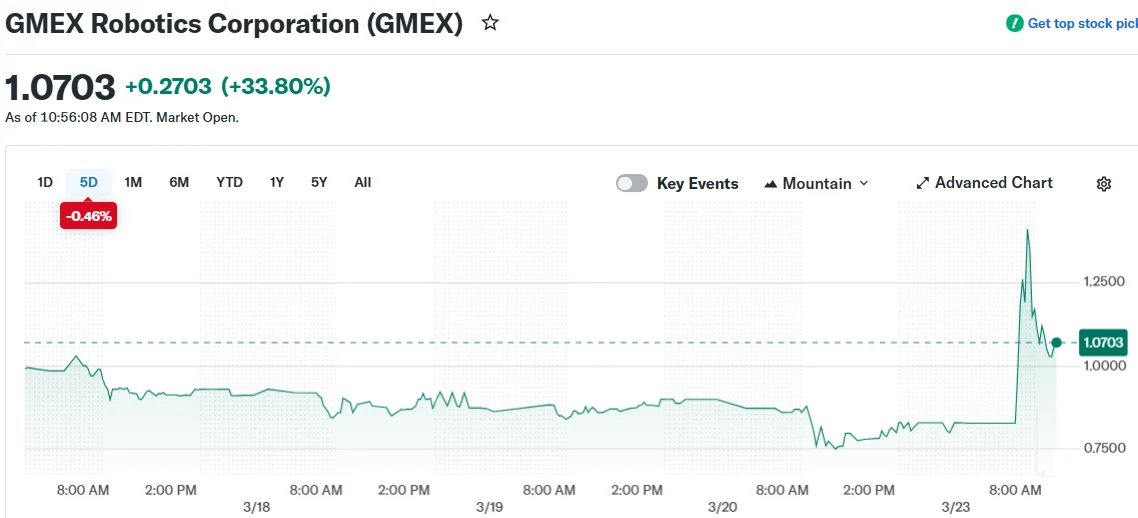
The partnership calls for the delivery of no fewer than 50 Smart Digital Intelligence All-in-One Kitchen Robots. The client manages numerous dining facilities and food outlets, with several strategically positioned within Australia’s busiest airport terminals.
The technology being installed includes the company’s Bon Vivant 3.0 and Max robot series. These advanced platforms incorporate built-in sensors, artificial intelligence command systems, and customizable cooking sequences to handle culinary tasks autonomously.
According to GMEX CEO Sam Lu, this contract represents “an important milestone” for the company’s efforts to bring its culinary robotics technology to market. Lu emphasized that these systems aim to help restaurant and hospitality businesses reduce manual labor requirements while maintaining uniform food preparation standards.
Prior to Monday’s announcement, shares were changing hands at approximately $0.83 each. This valuation represents a devastating 99% drop from where the stock traded one year ago.
Milestone Contract Following Corporate Transformation
The Australian deal represents the company’s first restaurant customer since unveiling its automated cooking technology platform in December 2025. GMEX Robotics Corporation officially adopted its current name and began trading under the “GMEX” ticker symbol on the Nasdaq Capital Market as of March 12, 2026, following its transition from Fitell Corporation.
The company’s previous business model centered on e-commerce sales of fitness and exercise equipment. It has since undergone a strategic transformation, focusing its operations on artificial intelligence-driven robotic technologies targeting commercial kitchens, consumer applications, and industrial uses.
The robotics division, operating as 2F Robotics Pty Ltd, recently brought on Jack Zeng as Head of Technology. Zeng brings experience in data analytics and intelligent automation systems to his new role.
Financial Pressures Persist Despite Contract Win
While the contract announcement provided a boost to investor sentiment, GMEX’s underlying financial condition remains challenging. The company generated $5.2 million in revenue over the trailing twelve-month period and continues to operate at a loss.
With a market capitalization of merely $1.17 million, GMEX qualifies as a micro-cap stock by standard definitions. The company recently executed share consolidations that became effective January 8, 2026—implementing a 1-for-8 reverse split for Class A shares and a 1-for-2 consolidation for Class B shares.
Additionally, GMEX completed a corporate redomiciliation, shifting its legal jurisdiction from the Cayman Islands to the British Virgin Islands following shareholder approval in December 2025.
Shares of GMEX Robotics climbed more than 24% during Monday’s trading session in response to the contract disclosure.
The post GMEX Robotics (GMEX) Shares Surge 24% on AU$4.2M AI Kitchen Robot Contract appeared first on Blockonomi.
Key Highlights
- MSTR stock advances 1.98% to $138.34 following STRC program update
- Total capital raise capacity through STRC expands to $21 billion
- Company has secured over $2.22 billion with $1.98 billion remaining
- Annual dividend rate on preferred shares escalates to 11.50% by March 2026
- Flexible issuance framework enables strategic capital deployment
Strategy Inc (MSTR) stock advanced to $138.34, posting a 1.98% gain during the trading session after experiencing early price fluctuations. The upward movement came after the company announced a significant expansion of its capital raising capabilities through preferred stock instruments. The firm detailed a comprehensive framework to generate up to $21 billion via its STRC initiative.
Strategy Inc, MSTR
Capital Program Extension Enhances Financial Flexibility
Strategy announced an amended sales agreement with several financial partners, enabling the issuance of additional Variable Rate Series A Perpetual Stretch Preferred Stock. This enhancement brings the aggregate offering capacity to $21 billion, representing a substantial increase in the company’s capital access.
The expansion integrates seamlessly with the organization’s existing financial architecture and regulatory documentation. Execution will proceed through designated placement agents operating under a comprehensive omnibus framework. This methodology facilitates gradual issuance instead of deploying capital in one massive offering.
Previously, the corporation established a $4.2 billion STRC initiative. To date, it has distributed more than 22 million shares, accumulating proceeds exceeding $2.22 billion. Approximately $1.98 billion in issuance capacity remains unutilized from the prior authorization.
Preferred Share Terms and Dividend Structure
The STRC stock features a guaranteed liquidation preference set at $100 per share. This baseline valuation is protected from downward modification according to program specifications. Nevertheless, the corporation maintains authority to modify certain other financial parameters associated with the security.
These preferred instruments accrue cumulative dividends on a monthly basis. Distribution occurs at each month’s conclusion, contingent upon board authorization and sufficient capital availability. This framework guarantees ongoing accumulation regardless of temporary payment suspensions.
The initial annual dividend rate was established at 9.00% during mid-2025. Through subsequent periodic increases, the rate has climbed to 11.50% as of March 2026. Management retains flexibility to modify this percentage within predetermined parameters.
Investor Response and Trading Dynamics
MSTR stock demonstrated solid performance despite intraday volatility. The share price settled at $138.34, representing a 1.98 percent appreciation. This price action indicates a constructive market interpretation of the expanded capital framework.
STRC stock maintained trading levels near its liquidation foundation, with recent sessions closing at $99.55. The valuation reflects conformity with its predetermined yield characteristics and priority status. Trading continues on the Nasdaq Global Select Market platform.
The broadened issuance capability pushes total outstanding STRC shares above the 50 million threshold. Future issuances will maintain identical contractual provisions and voting privileges upon distribution. This standardized approach ensures uniformity across the entire preferred equity class.
Strategy maintains its commitment to structured equity financing as a cornerstone of financial management. The incremental issuance methodology enables measured capital accumulation across extended timeframes. Consequently, the enterprise fortifies its financial position while maintaining strategic operational flexibility.
The post Strategy Inc (MSTR) Stock Gains 1.98% Following $21B Preferred Stock Program Expansion appeared first on Blockonomi.
Key Takeaways
- Urban-gro (UGRO) shares jumped more than 60% during premarket and early Monday session trading.
- The trigger: Innovative Production Group (IPG) finalized an all-stock combination with Flash Sports & Media, introducing T20 cricket league rights to the UGRO ticker.
- IPG’s asset base features the Lanka Premier League alongside T20 competitions in Malaysia and Zimbabwe.
- The merged company intends to push into Bangladesh and UAE markets, focusing on developing cricket territories.
- Before Monday’s session, UGRO shares had fallen approximately 85% during the previous 12-month period and were hovering near 52-week lows.
Urban-gro (UGRO) experienced the kind of Monday session most equities rarely see. The micro-cap ticker skyrocketed more than 60% following confirmation that Innovative Production Group FZ, LLC (IPG) finalized its all-stock combination with Flash Sports & Media, Inc.
urban-gro, Inc., UGRO
The transaction introduces an entire suite of T20 cricket league rights into a Nasdaq-listed public framework for the first time ever. IPG’s commercial rights package — anchored by the Lanka Premier League (LPL) — now operates within a publicly governed, capital-supported structure.
$UGRO < $3 – URBAN-GRO INC
IPG to Expand T20 Cricket Footprint Across Sri Lanka, Malaysia and Zimbabwe
— John Zidar aka/ Stock Wizard (@JohnZidar) March 23, 2026
Breaking Down the Transaction
The combination integrates IPG’s league administration, media monetization capabilities, and commercial operations into the UGRO public platform. Flash Sports & Media CEO Bradley Nattrass stated the transaction “accelerates our ability to execute across multiple cricket economies simultaneously.”
CFO Eric Sherb emphasized that the public-market framework “enables phased capital deployment into league infrastructure while maintaining strict ROI discipline.”
In addition to the LPL, IPG controls exclusive commercial and media rights for T20 competitions in Malaysia and Zimbabwe. These rights now consolidate under a single publicly traded entity.
The newly combined organization has set its sights on geographic expansion, identifying Bangladesh and the United Arab Emirates as priority markets. The strategic roadmap includes centralizing sponsorship revenue streams, elevating broadcast production to 4K quality, and establishing recurring revenue channels across South Asia and additional emerging cricket markets.
UGRO’s Position Heading Into Monday
Perspective is crucial here. UGRO had been struggling significantly leading up to this week’s action. The ticker had dropped approximately 85% during the preceding 12-month period and was trading near its 52-week floor before Monday’s explosive rally.
Shares had been hovering below the $3.00 threshold for multiple weeks and had previously been unable to sustain gains following attempted rallies. That track record initially prompted questions about whether Monday’s movement possessed genuine continuation potential.
From a technical analysis perspective, UGRO was trading 22.7% above its 20-day simple moving average prior to the catalyst materializing, though it remained 16.3% beneath its 50-day SMA. The RSI registered at 34.35, indicating neutral territory, while the MACD demonstrated a bullish crossover with the signal line.
Critical resistance levels sit at $3.50. Primary support rests at $2.50.
Early premarket commentary around the price movement initially characterized it as a potential overnight revaluation lacking a definitive catalyst — this assessment came before the merger announcement gained widespread distribution. The initial surge was attributed to speculative trading in a low-liquidity micro-cap name.
UGRO commenced Monday’s premarket session at $2.17 and climbed as high as $3.75, representing approximately a 72% increase from Friday’s closing price, according to Benzinga Pro data.
The post Urban-gro (UGRO) Stock Rockets Over 60% After Flash Sports Cricket Merger Completion appeared first on Blockonomi.
Quick Summary
- Urban-gro (UGRO) shares climbed more than 60% during premarket and morning trading on Monday.
- The driver: Innovative Production Group (IPG) finalized an all-stock merger with Flash Sports & Media, bringing exclusive T20 cricket league rights to a publicly traded company.
- IPG holds rights to the Lanka Premier League along with T20 competitions in Malaysia and Zimbabwe.
- The merged company intends to pursue expansion opportunities in Bangladesh and the United Arab Emirates, focusing on growing cricket markets.
- Before Monday’s rally, UGRO had plunged approximately 85% over the previous year and was hovering near 52-week low territory.
Urban-gro (UGRO) experienced the kind of Monday session that most equities rarely see. The micro-cap company rocketed more than 60% higher following reports that Innovative Production Group FZ, LLC (IPG) finalized its all-stock combination with Flash Sports & Media, Inc.
urban-gro, Inc., UGRO
The transaction marks the first time a portfolio of T20 cricket league rights has entered a Nasdaq-listed public company framework. IPG’s commercial rights holdings — anchored by the Lanka Premier League (LPL) — are now housed within a publicly regulated, capital-supported structure.
$UGRO < $3 – URBAN-GRO INC
— John Zidar aka/ Stock Wizard (@JohnZidar) March 23, 2026
Breaking Down the Transaction
The combination integrates IPG’s league administration, media revenue generation, and commercial activities into the UGRO public platform. Flash Sports & Media CEO Bradley Nattrass stated the transaction “accelerates our ability to execute across multiple cricket economies simultaneously.”
CFO Eric Sherb noted that the public-market framework “enables phased capital deployment into league infrastructure while maintaining strict ROI discipline.”
In addition to the LPL, IPG possesses exclusive commercial and broadcasting rights for T20 leagues operating in Malaysia and Zimbabwe. These assets now operate under a single publicly listed entity.
The newly combined organization has identified expansion opportunities, specifically naming Bangladesh and the United Arab Emirates as priority markets. Strategic objectives include consolidating sponsorship revenue streams, enhancing broadcast production capabilities to 4K standards, and establishing sustainable revenue models throughout South Asia and additional emerging cricket territories.
UGRO’s Position Prior to the Rally
The backdrop is significant. UGRO had endured a challenging period leading up to this trading week. Shares had tumbled approximately 85% during the preceding 12 months and were positioned near their 52-week floor before Monday’s explosive movement.
The equity had traded beneath the $3.00 threshold for multiple weeks and had consistently failed to sustain momentum following earlier breakout attempts. This track record initially sparked questions regarding whether Monday’s advance possessed genuine staying power.
From a technical perspective, UGRO was positioned 22.7% above its 20-day simple moving average prior to the catalyst announcement, yet remained 16.3% beneath its 50-day SMA. The RSI registered at 34.35, indicating neutral momentum, while the MACD displayed a bullish crossover with its signal line.
Critical resistance is located at the $3.50 level. Primary support exists at $2.50.
Early observations of the premarket surge initially characterized it as a potential overnight revaluation without a clear fundamental trigger — this assessment preceded widespread distribution of the merger announcement. The initial movement was attributed to speculative trading activity in a thinly-traded micro-cap security.
UGRO commenced Monday’s premarket session at $2.17 and reached an intraday peak of $3.75, representing approximately 72% appreciation from Friday’s closing price, per Benzinga Pro data.
The post Urban-gro (UGRO) Stock Rockets 60% Following Cricket Media Rights Acquisition appeared first on Blockonomi.
Key Takeaways
- AMC Entertainment recorded its strongest opening weekend performance of 2026 with Project Hail Mary
- Weekend box office admissions surged over 70% compared to the corresponding period in 2025
- The Ryan Gosling sci-fi thriller earned more than $140M in its global debut, setting an Amazon MGM record
- IMAX presentations worldwide contributed $28M to the opening weekend haul
- AMC’s CEO Adam Aron projects 2026 to become the strongest moviegoing year since pre-pandemic 2019
The Ryan Gosling-fronted science fiction epic Project Hail Mary delivered exceptional box office results for AMC Entertainment over the weekend — with the theater chain releasing impressive performance metrics to prove it.
On Monday, AMC disclosed that the film achieved the company’s most substantial opening weekend performance in 2026 thus far. Worldwide ticket revenue for the period exceeded the comparable weekend in 2025 by more than 70%.
The weekend also secured the position as AMC’s second-most lucrative period of 2026 in terms of admissions revenue, both domestically and across its international footprint, which includes ODEON Cinemas properties.
Industry sources indicate the film captured over $140 million in worldwide ticket sales during its opening frame. This performance establishes it as the most successful theatrical launch in Amazon MGM’s history.
AMC Entertainment Holdings, Inc., AMC
Shares of AMC were changing hands around $0.98, hovering near the stock’s 52-week low point, representing approximately a 68% decline over the trailing twelve months. The exhibition company maintains substantial debt obligations and reported negative earnings per share of -$1.34 for the last year.
Revenue Distribution Analysis
Premium IMAX presentations across global markets generated $28 million of the film’s total opening weekend gross. The theatrical release had already accumulated $11 million through Thursday evening preview showings, according to industry publication Deadline.
“PROJECT HAIL MARY is a terrific example of how original storytelling combined with expert marketing of the theatrical experience can resonate with audiences,” said AMC Chairman and CEO Adam Aron.
Aron further indicated that the film’s box office strength, when viewed alongside broader year-to-date industry performance, reinforces the company’s forecast that 2026 will represent the most robust year for theatrical attendance since 2019.
Current Financial Performance
AMC maintains operations across approximately 855 cinema locations featuring 9,640 screens worldwide. The exhibition chain provides enhanced viewing experiences through premium technologies including IMAX at AMC, Dolby Cinema, RealD 3D, and PRIME at AMC.
In the company’s latest quarterly earnings report, AMC delivered an adjusted loss per share of -$0.18, outperforming Wall Street projections of -$0.25. Total revenue reached $1.29 billion, surpassing analyst consensus estimates of $1.27 billion.
AMC recently inaugurated four new premium format theaters through its collaboration with CJ 4DPLEX. The expansion includes two SCREENX installations in Los Angeles and Las Vegas markets, plus two 4DX theaters in Houston and Kansas City.
Regarding capital structure, AMC arranged a $425 million credit line with Deutsche Bank aimed at refinancing outstanding obligations associated with its Odeon Finco PLC subsidiary.
The theater operator additionally modified terms governing its 2029 Senior Secured Notes, revising collateral provisions with select bondholders.
AMC shares were quoted at $0.98 during Monday’s morning trading session, positioned near the stock’s yearly bottom.
The post AMC Entertainment (AMC) Stock Surges as Project Hail Mary Smashes Box Office Records appeared first on Blockonomi.
CryptoPotato
XRP has been in a sustained downtrend since its July 2025 peak, losing ground against both the dollar and Bitcoin over the past eight months. With the price still trapped below key moving averages and inside a descending channel, the broader structure remains bearish heading into the final stretch of Q1 2026.
Ripple Price Analysis: The USDT Pair
XRP is trading around $1.42 after bouncing from the February low near $1.20, a level that has held as key horizontal support. The recovery, however, remains shallow. The price is still well beneath the 100-day and 200-day MAs sitting near $1.80 and $2.10, which represent the next major resistance levels to watch.
A sustained close above $1.80 would be the first sign of bullish momentum returning, while a breakdown below $1.20 exposes XRP to a retest of the $1.00 psychological level and even drop much deeper. The RSI has also recovered from deeply oversold territory but is hovering around the midpoint, offering no clear directional conviction just yet.
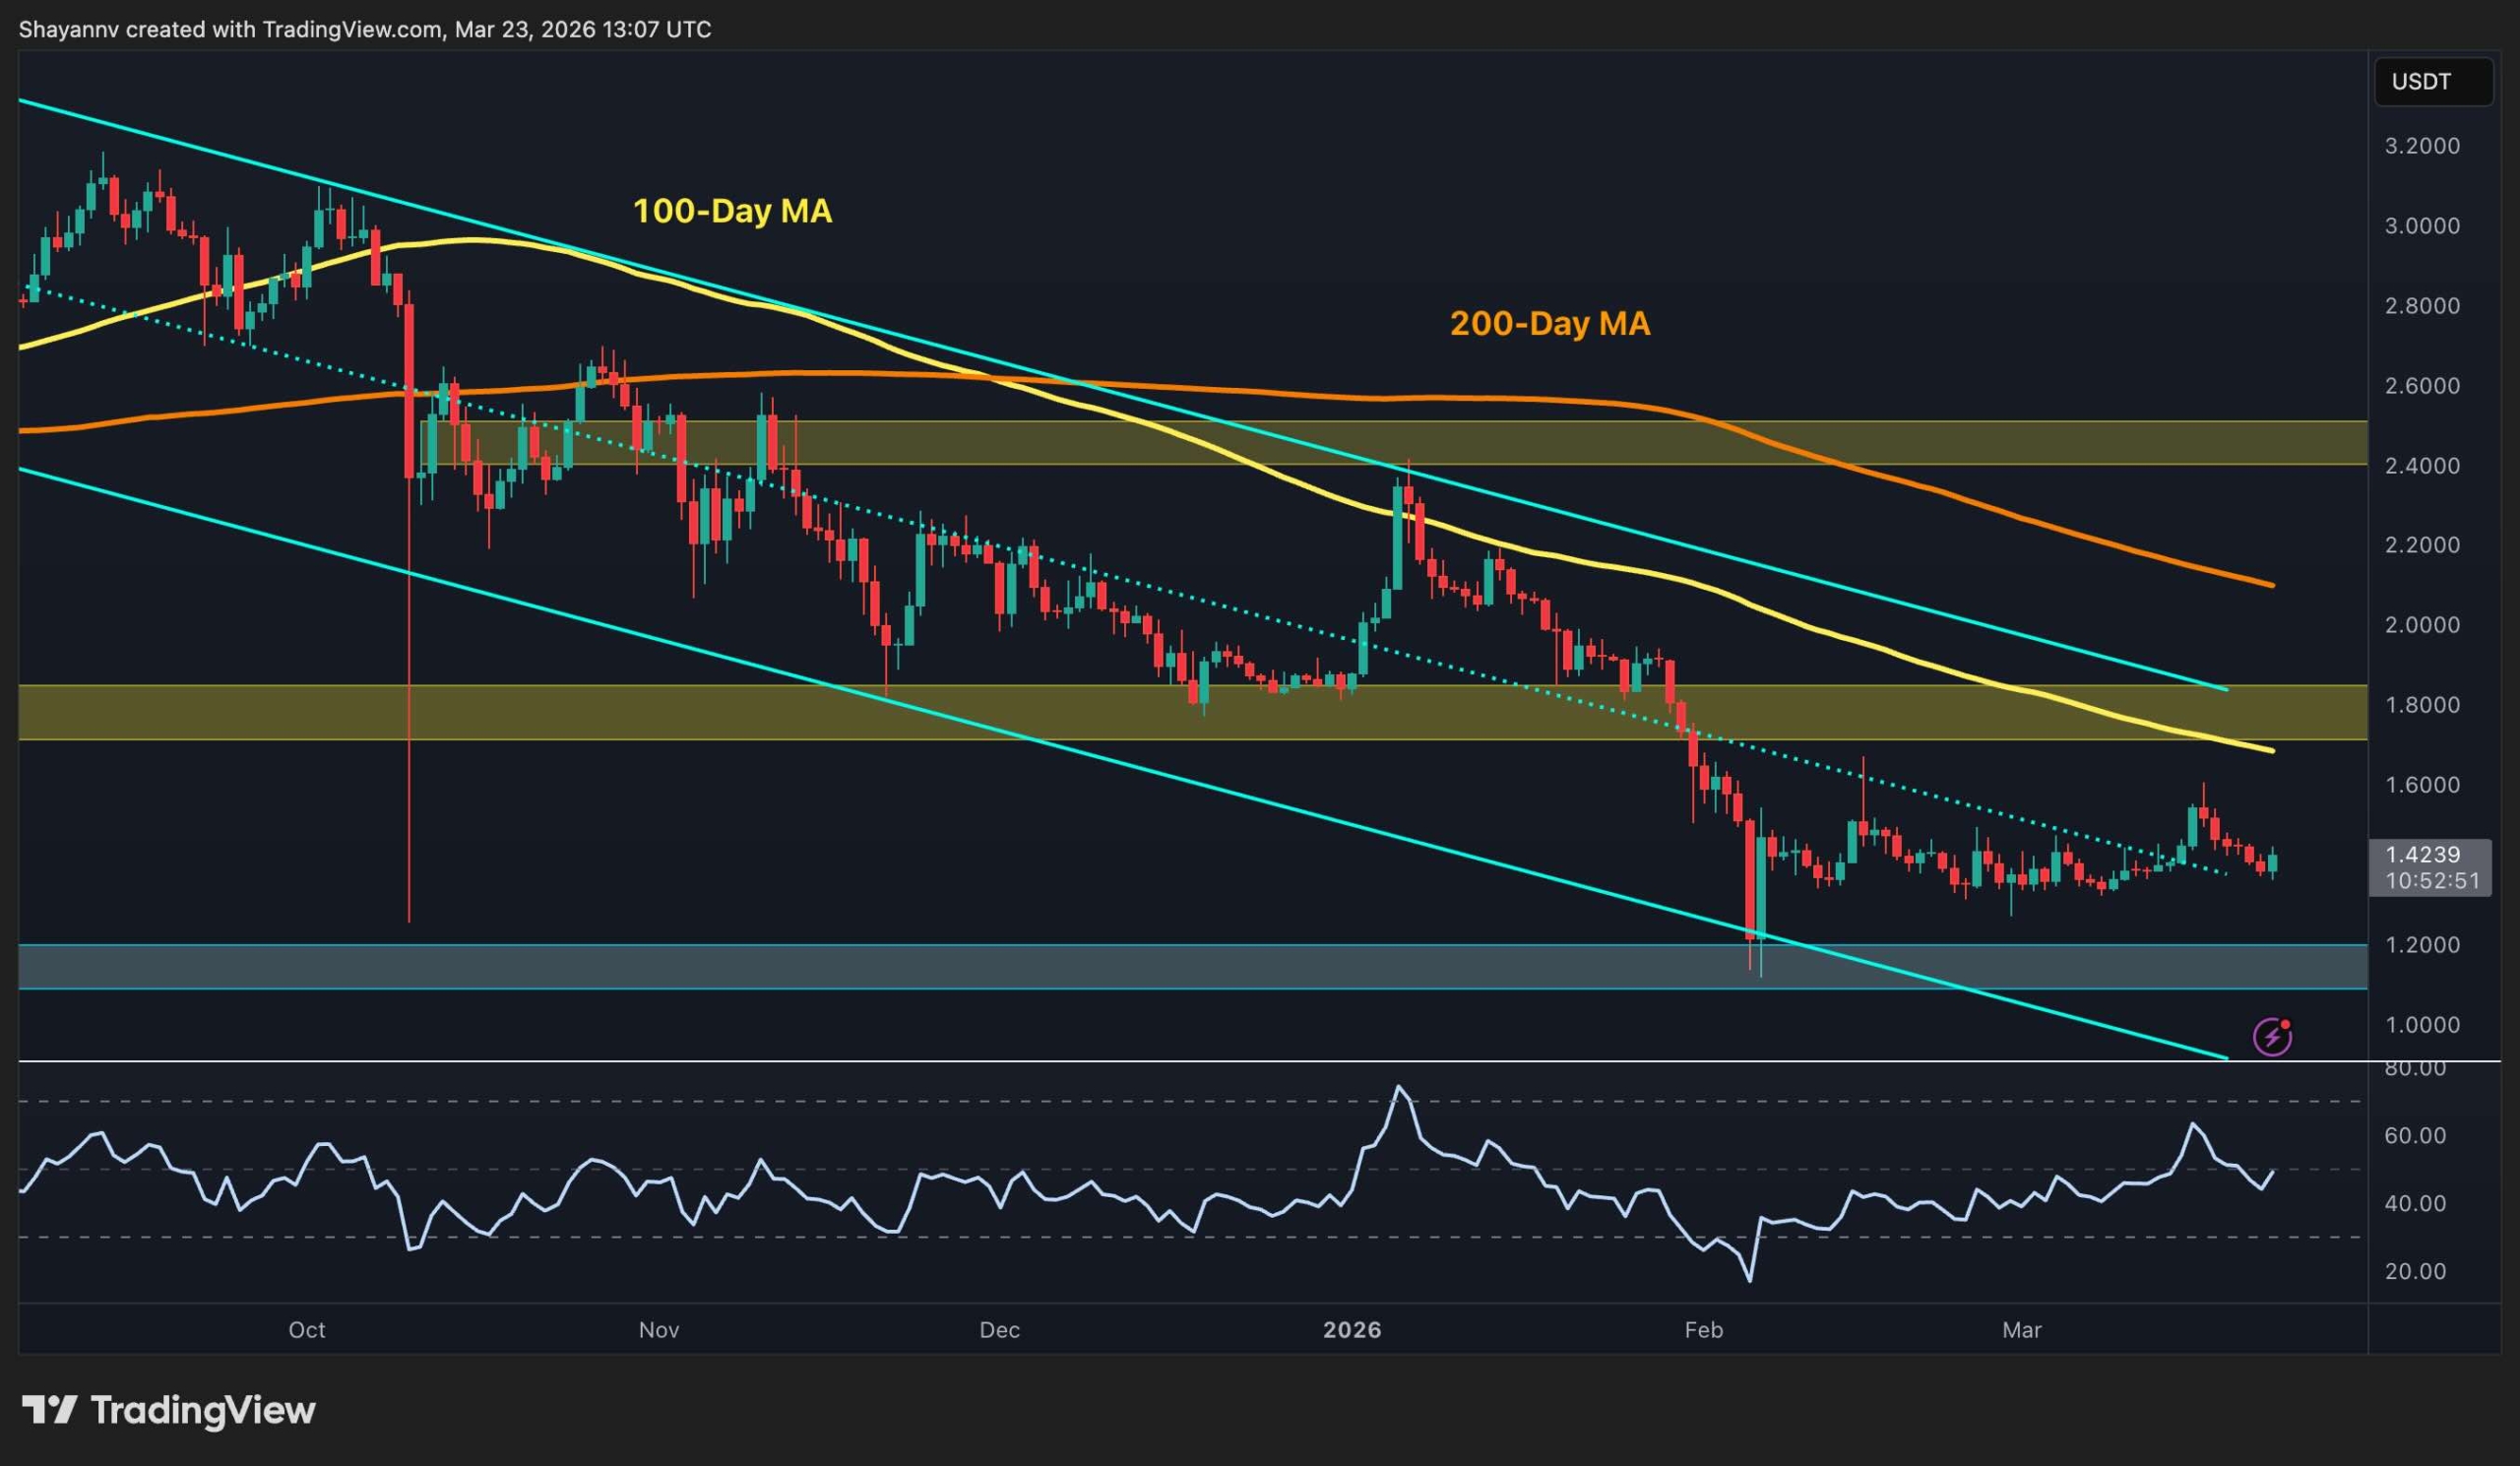
The BTC Pair
XRP/BTC is hovering near 2,020 sats, deep within a months-long descending channel and below both the 100-day (2,100 sats) and 200-day (~2,200 sats) moving averages. The resistance band at 2,500 sats has capped every recovery attempt since October 2025.
The 2,000 sats support zone has held on a closing basis, and the RSI is recovering from its most oversold level of the correction cycle, which is a modest positive sign. But unless XRP breaks above the channel’s upper trendline and reclaims the 100-day and 200-day moving averages, the path of least resistance remains to the downside.

The post Ripple Price Analysis: XRP Recoveries Stay Weak Below This Key Level appeared first on CryptoPotato.
Ethereum is attempting to stabilize after an extended corrective phase. The asset is showing early signs of recovery from the $1.8k demand zone. However, despite the recent bounce, the broader market structure remains under pressure, and the current move appears more like a relief rally than a confirmed trend reversal.
The key challenge for bulls lies in reclaiming higher timeframe resistance levels while maintaining momentum. So far, every push upward has been met with selling pressure, suggesting that market participants are still using rallies as exit liquidity.
Ethereum Price Analysis: The Daily Chart
On the daily timeframe, Ethereum continues to trade within a well-defined bearish structure, printing lower highs and lower lows over the past few months. The price remains below both the 100-day and 200-day moving averages, located around the $2.5k and $3.2k marks, respectively. They are acting as dynamic resistance and reinforcing the overall downtrend bias.
The recent bounce from around $1.8k was technically significant, as this level has historically served as a strong demand zone. The move pushed ETH toward the $2.2k–$2.4k resistance region, which aligns with a previous breakdown area and a key supply zone. However, the price action has stalled here, with multiple rejections indicating that sellers are still firmly in control at higher levels.
A decisive daily close above $2.4k would be the first meaningful sign of strength, potentially shifting market structure and opening the door toward the next major resistance at $2.8k. On the downside, if ETH fails to hold above the psychological $2k level, the market could revisit $1.8k. A breakdown below this support would likely accelerate bearish momentum and expose lower levels, potentially triggering panic selling.
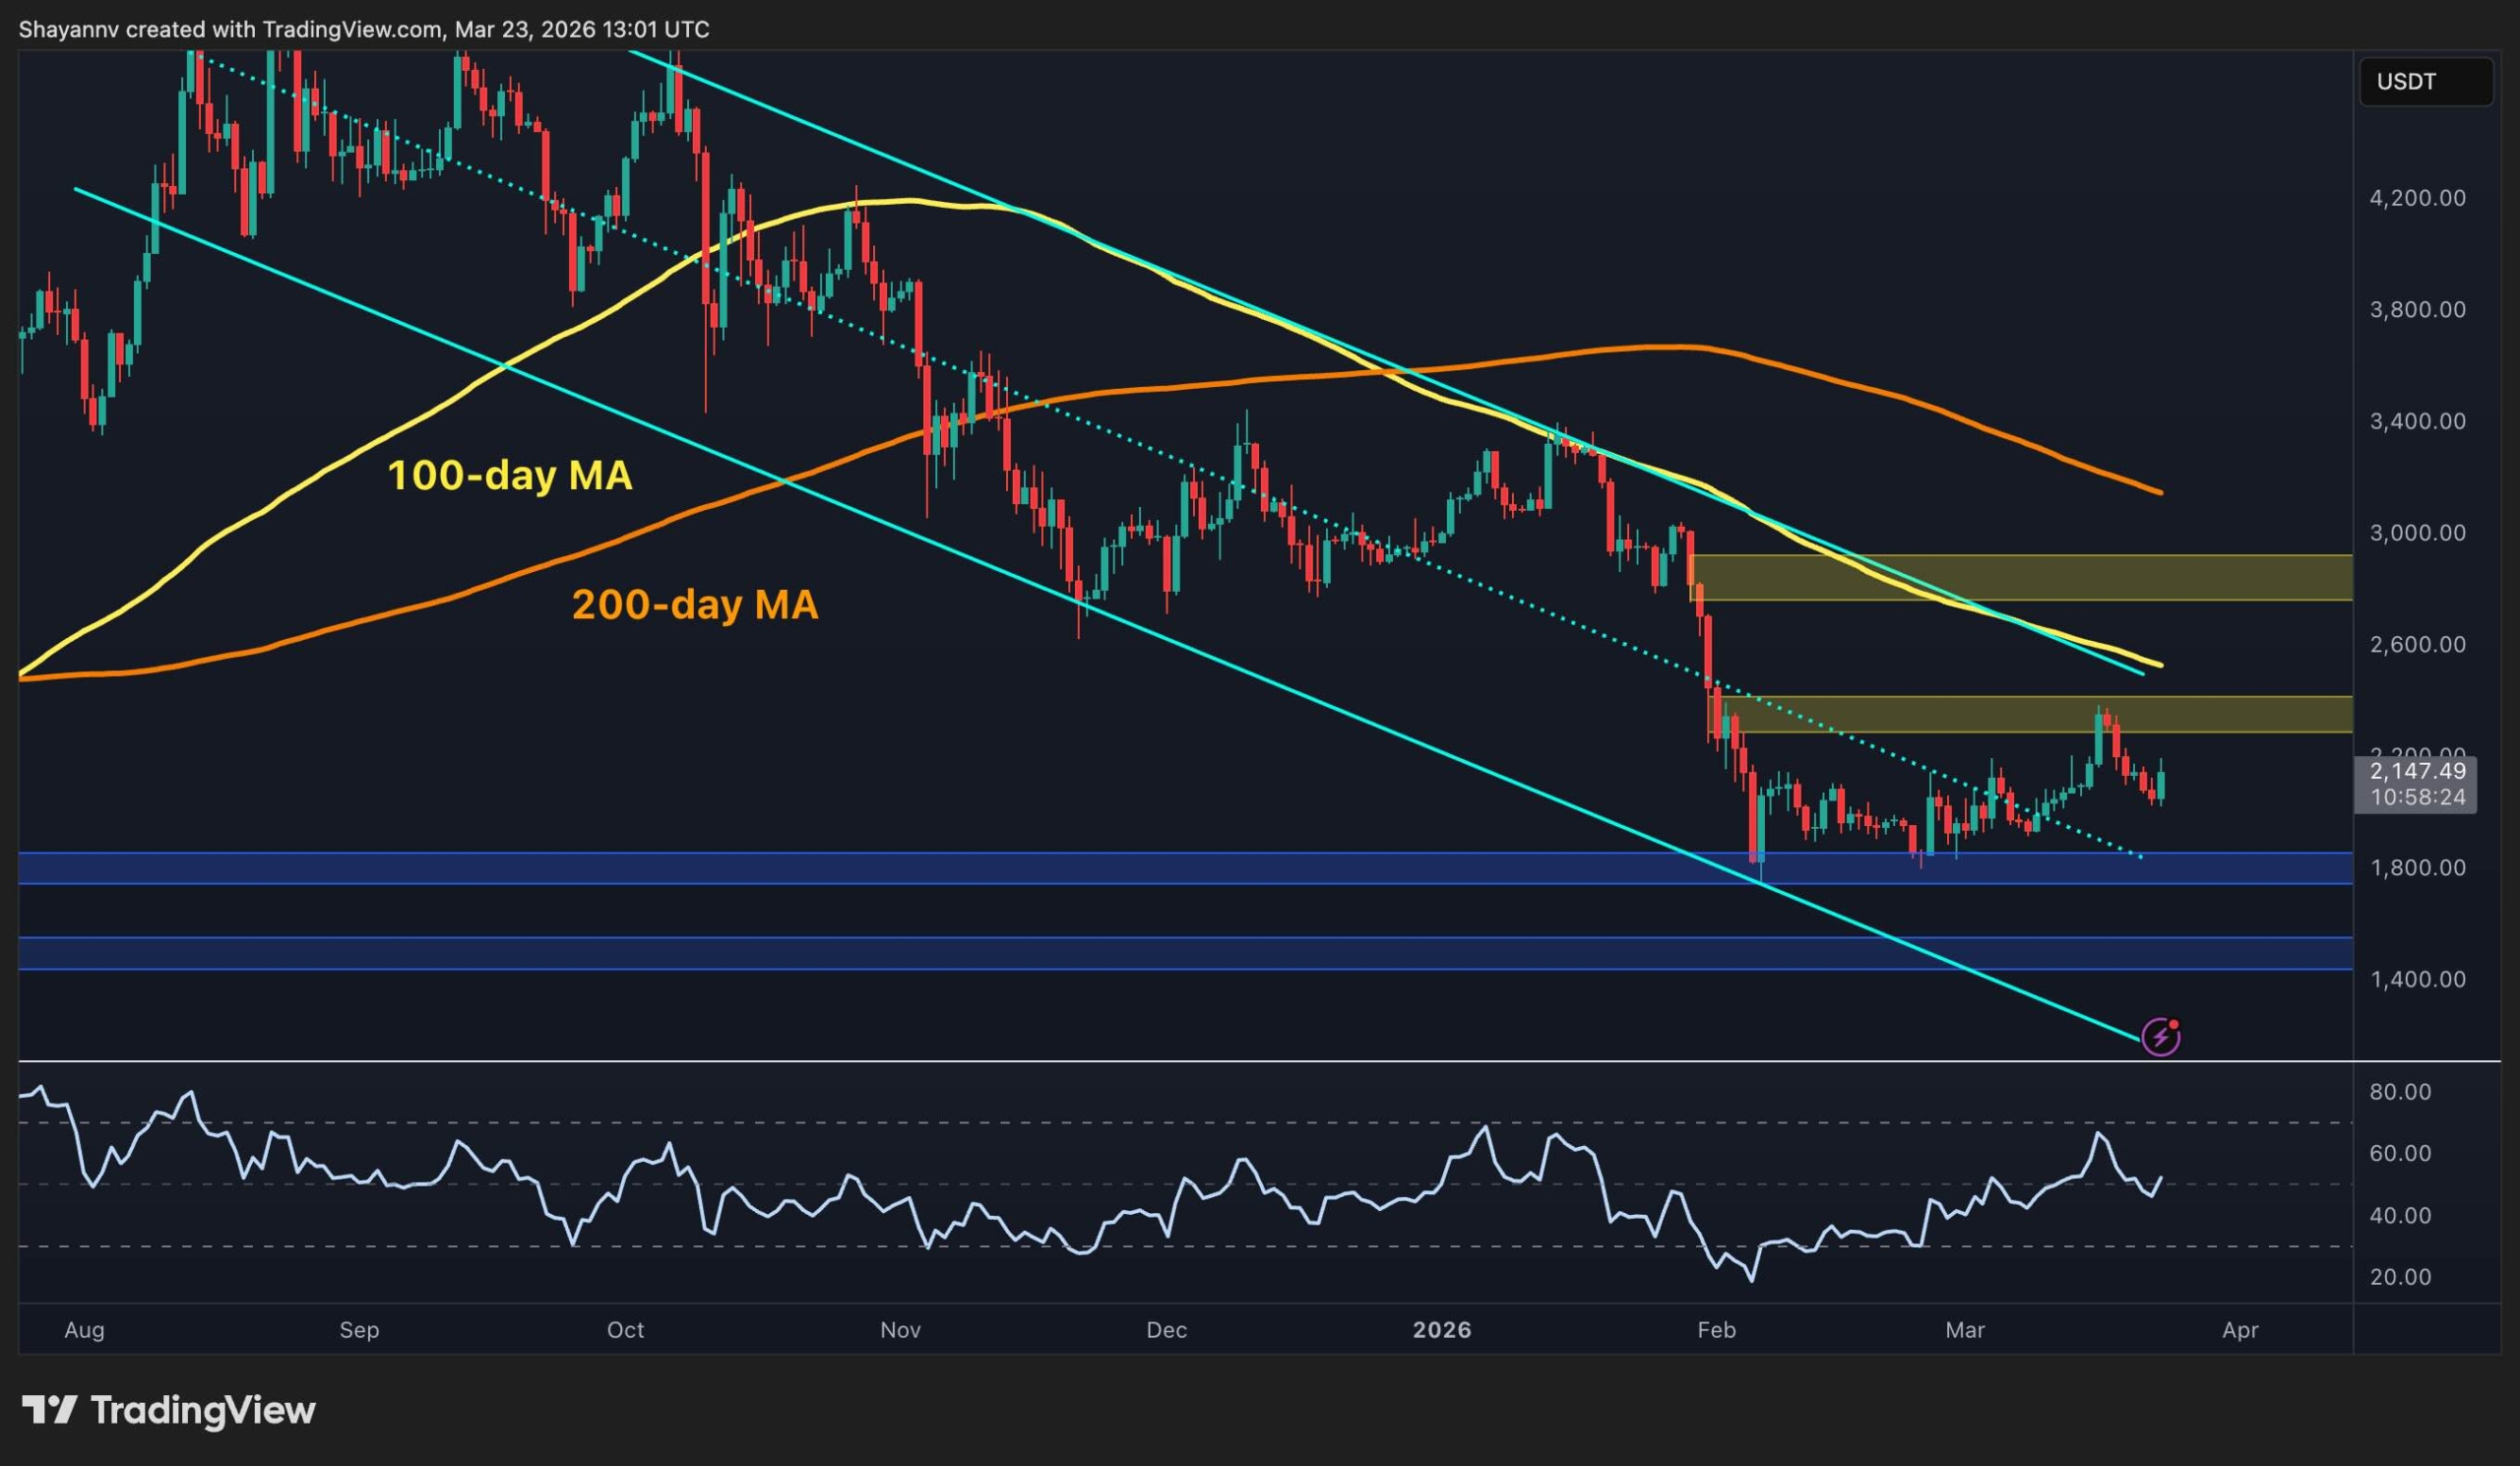
ETH/USDT 4-Hour Chart
Zooming into the 4-hour timeframe, ETH had been forming an ascending channel, which typically signals a controlled bullish retracement within a broader downtrend. This structure was supported by higher lows and relatively steady buying pressure.
However, the recent price action near the $2.3k–$2.4k resistance resulted in a fake breakout, where the asset briefly pushed above the channel resistance and supply zone, only to be quickly rejected. This type of move often traps late buyers and signals exhaustion in bullish momentum.
Following the rejection, ETH dropped back inside the channel and is now trading around $2,150. The loss of momentum is further confirmed by RSI, which showed an overbought signal at the recent highs, indicating that, despite higher prices, buying strength was weakening. Yet, in another interesting development, ETH has jumped significantly from the lower boundary of the channel, indicating that another test of the higher trendline and the $2.4k supply zone could be expected in the coming days.

Sentiment Analysis
From a sentiment perspective, the Taker Buy Sell Ratio has recently shown a noticeable uptick, moving toward and slightly above the neutral 1.0 level after almost 2 years. This indicates that aggressive buyers (market takers) are becoming more active, suggesting a short-term increase in demand.
However, context is crucial. This increase comes after a prolonged period where the ratio remained below 1.0, reflecting dominant selling pressure. In such scenarios, sudden spikes in buying activity during a broader downtrend can sometimes represent short-term relief rallies rather than the beginning of a sustained uptrend.
Additionally, the lack of strong follow-through in price despite rising buy pressure suggests that passive sellers are still absorbing demand. For a more convincing bullish signal, the ratio would need to remain consistently above 1.0 while being accompanied by higher highs in price.

The post The $2.4K Fakeout: Why ETH’s Latest Rally Might Just Be a Bull Trap (Ethereum Price Analysis) appeared first on CryptoPotato.
Pi Network’s native token took another move south over the past week, and certain indicators suggest that a more painful decline could be on the way.
Others, though, suggest a short-term rebound is also a plausible option.
The Bullish Case
PI was among the top-performing cryptocurrencies in mid-March, with its price soaring to a five-month high of almost $0.30. Some of the catalysts fueling the rally included numerous protocol updates, community enthusiasm from PiDay 2026, and Kraken’s decision to enable trading services for the asset.
However, the upward momentum was short-lived, and the coin headed south in the following days. As of this writing, it trades at around $0.19 (per CoinGecko’s data), representing a 6% decrease on a seven-day scale.
PI’s Relative Strength Index (RSI), though, hints that the token might be gearing up for a renewed resurgence. The technical analysis tool measures the speed and magnitude of recent price movements and helps traders identify reversal spots. It ranges from 0 to 100, with ratios below 30 indicating oversold conditions and potential for a rally, while anything above 70 is considered bearish territory. As of press time, the token’s RSI stands at around 31.

Another encouraging signal comes from market sentiment: PI currently ranks as the cryptocurrency with the second-most bullish sentiment on CoinMarketCap. This shows that traders and investors remain optimistic and highly interested in the asset, a trend that often supports buying pressure and increases the chances of a short-term recovery. The cryptocurrency with the highest bullish sentiment today is Kaspa (KAS), whereas popular altcoins like Pepe (PEPE), Shiba Inu (SHIB), and Ethereum (ETH) are well below PI.

The Bearish Outlook
Despite the positive signals, there are also some warning signs that suggest PI might not be done falling just yet. The first one is the rising amount of coins stored on cryptocurrency exchanges.
Data shows that the figure has risen by more than 2 million over the past 24 hours alone and now stands at almost 473 million. The majority of the tokens (251 million) are held by Gate.io, while Bitget comes second with roughly 144.6 million. Kraken, which only recently listed PI, accounts for only 1% of the total. While this development doesn’t necessarily guarantee a price pullback, it is often seen as a pre-sale step.

Next on the list are the upcoming token unlocks. The end of March and start of April are shaping up to be turbulent, as tens of millions of PI are set to hit the market on several occasions. The total unlocks scheduled for the next 30 days equal 154.2 million, making the average daily number around 5.1 million. Again, this doesn’t mean a correction is inevitable, but it clearly increases selling pressure.

The post 2 Bullish and 2 Bearish Signals for PI as Pi Network’s Price Slips 6% Weekly appeared first on CryptoPotato.
The cryptocurrency markets are often impacted by major global developments, and the past hour or so proved that narrative right once again.
Recall that BTC skyrocketed by three grand in minutes after Trump said he and his team carried out successful and in-depth talks with Iran’s leaders and agreed to pause all military operations against the latter’s power plants for five days as the conversations continue.
However, Iran issued a statement immediately after Trump’s post went viral, denying his claims. Moreover, Iran said there “has been no indirect or direct contact with President Trump,” and blamed the POTUS for trying to buy time in the war that’s not going as promised.
Iran’s officials went further, as they alleged Trump “withdrew” from attacking power plants after the Middle East country issued “firm warnings.” They added that the Strait of Hormuz will “not return to pre-war conditions as long as psychological warfare continues.”
BREAKING: Iran issues a statement DENYING President Trump’s post which claimed the US and Iran have had “productive conversations” to end the Iran War:
Iran says:
1. “There has been no indirect or direct contact with President Trump”
2. President Trump is trying to “buy time”…
— The Kobeissi Letter (@KobeissiLetter) March 23, 2026
The primary cryptocurrency retraced instantly after Iran’s statement. The asset touched a multi-day peak of $71,500 but slipped by two grand in minutes before it settled at around $70,000 as of press time.
All this volatility continues to harm over-leveraged traders, with more than 200,000 such market participants being wrecked in the past day. The total value of liquidations has risen to $800 million, according to CoinGlass data.
The post Bitcoin Sees Wild Price Swings as Iran Rejects Trump’s De-escalation Claims appeared first on CryptoPotato.
The world’s largest corporate holder of bitcoin continues to be unfazed by the ongoing tension in the Middle East, announcing bitcoin purchases every Monday.
According to the numbers Michael Saylor just published, this one was completed at some point in the first few days of the previous business week since the average entry price was at $74,326. The cryptocurrency stood above $74,000 by Wednesday morning before it nosedived before and after the second FOMC meeting for the year.
Nevertheless, Strategy’s holdings have shot up to 762,099 BTC after the company accumulated another 1,031 units for $76.6 million. The firm has spent $57.69 million to acquire its bitcoin fortune.
Strategy has acquired 1,031 BTC for ~$76.6 million at ~$74,326 per bitcoin. As of 3/22/2026, we hodl 762,099 $BTC acquired for ~$57.69 billion at ~$75,694 per bitcoin. $MSTR $STRC https://t.co/SELVmAz9WA
— Michael Saylor (@saylor) March 23, 2026
This week’s announced purchase is significantly lower than the one highlighted last Monday. At the time, Saylor said the company he co-founded has spent a whopping $1.57 billion to acquire 22,337 BTC.
The firm continues to be deep in the red on its bitcoin position, given the cryptocurrency’s correction to under $70,000 as of press time after the fake-out rally to $71,500 following Trump’s latest questionable statement on the war in Iran.
The post Saylor’s Strategy Buys Over 1,000 BTC as Unrealized Losses Mount Up appeared first on CryptoPotato.