Cryptocurrency Posts
Crypto Briefing
Bitcoin's potential rise to $150K by 2027 highlights the importance of liquidity, institutional demand, and regulatory developments in shaping its future.
The post Bitcoin could reach $150K by 2027 despite fragile recovery, Moon Pursuit founder says appeared first on Crypto Briefing.
France's diesel release may stabilize domestic markets and influence global energy dynamics amid geopolitical and supply chain challenges.
The post France sells 3.6M barrels of diesel from strategic reserves appeared first on Crypto Briefing.
This case highlights the urgent need for stronger internal controls and protocols in handling digital assets within law enforcement agencies.
The post Former FBI agent pleads guilty to stealing $2.47 million in seized crypto appeared first on Crypto Briefing.
The sliding odds reflect market uncertainty and skepticism about Anthropic's IPO timeline, impacting investor confidence and strategy.
The post Kalshi odds for an Anthropic IPO announcement slide to 57% appeared first on Crypto Briefing.
Anthropic's IPO highlights the growing investor appetite for AI, despite significant financial risks and the need for cautious optimism.
The post Anthropic’s IPO gets an all-day livestream as Wall Street sizes up the AI trade appeared first on Crypto Briefing.
Bitcoin Magazine
Bitcoin Magazine

Strive (ASST) Posts $474.8 Million Common Net Income as Bitcoin Yield Hits 63.2%
Strive reported $474.8 million of net income attributable to common stockholders for the third quarter ended Sept. 30, a print that arrived Friday alongside a company claim that Class A total return had outperformed bitcoin by 103.7% year to date through the same date.
GAAP net income was $509.0 million, or $5.24 a share on a fully diluted basis. Almost all of that came from a $533.7 million unrealized gain on digital assets marked to fair value. Operating revenue for the quarter was just $2.7 million, so the earnings line is a treasury mark, not a fee business.
In a post on X that led with the outperformance figure, Strive also highlighted a year-to-date bitcoin yield of 63.2% and a bitcoin dollar gain of $9.00 per assumed diluted share outstanding, both measured through Sept. 30. Chairman and CEO Matthew Cole tied those metrics to the stock’s relative showing against the asset.
“Strive has continued to successfully execute on its treasury management strategy, delivering a strong bitcoin yield year to date in 2026, which I believe is the primary driver of our common equity’s outperformance relative to Bitcoin so far this year,” Cole said in the earnings release.
Bitcoin yield, buys and the preferred stack
Bitcoin yield, as Strive defines it, is the percentage change in bitcoin per share over a period — not a cash yield. On that measure the company posted 18.5% in the third quarter alone and 19.3% from Oct. 1 through Oct. 30, after the SATS preferred debut.
Strive acquired 8,136 bitcoin in the third quarter at an average cost of about $78,885 and 20,373 bitcoin over the nine months ended Sept. 30. Another 15,124 coins followed between Oct. 1 and Oct. 30. Holdings stood at 28,000 bitcoin on Sept. 30 and 43,124 by Oct. 30, keeping Strive among the largest public corporate stacks after recent multi-thousand-coin buys and smaller weekly adds that still trailed Strategy.
Digital assets at fair value were $2.34 billion on the Sept. 30 balance sheet. Cash had risen to $490.4 million by Oct. 30, and Strive still held Strategy’s variable-rate STRC preferred with a fair value of about $50.1 million.
The capital stack that funded the buys is mostly perpetual preferreds. On Oct. 20 Strive closed a registered offering of 7 million shares of its 15% Series A perpetual preferred (SATS) for about $609 million in net proceeds. Preferred dividends of $34.2 million in the quarter are what turned the $509.0 million GAAP profit into the $474.8 million common figure.
Strip the story to nine-month GAAP and the picture flips. For the nine months ended Sept. 30, Strive posted a net loss attributable to common stockholders of $88.4 million. The third-quarter profit is real under fair-value accounting, but it is concentrated in one mark-to-market line.
What ASST stock has done over the past year
ASST itself has not moved in a straight line with the company’s bitcoin-yield scoreboard. Shares closed at $20.59 on Thursday, down about 10% on the day, and traded near $20.70 early Friday. That leaves the stock roughly 29% below its level a year earlier, when Yahoo Finance data put the close near $29, and about 33% under its Oct. 21 local high of $30.75.
The 52-week range on Yahoo Finance runs from $7.02 to $34.40. Year to date, the price path from the Jan. 2 close near $17.30 into the mid-$20s is a gain of roughly 20%, with a February low near the 52-week floor and a September push back toward $30. Through Sept. 30 — the cutoff on Strive’s outperformance claim — ASST had risen about 70% from that January close while bitcoin was down roughly 7% over the same window on Yahoo Finance data, a wide gap even before the company’s own total-return methodology.
The longer chart still carries the scar of 2025, when Asset Entities became the public shell for Strive’s bitcoin-treasury reverse merger and the share price spiked into triple digits on weekly closes before collapsing. Investors who held through that conversion saw a different ride than the tidy year-to-date relative-return figure Strive put at the top of Friday’s note.
Cole said the recent SATS issuance leaves Strive “never been in a better position to generate long-term returns in excess of Bitcoin for our common equity shareholders.” The test for ASST from here is whether another quarter of bitcoin yield and preferred-funded buys can reopen the gap to bitcoin after a year in which the stock still sits well below where it traded twelve months ago, even as the treasury has climbed past 30,000 then 40,000 bitcoin.
This post Strive (ASST) Posts $474.8 Million Common Net Income as Bitcoin Yield Hits 63.2% first appeared on Bitcoin Magazine and is written by Micah Zimmerman.
Bitcoin Magazine
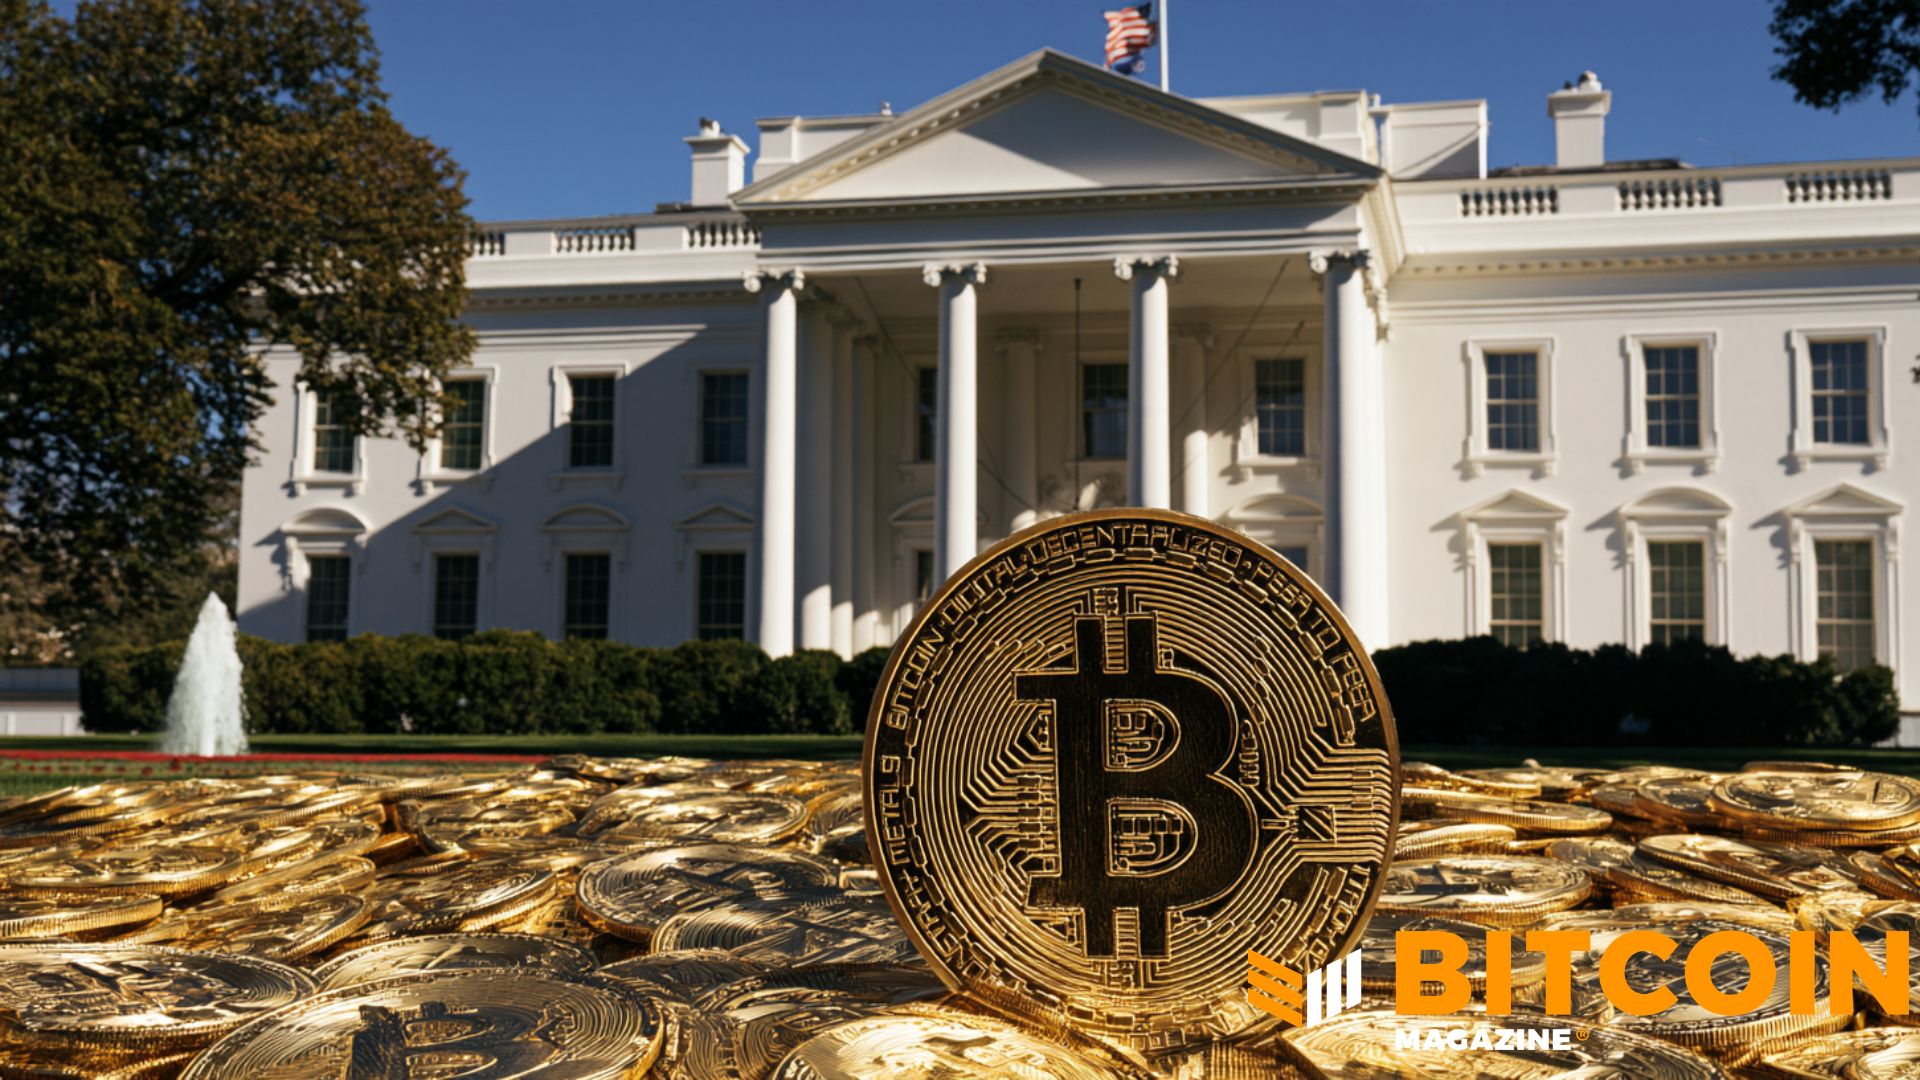
Rule to Allow Crypto in 401(k)s Arrives at White House for Final Review
A final DOL rule that would ease alternative assets such as private equity, real estate and cryptocurrency into 401(k) retirement plans arrived at the White House on Thursday for review, Bloomberg Law reported, a procedural step that usually precedes public release.
The Office of Information and Regulatory Affairs logged the package on Nov. 5 under the title “Fiduciary Duties In Selecting Designated Investment Alternatives,” RIN 1210-AC38. The filing lists the DOL’s Employee Benefits Security Administration as the authoring office, marks the stage as a final rule, flags it as economically significant and notes that there is no legal deadline for completion.
The DOL unveiled the proposal on March 30. In that draft, plan fiduciaries who follow a documented process when adding private assets to a 401(k) menu would get a legal safe harbor under the Employee Retirement Income Security Act of 1974.
The six factors named in the proposal are performance, fees, liquidity, valuation, performance benchmarks and complexity. Satisfying them does not force plans to offer crypto. It lowers the litigation risk for employers that decide they want to.
JUST IN:
— Bitcoin Magazine (@BitcoinMagazine) November 6, 2026The White House is now reviewing a new rule which will allow Americans to invest in crypto through their 401(k) retirement plans
pic.twitter.com/uXGGIXEzdC
What the DOL safe harbor covers
President Donald Trump’s Aug. 7, 2025, executive order, “Democratizing Access to Alternative Assets for 401(k) Investors,” directed the Labor secretary to reexamine ERISA guidance and, where appropriate, propose rules with “appropriately calibrated safe harbors.” The order defined alternative assets to include private-market equity and debt, real estate, holdings in actively managed vehicles that invest in digital assets, commodities, infrastructure and lifetime-income strategies.
The March proposal implements that order. A DOL fact sheet said prudence under ERISA is process-based and that fiduciaries retain discretion to select any designated investment alternative if they follow the outlined review. Deputy Labor Secretary Keith Sonderling cast the approach as neutral: “The department’s days of picking winners and losers are over.”
That stance reverses a prior chill. In May 2025 the DOL rescinded its March 2022 compliance release that told fiduciaries to use “extreme care” before putting cryptocurrency on a 401(k) menu. The department said that phrase was not found in ERISA and restored a context-specific standard.
Later, it was reported that Sens. Bernie Sanders and Elizabeth Warren pressed the DOL to abandon the crypto-friendly path. House Republicans have separately pushed to codify Trump’s crypto order in statute.
Why OIRA review matters for bitcoin and crypto
OIRA review under Executive Order 12866 is the last interagency checkpoint before a final rule can be published in the Federal Register. Bloomberg Law said the arrival signals the package is nearing completion. The same office cleared the proposed version in late March before the DOL published it; that earlier pass took roughly two months after the January submission, per prior Bloomberg coverage of the roughly $12 trillion 401(k) market.
What is not yet public is the final text itself. Whether the six-factor safe harbor survived comment intact, how digital-asset vehicles are described, and what effective date the DOL chose will only be clear when OIRA returns the rule and the department posts it. Comment volume on the proposal was heavy; industry and labor groups have argued opposite sides of the prudence standard for months.
For bitcoin, the stakes sit in plan menus rather than spot ETF flows. Trump’s August order helped frame digital assets as a retirement-access issue for more than 90 million defined-contribution savers. A finalized DOL safe harbor would not put bitcoin and crypto on every lineup overnight. It would give plan committees a clearer map if they want exposure through an asset-allocation sleeve that holds digital assets.
The test now is how fast OIRA clears the economically significant package — and whether the published final rule still gives fiduciaries the process cover the March draft promised, or whether the comment fight rewrote the safe harbor before the White House stamps it.
This post Rule to Allow Crypto in 401(k)s Arrives at White House for Final Review first appeared on Bitcoin Magazine and is written by Micah Zimmerman.
Bitcoin Magazine

Binance Hackers Swap About $50 Million of Stolen XRP Mostly Into Bitcoin, Elliptic Says
Hackers tied to the record Binance theft have begun converting a large slice of the stolen XRP into bitcoin, blockchain analytics firm Elliptic said in an update dated through Friday, with about 42 million XRP — roughly $50 million — already swapped, mostly through THORChain.
Converted bitcoin from other stolen assets nearly doubled overnight to about 1,650 BTC, worth some $124 million, Elliptic wrote. Most of that jump came from the XRP route. About 192 million XRP, roughly $226 million, remained unswapped in addresses linked to the Binance theft.
The XRP was part of the Oct. 29 drain that Binance later put at $6.34 billion. Between 20:05 and 20:09 UTC that day, five hot wallets sent 233.46 million XRP to an attacker address. The FBI has attributed the campaign to North Korea’s TraderTraitor group. Binance has reopened withdrawals in stages and said it has frozen or intercepted about $2.85 billion while covering customer losses from its own funds.
How the XRP started moving
The stolen XRP sat quiet at first. Early on Nov. 2, between 02:12 and 04:00 UTC, all about 233 million XRP moved into six new addresses, where it stayed until Nov. 5, Elliptic said. From the afternoon of Nov. 5, two of those six addresses began sending XRP on to dozens of new accounts that swapped it, mostly through THORChain into bitcoin.
A small amount of ether also went through THORChain into bitcoin that evening. The main bitcoin and ether holdings from the theft — the largest pools — have still not moved, Elliptic said. That pattern matches what the firm saw after the Bybit hack: turn freezable and mid-liquidity tokens into bitcoin first, then attempt cash-out later through OTC brokers.
The broader laundering trail is already vast. Since the Binance theft, Elliptic has counted more than 20,000 wallets on 16 blockchains, at least 36 services and at least 65,000 transactions — roughly one new wallet every 30 seconds and one transaction every 10 seconds. About $3.11 billion remains in addresses linked to the Binance theft, mostly as ether and bitcoin. A negligible amount has likely been cashed out so far.
Why XRP and bitcoin matter here
Issuers can freeze many stablecoins. They cannot freeze XRP the same way, and they cannot freeze bitcoin. After Tether and Circle locked down large stablecoin tranches on Oct. 29, the attacker prioritized assets that sit outside that kill switch. Swapping XRP into bitcoin continues that logic: bitcoin is harder to claw back once it is fragmented across fresh addresses.
All of the stolen SOL, about $87 million at Elliptic’s prices, has already been swapped, bridged or mixed, with much of it ending as bitcoin. Most early Tron laundering — about $220 million in TRX — has also run, a flow Bitcoin Magazine noted when covering the quiet shutdown of the T3 Financial Crime Unit before the hack. Only small parts of the main ether and NEAR piles have moved.
Some converted bitcoin has gone into Wasabi-style coinjoins — about 33 BTC, or $2.5 million, since Nov. 1 — and about $1.1 million in ether and SOL entered the Privacy Cash pool before that service paused deposits. Elliptic said the speed points to conventional automation, not an AI agent making live decisions: fixed timing, set amounts, blind retries and new tactics introduced hours apart.
U.S. bank supervisors have already checked in with lenders after the Binance breach. For bitcoin markets, the nearer question is how much more of the remaining ~192 million XRP — and eventually the parked ether — gets turned into BTC before anyone tries to cash out.
The test now is whether THORChain operators and other bridges keep blocking the published attacker addresses fast enough to slow the XRP-to-bitcoin pipe, or whether the rest of that pile follows the same overnight path the first $50 million already took.
This post Binance Hackers Swap About $50 Million of Stolen XRP Mostly Into Bitcoin, Elliptic Says first appeared on Bitcoin Magazine and is written by Micah Zimmerman.
Bitcoin Magazine

Bitcoin Price Holds Near $75,000 After Hot October Jobs Report
U.S. employers added 165,000 jobs in October, nearly three times the 59,000 economists expected, the Labor Department said Friday, and the bitcoin price briefly pushed above $76,100 before settling near $75,500, Bitcoin Magazine Pro data shows.
The unemployment rate edged down to 4.1% from 4.2%, beating the Dow Jones forecast that called for it to hold. Average hourly earnings rose 0.4% on the month and 3.1% over the year, both ahead of estimates, CNBC reported.
Prior months were revised higher as well. August payrolls moved to 186,000, an upward revision of 53,000, and September rose to 60,000 after a 31,000 upgrade, leaving the two-month total 84,000 stronger than first reported.
The print lands on a market still digesting Thursday’s Nasdaq-led rout. The bitcoin price had held near $76,000 into that close, dipped toward $75,200 late in the session, then recovered into the mid-$75,000s overnight before the 8:30 a.m. ET release. Spot bitcoin changed hands around $75,800 after the data, with a market cap of about $1.52 trillion and roughly $48 billion in trading volume over the past day, Yahoo Finance data indicated.
Bitcoin price reaction
Bitcoin price’s first move was a quick spike above $76,100, then a slide toward $75,600 before it settled back near $75,800. The range on the day has run from about $75,240 to $76,280, leaving the market little changed from its pre-release level even as rate futures repriced.
That muted finish fits the pattern after big macro prints. Most of the damage to the bitcoin price this week came from equity risk-off, not from the labor market itself, and a hot payrolls number mainly reinforces the path the Fed was already pricing.
CME FedWatch odds put roughly a 79% chance of a 25-basis-point hike at the Dec. 9 meeting after the release, up from about 70% into the open. The next employment report is due Dec. 4, five days before that decision, and the signal points the same way the last Fed hold did: stronger hiring and firmer wages leave less room for another pause.
Tech rout aftermath and ETF outflows
Thursday’s session still sets the floor under the bitcoin price. The Nasdaq Composite fell about 5.5% and dropped into correction territory, more than 10% below its recent high, while the S&P 500 lost about 4.4% and the Dow shed roughly 1,800 points, or 3.4%, CNBC reported.
The Magnificent Seven erased more than $1 trillion in market value. Nvidia alone lost more than 9%, wiping out roughly $440 billion in capitalization, as investors priced in a slower AI data-center buildout after the Democratic midterm sweep.
Bitcoin has traded with that AI-heavy complex for most of the year, so a correction in the Nasdaq has pulled the bitcoin price lower even when on-chain flows looked steady. Miners that leased power and floor space to AI tenants are caught in both trades.
Fund flows followed the risk-off tape. U.S. spot bitcoin ETFs posted $430.2 million in net outflows on Thursday, led by about $200 million from Fidelity’s FBTC and roughly $105 million from BlackRock’s IBIT, bringing week-to-date redemptions through Thursday to about $870 million.
Leverage kept the bitcoin price soft into the overnight. More than $1 billion in crypto positions were liquidated over 24 hours, mostly long bets built during Wednesday’s short-squeeze bounce that lifted bitcoin near $80,000.
What comes next for bitcoin price
Professional and business services led October hiring with 70,000 jobs, health care added 42,000, and transportation and warehousing gained 25,000. Manufacturing rose 19,000. The breadth undercuts the recent pattern in which health care carried most of the gains.
Policy risk has not eased either. House Democrats are already drafting their own market structure bill ahead of taking the committees in January, a backdrop that has hung over crypto equities since the midterm results first hit the bitcoin price.
Traders are watching whether the bitcoin price can defend the mid-$75,000 zone that held on election night and several times since August. A clean break would leave September’s low back in sight after a week that erased most of the post-election squeeze, now with a hotter labor market and firmer hike odds stacked on top.
At the time of writing, the bitcoin price is near $75,500.
This post Bitcoin Price Holds Near $75,000 After Hot October Jobs Report first appeared on Bitcoin Magazine and is written by Micah Zimmerman.
Bitcoin Magazine
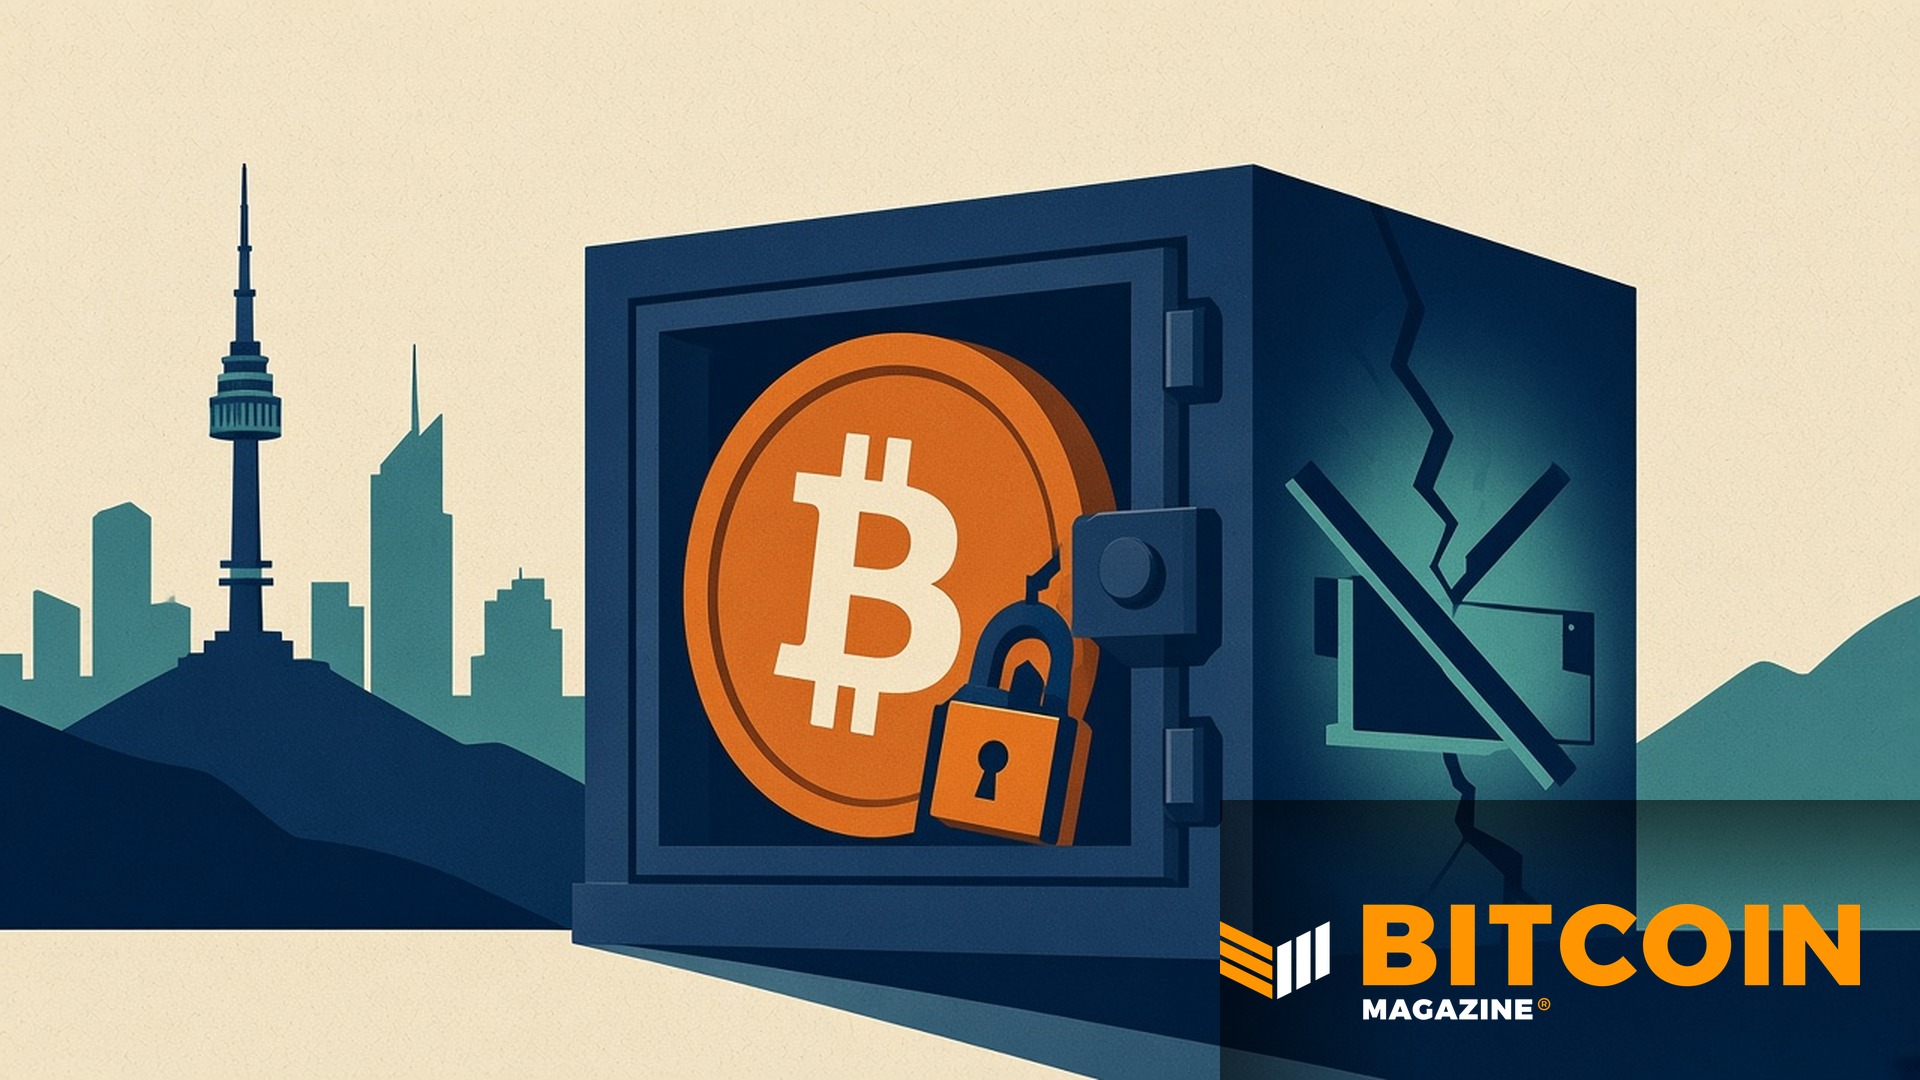
South Korean Crypto Exchange Gopax Suspends Withdrawals and Trading After Hacking Threat
South Korean cryptocurrency exchange Gopax suspended withdrawals and trading on Friday after receiving a hacking-threat email, and said it is moving all held virtual assets into offline cold wallets as a preemptive step to protect customer funds.
Gopax halted standard deposit and withdrawal services at 2:55 p.m. local time and stopped trading at 3:53 p.m., Yonhap News Agency reported, citing the exchange. Direct withdrawals through the website and app are unavailable. Customers who want coins out must apply through the customer support center, where requests are processed manually after internal verification.
“To ensure the safe custody of user assets, we plan to transfer all virtual assets to cold wallets for storage,” Gopax said in remarks carried by Seoul Economic Daily. “Direct withdrawals through the Gopax website or app are temporarily unavailable, and customers wishing to withdraw funds should apply through the Gopax customer support center.”
No actual loss of assets has been reported. The company has not set a date to reopen trading or standard withdrawals.
What Gopax closed and what still works
With trading offline, all open orders were canceled, Chosun Biz reported. Deposits were initially paused with withdrawals; later Korean coverage said deposits had been restored while web and app withdrawals stayed shut. Manual withdrawals through support will take longer than usual.
A cold wallet is a storage setup kept offline, cut off from the internet that hot wallets use to process customer sends. Gopax said the shift of remaining hot-wallet balances into cold storage is meant to shrink the surface available to anyone who can reach online systems.
A Gopax official told Yonhap the email came from a party claiming it could hack the exchange, but that the threat itself had not been verified. “We ask for your understanding, as this measure is intended to prevent financial incidents and protect user assets,” the company said.
A rough stretch for Korean crypto platforms
The freeze lands in a week when exchange security is already under a bright light. On Oct. 29, attackers drained about $6.34 billion from Binance hot wallets in what Binance later described as a months-long campaign that began with a fake job interview. The FBI has tied that theft to North Korea; Binance has reopened withdrawals in stages and said it is covering customer losses from its own funds.
Brazil’s Mercado Bitcoin froze deposits and withdrawals earlier this week after its own security incident, with preliminary estimates of suspicious transfers near $40 million. Gopax’s case is different on the facts disclosed so far: the exchange is describing a threat email and a precautionary lockdown, not a confirmed drain.
Gopax itself has been dealing with account trouble. From early September, abnormal access hit some user accounts, leaking personal information on seven customers and two current or former employees, with further leakage confirmed last month, Yonhap’s Korean dispatch said. The company has treated that breach as separate from Friday’s threat email; any link has not been confirmed.
South Korea’s Financial Services Commission has also been pressing domestic platforms after a broader wave of cybersecurity incidents across financial firms. Korean exchanges are already required to keep at least 80% of customer crypto in cold storage. Friday’s move pushes Gopax further offline while it checks whether the threat is real.
For bitcoin holders on Gopax, the practical effect is a queue: coins are being parked offline while support staff approve outbound sends one by one. That is slower than an app button, and it is the trade the exchange says it is making to keep balances intact.
The test for Gopax now is whether it can finish the cold-wallet transfer, clear the manual withdrawal queue without a loss, and say when trading comes back — or whether the unverified threat turns into the incident it was trying to get ahead of.
This post South Korean Crypto Exchange Gopax Suspends Withdrawals and Trading After Hacking Threat first appeared on Bitcoin Magazine and is written by Micah Zimmerman.
CryptoSlate
Concentrated Q3 buying and falling older-holder balances leave sustained absorption unproven as November withdrawals meet the next US jobs report.
Read the full story on CryptoSlate
Understand the crypto stories that matter and what to watch next. Get The Catalyst in your inbox
Energy inflation has prompted UK tightening, while any pressure on Bitcoin depends on financing conditions and investor demand.
Read the full story on CryptoSlate
Understand the crypto stories that matter and what to watch next. Get The Catalyst in your inbox
The firm says six public addresses appeared across 28 services, while its data identifies neither the device nor the person.
Read the full story on CryptoSlate
Understand the crypto stories that matter and what to watch next. Get The Catalyst in your inbox
Its November 4 notice says the operator and affiliates will abstain from providing liquidity, leaving eligible outside participants to supply the planned pools.
Read the full story on CryptoSlate
Understand the crypto stories that matter and what to watch next. Get The Catalyst in your inbox
Patrick Steven Yaroch used credentials tied to 35 investigations for about 100 fraudulent transfers, according to DOJ.
Read the full story on CryptoSlate
Understand the crypto stories that matter and what to watch next. Get The Catalyst in your inbox
CryptoTicker.io
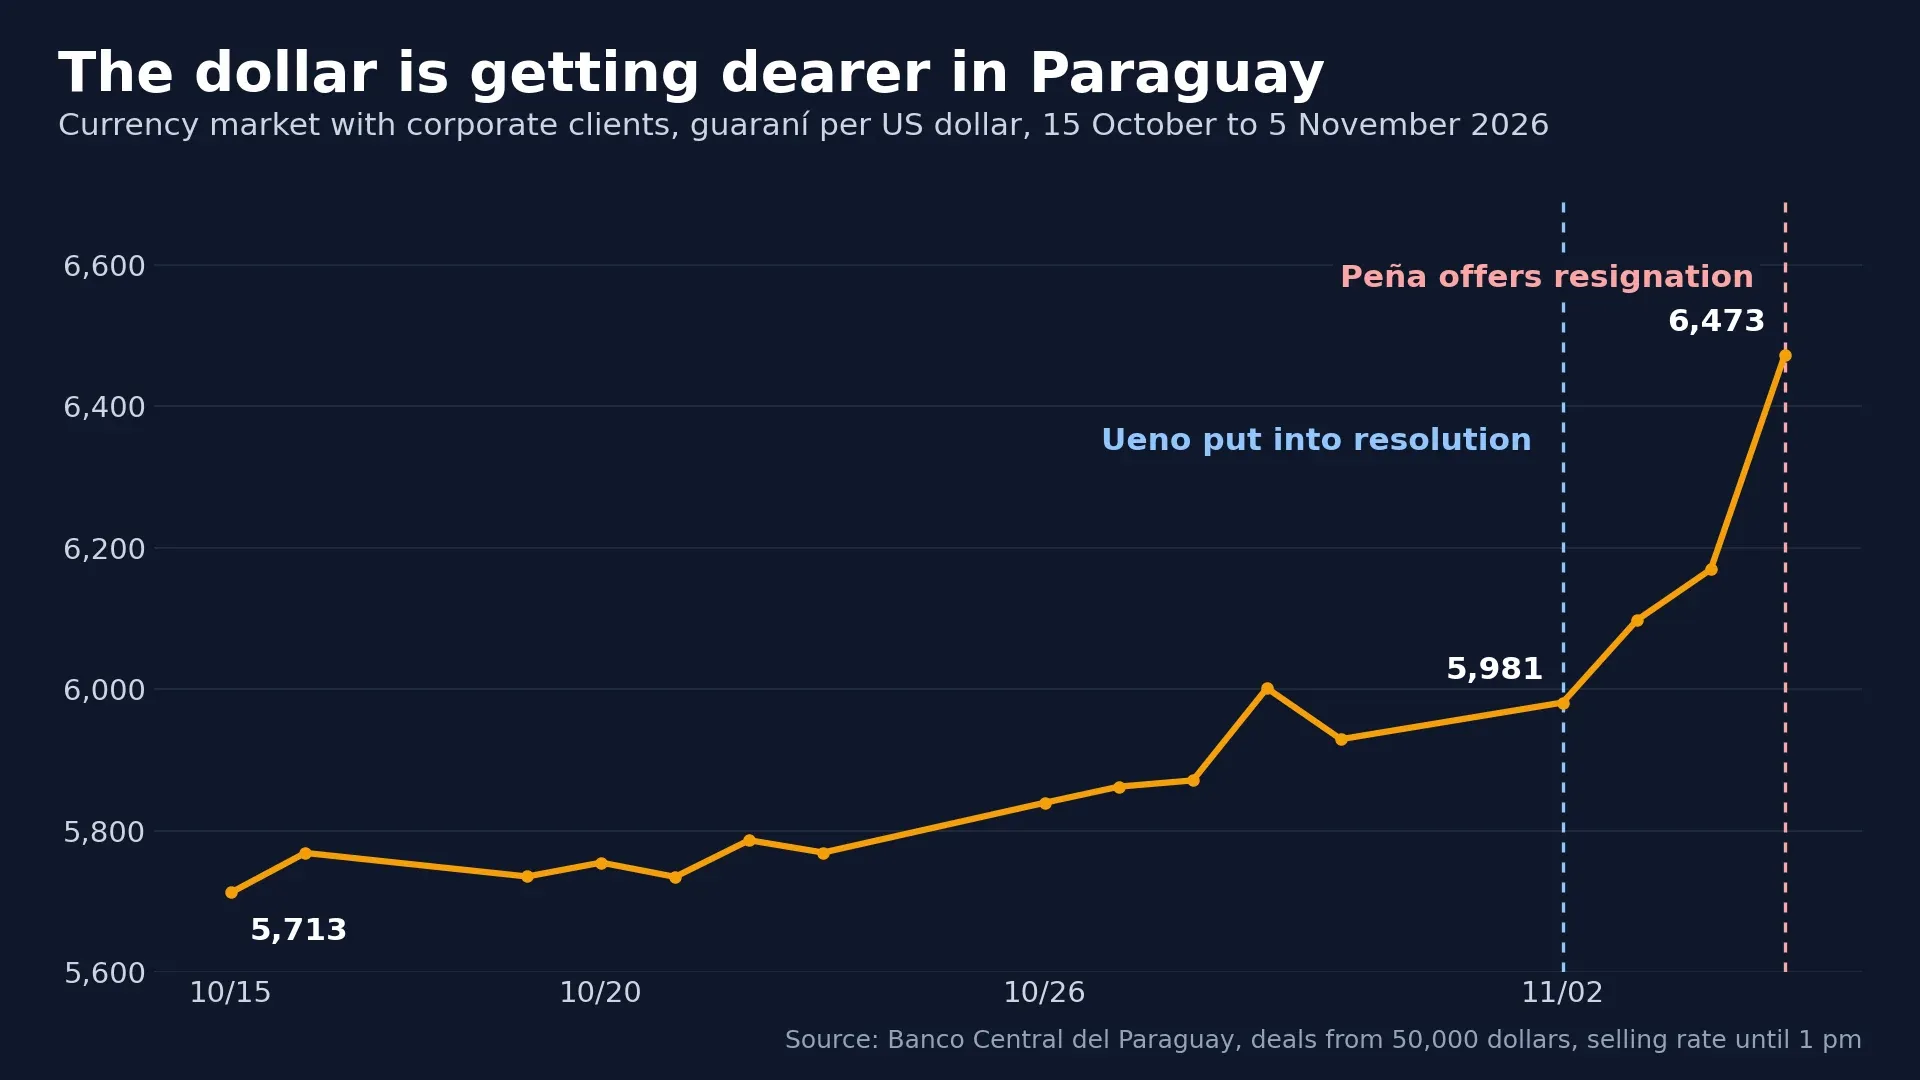
Paraguay's central bank put Ueno Bank into resolution on 2 November. Since then, around three million customers have been locked out of their accounts in a country of 6.5 million people. On Thursday, 5 November, President Santiago Peña handed in his resignation, which has not been accepted so far. On the currency market, the guaraní has lost 7.6 percent of its value against the dollar since the intervention.
The banking crisis in Paraguay lands in a week full of alarming headlines: a list of bank hacks in 15 countries is going viral on X, AI stocks crashed on Wall Street, and Bitcoin fell with them. Here is what holds up and what crypto can do in a situation like this, beyond being an investment. If you want to secure your own coins first, our hardware wallet comparison is the place to start.
What happened at Ueno Bank in Paraguay?
Ueno Bank is insolvent. On 2 November, the central bank's board unanimously decided to open resolution proceedings under deposit guarantee law 2334/03, reports the Argentine newspaper Perfil. The bank's solvency ratio had fallen to 5.56 percent against a required minimum of 12 percent.
The trigger was balance sheet adjustments of more than 1.6 trillion guaraní, roughly 250 million dollars, and a 70 million dollar hole in the bank's reserve requirement. Ueno started as a fintech and grew into a mid-sized bank that managed almost 850 million dollars of public money, according to Al Jazeera. Figures from Perfil and AP show that the fallout reaches far beyond its customers:
- 2,941,996 customers banked with Ueno in June 2026. According to AP, the bank claimed to reach more than 60 percent of the country's adults.
- Around 355 million dollars of the state social security fund IPS were invested with Ueno, about 9 percent of its portfolio.
- Around 32,000 pensioners received their pensions through the bank.
- Eight senior executives were detained and 27 bank officials and business associates charged, reports the Associated Press.
In the capital Asunción, protesters chanted "Give us back our money", and police used pepper spray and rubber pellets.
Why did Paraguay's President Santiago Peña hand in his resignation?
After the Ueno collapse, Peña lost the backing of parts of his own Colorado Party and announced his resignation in a video address on Thursday. He said he was acting with "the stability of our country, social peace" and the preservation of democratic institutions in mind, according to Al Jazeera.
Lawmakers accuse him of conflicts of interest, misuse of pension funds and a cover-up. According to Perfil, Peña was a shareholder of Ueno Holding, kept business ties to the group until March 2025 and appointed then Ueno chief Carlos Carvallo as head of the central bank, the very authority meant to supervise the bank. Carvallo stepped down at Peña's request, and according to AP Pedro Acosta Bernal is running the central bank on an interim basis.
The resignation has not been accepted. Thursday's joint session of both chambers collapsed without a quorum after lawmakers of the Colorado Party walked out, so Peña formally remains president, reports the Paraguayan newspaper La Nación. The Chamber of Deputies had previously voted unanimously to impeach him; the Senate decides on that. If Vice President Pedro Alliana takes over, he will serve out the term until August 2028.
Will Ueno Bank customers get their money back?
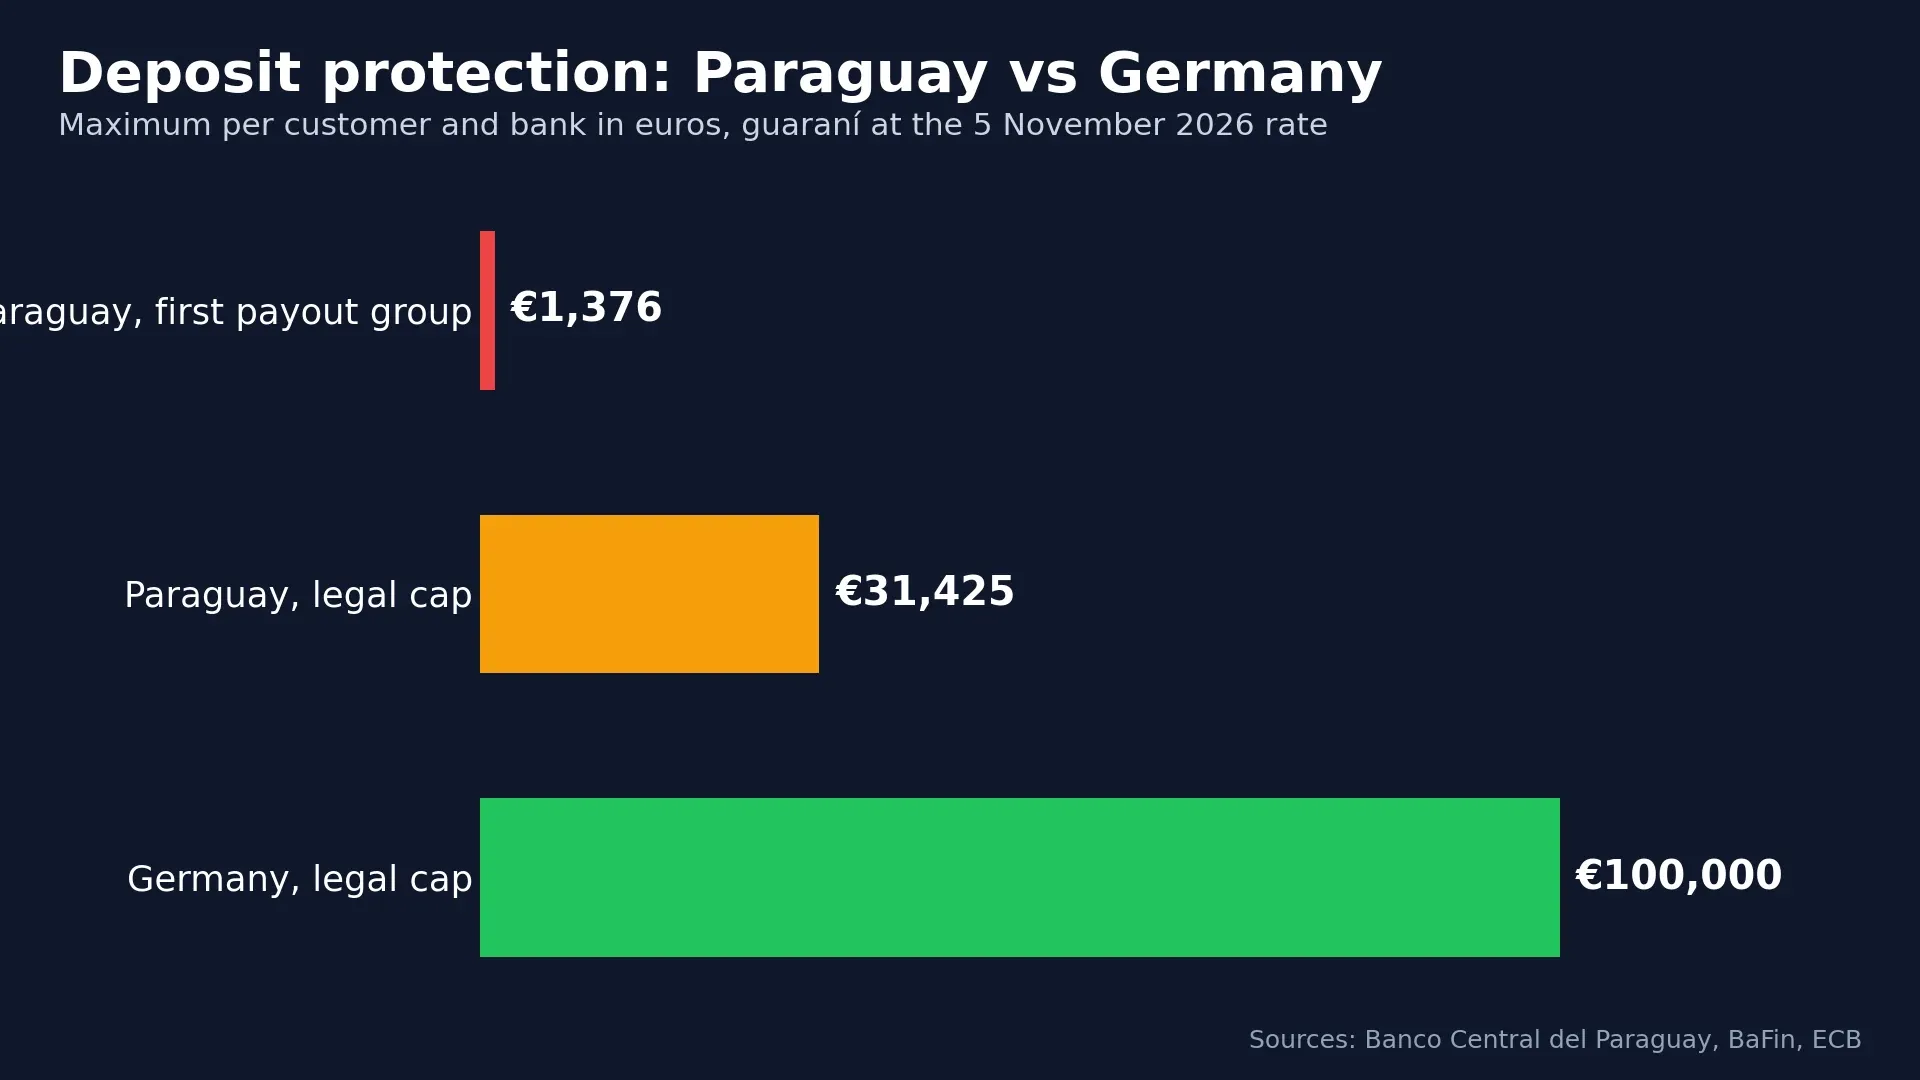
Many will, but in stages. Paraguay's deposit guarantee covers up to 228.3 million guaraní per customer and bank, equal to 75 monthly minimum wages. The fund first pays customers whose balances total no more than 10 million guaraní, who owe Ueno nothing and who hold an active account at another domestic bank. They receive their full balance, reports crypto.news, citing the central bank. Around 280,000 customers who banked only with Ueno are being given accounts at other banks, according to AP.
The payout window is 15 calendar days, until 17 November, and can be extended to 2 December. Anything above the cap depends on the banking supervisor's review.
A second problem only shows up in dollars: the guaraní is losing value. On 2 November, one dollar cost 5,981 guaraní on the currency market for corporate clients, and 6,473 on 5 November, according to central bank data for deals of 50,000 dollars or more. The 10 million guaraní threshold for this first group was worth 1,672 dollars on the day of the intervention and 1,545 dollars three days later. The currency had already been weakening since mid-October, and on Thursday alone the dollar rose 4.9 percent.
The crypto market offers a hint of the demand for dollars: one seller on Bybit asked 6,942 guaraní for one Tether dollar (USDT) on the morning of 5 November, about 13 percent above the previous day's reference rate by crypto.news' calculation. Other offers were well below that.
Bank hacks in 15 countries: what the viral list on X gets right
The list that has been shared on X since Thursday warns of a "bank lockdown". Check each case against its original source and a different picture emerges: there is no coordinated attack, only unrelated individual cases, many of them months or years old. Only in Taiwan, South Korea, Singapore, Nepal and France did the incident itself happen in October or early November 2026. The post itself notes that no government has frozen accounts.
| Country | What happened | When |
|---|---|---|
| Taiwan | Bank SinoPac: 427 unauthorised transfers from 419 customers, over NT$40 million in total, fully refunded; the entry point was suppliers of the new mobile banking system (Focus Taiwan) | November 2026 |
| South Korea | 40 incidents at 37 financial firms, around 473,000 records leaked (Munhwa Ilbo) | 30 September to 3 November 2026 |
| France | Crédit Mutuel Arkéa: fraudulent transfers after a cyberattack, around 100 million euros, the loot was swapped into crypto and part of it frozen (Capacity) | Early November 2026 |
| Singapore | Company wires 12.8 million US dollars to Cambodia on a forged approval letter, police recover all of it (The Star) | October 2026 |
| Nepal | The central bank takes its own website offline over a critical security flaw and tells all banks to tighten protection (ShareSansar) | October 2026 |
| Indonesia | Bank Jambi: around 144 billion rupiah drained from 6,609 customer accounts and swapped into crypto within hours (Antara) | February 2026 |
| USA | 14 people indicted over SIM swaps and corrupt insiders; the targeted accounts held 373 million US dollars in total (US Department of Justice) | Crimes 2023 to 2024 |
| Japan | Fake bank calls to companies in Yamagata, losses of 912 million yen (Sakigake) | March 2025 |
The pattern behind the real cases: attackers rarely break into the vault. They come in through suppliers, fake emails, phone scams and bribed staff. Brazil's central bank reports 99 cyber incidents through September, more than in all of 2025 (CNN Brasil). Crypto cuts both ways here: the thieves at Bank Jambi and at Crédit Mutuel Arkéa swapped their loot into cryptocurrencies.
Worst day in stock market history? What really happened on Wall Street
No, Thursday was not a record. The S&P 500 lost 4.4 percent, the Nasdaq 5.5 percent and the Dow Jones 3.4 percent. For the S&P 500 it was the worst day since April 2025, when US tariffs rattled markets, AP reports via BNN Bloomberg. For comparison: on Black Monday in 1987, the Dow Jones lost 22.6 percent in a single day (Federal Reserve History).
In dollar terms the day was huge: the S&P 500 alone shed around 2.8 trillion dollars in market value, according to NBC News. That money was not pulled out of the market, though: every sale has a buyer, and market value shrinks because prices fall. The trigger was concern that the Democrats' midterm wins will slow the construction of AI data centres; Nvidia lost 9.3 percent. The background is in our article on the Nasdaq crash.
The widely shared rumour that China would dump all its US Treasuries at an emergency meeting does not fit the data either. Mass selling would have pushed yields up; instead the 10-year Treasury yield fell from 4.90 to 4.84 percent on Thursday as investors fled into government bonds. China held 590.7 billion dollars in August according to the US Treasury, the lowest since 2008 (South China Morning Post), and has been reducing its holdings step by step for years.
Bitcoin fell with tech stocks and traded at 75,818 dollars late on Thursday evening, 5.5 percent lower than 24 hours earlier. What that means for the price is covered in our analysis of the Bitcoin crash.
How can crypto protect you in a banking crisis?
Crypto does not protect you from falling prices. It protects you from what three million people in Paraguay are going through right now: a bank or an authority cutting off access to your money. If you hold Bitcoin or stablecoins in your own wallet, you need no bank, no branch and no opening hours to send a payment.
- Self-custody: If you hold your private key yourself, your holdings do not depend on any bank or account freeze. The safest place for your keys is a hardware wallet; our hardware wallet comparison shows which devices fit.
- Protection from your own currency: The guaraní has lost 7.6 percent against the dollar since the intervention. Anyone who kept savings in dollar stablecoins avoided that loss. That is exactly why people in countries with weak currencies use stablecoins as a digital dollar account; we compare the most important ones in our stablecoin list.
- Available around the clock: The Bitcoin network has no bank holidays. A transfer goes through even when branches are closed and ATMs are empty.
- No access for third parties: In the 2013 rescue of Bank of Cyprus, 47.5 percent of deposits above 100,000 euros were converted into the bank's shares (Bank of Cyprus). Bitcoin in self-custody cannot be tapped that way.
Where crypto does not protect you in a banking crisis
Crypto is not all-round protection. If you use it as a reserve, you should know its limits:
- Price: Bitcoin fell with the Nasdaq on Thursday. If you need cash quickly in a crisis, you may end up selling at the worst moment.
- Balances on an exchange: Coins on a trading platform are a claim against the provider, just like a bank balance. Only withdrawing to your own wallet protects you from the provider going bust. Under MiCA, providers in the EU must keep client assets separate from their own, but there is no deposit insurance for crypto assets as there is for banks.
- Stablecoin issuers: Behind every stablecoin is a company that holds reserves and can freeze addresses. In the EU, regulated exchanges mainly offer MiCA-compliant stablecoins such as USDC and EURC. They are not covered by deposit insurance either.
- Your key: If you lose your recovery phrase or hand it to scammers, you lose everything. Self-custody means self-responsibility.
What does the banking crisis in Paraguay mean for your money?
In the EU, deposits of up to 100,000 euros per customer and bank are protected by law. In Germany the money is paid out within seven working days without an application, according to the financial supervisor BaFin, and this also applies to partnerships and corporations. In the US, the FDIC insures up to 250,000 dollars per depositor and bank. At the 5 November exchange rate, Paraguay's cap is around 31,400 euros.
What you can take away from Paraguay:
- Spread it out: If you hold more than the insured limit at one bank, split it across several institutions. The limit applies per bank, not per account.
- A reserve outside the banking system: If you want to hold a small share independently of banks, you can keep Bitcoin or euro stablecoins in your own wallet. You can buy them from a MiCA-licensed provider, see our comparison of regulated crypto exchanges, and then withdraw to your own wallet.
- Protect your logins: Most bank hacks run through fake calls, emails and approvals. No bank will ask for your one-time codes over the phone.
As of 5 November 2026, 11 pm CET. This article is not investment advice; crypto assets can lose value sharply.
What is documented: the US spot ETFs on Solana lost a net $1.18 million on Thursday, November 5, even though the price fell 6.5 percent that day and briefly slipped below the 200-day line. At the same time, the value of all fund holdings, at $1.333 billion, is around $134 million below what investors have paid in net since launch. Our assessment follows further down: investors who do not sell despite a paper loss form a quiet base under the price, and that base is about to be tested in the coming days.
On Friday afternoon Solana trades at $91.12, or €81.76, according to data from CoinGecko. The daily low was $88.35 and the daily high $92.87. Our Solana price prediction sets out where the price could head over the coming months. This piece sticks to the question of the day: how do fund investors behave when the price falls, and what does that mean for the next levels?
An Outflow of $1.2 Million on a Day With a 6.5 Percent Drop
The daily figures come from SoSoValue, a data service that tracks inflows and outflows of US crypto funds every day. For November 5 it shows net outflows of $1.1761 million from the Solana ETFs. The Grayscale Solana Trust (GSOL) accounted for the largest share at $815,100, with a further $360,900 from the Invesco Galaxy Solana ETF (QSOL). The other funds reported no movement.
A net outflow is the difference between newly issued and redeemed fund shares. When an investor redeems shares, the issuer usually sells the corresponding amount of SOL. A large outflow therefore weighs directly on the spot market; a small one hardly does.
How small Thursday's figure is becomes clear in comparison with the week of October 26 to 30. Back then investors pulled out $71.47 million, the largest weekly outflow since the funds launched and the fourth week of outflows in a row. Thursday's outflow is less than 2 percent of that weekly figure, even though the price fell almost as much in a single day as on October 30, when it dropped from $102.32 to $95.47.
Solana also stands out against the other large funds. According to The Block, the Bitcoin ETFs lost $199.9 million at Fidelity alone and $105 million at BlackRock on the same Thursday. Together with the Ether funds, outflows across all crypto ETFs came to more than half a billion dollars.
$1.467 Billion Paid In, $1.333 Billion in Holdings
According to SoSoValue, the Solana ETFs have taken in a net $1.467 billion since launch. The total value of their holdings stood at $1.333 billion on Thursday evening, equal to 2.51 percent of Solana's entire market capitalisation. At a price of around $89, that works out at just under 15 million SOL.
The gap between the two figures is about $134 million. One caveat applies: before its conversion, the Grayscale fund was a trust and brought in holdings that were never counted as inflows. Net assets include those holdings, the sum of inflows does not. The real gap between money put in and current value is therefore more likely to be larger than $134 million.
For the state of the market, this is an important finding. The gap shows that fund investors bought in on average at higher prices than today's. As a group they are under water and still hardly selling. That points to investors with a longer horizon who sit out a decline rather than join it.

What Has Changed at the 200-Day Line Since Thursday Evening
In our Solana analysis of November 5, the price stood at $89.19 in the evening, 0.6 percent above the 200-day line, which was then at $88.93. The 200-day line is the average of closing prices over the past 200 days, and many traders see it as the border between an intact and a broken uptrend.
Since then, Solana slid to $88.35 overnight into Friday, falling further below the line than on Thursday; the line now sits at $88.96. The slide did not last. By Friday afternoon the price had recovered about 3 percent and is again 2.4 percent above the average. A daily close below the line, the yardstick most chart analysts use, has therefore still not happened.
The situation on the network is new as well. Since Friday, version 4.4.1 of the Agave validator software has been mandatory for all validators, a required update we reported on in the morning.
Six Weeks Down: Monday Readings Since September 28
The decline is not a story of this week alone; it runs through the whole autumn. CoinGecko's Monday readings, each taken at 0:00 UTC, show an unbroken staircase downwards: $121.96 on September 28, $121.52 on October 5, $111.25 on October 12, $104.00 on October 19, $101.24 on October 26 and $94.48 on November 2.
So for five weeks in a row the weekly open was lower than the week before. If Solana stays below $94.48 until Sunday evening, it will be the sixth. Over 30 days the loss adds up to 22.5 percent, over seven days to 6.7 percent. That leaves the price a good 69 percent below its all-time high of $293.31 from January 2025.
The capital locked in applications on the blockchain has shrunk at the same time. According to DefiLlama, the total value of funds deposited in Solana applications, known as TVL, fell from $6.57 billion on October 7 to $5.30 billion today. That is 19.4 percent less, slightly less than the price loss over the same period. A large part of the decline is therefore a price effect: the deposited SOL are worth less, and only a smaller part was withdrawn.
The Levels Between $88 and $99
For the coming days, the levels can be derived from the price data itself. The first support is the 200-day line at $88.96, with the overnight low at $88.35 just below it. A daily close below both would be the first since August 21, when Solana closed at $87.65.
On the upside, the first hurdle is the daily high of $92.87, the second the weekly open of $94.48. That level decides whether the losing streak on a weekly basis is broken. Above it lie the 100-day line at $98.89 and, much higher, the 50-day line at $108.39. Both averages are falling, so they will remain above the price in the coming days.
Further down there are few reference points this year. Solana set its low for the year on June 7 at $62.18. Between the 200-day line and that low lie more than $26, or almost 30 percent.

Futures Market: Bets on Rising Prices Dominate on OKX
A second look goes to futures trading. On the OKX exchange, open positions in perpetual SOL contracts amount to more than 3.48 million SOL, or around $316 million, on Friday, according to the exchange's public market data. The ratio of accounts holding long positions to those holding short positions was most recently 3.64. In mid-October it was still 2.2 to 2.5.
This metric counts accounts, not amounts. It shows that many smaller traders are betting on a recovery. For the price, that cuts both ways: if Solana falls below the levels mentioned, forced closures of these positions can accelerate the decline. A liquidation is the automatic closure of a leveraged position by the exchange once the posted collateral is no longer sufficient.
ETF or Coin: Which Route Is Open to Investors in Germany
As a private investor in Germany, you generally cannot buy the US spot ETFs discussed in this piece. The reason is the EU's PRIIPs regulation, which requires a key information document in German for such products. The US issuers do not provide one. German banks and brokers therefore block the funds for retail clients.
Two other routes are open. The first is exchange-traded products on Solana that are listed on European exchanges such as Xetra and sit in a securities account like a share. Our overview of crypto ETFs and ETPs in Germany shows which products exist and what matters for collateral and costs. The second route is buying the coins themselves through an exchange licensed under the EU's MiCA regulation, which has applied to crypto service providers since the end of 2024.
The main difference is tax. On gains from exchange-traded crypto products, most banks withhold the 25 percent flat-rate withholding tax plus solidarity surcharge, regardless of how long you have held them. Whether tax exemption after one year applies to fully collateralised products, as with Xetra-Gold, has not been settled by the highest court for cryptocurrencies. For SOL held directly, by contrast, the rule for private disposals clearly applies.
Staking and the Holding Period: The German Tax Office's Rules for SOL
If you hold SOL directly, you sell tax-free under Section 23 of the Income Tax Act if more than twelve months pass between purchase and sale. Within that period, the gain is taxed at your personal rate once all private disposal gains in a year together reach the exemption limit of €1,000. Losses from sales within the period can be offset against such gains, in the same year or carried forward to later years.
Many Solana holders stake their coins to earn rewards. Staking means assigning SOL to a validator, which uses them to take part in running the blockchain and receives new SOL in return. In its letter of March 6, 2025, the Federal Ministry of Finance confirmed that staking does not extend the holding period of the coins used to ten years. The rewards themselves are other income under Section 22 No. 3 at the time they are received and remain tax-free only up to an exemption limit of €256 a year. A separate holding period starts for each reward received.
In concrete terms: if you bought at $120 in the autumn and sell now at $91, you realise a loss that can be set against gains from other coins. If your purchase is more than a year behind you, however, you can claim neither gains nor losses. Without clean records of purchase dates and rewards, this is hard to prove, so it pays to reconcile your exchange history before the end of the year.
Two Paths to Mid-November
Our view: the fund figures argue against a sell-off by the big investors. The evidence is an outflow of just $1.18 million on a day with a 6.5 percent drop, the comparison with $71.47 million in the last week of October and the fact that fund investors are holding despite a paper loss of at least $134 million. As long as that holds, pressure on the 200-day line is likely to come mainly from the futures market and from Bitcoin, which trades at $75,811 on Friday, down 4 percent.
The ratio of long to short accounts on OKX of 3.64 points the other way. The more traders have bet on a rebound, the sharper a break of the $88.35 level could turn out. Only a weekly close above $94.48 would end the run of falling weeks. The editorial team does not derive a price target from this; the levels above are the test. Cryptocurrencies can be highly volatile, and a total loss is possible.
Solana ETFs: As Long as $89 Holds, the Base Stays Calm
- Choose your route: Decide whether you want to hold Solana as an exchange-traded product in a securities account or as a coin. Our crypto broker comparison shows providers' fees and product ranges.
- Sort out custody: If you buy SOL directly and hold it for more than a year, it is best kept off the exchange. Suitable devices are listed in our hardware wallet comparison.
- Record losses and deadlines: Enter purchase date, purchase price and every staking reward in a tax tool before December 31. Our comparison of crypto tax tools lists suitable programs.
(As of November 6, 2026. This article is not investment advice. Prices and fee structures change; check the terms with the provider before you buy.)
The US labour market grew much faster than expected in October, and that is deepening fears in the crypto market of another rate hike by the Federal Reserve. Ethereum traded at around $2,236 on Friday afternoon, shortly after the data came out, according to CoinGecko. That is roughly €2,006 and 6.4 percent below the previous day's level. The figures brought no rebound.
What is documented: the jobs report, the higher odds of a rate hike in futures markets, Ether's price and the outflows from the US spot ETFs, each with a source further down. Our own assessment follows in a separate, labelled section.
US Jobs Report for October: 165,000 Jobs Instead of the Expected 65,000
The US economy added 165,000 non-farm jobs in October. According to Bloomingbit, the market had expected a gain of only 65,000. The unemployment rate fell to 4.1 percent from 4.2 percent in September, also below the 4.2 percent forecast. Average hourly earnings rose 0.4 percent on the month, against expectations of 0.3 percent. The September figure was revised up from 29,000 to 60,000 new jobs.
The jobs report, known in the trade as Nonfarm Payrolls, is one of the most important economic releases in the world. It usually comes out on the first Friday of the month at 8:30 a.m. New York time and shows how many jobs the US economy has created outside agriculture. For the central bank it is a gauge of how hot the economy is running. A strong labour market with sharply rising wages can push up inflation, because households spend more.
This time the report carried double weight in the crypto market. Bitcoin and Ether had already dropped sharply overnight after chip and technology stocks slumped on Wall Street. Traders had therefore hoped for weak payroll data that would ease the pressure on the Fed. The numbers delivered the opposite.
Fed Rate Hike in December: Futures Price In Around 80 Percent
After the release, the probability of a 0.25 percentage point rate hike in December rose to about 80 percent in futures markets. That is according to TechFlow, citing the financial data service Jin10. Before the report, traders had priced in around 75 percent. "Priced in" here means the probability implied by the prices of futures contracts on the Fed's policy rate.
The background: in September the Fed raised its policy rate by a quarter point to a range of 3.75 to 4.00 percent. At its meeting on October 28 it left rates unchanged. According to the Fed's statement, the vote was 10 to 2, and the two dissenters, Lisa D. Cook and Beth M. Hammack, would have preferred an immediate quarter-point hike. The same statement says the economy is expanding at a solid pace. The next meeting of the Federal Open Market Committee is set for December 8 and 9.
For Ether, that date matters more than any chart level. A rate hike would make dollar funding more expensive and raise the yield on safe government bonds. Risk assets such as cryptocurrencies then have to offer more to attract capital.

How Rates Work on Ether and Bitcoin When Money Gets Expensive
Ether itself pays no interest unless it is staked. When the policy rate rises, the gap widens to an investment that yields just under 4 percent with no price risk. Large investors calculate exactly that spread. Funds that run mixed portfolios of technology stocks and cryptocurrencies often sell both at once when rates rise, because both depend on expectations of future growth.
A second channel is the dollar. Higher US rates make the dollar more attractive to investors. A strong dollar usually weighs on the prices of commodities, gold and cryptocurrencies quoted in dollars. For investors in Germany the exchange rate adds another layer: if you count in euros, the loss on Ether looks somewhat smaller when the dollar is gaining against the euro at the same time.
Bitcoin was also under pressure. According to CoinGecko, BTC traded at around $75,800 in the afternoon, 5.0 percent below the previous day. Over the same period, Ether lost a good percentage point more than Bitcoin.
Ethereum Price at $2,236: Lowest Level Since August
According to CoinGecko data, the 24-hour high was $2,388 and the low $2,209. On Wednesday, after the US election, Ether had still closed above $2,400. Those gains have now been wiped out entirely. Over 30 days Ether is down a good 13 percent, over one year around 33 percent. The price is 55 percent below its all-time high of $4,946, reached on August 24, 2025.
Market capitalisation, the value of all Ether in circulation at the current price, was last around $273 billion. Trading volume over the past 24 hours came to just under $18 billion. In CoinGecko's daily closing prices, Ether last traded lower than now in mid-August.
Since the end of October the price has moved in a narrow band between roughly $2,240 and $2,280, interrupted only by Wednesday's jump. The fall back to the starting point shows how little tailwind the market has at the moment. New buyers stayed for just one day after the election result.
Spot Ether ETFs: $99.97 Million in Outflows on November 5
US spot funds on Ether saw net outflows of $99.97 million on Thursday, according to SoSoValue data reported by TokenPost. Four of the eleven funds recorded outflows. BlackRock's ETHA accounted for the largest share at $75.20 million. On Wednesday, the day after the election, $53.02 million had still flowed in. Since launch, the funds have taken in a net $12.02 billion.
A spot ETF buys real Ether for every new share and holds it in custody. When money flows out, the fund has to sell Ether or return it to dealers. Outflows therefore act directly on supply in the market. If you are in Germany and want exposure to ETH without holding coins yourself, you can use an exchange-traded product listed in Europe instead of the US funds; our overview of crypto ETFs and ETPs in Germany shows which options exist.

200-Day Line at $2,157: The Key Chart Levels for ETH
The 200-day line is the average of the closing prices over the past 200 days. Many traders read it as the border between an intact and a broken long-term trend. For Ether it currently sits at around $2,157, just under $80 or a good 3.5 percent below the price. The 100-day line runs at about $2,360, the 50-day line at around $2,503. Both are above the price. cryptoticker.io compiled this analysis itself on November 6, 2026, based on 365 daily closing prices from CoinGecko.
On the downside, the 200-day line is therefore the first level. Below it lies the August low: on August 11 Ether closed at around $1,871, the lowest daily close of the past 90 days. On the upside, the price first has to reclaim the 100-day line at $2,360. The 30-day high was about $2,573 on October 8.
What the Levels Tell Investors
Chart levels are not laws. They show where many market participants have placed orders, which is why they are often tested. A close below the 200-day line would mainly prompt short-term traders to sell, while holding above it would calm the situation. If you invest for the long term, treat the levels as a guide for staggered purchases rather than as a signal to act.
Leverage and Liquidation: Rate Data Hit Leveraged Longs First
A liquidation is the forced closure of a position funded with borrowed money once the posted collateral is no longer sufficient. Anyone betting on rising prices with ten times leverage, for example, loses the entire stake on a drop of around ten percent. Exchanges close such positions automatically and sell into the market in the process, which pushes the price down further. With strong economic data this often happens within minutes, because futures prices react abruptly.
Ahead of events such as the jobs report or a Fed meeting in particular, leverage raises the risk considerably. If you trade derivatives, check the distance to your liquidation price and reduce rather than increase leverage before December 9. Our perp DEX comparison shows which platforms for perpetual futures, meaning futures contracts with no expiry date, offer which fees and safety mechanisms.
Holding Period and Loss Offsetting: Ether Tax Rules in Germany
For private investors in Germany, crypto falls under the holding period in Section 23 of the Income Tax Act. If you hold Ether for more than a year, you sell tax-free. If you sell earlier, the gain is taxed at your personal rate, provided that all private disposal gains in a year exceed the exemption limit of €1,000. A price slump can therefore also be a tax opportunity: realised losses on purchases from the past twelve months can be offset against gains from other private disposals in the same year.
The order matters. For identical coins, the tax office generally assumes that what was bought first is sold first. If you have bought Ether over several years, check before selling which units have already passed the holding period. A crypto tax tool works this out automatically from your trading history and produces the report for your tax return.
Buying Through a MiCA-Licensed Provider, Custody and Staking in a Falling Market
If you want to use the decline to buy more, choose a provider licensed under the EU's MiCA regulation. MiCA is the single legal framework for crypto services in the EU; licensed providers must keep client funds segregated and are subject to supervision, in Germany by BaFin. Which exchanges meet these requirements and what they charge is set out in our comparison of the best crypto exchanges. A savings plan, a fixed amount at a fixed interval, takes the question of the right entry day out of the decision.
On custody: coins on an exchange are convenient, while coins in your own wallet belong only to whoever holds the keys. For larger amounts held over the long term, a hardware wallet is the tool of choice. Staking, the locking up of Ether to secure the network in return for a reward, can make the wait in a weak market more bearable. The reward fluctuates and does not offset price risk. For tax purposes, the German tax authorities take the view that the one-year holding period also applies to staked Ether; the rewards themselves are taxable as other income when received.
Our View on the Ether Price
Our view: the jobs report takes away the market's hope that the Fed will stand pat in December. In favour of this reading: the probability of a rate hike has risen to about 80 percent according to TechFlow, two committee members already voted for a hike in October, and the Ether ETFs are losing money again. As long as these three points hold, Ether lacks a buyer to carry the price above the 100-day line at $2,360. Against it: much of this is already priced in. The hike was three-quarters expected even before the report, and the 200-day line at $2,157 is only a few percent below the current level. This is expressly not a recommendation to buy or sell. Cryptocurrencies can fall to zero.
Ethereum Ahead of December 9: Without a Rate Turn, the Next Push Is Missing
- Decide how to buy: If you want to buy more, do it in stages and through an exchange with a MiCA licence. Fees and licences are listed in our exchange comparison.
- Check your leverage: Before the Fed meeting on December 8 and 9, widen the distance to your liquidation price. Our perp DEX overview compares platforms and safety mechanisms.
- Recalculate the holding period: Before any sale, establish which Ether are older than one year and which losses can be offset. A tax tool does the calculation for you.
(As of November 6, 2026. This article is not investment advice. Prices and fee structures change; check the terms with the provider before you buy.)
The market capitalization of a cryptocurrency is its price multiplied by the number of coins currently in circulation. The figure tells you how much the market would pay for all circulating units of a coin combined if each were valued at the current price. On Friday morning, November 6, the entire crypto market came to around $2.58 trillion according to data from CoinGecko, the equivalent of about 2.30 trillion euros. Bitcoin alone accounted for a good $1.53 trillion of that.
The figure is the main sorting key of every crypto list, from the ranking on CoinMarketCap to our overview of the largest coins. But the metric has limits that many investors only notice when a token is barely tradable despite a high rank. This guide explains how the figure is calculated, what it reveals about a coin and where it can lead you astray.
What is market cap in crypto?
Market capitalization, market cap for short, is the notional total value of all circulating units of an asset. The term comes from the stock market, where the share price is multiplied by the number of shares issued to give a company's market value. With cryptocurrencies, the circulating supply takes the place of the share count.
The circulating supply is the number of coins or tokens that can be freely traded. Locked tokens held by founding teams, a foundation's reserves or coins not yet mined are not included. This is exactly where the room for interpretation begins, because the data providers decide for themselves which holdings count as freely tradable.
The difference from the price matters. The price tells you what a single unit costs. Market cap tells you how large the whole project is valued in the market. Two coins with the same price can differ in size by a factor of a thousand if one has a thousand times more units in circulation.
Market cap formula: price times circulating supply, using Bitcoin as an example
The calculation is simple and can be checked with any calculator:
Market cap = current price × circulating supply
Take Bitcoin as of November 6: around 20.11 million BTC were in circulation, and the price stood at about $76,140. That gives a market capitalization of a good $1.53 trillion. In euros, at a price of about 68,170 euros per BTC, it comes to around 1.37 trillion euros.
Because the price changes around the clock, market cap also changes every minute. The circulating supply of Bitcoin, by contrast, moves only slowly: new coins are created exclusively through mining, and the maximum supply is fixed at 21 million BTC. With other tokens the circulating supply can jump, for example when locked holdings are released. Market cap then rises even though the price stays the same or even falls.
What the calculation leaves out
Market capitalization is not money sitting somewhere. No account holds $1.53 trillion ready for Bitcoin. The figure values every coin at the price of the last trade, even if only a small fraction of them actually changed hands. If all holders wanted to sell at the same time, the achievable price would be far below the last quoted price.
Total crypto market cap: $2.58 trillion after a 6.5 percent daily drop
Total crypto market capitalization is the sum of the individual values of all tracked coins and tokens. On November 6, CoinGecko listed almost 22,840 active cryptocurrencies and arrived at around $2.58 trillion. Within 24 hours the total value had fallen by about 6.5 percent, part of the sell-off that has gripped the market since the middle of the week.
The total is a useful thermometer for market sentiment. If it rises over weeks, capital is flowing into the sector; if it falls, investors are pulling money out or prices are slipping across the board. The percentage change is more telling than the absolute value, because it makes days and years comparable.
If you want to follow the trend regularly, you will find the totals, the dominance of individual coins and 24-hour volume on data sites and in portfolio apps. Which crypto analytics platforms provide which metrics, and what they cost, is covered in a separate comparison.
Bitcoin dominance at 59 percent: the market share of the largest coin
Bitcoin dominance is Bitcoin's share of total crypto market capitalization. On November 6 it stood at around 59.2 percent according to CoinGecko. More than half the value of all cryptocurrencies is therefore concentrated in a single coin.
Behind it came Ethereum with about 10.6 percent and the stablecoin Tether (USDT) with just under 6.9 percent. BNB accounted for around 3.5 percent and XRP for just under 3.0 percent. The five largest assets thus held over 83 percent of the market between them, while the remaining 22,000-plus coins share the rest.
Dominance is seen as a gauge of whether investors are putting money into Bitcoin or into altcoins. When it rises, investors often rotate into the market leader they regard as safer, typically during weak phases. When it falls significantly over a longer period, traders speak of an altcoin season. As a signal, though, the metric is blurry, because growing stablecoin holdings push dominance down mathematically without a single altcoin having risen.

Price per coin is misleading: Zcash costs over a thousand times more than XRP and is worth less
The most common mistake in the crypto market is focusing on the unit price. A coin costing a few cents looks cheap and seems to have plenty of room to rise, while a coin costing several thousand dollars looks expensive. Market capitalization shows why that impression is deceptive.
A comparison from November 6: Zcash cost around $1,292 per coin, XRP around $1.20. One Zcash was thus more than a thousand times as expensive as one XRP. By market capitalization the ratio was reversed: XRP came to about $76 billion, Zcash to around $22 billion. The reason is the circulating supply. A little over 17 million Zcash coins are in circulation, compared with more than 63 billion XRP.
When asking whether a coin can still rise, market capitalization is therefore the right measure. A token priced at $0.0001 that is supposed to rise tenfold would have to increase its total value tenfold. If it has a quadrillion units in circulation, it would need a valuation higher than Bitcoin's to do so. The calculation takes seconds and protects you from promises that already fail on the arithmetic.
Rank 12 among all assets: Bitcoin between Meta and Broadcom
Market capitalization makes crypto comparable with other asset classes. The website CompaniesMarketCap lists companies, precious metals and cryptocurrencies in a single ranking. On November 6, gold sat at the top with around $28.4 trillion, followed by Apple with about $5.0 trillion and Nvidia with around $4.4 trillion.
Bitcoin ranked 12th with about $1.53 trillion, just behind Meta Platforms and ahead of Broadcom and Tesla. Gold was thus valued at a good 18 times the size of Bitcoin, Apple at a good three times.
Such comparisons have a catch you should be aware of. For gold, data providers estimate the total amount ever mined, so the circulating supply is an assumption. Behind a company's market value lies a business with revenue and profit; behind Bitcoin there is none. The numbers show the order of magnitude, but they say nothing about which value is appropriate.
A reference figure, not a price target
How far Bitcoin is from gold is easy to calculate: with around 20.11 million coins in circulation, a market cap of $28.4 trillion would correspond to a price of about $1.41 million per BTC. That is pure arithmetic as of November 6 and not a forecast. The value of gold changes too, and no one can say whether Bitcoin will ever reach that size.
Large cap, mid cap, small cap: size categories in the crypto market
In the crypto market, coins are commonly sorted into categories by market capitalization. A widely used rule of thumb, though not a binding standard, distinguishes three groups:
- Large caps with a market capitalization above $10 billion. On November 6 these included a good dozen assets, among them Bitcoin, Ethereum, XRP, Solana and several stablecoins.
- Mid caps between roughly $1 billion and $10 billion, often established layer-1 blockchains, DeFi protocols or utility tokens with their own use case.
- Small caps below $1 billion. This is where the vast majority of the more than 22,000 tracked coins sit, including many young projects and meme tokens.
The smaller the market cap, the more the price usually swings. A buy order of just a few hundred thousand dollars can move a small cap by double-digit percentages, while the same sum goes unnoticed in Bitcoin. This works in both directions: the chance of large gains comes with high risk, up to and including a total loss.

Market cap vs FDV: 36 billion XRP sit outside circulation
Alongside market capitalization, most data sites show a second metric, the fully diluted valuation, or FDV. FDV applies the current price to a coin's maximum supply, meaning every unit that can ever exist. It shows how large a project would be valued if all tokens were already in circulation.
With XRP the gap is marked. Of a maximum of 100 billion XRP, around 63.5 billion were in circulation on November 6, so a good 36 billion were not. Market cap stood at about $76 billion, FDV at around $120 billion. With Bitcoin, by contrast, over 95 percent of the maximum supply has already been mined, and market cap and FDV are close together.
The larger the gap, the more supply can come onto the market in future. Whether that weighs on the price depends on the schedule and on demand. How to look up circulating supply, total supply and FDV yourself before buying a newly listed token is shown in our August guide on FDV and circulating supply.
Stablecoins in the ranking: USDT and USDC grow with issuance, not with price
Stablecoins regularly feature among the ten largest cryptocurrencies. On November 6, Tether (USDT) had a market capitalization of around $178 billion, USD Coin (USDC) about $70 billion. For them, the metric works differently than for ordinary coins.
A stablecoin is a token whose price is pegged to a currency such as the US dollar. Because the price almost always sits at one dollar, market cap essentially equals the number of tokens issued. The value grows when the issuer creates new units against deposits and shrinks when tokens are redeemed. A rising stablecoin market cap is therefore not a price gain but a sign of fresh capital standing ready in the crypto market.
Limits of the metric: trading volume and a thin free float
A high market capitalization does not mean a coin is easy to buy or sell. Trading volume is the better metric for that, meaning the value of all trades over a period, usually 24 hours. For Bitcoin, 24-hour volume on November 6 was around $45 billion, just under three percent of its market cap.
For some tokens the ratio is considerably worse. An analysis by cryptoticker.io from October 11, 2026 found that four of the 25 largest cryptocurrencies traded less than 0.32 percent of their market capitalization per day. What lies behind such cases is set out in the article on market cap and trading volume of the top 25.
A second problem is a small free float. If only a fraction of the tokens is freely tradable, a few purchases are enough to lift the price, and with it the market cap, sharply. The valuation of all units then follows a price based on very little volume. A high rank in the list can arise this way without much money having flowed into the token.
CoinGecko and CoinMarketCap: why rankings differ
If you compare a coin's market capitalization on two data sites, you will often find different values. There are several reasons for this. The providers source their prices from different exchanges and weight them differently. Above all, though, they set the circulating supply themselves: whether locked tokens, a foundation's holdings or burned coins are counted is decided by each site according to its own rules.
In practice, a single value is a snapshot with some blur, not an official figure. For large coins the differences are usually within a few percent; for small tokens they can be considerable. When buying, check what a stated circulating supply is based on and, if in doubt, consult a second source.
Market cap when buying: a MiCA-licensed exchange and the holding period in Germany
Market capitalization helps you assess a coin, but it does not make the buying decision for you. For investors in Germany, two further points matter when buying. Since the EU's MiCA crypto regulation took effect, providers that broker crypto assets in the EU need a license as a crypto-asset service provider. Which platforms hold such a license is shown in our crypto exchange comparison.
For tax purposes, cryptocurrencies held as private assets are subject to the holding period under Section 23 of the German Income Tax Act. If you sell a coin after more than one year, the gain is tax-free. Within that period, gains remain tax-free as long as all private disposal gains in a year stay below the exemption limit of 1,000 euros. This applies to Bitcoin just as it does to a small cap; the size of a coin plays no role.
Market cap: $2.58 trillion is a price tag, not a pile of money
The metric shows you in seconds how large a coin is relative to the market and guards against the fallacy of cheap unit prices. Three steps help you use it sensibly:
- Gauge the size: Before every purchase, look up market cap, FDV and 24-hour volume, ideally in a tool that shows all three values. You will find a selection in the analytics platform comparison.
- Choose a trading venue: Buy on a MiCA-licensed platform and check whether the coin trades there with sufficient volume. The providers are listed in the crypto exchange comparison.
- Regularly rather than all at once: If you want to invest in the large assets without trying to time the market, you can buy with fixed monthly amounts. Providers and fees are shown in the Bitcoin savings plan comparison.
(As of November 6, 2026. This article is not investment advice. Prices and fee structures change; check the terms with the provider before you buy.)
On November 15, 127 million Starknet tokens (STRK) unlock, as they have on the 15th of every month since April 2025. What is new is the weight of this tranche. At the current price of $0.0402 the tokens are worth around $5.1 million, while daily trading volume stands at $35.8 million according to Coinpaprika (as of Friday morning, November 6). The unlock therefore equals a little over 14 percent of one trading day. Ahead of the October tranche the figure was around 2 percent.
Starknet has had an eventful week. Binance reopened STRK withdrawals after the attack of October 29, and the Starkzap developer kit has supported the STRK20 privacy features and Shadow Accounts since November 4. The price showed none of it: STRK lost 10 percent in seven days. This article puts the unlock into numbers, describes the week's developments and shows what you should keep in mind as a holder in Germany when buying, staking and paying tax.
Starknet unlock on November 15: 127 million STRK for investors and early contributors
A token unlock is the point at which previously locked tokens become freely available to their recipients. At Starknet the monthly release covers two groups: early contributors, meaning team members and developers from the first years, and investors from StarkWare's funding rounds. According to the tracker Tokenomist, the next unlock is scheduled for November 15, 2026 and goes to exactly these two groups.
The amount follows the revised vesting schedule that Decrypt reported on in February 2024. Under the plan as amended back then, 64 million STRK unlocked every month in the first year from April 15, 2024, followed by 127 million a month for 24 months. 127 million is 1.27 percent of the total supply of 10 billion STRK. Measured against the circulating supply of 7.66 billion tokens, which Tokenomist and Coinpaprika both report, the November tranche expands the freely tradable supply by around 1.7 percent.
Who receives the tokens
In Starknet's allocation, early contributors hold 20.04 percent of the total supply according to Tokenomist, investors 18.17 percent. Together that is a little over 38 percent, the largest single position, ahead of the developer grant pools with 12.93 percent. The published schedule does not say how the 127 million are split between the two groups. Whether and when the recipients sell cannot be known in advance: an unlock makes tokens tradable, it does not sell them.
STRK price this week: $0.0402 and down 10 percent in seven days
STRK is trading at $0.0402 on Friday morning. According to Coinpaprika, the token lost 8.6 percent in 24 hours, 10.0 percent in seven days and 17.4 percent in 30 days. Its market capitalization is $308 million. Valuing all 10 billion tokens at today's price, Tokenomist arrives at a fully diluted valuation of $401.8 million. The gap of a little over $90 million sits in tokens that are not yet unlocked.
Based on Coinpaprika's daily closing prices, the weekly high was $0.0440 on October 31, and the weekly low is today's level. The decline of the past 24 hours coincided with the broad sell-off across the crypto market, in which Bitcoin fell 5.9 percent and Ether 7.7 percent according to Coinpaprika. The sources reviewed do not cite any STRK-specific news as the trigger.
Unlock versus daily volume: 2 percent in October becomes more than 14 percent
The number of tokens stays the same every month; their weight in the market changes with price and volume. On October 9, cryptoticker.io assessed the October tranche in a first calculation on the Starknet unlock. At the time, STRK stood at $0.0721 after a 68 percent rally, the tranche was worth $9.15 million and daily volume was around $470 million. The unlock thus made up roughly 2 percent of one trading day.
Today the tranche is worth only a little more than half as much, but daily volume is more than 90 percent below its level of October 9. At $5.1 million against $35.8 million, the same amount weighs seven times as much as in October. The unlock-to-daily-volume ratio shows how much of a trading day the market would need to absorb the entire tranche if it were sold in full. At 2 percent, a tranche barely registers in normal market noise. At 14 percent, even a partial sale can be enough to show up in the order book, especially on venues with thin liquidity.
The calculation, step by step
- 127,000,000 STRK times $0.0402 equals $5.11 million.
- $5.11 million divided by $35.8 million in daily volume equals 14.3 percent.
- 127 million divided by 7.66 billion circulating tokens equals 1.66 percent.
The volume figure comes from a data provider that aggregates many exchanges. On your own trading venue it can be considerably lower. For a larger order it is worth checking the market depth directly in your exchange's app.

From the October high of $0.113 to this week's low: the price path since the last tranche
According to Coinpaprika's daily closing prices, the October rally carried STRK to $0.1128 by October 11. Since then the token has lost 64 percent. On the day of the October unlock, October 15, STRK closed at $0.0816, and a week later at $0.0548, a drop of 33 percent. The price data alone cannot show how much of that was due to the unlock and how much to the pullback after a very steep rally. All that is certain is that the October tranche arrived in a falling market and the price has not recovered since.
The comparison highlights a point that often gets lost in the debate about unlocks: what matters is less the amount than the state of the market it meets. In October, a small tranche faced strong demand. In November, the same amount faces one seventh of the volume.
Binance reopens STRK withdrawals after the October 29 attack
After the attack on Binance on October 29, in which crypto assets worth $6.3 billion were stolen according to a report by crypto.news, the exchange suspended withdrawals for many tokens. On November 3, Binance listed STRK among the assets that can once again be withdrawn via the Ethereum network. According to the exchange, around 95 percent of the affected holdings had been replenished by November 1. Withdrawals were restored step by step, each after a security review per token and network.
For holders keeping STRK on Binance, the route to their own wallet is open again. If, after last week's experience, you would rather hold your tokens yourself, the hardware wallet comparison offers an overview; whether a device supports Starknet is listed in the manufacturer's network list. A hardware wallet is a small device that stores the private keys offline and signs transactions only after confirmation on the device.
Starkzap update: STRK20 privacy and Shadow Accounts for wallet developers
Starkzap is Starknet's developer kit that apps and wallets use to integrate the network's functions. Since November 4 it has supported two privacy building blocks, according to a report by bsc.news that was picked up by cryptonews.net. STRK20 is StarkWare's privacy framework, which lets balances be shielded and transferred privately. Shadow Accounts are separate addresses per app that are funded from a shielded STRK20 balance and cannot be linked to the main wallet on the blockchain.
The feature has clear limits. According to the documentation, the STRK20 module in the developer kit is a preview release. Deposits into the privacy pool require approval from StarkWare, and every deposit is screened against sanctions lists by the analytics provider Elliptic. Balances and transactions of a Shadow Account remain visible on the blockchain, as Crypto Briefing described at the launch on October 13. Only the link to the main address is hidden.
For investors, the update mainly shows the direction of the project: Starknet combines privacy with built-in screening against sanctions lists. How many apps will actually integrate the feature remains open so far; Starknet has not published any figures on it.

Remaining schedule to March 2027: four more STRK tranches after November 15
Under the revised schedule, the phase of 127 million STRK a month runs until March 15, 2027. After the November tranche, four dates remain: December 15, January 15, February 15 and March 15. Including November, that brings another 635 million STRK to the market, a little over 8 percent of today's circulating supply. At the current price that would be around $25.5 million.
According to Tokenomist, Starknet's full vesting schedule runs into 2027. Besides the monthly tranches for contributors and investors, further allocations sit with StarkWare, the Starknet Foundation and grant pools. If you plan to hold STRK for longer, you should know the monthly dates: every 15th until March is a day with additional supply. Starknet is a layer-2 network on Ethereum, and its price is currently moving closely with the market: over the past 24 hours STRK fell 8.6 percent, Ether 7.7 percent.
STRK levels up and down: $0.044 and $0.040
On the upside, the weekly high of October 31 at $0.0440 is the next level the price would have to reclaim. Above that lies the daily close of October 24 at $0.0480, from which the downtrend of the second half of October had slowed. On the downside, the round mark of $0.0400 is the first line, and the price is already sitting right on it. These levels are observation points drawn from past price data, neither price targets nor a recommendation.
Buying, staking and taxing STRK in Germany: MiCA, holding period and a seven-day wait
Buying through a MiCA-licensed provider
Since the end of the transition period, crypto providers serving customers in Germany need a license under the EU's MiCA regulation. MiCA stands for Markets in Crypto-Assets and governs licensing, custody and disclosure duties for crypto service providers in the EU. You can check whether your provider is licensed in the public register of the European Securities and Markets Authority, ESMA. Which platforms offer STRK and what they charge is shown in our crypto exchange comparison. With smaller tokens in particular, it pays to look at the spread, the gap between the buying and selling price, because it widens when volume is low.
Staking STRK
Starknet allows staking: according to the Starknet documentation, validators deposit at least 20,000 STRK, and smaller holders can delegate their tokens to a validator. Rewards are paid out in newly created STRK. One point matters for planning around an unlock: if you end your staking, you wait seven days before the tokens are available again and earn no rewards during that time. Anyone who wants to sell at short notice cannot reach their tokens in that week. Providers that handle staking for you can be found in the staking platform comparison.
Holding period and tax
In Germany, gains from selling STRK are tax-free under Section 23 of the Income Tax Act if more than one year passes between purchase and sale. Within that period, an exemption limit of 1,000 euros applies to all private disposals in a year. Under the Federal Finance Ministry's circular of March 6, 2025, staking rewards count as other income at the moment they are received, with a separate exemption limit of 256 euros. The holding period of the staked tokens is not extended as a result. If you want to keep clean records of purchases at different prices, staking income and sales, one of the crypto tax tools is the best choice.
Leverage and liquidation
If you trade STRK with leverage, dates such as an unlock expose you to additional risk. A liquidation is the forced closure of a leveraged position when the posted collateral no longer covers the loss. With daily volume of $35.8 million, even mid-sized sales can trigger short, sharp swings that wipe out leveraged positions before the price steadies again.
Starknet unlock: at 14 percent of daily volume, liquidity is what counts
The November 15 unlock brings the same amount as every month, but it meets a market with a fraction of October's volume. Three steps help you assess the situation for your own portfolio:
- Before buying or selling, check the spread and market depth on your trading venue. The exchange comparison gives an overview of fees and offerings.
- If you stake, factor in the seven-day wait if you want to stay flexible around November 15 or one of the four following dates. You can compare terms on the staking platforms.
- Record the purchase date and price of every position so you can prove the one-year holding period. The tax tools help with that.
(As of November 6, 2026. This article is not investment advice. Prices and fee structures change; check the terms with the provider before you buy.)
Decrypt
The attackers have used more than 20,000 wallets on 16 blockchains so far, but the bulk of the stolen ETH and Bitcoin hasn't moved.
The Tesla CEO said the Texas plant will make room for the Cybercab, as sales of the stainless-steel pickup run far below capacity.
Thursday marked a massive reversal and historic selloff for AI stocks, and crypto was not immune. What held up the strongest?
Patrick Yaroch drained wallets using credentials the FBI had collected, then asked ChatGPT for advice on starting a new life in Europe.
The Network Sustainability Mechanism will reissue removed ZEC from 2031 within the 21 million cap, as the community debates its dev fund.
U.Today - IT, AI and Fintech Daily News for You Today
The XRP Ledger leadership in the tokenized commodities market remains undisputed, even though it is guaranteed by just a single $2.2 billion energy deal.
Binance issues new update on the much-anticipated re-opening of Hyperliquid withdrawals on its exchange amid trolls and backlash from holders.
Ripple gains high profile attention at major Dubai event as regional expansion plans gather momentum.
China's central bank halts Solana's Shanghai event shortly after it began and will investigate those involved.
A bug in Reth's legacy trie code could cause incorrect state-root calculations.
Blockonomi
TLDR
- Analyst CW reported stablecoins shifting toward net exchange inflows on November 6.
- The analyst described market conditions as neutral, without a confirmed directional trend.
- DefiLlama placed total stablecoin capitalization near $291.6 billion on November 6.
- Stablecoin capitalization declined 1.95% over seven days and 4.55% over 30 days.
- CryptoQuant defines stablecoin exchange netflows as deposits minus withdrawals.
Stablecoin transfers into cryptocurrency exchanges are shifting toward net inflows, according to on-chain analyst CW. The November 6 observation suggests trading balances may be rebuilding after recent withdrawals. However, broader supply figures still point to contracting liquidity, complicating any recovery signal.
In a November 6 post, CW described stablecoins moving back toward net inflows. The analyst also characterized conditions as neutral, without a confirmed market direction. The supplied statement gave no aggregate inflow amount or measurement window.
Stablecoin Deposits Contrast With Shrinking Supply
DefiLlama’s November 6 dashboard placed total stablecoin capitalization near $291.6 billion. The reading showed a 1.95% decline over seven days and 4.55% over 30 days. That contrasts with the improving exchange-flow signal described by CW.
The difference matters because exchange transfers and token supply track separate activities. Stablecoins can move from private wallets or decentralized platforms into exchanges without new issuance. Such movements can increase trading balances while total circulating supply keeps falling.
Tether’s USDT accounted for roughly $177.5 billion, while USDC stood near $70.7 billion. Both showed declines over the preceding 30 days on DefiLlama’s dashboard. These figures measure circulating token values, not purchases of Bitcoin or other cryptocurrencies.
CryptoQuant labels its public exchange-flow dataset as ERC-20 stablecoins. DefiLlama aggregates stablecoins across multiple networks. Different coverage definitions further limit direct comparisons. An exchange deposit can relocate existing tokens without creating new supply.
Exchange Activity Offers Incomplete Market Signal
CryptoQuant’s methodology defines stablecoin netflow as exchange deposits minus withdrawals. Positive values mean transfers into tracked exchange wallets exceed transfers leaving those wallets.
Spot-market deposits can provide funds for purchases. However, stablecoins sent to derivatives exchanges can also support leverage and short positions. Consequently, positive net flows alone cannot establish that traders have begun accumulating cryptocurrencies. The available statement does not identify which exchanges received the reported deposits.
Recent exchange-reserve research reinforces that distinction. In an October 21 analysis, CryptoQuant contributor Darkfost reported Binance held $41.6 billion in ERC-20 stablecoins. The analyst said Binance balances had fallen $6.3 billion since April. That older snapshot established a weaker liquidity backdrop, not the current reserve total.
The post Stablecoin Inflow Reversal Fails to Confirm Crypto Recovery appeared first on Blockonomi.
A new long-term outlook on Bitcoin (BTC), published this week, calls a climb to $150,000 by 2030 realistic. The same analysis treats a $1 million price as unlikely.
The call comes as Bitcoin trades well below its record high and has slipped for a month, while spot ETF demand cools. For any Bitcoin price prediction, two nearby levels now matter more than distant targets.
Traders who watch those levels also keep an eye on early-stage projects. One of them is MEMASA ($MEMASA), an upcoming AI crypto trading app that lets users research and trade crypto through a chat. Its token sells at $0.0155 in an ongoing on-chain sale.
Bitcoin Price Prediction: Analyst Sees $150,000 as a Realistic 2030 Target
The outlook comes from Sam Daodu, who weighed four scenarios for Bitcoin, from a modest gain to a $1 million price. He sees a range up to $250,000 as realistic and the most extreme targets as unlikely, according to 24/7 Wall St.
His case rests on scarcity, since almost all of Bitcoin’s fixed supply is already in circulation. Halving cycles add to that thesis, with the next one expected in 2028.
Still, near-term demand looks softer, as spot Bitcoin ETFs have logged a string of uneven days with notable outflows. That leaves the long-term story depending on whether big buyers return before the next leg of the cycle.
Support at $73,500 Faces a Likely Retest
Bitcoin now trades near $75,600, down about 12% over the past month. The nearest strong support sits near $73,500, while resistance stands much higher, around $84,400.
Technical indicators lean firmly bearish, so a retest of support looks more likely than a quick rebound. For any near-term Bitcoin price prediction, a break below $73,500 could open a path toward $69,500.
A move back above $84,400 would change the picture and bring the $90,000 area back into view. While Bitcoin tests these levels, some traders look at new tools and tokens built around the market itself.
MEMASA ($MEMASA): AI Trading App Preparing for Market Debut
MEMASA is an upcoming AI crypto trading app that lets users analyze markets, check token risks, and trade on-chain by chatting with an AI assistant.
The app tackles problems familiar to crypto traders: too many charts, scattered market data, scam tokens, and complicated interfaces. MEMASA plans to combine market intelligence, risk checks, automated strategies, and trading in one self-custodial app.
If the crypto market enters another bullish phase, growing interest in altcoins could bring more people into trading. MEMASA aims to serve that audience by making market research and trading as simple as a conversation. Its potential appeal extends from beginners struggling with trading interfaces to experienced traders who want faster access to market insights.
Can $MEMASA Benefit From the Next Crypto Rally?
$MEMASA is the utility token powering the MEMASA ecosystem. Its planned uses include premium AI intelligence, trading fee discounts, marketplace payments, and staking for analysts and AI agents.
The token’s potential derives from stronger sentiment across the crypto market and growing demand within the MEMASA ecosystem. If the app attracts a wide audience, it might drive the demand for $MEMASA.
MEMASA is currently offering early access to $MEMASA through an on-chain early sale, with prices below the project’s anticipated public listing price. Earlier stages offer lower prices, while later stages provide faster token unlocks.
Gain Early Access to MEMASA
A Bitcoin rally could create favorable conditions for MEMASA’s debut. The bigger test will be whether the app delivers on its promise to simplify crypto trading and attracts enough users to build lasting demand for its token.
The Road Ahead for BTC and MEMASA
Bitcoin’s next move likely hinges on whether buyers defend support near $73,500. A recovery above $84,400 would put the longer-term bullish case back on firmer ground.
The 2030 targets remain distant, and ETF demand will shape how quickly the market can build toward them.
MEMASA faces a different test, as it needs to turn an AI trading concept into an app people use every day. Both Bitcoin’s path and MEMASA’s outcome remain uncertain, and higher potential comes with higher risk.
The post Bitcoin Price Prediction: 2 Key Levels Could Decide the Next Move Before Any $150,000 Run by 2030 appeared first on Blockonomi.
TLDR
- Daan Crypto Trades identified a retest of the daily 200-day moving average.
- The analyst also highlighted the 61.8% Fibonacci retracement as a potential support level.
- A long-standing horizontal resistance zone remains important for any sustained recovery.
- Bitcoin dominance stood near 59.8% on CoinMarketCap’s November 6 dashboard.
- The Altcoin Season Index remained around 45, below its confirmation threshold of 75.
Altcoin capitalization is testing support after weeks of fading rallies, according to trader Daan Crypto Trades. In his November 6 analysis, he identified the daily 200-day moving average and 61.8% Fibonacci retracement. The test follows a decline from September’s local high. Daan said successive rebounds have struggled to hold. That leaves a long-standing horizontal zone as the next obstacle.
Reclaiming Resistance Matters More Than Touching Support
The 200-day moving average tracks the average index value across 200 daily sessions. The 61.8% Fibonacci retracement marks a potential reaction level within a previous market move. Daily averages are lagging indicators, while Fibonacci levels depend on the swing highs and lows chosen.
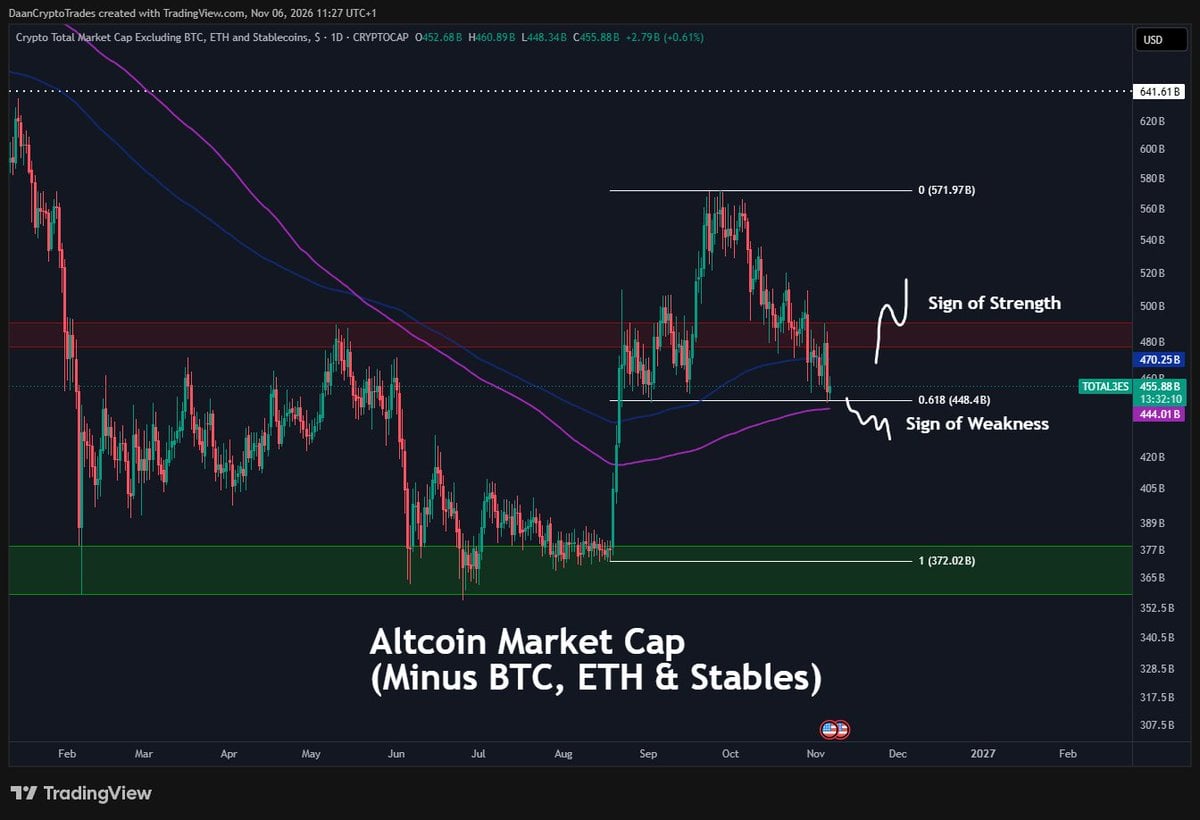
Their reported overlap makes the area technically notable. However, neither indicator independently confirms renewed buying or a trend reversal. Daan identified a nearby red zone that has alternated between support and resistance over several years. Reclaiming that zone would strengthen the bullish case, he argued.
Conversely, continued declines without a meaningful response would suggest that sellers retain control. Both outcomes remain conditional, with no guaranteed direction or timing. A recovery above the zone would also require follow-through. One brief move through resistance could reverse without establishing a sustained trend.
Broader Market Data Show Limited Altcoin Leadership
CoinMarketCap’s market dashboard showed Bitcoin dominance near 59.8% on November 6. Its Altcoin Season Index stood around 45 out of 100, below the confirmation threshold of 75. The index compares eligible cryptocurrencies against Bitcoin over the preceding 90 days. Its methodology excludes stablecoins and wrapped tokens, whose returns differ from those of volatile cryptocurrencies. The reading suggests that broad altcoin outperformance has not emerged. That distinction matters because rising capitalization alone would not establish an altcoin season.
Market values can rise without most individual tokens outperforming Bitcoin. Rising valuations also do not necessarily indicate equivalent new investment inflows. TradingView uses different measures for the altcoin market. TOTAL2 excludes Bitcoin, while TOTAL3 removes both Bitcoin and Ethereum. Separate versions exclude stablecoins.
Consequently, any numerical support target depends on the exact index selected. The analyst’s chart symbol and retracement anchors require confirmation before publishing precise capitalization levels.
TradingView warns that changes in index membership can produce jumps in aggregate capitalization. Those methodological effects differ from market-wide buying. Earlier, Blockonomi reported stronger altcoin trading activity in August. Yet that activity did not confirm a full altcoin season. Daily closes above Daan’s marked zone, accompanied by improving breadth, would support a stronger recovery interpretation.
The post Altcoin Market Cap Tests Support Amid Weak Breadth appeared first on Blockonomi.
TLDR
- Moderna stock jumps 7.38% to $259.25 following strong third-quarter results.
- Quarterly revenue climbs 29% to $1.3 billion as overseas vaccine sales rise.
- Moderna swings to a $162 million quarterly profit, with EPS reaching $0.38.
- Moderna lifts its 2026 revenue growth forecast to 15%-25% after strong sales.
- Phase 3 melanoma data show a 42% drop in recurrence or death risk with therapy.
Moderna (MRNA) shares jumped 7.38% to $259.25 after the company reported higher sales and positive cancer results. The stock gained $17.79 and recovered from an intraday low near $241.46. Higher annual revenue guidance added further support for the stock’s rally.
Moderna, Inc., MRNA
Moderna Reports Higher Revenue and Returns to Profit
Moderna generated $1.3 billion in third-quarter revenue, up 29% from $1.0 billion a year earlier. International vaccine demand and government agreements supported growth. U.S. sales totaled $780 million, while international markets contributed another $533 million.
The company posted $162 million in net income after recording a $200 million loss last year. Diluted earnings reached $0.38 per share, compared with a $0.51 loss per share previously. Meanwhile, research spending declined 27% to $583 million as Moderna reduced late-stage clinical development costs.
Cost of sales increased 54% to $318 million alongside higher vaccine volumes and manufacturing expenses. Selling, general, and administrative costs rose 5% to $282 million this quarter. Sales growth and lower research costs offset higher production expenses across operations.
Moderna Raises Revenue and Cash Forecasts for 2026
Moderna now expects annual revenue growth between 15% and 25%, above its previous forecast of 10% maximum. U.S. and international markets should contribute roughly equal revenue shares. The forecast follows expanded deliveries and commercial partnerships in several international markets.
Management reduced its full-year research spending forecast from $2.9 billion to approximately $2.7 billion. The company maintained its $1.0 billion administrative expense projection and expects capital spending near $200 million. It also expects approximately $1.7 billion in cost of sales, including litigation settlement costs.
Moderna raised its year-end cash forecast to $8.1 billion through $8.3 billion. Previously, the company projected a range of $4.7 billion to $5.2 billion. September financing provided approximately $2.6 billion in net proceeds and strengthened its cash position.
Cancer Trial Results Expand Moderna’s Pipeline Progress
Moderna and Merck reported positive Phase 3 melanoma results for intismeran autogene combined with Keytruda. The combination reduced recurrence or death risk by 42% compared with Keytruda alone. It also lowered the risk of distant metastasis or death by 38% in the study.
The companies plan regulatory submissions and preparations for a possible launch after securing approval. Separately, U.S. regulators approved Moderna’s mFLUSIVA influenza vaccine for adults aged 50 through 64. Regulators also granted accelerated approval for adults aged 65 and older.
Moderna expects pivotal results from its propionic acidemia program before the end of 2026. Meanwhile, its norovirus vaccine missed the interim threshold for early success in Phase 3 testing. These updates show clinical progress alongside development setbacks across its portfolio.
The post Moderna (MRNA) Stock: Rally 7.38% as $1.3B Revenue and Positive Cancer Trial Results Boost Optimism appeared first on Blockonomi.
TLDR
- Gnosis Pay detected unauthorized access to its legacy consumer card system on November 3, 2026.
- The security incident exposed customer information, although the company reported no loss of customer funds.
- Gnosis Pay introduced mandatory 3D Secure verification for all online card payments.
- The company confirmed that its enterprise white-label card platform remained unaffected by the breach.
- Gnosis Pay notified affected customers and began communicating with relevant data protection authorities.
Gnosis Pay has mandated 3D Secure checks for online card payments following a customer data breach. The company detected unauthorized access to its legacy consumer card system on November 3, 2026. It disclosed the incident on November 6, confirming that some customer information was exposed. The added checks will remain until December 20, when Gnosis Pay plans to retire that system. The company said customer funds and its separate enterprise card platform were unaffected.
Extra Verification Remains Until December Shutdown
Gnosis Pay said its security team began containment within two hours of detection. The company replaced affected credentials and addressed the underlying vulnerability. It also increased monitoring of cards and wallets for fraud and attempted access to customer funds. Mandatory 3D Secure adds an identity-verification step to online card purchases.
The safeguards apply during the remaining life of the legacy consumer operation. Gnosis Pay had already announced plans to discontinue consumer interfaces and shift users toward partner applications. The company said its enterprise platform, which powers white-label card programs, was unaffected. That distinction limits the confirmed exposure to the older consumer system, not every Gnosis Pay integration.
Company Notifies Customers and Privacy Authorities
Gnosis Pay said it emailed each affected customer on November 6. Those messages detailed the information accessed from individual accounts. The public statement did not specify the number of affected users or all exposed data categories. It also did not identify the intruder or explain how unauthorized access was obtained.
The company notified partners and began communicating with relevant data protection authorities and its card issuer. It is reviewing the incident and arranging specialist monitoring for possible misuse of exposed information. Gnosis Pay warned customers against unexpected messages containing personal details or genuine card purchases. It said legitimate support would never request seed phrases, private keys, PINs, or complete card numbers.
Data Obligations Continue After Consumer Card Retirement
The December shutdown does not mean Gnosis Pay will immediately erase all customer records. Its published data guidance says identity and transaction records remain for five years after account closure. Support correspondence is retained for six years. Customers can export card transaction histories through the consumer web app until December 20. After that, they must request records directly from the company.
Gnosis Pay says blockchain explorers cannot show merchant names or card-level transaction details. Customers therefore cannot replace a card-history export with on-chain records. The disclosure concerns customer information, not the separate June smart-contract exploit affecting Gnosis Pay wallets. Gnosis previously confirmed that it restored funds lost in that incident.
The post Gnosis Pay Requires 3D Secure After Data Breach appeared first on Blockonomi.
CryptoPotato
All eyes in the past week were on the US midterms that took place on Tuesday, and financial markets have yet to settle following the major volatility experienced after their conclusion.
But first, let’s review how we got there. Binance was hit with the largest hack in USD terms last Friday morning when reports emerged that the exchange suffered losses of around $6.3 billion. Bitcoin and (almost) all altcoins reacted with immediate leg downs, with the leading crypto asset plunging to $76,000. However, it recovered a few grand over the weekend, perhaps because of Binance’s promises to cover all user losses.
The cryptocurrency used the previous weekend to regain some traction, and even challenged the $79,000 resistance on Monday. However, it was quickly rejected there before the actual storm arrived on Tuesday. The asset stood at $78,000 before the election results started to pop up, but once it became known that the Democrats would win in every part that matters, BTC, alongside Wall Street futures, tanked.
Bitcoin plunged to $75,600 for the first time in seven weeks. However, once the election uncertainty disappeared, BTC and Wall Street headed north on Wednesday afternoon, with the leading cryptocurrency rocketing to $81,000 within an hour or so. Although it was stopped there, it still managed to remain above $80,000 for the next 18 hours or so.
Then came the massive Thursday crash. Once again, BTC was not an isolated case as it moved in tandem with Wall Street. Nevertheless, the leg down was extremely painful to $75,000. It was exacerbated today when the US jobs report was published, and it smashed expectations, with BTC dumping to $74,800 for the first time since the breakout rally in mid-August began.
Although it has rebounded by nearly a grand since then, BTC is still 3% down weekly. Even more painful declines are evident from XRP, TRX, NEAR, HYPE, XLM, and BCH. ZEC has managed to defy the trend.
Market Data

Market Cap: $2.640T | 24H Vol: $106B | BTC Dominance: 57.2%
BTC: $75,550 (-3%) | ETH: $2,210 (-0.4%) | XRP: $1.19 (-5.9%)
This Week’s Crypto Headlines You Can’t Miss
Are Users Returning? Binance Gains $3.4B in Tracked Assets After Hack. On-chain data pointed to a few days after the hack unraveled that Binance’s tracked assets had increased by over $3.4 billion, hinting that the exchange might be seeing users rush back. Meanwhile, North Korea refuted the allegations that it was behind the massive incident.
Strategy Resumes Bitcoin Accumulation by Adding 810 BTC. The world’s largest corporate holder of bitcoin made its most substantial purchase in weeks, acquiring 811 BTC, while also repurchasing $208 million worth of STRC. Strive also bought more BTC, but its acquisition was significantly lower than the previous week’s.
CLARITY Act Could Face 2-Year Delay After Republican Midterm Losses: Analyst. The consequences for crypto from the Democratic sweep are yet to unfold, but some analysts believe the highly anticipated CLARITY Act could be delayed at least a couple of years.
Report: Democrats Considering New Crypto Market Structure Bill. In contrast, reports emerged later on that House Democrats are working on drafting a broader crypto market structure bill to enhance SEC oversight and consumer protections following the elections.
Mercado Bitcoin Assures Users Won’t Lose Funds Following $38M Security Breach. Binance was not the only exchange to fall victim to a major hack. Brazil’s Mercado Bitcoin suffered a $38 million exploit but, like Binance, promised to make users whole.
OKX-ICE Tokenization Plan Faces Objections From Dozens of Companies. Over 60 publicly traded companies, including major players such as Apple and Boeing, have objected to the plans from OKX and ICE to tokenize their shares. Their concerns range from potential impact on share prices and liquidity issues to shareholder rights amid ongoing regulatory evaluation.
Charts
This week, we have a chart analysis of Ethereum, Ripple, Cardano, Binance Coin, and Hyperliquid – click here for the complete price analysis.
The post Bitcoin Sinks to 11-Week Low After Democratic Sweep and Wall Street Crash: Weekly Crypto Recap appeared first on CryptoPotato.
The cryptocurrency market has been bleeding heavily again, and ETH was not spared in the renewed correction.
The largest altcoin plunged 7% over the past 24 hours, yet many analysts remain optimistic that nothing is lost and a major rebound could be coming. Meanwhile, one whale’s actions support the bullish theory.
Time to Rally Again?
Earlier today (November 6), ETH dropped to nearly $2,200 before rising to the current $2,240 (per CoinGecko). Instead of panicking, though, one big investor appears to have seen the decline as a perfect buying opportunity.
Lookonchain revealed that the whale opened a $45.3 million long position on the asset with 25x leverage. What’s particularly interesting is that the mysterious person or entity has made 10 trades so far, and they have all been successful.
Playing with millions and winning each time has naturally fueled speculation that the whale might have inside information about potential upcoming events that can positively impact ETH. Of course, that is not guaranteed, but it could encourage smaller players to jump on the bandwagon with fresh capital and aid an eventual recovery for the cryptocurrency.
Some of the analysts commenting on ETH lately include Michael van de Poppe and ZAYRO ₿. The former expects the asset to outperform BTC in “the coming period.” However, he noted that the latest correction has made that scenario more challenging.
“This range is the big range for ETH. If this breaks above 0.03, we’ll see a strong move and a surge across the board in altcoins. Big weeks are upon us,” he added.
X user ZAYRO ₿ argued that ETH’s monthly chart is “absolutely ridiculous,” saying the past two expansion phases were followed by astronomical price increases.
“Now Ethereum has spent nearly 1,800 days building its next massive base. The longest consolidation of the three structures shown. The next expansion is the one I’m positioning for. A move into five-figure territory is written all over this chart. Ethereum’s parabolic chapter is far from over,” they concluded.
A Pivotal Moment
According to Daan Crypto Trades, ETH currently sits right on the big .618 Fibonacci retracement level and the Daily 200MA. The analyst focused on the $2,350 zone, suggesting that a move above can serve as “a proper sign of strength that the bullish momentum is back.” On the other hand, a drop below could trigger a deeper correction.
If you are curious to explore additional price forecasts, please take a look at our detailed article here.
The post Never Wrong So Far: This Trader Bets Big on Ethereum (ETH) appeared first on CryptoPotato.
Bitcoin is on the move again after the release of the US jobs report for October, which was well above what experts anticipated. The reading, published minutes ago, noted that the US economy added 165,000 jobs in October, while expectations were around 59,000, according to CNBC.
The unemployment rate fell to 4.1%, which is below expectations of 4.2%. Moreover, data for September’s report was also revised higher by 31,000 jobs.
A stronger-than-expected reading is typically bearish for risk-on assets because it shows that the US Federal Reserve can maintain tighter monetary policy without breaking the economy.
As such, it’s no real surprise that BTC’s immediate price reaction was a major leg down, dumping from $76,000 to $75,200 before erasing almost all losses. The asset plunged hard yesterday after the post-election rally, going from $81,000 to a multi-month low of $75,100 before recovering slightly to $76,000.
The asset’s price reaction to the jobs reports has been quite intense in the past several months. It tanked after the August reading, but jumped hard after the September report went live.
Before the report was released earlier today, Nicole Bachaud, a labor economist at the job site ZipRecruiter, said that the US wouldn’t need to add many jobs to the economy in the long term, as there are simply fewer people available to work, before adding:
“An aging workforce is pushing a lot of people into retirement. We have had decades of low birth rates, meaning we don’t have a lot of people who are coming in to replace those retiring workers. And immigration is now down pretty significantly, which is reducing some of that prime-age employment.”
The post Bitcoin Price Goes Wild Again as US Jobs Report Smashes Expectations appeared first on CryptoPotato.
It’s been a wild week for Bitcoin (so far), with the price hovering between $75,000 and $81,000, driven by financial market dynamics and the US midterm elections.
Ripple’s XRP has also been affected, eventually dropping to its lowest level since August, while Hyperliquid (HYPE) plunged below $80 and faces a deeper correction.
BTC’s Rollercoaster
At the start of the business week, the primary cryptocurrency traded near $78,000, but the midterm elections in the United States on November 4 brought immense turbulence.
As it became clear that the Democrats would likely secure a decisive victory and regain control of the Senate and the House of Representatives, BTC headed south to roughly $76,000. Shortly after, their win became clear, and the reduced uncertainty fueled a substantial resurgence, with the asset rising as high as $81K.
However, that peak was short-lived as a broad sell-off across global financial markets over the past 24 hours weighed heavily on the cryptocurrency. Buyers stepped in to recover some losses, and as of this writing, BTC is trading around $76,000 (per CoinGecko).
The brief rally fueled growing optimism across the crypto community. Among the bulls was X user Ted, who predicted a potential move toward $87,000 should BTC regain the $82,000 zone. Similarly, Michael van de Poppe maintained that buyers would stay in control as long as the asset remains above the key support level of $79,000.
At the same time, several warning signs were already emerging, potentially foreshadowing the decline that followed. Those included the transfer of thousands of coins from Trump Media Group to Crypto.com and from MARA Holdings to certain platforms such as Galaxy Digital and Copper. Historically, developments like this precede sell-offs, which can negatively impact price. Meanwhile, The Kobeissi Letter reported that Trump’s administration and the US military are finishing preparations for “a possible resumption of major combat operations in Iran.”
XRP’s Fall
Ripple’s native token also experienced enhanced volatility, briefly rising above $1.30 on November 5 when the entire market flashed green. Nonetheless, it followed BTC and many other cryptocurrencies that headed south today (November 6) amid Wall Street weakness.
In fact, XRP plunged by 9% over the past 24 hours and dipped below $1.20. One potential reason why it performed worse than its rivals is the lack of institutional demand.
Spot XRP ETFs have struggled to attract fresh capital, with daily net inflows standing at $0 for two consecutive days. The companies that have launched such investment vehicles include Bitwise, Franklin Templeton, Canary Capital, 21Shares, and Grayscale. Since their debut, the products have accumulated $1.81 billion in net inflows.
HYPE in Danger?
Hyperliquid’s native token is among the worst performers on a weekly scale, with its valuation tumbling by 15% to around $78. Earlier this week, several analysts warned that the asset could plunge even more in the near future.
Ali Martinez, for example, pointed to a potential head-and-shoulders top on the 12-hour chart and suggested that a sustained close below the $76-$78 neckline could be followed by a crash toward $59. FOUR | Crypto Spaces shared a similar view, predicting a collapse to $60 if bulls fail to defend the $77 zone.
Perhaps a major factor (besides the broader market decline) for the asset’s plunge is the recent whale activity. Santiment noted that the token pumped above $95 following Stan Druckenmiller’s endorsement, but within a day, four whales closed their HYPE longs entirely, banking around $5 million.
The post Major Bitcoin (BTC) Volatility, Ripple (XRP) Price Collapse, and More: Bits Recap Nov 6 appeared first on CryptoPotato.
Today, we examine Ethereum, Ripple, Cardano, Binance Coin, and Hyperliquid in greater detail.
Ethereum (ETH)
In the past 48 hours, the crypto market has been extremely volatile as the mid-term elections in the US concluded. Ethereum quickly rallied by 10% only to erase those gains in full a day later, thus reconfirming $2,400 as resistance. This also made the weekly price flat.
Sellers have total control over the price, considering that the past five weekly candles are red with clear lower lows. In this context, it’s unlikely ETH can do much but seek support closer to $2,000.
Looking ahead, the correction for the leading altcoin is far from over. The first key level that may have a shot at reversing this is found at $2,000. If that support won’t hold, then bears will push towards $1,800 next.

Ripple (XRP)
XRP had a bad week and closed 6% lower as sellers continue to dominate and push the asset to new lows. At the time of this post, the cross-border token is found around $1.2, but may soon find itself moving closer to the key support at $1.1 and $1.
Due to the recent volatility, XRP’s downtrend appears to be accelerating with no sign of relief. This is why sellers may be determined to test $1 before they run out of steam.
Looking ahead, the token is likely to explore lower levels before finding support. If $1.1 won’t hold, then buyers have a good shot at defending the price around $1 since this level held well back in August.

Cardano (ADA)
ADA is in the same boat as Ethereum and is about to close its fifth weekly candle in red. It also fell by 5% this week. This correction has now erased more than half of the gains made during the previous rally in August and September.
Hopefully, buyers will start to show up around current levels, with good support expected at $0.18 and $0.16. If sellers somehow manage to break below both these levels, then Cardano will be forced to re-test the support at $0.15 that was last visited in June.
Looking ahead, buyers have to show up on the order book, as the alternative is a quick drop back to the starting point from July. Such a scenario would be a bearish signal that ADA cannot sustain current prices and may be forced lower still.

Binance Coin (BNB)
Binance Coin dropped to the key support at $690 and is currently being contested at this level. Considering the market context, sellers may have the upper hand. If successful, then BNB will likely fall to $580 next.
The asset also closed the week 4% lower after it faced pressure from sellers. As previously noted, Binance experienced the biggest crypto hack in history and has recently reopened withdrawals, which saw roughly $5 billion leave the exchange.
Looking ahead, expect a bumpy road for BNB as it seeks support and a new equilibrium. This will likely depend on how Binance manages the impact of the recent hack and its fallout.

Hype (HYPE)
HYPE has seen similar volatility where the recent rally towards its all-time high at $97 was completely erased a week later. That forced it to close the week 17% lower, which makes it the worst performer on our list.
This change of momentum is extremely bearish and raises questions about whether the price has topped, at least in the immediate future. Even more concerning, price action since the start of 2025 has formed a huge bearish wedge that is about to resolve.
Looking ahead, if Hyperliquid fails to sustain its current price and falls below the wedge in blue on the chart, then the top was likely in at $97, and it will take months before it can be challenged again, likely sometime in 2027.

The post Crypto Price Analysis Nov-6: ETH, XRP, ADA, BNB, and HYPE appeared first on CryptoPotato.


